Embed Size (px)
Citation preview

Retrospective Theses and Dissertations Iowa State University Capstones, Theses andDissertations
1997
Measurement and analysis of lawn mowerperformance and noiseMatthew D. MooreIowa State University
Follow this and additional works at: https://lib.dr.iastate.edu/rtd
Part of the Engineering Mechanics Commons
This Thesis is brought to you for free and open access by the Iowa State University Capstones, Theses and Dissertations at Iowa State University DigitalRepository. It has been accepted for inclusion in Retrospective Theses and Dissertations by an authorized administrator of Iowa State University DigitalRepository. For more information, please contact [email protected].
Recommended CitationMoore, Matthew D., "Measurement and analysis of lawn mower performance and noise" (1997). Retrospective Theses and Dissertations.17368.https://lib.dr.iastate.edu/rtd/17368

Measurement and analysis of lawn mower performance and noise
by /
Matthew D. Moore
A thesis submitted to the graduate faculty
in partial fulfillment of the requirements for the degree of
MASTER OF SCIENCE
Major: Engineering Mechanics
Major Professor: Dr. J. Adin Mann III
Iowa State University
Ames, Iowa
1997

ii
Graduate College Iowa State University
This is to certify that the Master's thesis of
Matthew D. Moore
has met the thesis requirements oflowa State University
Signatures have been redacted for privacy

iii
''It is notoriously difficult to quantify mower performance in a repeatable fashion. For design
purposes, quantification is very important. Mower design is for the most part an incremental
process. Relatively few breakthroughs occur. Therefore, to make continuous improvement,
the designer must be sensitive to small changes in performance and know whether they are
the result of design features, grass condition, or simply random variation. Numerical
measures are helpful in making these determinations"
-John Vance

iv
TABLE OF CONTENTS
LIST OF TABLES
LIST OF FIGURES
CHAPTER 1. INTRODUCTION 1. 1 Reasons for conducting this research 1.2 Lawn mower deck and blades used in this research 1.3 Literature review 1. 4 Goals and constraints 1. 5 Outline of this thesis
CHAPTER 2. THEORETICAL BACKGROUND
Vl
Vll
1 1 2 6 7 8
9 2.1 Mechanisms of rotating blade noise generation 9
2.1.1 Terminology 10 2.1.2 Noise radiated by a single rotating blade in free space (unbound) 10 2.1.3 Blade rotating in bound space 13 2.1. 4 Mechanisms of noise from a two spindle lawn mower 15
2.2 Performance 17 2.2.1 Mechanisms of flow and lift generation 17 2.2.2 Other factors affecting lift generation 26 2.2.3 Mechanisms of grass cutting 31
2.3 Conclusions based on the literature 32
CHAPTER 3. EXPERIMENTAL METHODS 34 34 35 35 37 39 42 43 45 46 51
3.1
3.2
Laboratory tests 3 .1.1 Sound power experimental setup 3 .1.2 Dynamic pressure distribution measurement 3 .1. 3 Dynamic pressure distribution apparatus 3 .1. 4 Dynamic pressure measurement instrumentation 3 .1. 5 Data Presentation Field tests 3 .2.1 Sound power 3 .2.2 Performance 3.2.3 Static tests
CHAPTER 4. MEASURED DATA 53 4.1 Effect oflawn mower deck 53
4 .1.1 Effect of blade-deck interactions on the pressure distribution 54 4.1.2 Effect ofblade-deck interactions on sound power radiation 58 4 .1. 3 Effect of neighboring blade interaction in the overlap region on 61
the pressure distribution

v
4.1.4 Effect of neighboring blade interaction in the overlap region on 65
4.2
4.3
the radiated sound power
Effect of manufacturing variability on the sound power radiation
Correlation with Laboratory and Field Tests 4.3.1 Sound power 4.3.2 Performance 4.3.3 Static tests
CHAPTER 5. SUMMARY 5. 1 Conclusions of research 5.2 Recommendations for further work
REFERENCES
APPENDIX
69
71 72 74 79
81 81 82
84
85

vi
LIST OF TABLES
Table 3.1 Typical scanivalve operating parameters 41
Table 4.1 Comparison of octave band levels for a high wing blade spinning alone 67 on the left, and alone on the right. Levels expressed as differences from two blades spinning together, oriented at zero degrees. Negative numbers represent reductions
Table 4.2 Comparison of sound levels of two high wing blades operating at 68 Orientations of zero and 45 degrees. Negative numbers represent reductions
Table 4.3 Effect of manufacturing variability on the sound power radiated by two 71 high wing lawn mower blades in comparison to control group. Negative numbers represent reductions
Table 4.4 Comparison of ANSI sound power measurement procedures 73

vii
LIST OF FIGURES
Figure 1.1 Top view of John Deere deck 3
Figure 1.2 Bottom view of John Deere deck 4
Figure 1.3 Typical lawn mower blade 5
Figure 2.1 Photograph showing heavily eroded blade in comparison with new one 12
Figure 2.2 Depiction of thickness and thrust 12
Figure 2.3 Bottom view of John Deere deck. The shaded area shows regions of 14 small blade tip-deck clearance
Figure 2.4 Airflow leaving deck in region other than grass discharge 16
Figure 2.5 Simple representation of a discharge lawn mower 19
Figure 2.6 Coordinate system of a rotating blade 21
Figure 2.7 Partial vacuum behind the lawn mower blade wing 22
Figure 2.8 Velocity field blowing grass down 23
Figure 2.9 Depiction of a vertical flow created by the collision of opposing flows 25
Figure 2.10 Lift being created by opposing flows under the John Deere deck 26
Figure 2.11 Helicopter rolling due to uneven rotor lift generation 27
Figure 2.12 Changing pitch of helicopter rotor to change lift 28
Figure 2.13 Depiction of orientation where interaction from tangential flow 30 loading will increase upstream pressure
Figure 3.1 Sketch showing the sound power measurement hemisphere and test rig 36
Figure 3.2 Schematic of stainless steel taps embedded in ground surface 38
Figure 3.3 Photograph of dynamic pressure experimental set up with John Deere 38 deck
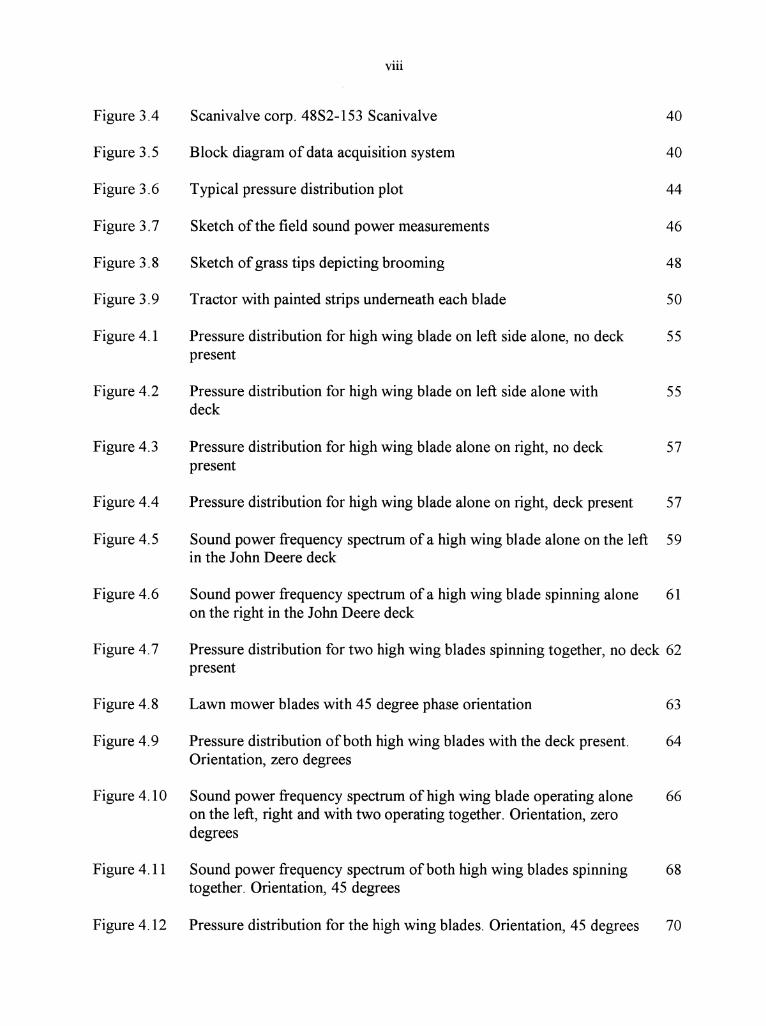
Figure 3.4
Figure 3.5
Figure 3.6
Figure 3.7
Figure 3.8
Figure 3.9
Figure 4.1
Figure 4.2
Figure 4.3
Figure 4.4
Figure 4.5
Figure 4.6
Figure 4.7
viii
Scanivalve corp. 48S2-153 Scanivalve 40
Block diagram of data acquisition system 40
Typical pressure distribution plot 44
Sketch of the field sound power measurements 46
Sketch of grass tips depicting brooming 48
Tractor with painted strips underneath each blade 50
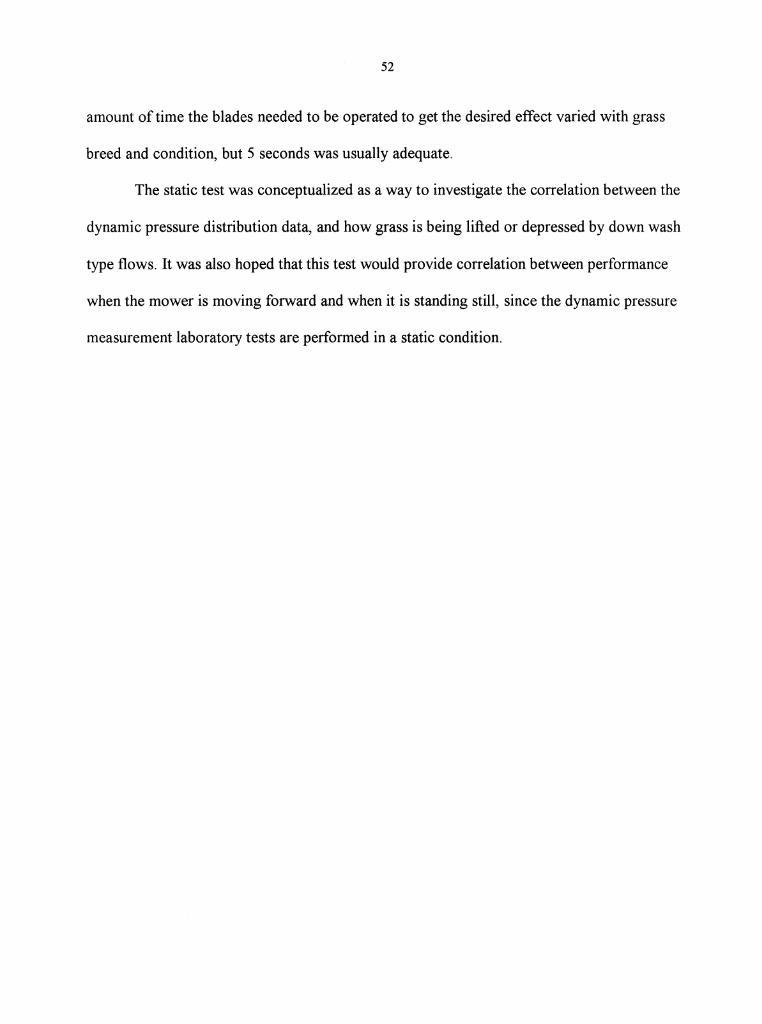
Pressure distribution for high wing blade on left side alone, no deck 55 present
Pressure distribution for high wing blade on left side alone with 55 deck
Pressure distribution for high wing blade alone on right, no deck 57 present
Pressure distribution for high wing blade alone on right, deck present 57
Sound power frequency spectrum of a high wing blade alone on the left 59 in the John Deere deck
Sound power frequency spectrum of a high wing blade spinning alone 61 on the right in the John Deere deck
Pressure distribution for two high wing blades spinning together, no deck 62 present
Figure 4.8 Lawn mower blades with 45 degree phase orientation 63
Figure 4.9 Pressure distribution ofboth high wing blades with the deck present. 64 Orientation, zero degrees
Figure 4.10 Sound power frequency spectrum of high wing blade operating alone 66 on the left, right and with two operating together. Orientation, zero degrees
Figure 4.11 Sound power frequency spectrum ofboth high wing blades spinning 68 together. Orientation, 45 degrees
Figure 4.12 Pressure distribution for the high wing blades. Orientation, 45 degrees 70

ix
Figure 4.13 John Deere LX-173 mower used in this research
Figure 4.14 Drawing of typical grass cutting results
75
76

X
ACKNOWLEDGMENTS
I would like to thank my parents for their loving support throughout the years. I wish
to express my sincere gratitude to my advisor, Dr. J. Adin Mann III for encouraging me to
pursue graduate work under him, and for his guidance and patience throughout my program
of study. I would also like to thank Dr. Ralph Smith, Dr. Ganesh Rajagopalan, and Dr. Jerry
Vogel for serving on my graduate committee. I am especially grateful for the insight
provided by Dr. Vogel and Dr. Ambar Mitra that led to the patent application that has been
filed on this research project.
I would like to thank my colleagues, Jodi Swanson, Thanet Kanlagna, and Katie
Gales for their assistance with the construction of the pressure distribution platform, data
measurement, and especially for their hard work preparing the jury tests. I would also like to
thank the Program for Women in Science and Engineering summer interns, Delney Bystrom,
Kelly Strickler, and Pei Li Li for serving as jurors during the grass cutting experiments
during their stay at Iowa State University. Additionally, I would like to express appreciation
to Tom Elliot for his assistance with fabrication of experiment components, Marcelo Dapino
for his help with photography, and to Ted Wiegandt, Donald Tauro, and Patty Driesch for
their intangible contributions in making this project a rewarding and enjoyable experience.
Finally, I would like to thank Lund International for funding this research project, and
John Hassinen of Lund International for providing much needed background information on
the lawn mowing industry.

1
CHAPTER 1. INTRODUCTION
1.1 Reasons for conducting this research
Reducing the noise radiated by internal combustion engine and electric powered
rotary lawn mowers is becoming a topic of great concern among many members of the
Outdoor Power Equipment Industry (OPEl). This concern has been fueled by a
comprehensive legislative directive designed to limit the noise levels of outdoor power
equipment sold to member states of the European Union (EU) has recently been issued. This
directive will have a dramatic effect on the existing trade markets ofboth European and U.S.
manufacturers and pose entry barriers for new markets because these limitations are believed
to be beyond the present technical capabilities that OPEl members are willing to develop for
production lawn mowers.
Another growing concern among manufacturers of rotary lawn mowers is
performance. Performance from the customer standpoint is qualitative, and is primarily a
subjective visual evaluation of the aesthetic appearance of the lawn [1,5]. This is essentially
the evenness and cleanliness of the cut grass and how visible the clippings are. Designing
lawn mowers with favorable performance is essential to maintain a competitive advantage
with other manufacturers.
Like lawn mower noise, there is much to be learned about performance. Differences
between actual and desired performance are large [1,5]. Problems such as poorly cut grass
plague designers to this day. Tremendous amounts of resources are invested by

2
manufacturers to remedy this problem, and are usually met with minimal success because
lawn mower design is an iterative process, some of which are the result of data that is not
sufficiently accurate. Mowers are typically tested, and then modified in someway and tested
again. This becomes a cumbersome task at best because this method requires significant
amounts of time, resources, and cooperation of the weather. This is complicated by the fact
that there appears to be no well defined methods available to quantify performance.
How a lawn mower performs and creates noise are all related to how the lawn mower
blades move air under the deck. It is therefore necessary to obtain a better understanding of
this in order to make significant improvements. Developing a test procedure that
characterizes how air is flowing is the key motivation for this research.
1.2 Lawn mower deck and blades used in this research
The lawn mower deck (Figure 1.1) used in this research was the John Deere 3 8 inch
two spindle production deck used in the research performed by Tauro [2]. An actual deck
was used in this research because noise and performance are strongly related to how the lawn
mower blades interact with the deck [1,2]. The front of the deck will be called the leading
edge, also referred to as the skirt, which comes in contact with uncut grass first. The right
side of the deck is the side that the grass discharge is on. The deck is mounted on the mower
such that the centerline of the blade spindles is staggered about 15 degrees from an axis
perpendicular to the direction of travel. The exact purpose of this staggered design is not
known, but is likely related to the desire to guarantee cut coverage in the overlap region,
which is where the neighboring blade tips meet.
3
leading edge (skirt) direction of travel
··················~
... ..... ····~
trailing edge
grass chscharge /
Figure 1.1 Top view of John Deere deck
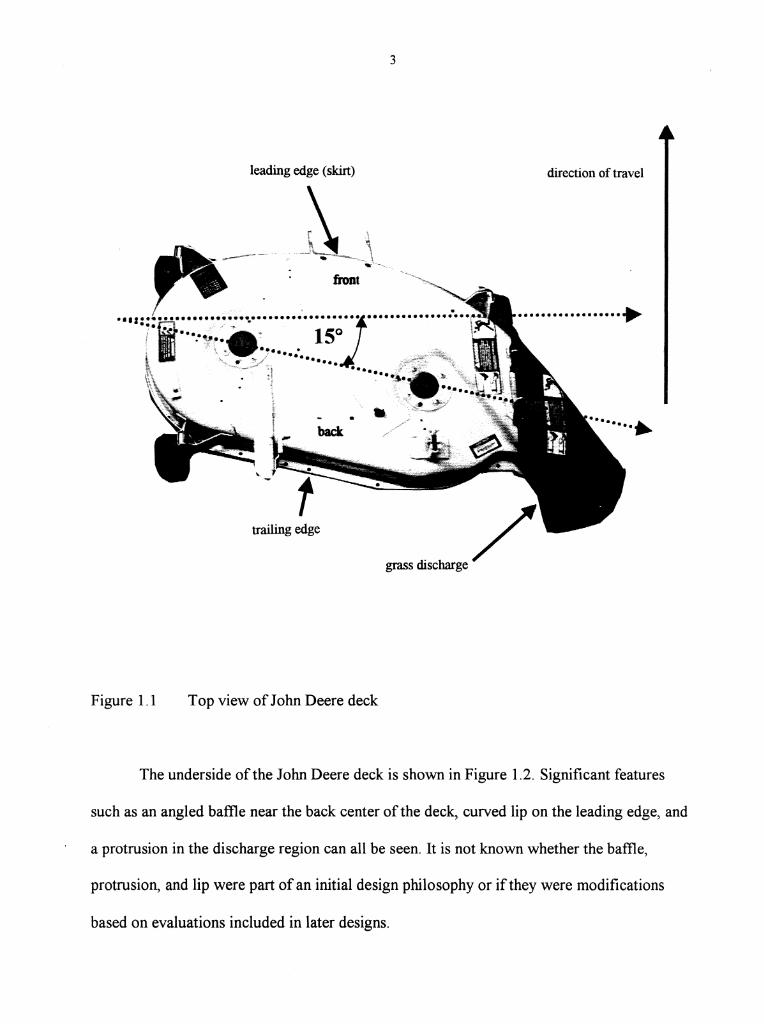
The underside of the John Deere deck is shown in Figure 1.2. Significant features
such as an angled baffie near the back center of the deck, curved lip on the leading edge, and
a protrusion in the discharge region can all be seen. It is not known whether the baffie,
protrusion, and lip were part of an initial design philosophy or if they were modifications
based on evaluations included in later designs.
4
overlap reg1on leading edge lip
channel
direction of travel
angle baffie
Figure 1.2 Bottom view of the John Deere deck
The purpose of the leading edge lip is to contain airflow that would otherwise blow
out of the right front comer of the deck [4]. This lip is a standard add-on to the deck that is
recommended to be left in place at all times. Similar lips can be purchased for the left side
and rear of the John Deere deck. A channel that is formed into the ceiling of the deck is also
visible. It is thought that this channel is intended to guide the clippings toward the discharge.
5
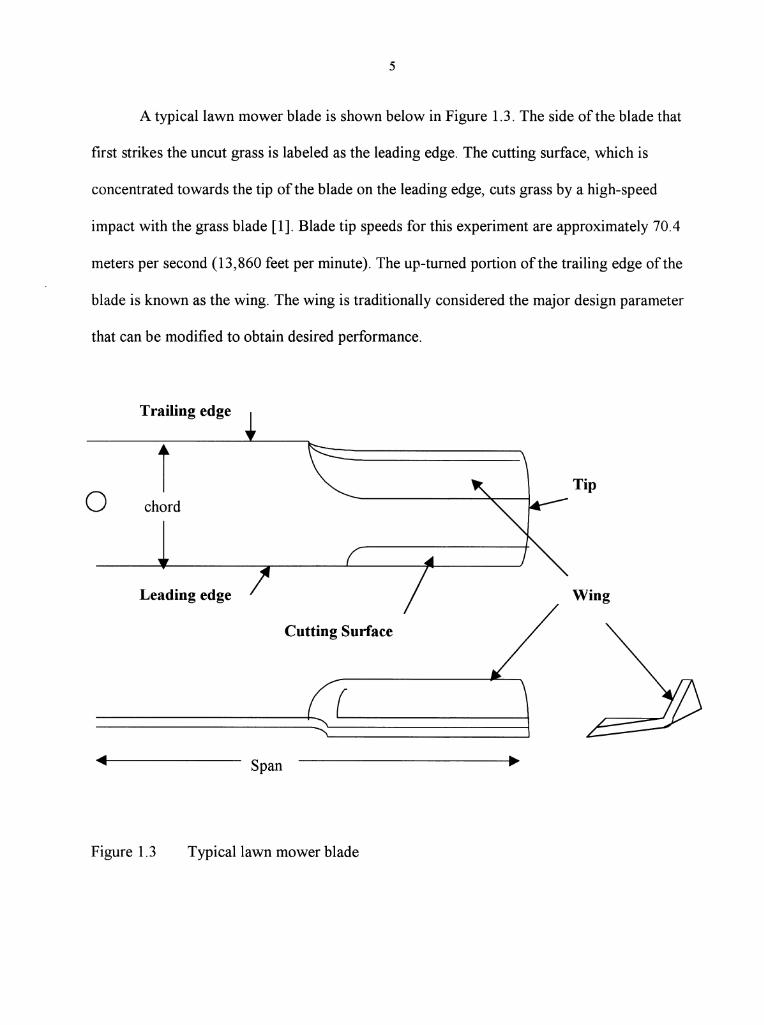
A typical lawn mower blade is shown below in Figure 1.3. The side of the blade that
first strikes the uncut grass is labeled as the leading edge. The cutting surface, which is
concentrated towards the tip of the blade on the leading edge, cuts grass by a high-speed
impact with the grass blade [1]. Blade tip speeds for this experiment are approximately 70.4
meters per second (13,860 feet per minute). The up-turned portion of the trailing edge of the
blade is known as the wing. The wing is traditionally considered the major design parameter
that can be modified to obtain desired performance.
Trailing edge
i 0 Tip
chord
Leading edge Wing
Cutting Surface
Span
Figure 1.3 Typical lawn mower blade

6
1.3 Literature review
Recent work by Tauro [2] was done to develop facilities and procedures to measure
the noise radiated by commercially available lawn mower blades. Tauro [2] specifically
discussed several important conclusions about single blade lawn mowers. Upon reviewing
several references Tauro concluded that noise generation mechanisms of a rotating lawn
mower blade are similar to other types of rotating blades such as aircraft propellers and fan
blades. Based on this conclusion, Tauro tested three common noise reduction theories;
reducing the rotational speed, reducing the length, and reducing the width of the lawn mower
blade and found that while effective, they are not realistic solutions for lawn mowers. Tauro
also concluded that the interaction between the deck and blades is a significant portion of the
noise radiated by a lawn mower, and that only limited noise reductions can be expected with
modifications to the blades alone.
Research conducted on aircraft propellers in 1995 by Metzger [3] at NASA's
Langley Research Center confirmed previously tested theories of the benefits of reducing the
speed and length of rotating blades. Metzger also showed that reducing the blade tip
thickness and reducing the loading at the tip reduced noise. Metzger's work also revealed
that noise levels can be reduced by altering the tip geometry and by sweeping the blade tips
back with respect to the direction of rotation.
Work done by Vance [1] in 1995 at the University ofWisconsin-Madison focused
primarily on performance. Vance made numerous important conclusions, the most important
being that the lawn mower blades and deck need to be designed together for optimum
performance. This important idea is supported by Tauro.

7
In general, much more information on noise reduction was available than on
performance. Hassinen [5] provided some basic ideas of lawn mower blade design and their
origin stating that in general, many blade designs are specified by the customer. There was
also little clear information available on design methodologies of lawn mower decks, or work
relating to optimizing noise and performance. Work done by Miller [6] at Purdue University
did focus on a computer program to be used in aircraft propeller design that optimized
performance and noise reduction. The noise reduction tools used by Miller are the same as
those explored by Metzger [3] and may not be viable for commercial lawn mowers. More
specific excerpts of the literature review are included in chapter 2 along with a summary of
conclusions.
1.4 Goals and constraints
The primary goal of this research was to design and develop a scientific test
procedure that tells us more about how the lawn mower blade and deck design effect
performance and noise radiation. This information could then be used to correlate lawn
mower performance to noise radiation so that a lawn mower deck and blades could be
designed which have favorable performance and low noise levels.
The test procedure was designed to be compatible with the same blade drive unit and
accompanying acoustic enclosure used in the research conducted by Tauro [2]. This was
necessary to allow for convenient changes from the new performance test procedure to the
established sound power measurements.

8
The lawn mower deck and blades also present a challenge for developing a
measurement system because space between the blades and the ground is limited, and
because ofthe inherent danger associated with the high tip speeds ofthe blades. It would be
difficult and hazardous to place instrumentation between the blades and the ground. This
constraint greatly limited the measurement probes that could be used
1.5 Outline of this thesis
Chapter 2 will describe the theoretical background of the sound power radiation and
performance measurements with a brief review of the mechanisms of noise generation and a
more detailed discussion of performance. Based on these theories, the methodology of the
measurement apparatus will be developed.
Chapter 3 describes the test apparatus design including changes made to the lawn
mower blade drive assembly, and discusses the procedure and instrumentation used to
acquire the data. An explanation of how the sound power was measured is mentioned as well.
Chapter 4 will present the data that was taken. Visual representation of some of the
key data will also be provided. Theories described in the literature and developed in earlier
chapters will be verified.
Chapter 5 will summarize the conclusions of this research project and discuss some
possible ideas for future work.
9
CHAPTER 2. THEORETICAL BACKGROUND
The lack of published information on lawn mowers indicates that more must be
learned about how performance and noise-generation are related. For example, characteristics
of a lawn mower blade that are known to reduce noise levels may also have an impact on
performance. In order to learn more about any relationships that exist, the mechanisms of
noise generation and performance need to be understood.
2.1 Mechanisms of rotating blade noise generation
Extensive work has been done in the past to identify the types and causes of noise
generated by a single rotating blade in free space. When multiple blades are placed in close
proximity to one another near solid boundaries, similar to the conditions under a lawn mower
deck, the mechanisms of sound generation are more complex and not as easily identifiable
due to the multiple interactions. The first subsection will discuss terminology used in this
chapter. The second will discuss basic mechanisms of rotating blade noise in unbound free
space, the third will discuss the contributions of boundaries and interactions, and the last will
compare these with noise relative to the John Deere mower used in this research.
10
2.1.1 Terminology
Upstream: That portion of space ahead, or about to be encountered by the leading
edge of the lawn mower blade
Downstream: That portion of space behind, or trailing the lawn mower blade.
Left blade: The lawn mower blade on the left side of the deck when viewed from
the top (Figure 1.1 ).
Right Blade: The Lawn mower blade on the right hand side of the deck when
Overlap:
viewed from the top (Figure 1.1). This is also the blade on the grass
discharge side of the deck.
The region in the middle of the deck where the blades pass each other
(Figure 1.2).
2.1.2 Noise radiated by a single rotating blade in free space (unbound)
Tauro [2] and Metzger [3] both state that for any blade rotating in free-space the
predominant noise components are discrete tone noise and broad band noise. Tauro states
that discrete tone noise is comprised of the fundamental frequency, which is related to the
blade passage frequency, and its associated harmonics. He states that the blade passage
frequency is caused by the pressure field that rotates with the blade and by the formation of
blade tip vortices. He adds that the vortices that are shed from the tip are much stronger than
those shed elsewhere, and are a major if not the main cause ofthe blade passage frequency
11
tone. Evidence of the strength of these vortices on the high wing blade used in this research
can be seen in Figure 2.1. In this figure, a heavily worn lawn mower blade (top) that came
with the deck is shown in a photograph with an unused blade (bottom). The groove that is
seen in the top blade, is the result of matter entrained in the vortices eroding the metal much
like sand blasting as they travel the length of the blade. A brand new blade is shown below it
for comparison.
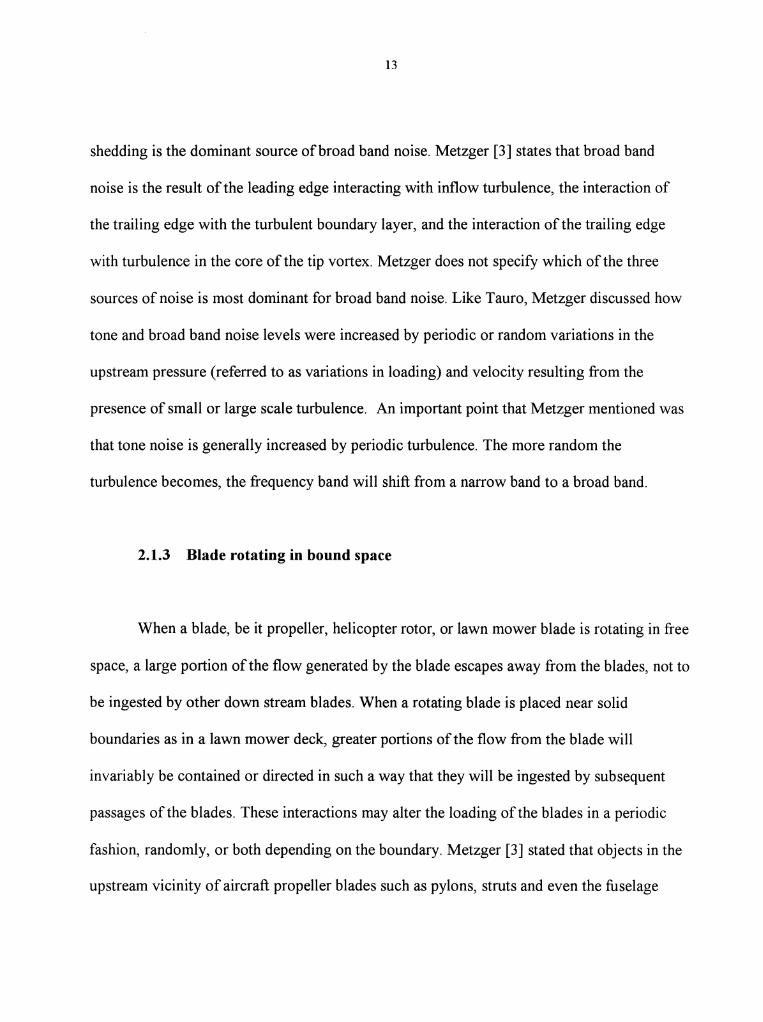
Metzger offers a more detailed characterization stating that the discrete tone noise is
primarily composed of thickness noise and loading, or thrust noise (Figure 2.2). Thickness
noise is the result ofthe blade physically displacing air and is monopole in nature.
Loading noise is related to the actual thrust force that is produced by the blade and is
dipole in nature. Metzger also mentions the contribution ofblade tip radial forces to discrete
tone noise based on his literature search, but did not discuss its importance in comparison
with thickness and loading noise. The noise associated with blade tip radial forces rotates in
phase with the thickness noise, and is the result of air accelerating around the blade tip from
the higher to lower pressure surface. Based on these definitions all three sources of tone noise
are dominant for the high wing blade used in this research. Thickness noise is dominant with
the wing height of 41.3 mm (1.625 in.) and thrust noise with the wing angle of attack of50°.
Noise from blade tip radial forces will also be dominant because the high wing height and
angle of attack will produce a large pressure difference between the front-and-back-sides of
the wing.
Tauro [2] states that broad band noise is composed of trailing edge vortex shedding,
turbulent boundary layer generation along the chord of the blade, and from blade rotation in
turbulent medium. Tauro states that for a flat lawn mower blade, trailing edge vortex
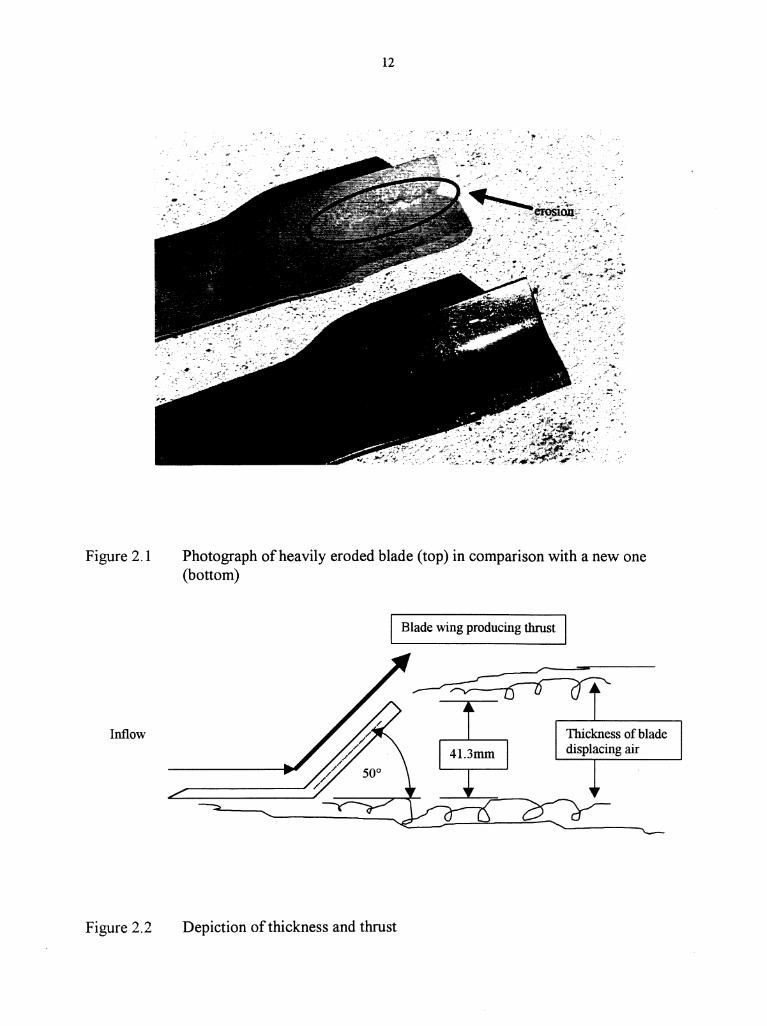
Figure 2.1
Inflow
Figure 2.2
12
Photograph ofheavily eroded blade (top) in comparison with a new one (bottom)
Blade wing producing thrust
Depiction of thickness and thrust
13
shedding is the dominant source ofbroad band noise. Metzger [3] states that broad band
noise is the result of the leading edge interacting with inflow turbulence, the interaction of
the trailing edge with the turbulent boundary layer, and the interaction of the trailing edge
with turbulence in the core of the tip vortex. Metzger does not specify which of the three
sources of noise is most dominant for broad band noise. Like Tauro, Metzger discussed how
tone and broad band noise levels were increased by periodic or random variations in the
upstream pressure (referred to as variations in loading) and velocity resulting from the
presence of small or large scale turbulence. An important point that Metzger mentioned was
that tone noise is generally increased by periodic turbulence. The more random the
turbulence becomes, the frequency band will shift from a narrow band to a broad band.
2.1.3 Blade rotating in bound space
When a blade, be it propeller, helicopter rotor, or lawn mower blade is rotating in free
space, a large portion of the flow generated by the blade escapes away from the blades, not to
be ingested by other down stream blades. When a rotating blade is placed near solid
boundaries as in a lawn mower deck, greater portions of the flow from the blade will
invariably be contained or directed in such a way that they will be ingested by subsequent
passages of the blades. These interactions may alter the loading of the blades in a periodic
fashion, randomly, or both depending on the boundary. Metzger [3] stated that objects in the
upstream vicinity of aircraft propeller blades such as pylons, struts and even the fuselage
14
resulted in the generation of turbulence that altered the loading of the blade and therefore
increased noise levels.
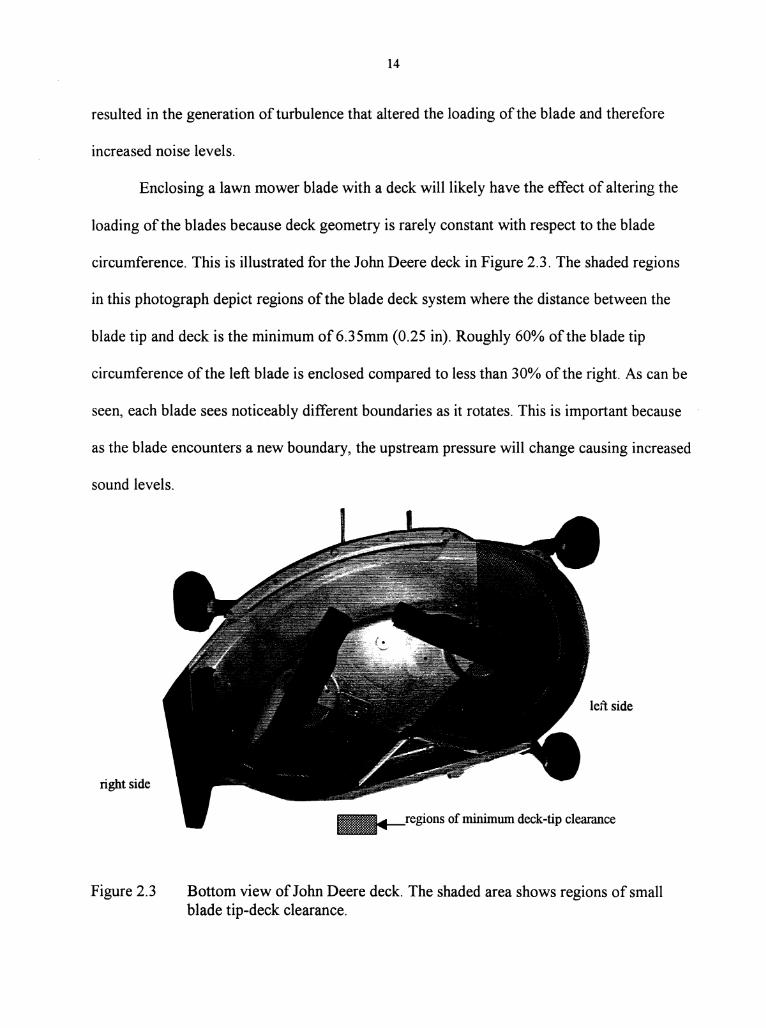
Enclosing a lawn mower blade with a deck will likely have the effect of altering the
loading of the blades because deck geometry is rarely constant with respect to the blade
circumference. This is illustrated for the John Deere deck in Figure 2.3. The shaded regions
in this photograph depict regions of the blade deck system where the distance between the
blade tip and deck is the minimum of6.35mm (0.25 in). Roughly 60% of the blade tip
circumference of the left blade is enclosed compared to less than 30% of the right. As can be
seen, each blade sees noticeably different boundaries as it rotates. This is important because
as the blade encounters a new boundary, the upstream pressure will change causing increased
sound levels.
right side
Figure 2.3
left side
~regions of minimum deck-tip clearance
Bottom view of John Deere deck. The shaded area shows regions of small blade tip-deck clearance.
15
2.1.4 Mechanisms of noise from a two spindle lawn mower
We have discussed thus far how lawn mower blades themselves are a significant
source of noise for a two-spindle lawn mower system. There is also noise resulting from the
flow generated by the lawn mower blades. Hassinen [ 5] stated that the wing of a lawn mower
blade traditionally existed to transport clippings into the bagging unit of the lawn mower, but
that the wing was also thought to generate lift, the mechanisms of which are not greatly
understood. High angles of attack for the wing were employed because it was known that
bagging was generally improved with increased wing height, especially with moist thick
grass. This is related to the fact that the tangential component of the thrust produced by the
blade increases with wing height.
Vance reported in his literature search that for a blade with an angle of attack of 3 0
degrees, the tangential speed of the air-clipping flow was as high as 60% of the blade tip
speed. Assuming this is valid for the blade used in this research, a tip speed of70.4 rn!s
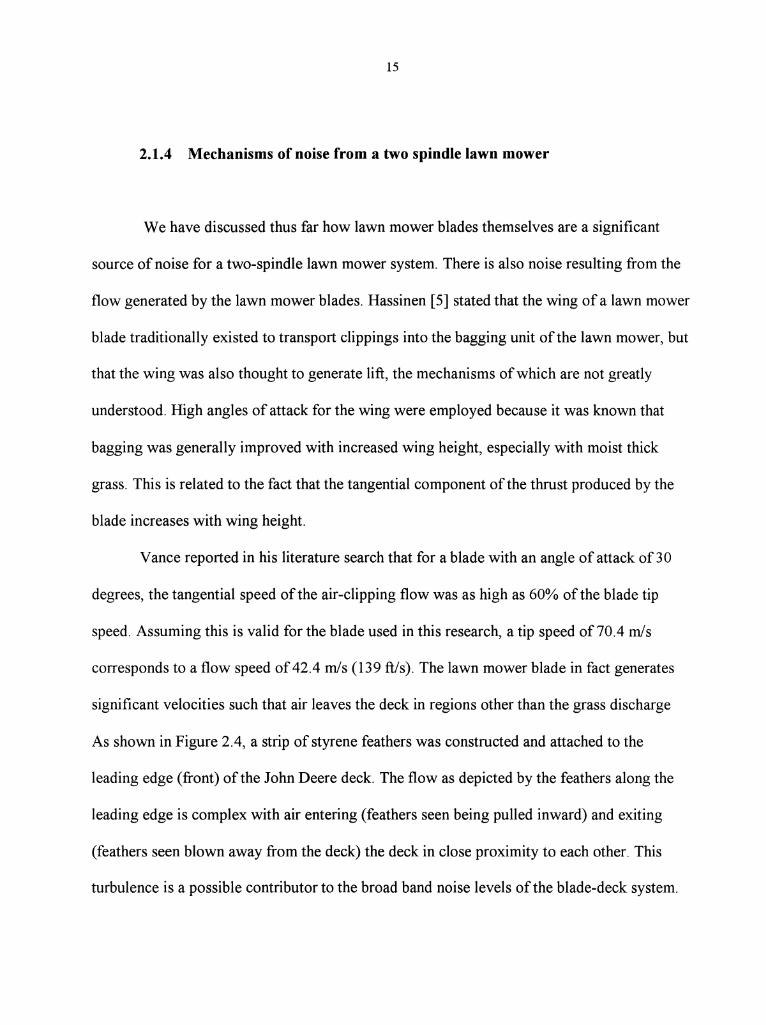
corresponds to a flow speed of 42.4 rnls (139 ft/s). The lawn mower blade in fact generates
significant velocities such that air leaves the deck in regions other than the grass discharge
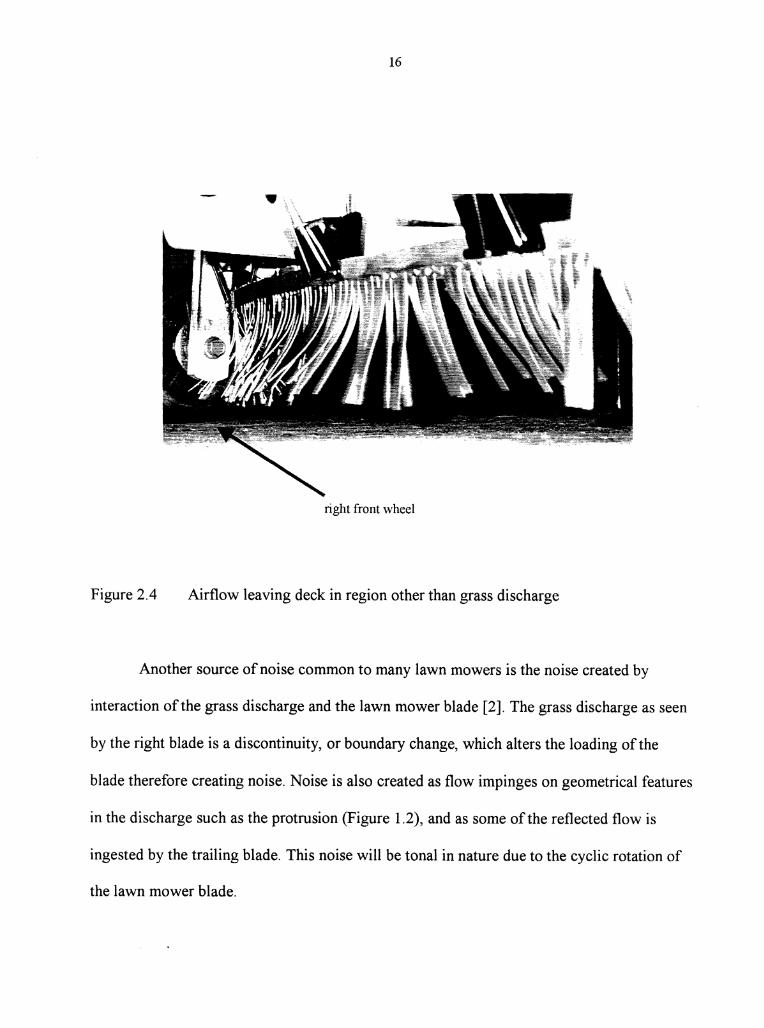
As shown in Figure 2.4, a strip of styrene feathers was constructed and attached to the
leading edge (front) of the John Deere deck. The flow as depicted by the feathers along the
leading edge is complex with air entering (feathers seen being pulled inward) and exiting
(feathers seen blown away from the deck) the deck in close proximity to each other. This
turbulence is a possible contributor to the broad band noise levels of the blade-deck system.
16
right front wheel
Figure 2.4 Airflow leaving deck in region other than grass discharge
Another source of noise common to many lawn mowers is the noise created by
interaction of the grass discharge and the lawn mower blade [2]. The grass discharge as seen
by the right blade is a discontinuity, or boundary change, which alters the loading of the
blade therefore creating noise. Noise is also created as flow impinges on geometrical features
in the discharge such as the protrusion (Figure 1.2), and as some ofthe reflected flow is
ingested by the trailing blade. This noise will be tonal in nature due to the cyclic rotation of
the lawn mower blade.
17
2.2 Performance
Unlike noise, comparably little information is readily available regarding lawn mower
performance. This may be due to a lack of understanding and study, but is also likely due to
an overall lack of any quantifiable scale such as the decibel which is used for sound.
Performance is commonly measured in terms ofthe aesthetic appearance of the cut
grass. In general, it is desired to cut every blade of grass to the same height. With current
mower and blade designs, how well this is achieved [1] is a function of many things
including grass type, initial grass height, moisture (density), lawn mower forward velocity,
and how well clippings are being expelled from the mower. Other factors such as adverse
airflow and the fact that on many lawn mower designs, the front wheel of the tractor
compacts the grass into the ground before the mower blade passes over are known to hinder
performance. All of these factors can result in regions of grass that may not be cut, or may be
cut too tall.
The first subsection will discuss ideas of how a lawn mower creates flow through the
deck and how this flow relates to the lift action. The second subsection will discuss factors
that may enhance or inhibit flow through the deck and lift generation, and the third will
discuss mechanisms of grass cutting.
2.2.1 Mechanisms of flow and lift generation
Like noise, understanding performance in a two-spindle lawn mower deck is also
difficult because of the complex flows and interactions between the blades and deck. Based

18
on the desire to cut every blade of grass to the same height, how well the lawn mower can
perform this is directly related to its ability to lift the grass since grass blades do not
inherently stand perfectly erect on their own. Lift is the force imparted on the grass blades
that raises them into the path of the blade to be cut. It is thought and desired by the lawn
mower manufacturer that the lawn mower blade should have some if not all of the
responsibility to produce lift. It appears to be a part of a misconception that a lawn mower
blade acts as a propeller that is capable of generating sufficient lift so that the primary
purpose of the deck is to act as a shield [ 1] to contain and guide clippings in a specified
direction. This thesis will address this traditional misconception.
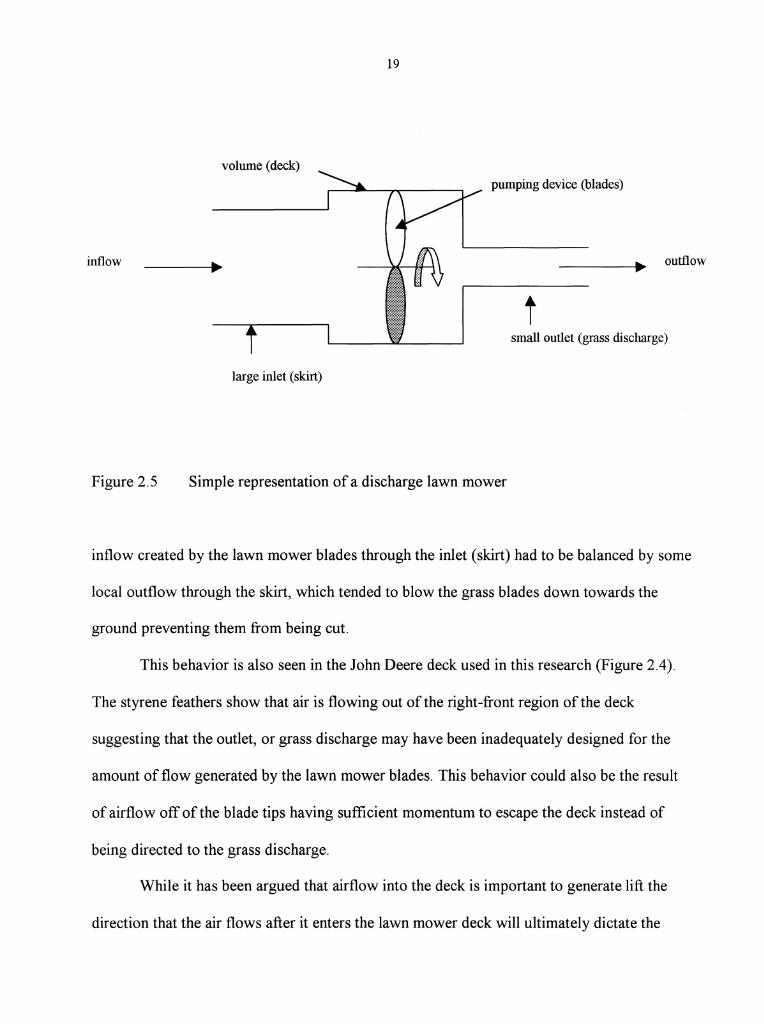
If one were to look at a lawn mower in a crude sense, it can be represented simply as
some sort of volume with a large inlet and a comparably smaller outlet with some device that
creates flow through the volume (Figure 2.5). One unique aspect of evaluating lawn mower
performance is that it cannot ideally be evaluated at the outlet, which is common with other
types of air moving devices. On a lawn mower, the lawn is near the inlet of the mower, so it
is necessary to study the flow behavior there instead.
If one were to compare this schematic (Figure 2.5) to the John Deere lawn mower
(Figure 1.2) used in this research, the skirt would ideally represent the inlet, the lawn mower
blades would be the pump, and the grass discharge the outlet. Looking at this schematic, it
can easily be argued that lift cannot be generated without some net inflow into the lawn
mower.
This point was supported by Vance [ 1]. He noticed in his work that one of the
primary problems with the mulching mower that he used in his work was inadequate airflow
due to the lack of an outlet in a mulching system. He therefore concluded that any local
19
volume (deck) pumping device (blades)
inflow outflow
t small outlet (grass discharge)
large inlet (skirt)
Figure 2.5 Simple representation of a discharge lawn mower
inflow created by the lawn mower blades through the inlet (skirt) had to be balanced by some
local outflow through the skirt, which tended to blow the grass blades down towards the
ground preventing them from being cut.
This behavior is also seen in the John Deere deck used in this research (Figure 2.4).
The styrene feathers show that air is flowing out of the right-front region of the deck
suggesting that the outlet, or grass discharge may have been inadequately designed for the
amount of flow generated by the lawn mower blades. This behavior could also be the result
of airflow off of the blade tips having sufficient momentum to escape the deck instead of
being directed to the grass discharge.
While it has been argued that airflow into the deck is important to generate lift the
direction that the air flows after it enters the lawn mower deck will ultimately dictate the
20
posture of the grass blades. Grass blades are not dissimilar from flags, in that they will tend
to 'fly in the direction of the wind'. It would seem from this that achieving lift is a function of
being able to create flow in the vertical direction.
Creating a lawn mower that does this on a consistent and uniform basis has not met
with much success. Part of this is very likely due to industries' traditional misconceptions of
lift generation, and also because of the many demands placed on the blade. Hassinen [5]
stated that customers routinely request higher winged blades when they have trouble with
uncut grass due to a perceived deficiency in lift generation. Hassinen also mentioned that
above all, lawn mower blade must be inexpensive. In addition it must lift grass, cut grass, and
transport clippings. Now there is the added requirement that the blade must be quiet. These
duties and constraints are counterproductive to each other, as with more duties and
constraints, there will be more compromises. It would seem logical that the removal of some
of the duties and constraints may enhance the likelihood of noticeable improvements in the
other areas. Vance [1] reported that in the past, the lift function was assigned to the blade out
of convenience, and that a potentially viable alternative would be to create lift with some
type of auxiliary system. This would by his theory eliminate the need for a winged blade
thereby lowering drag, which would possibly reduce power requirements and noise. The fact
that the component of the lawn mower that has the most important duties, a lawn mower
blade, must be cheap would seem to be the largest barrier because this limits the amount of
resources that can be invested in research and development of better performing blades.
One of the key problems of generating lift is that many lawn mower blades, including
the high wing blades used in this research are not capable of producing a vertical flow
between the ground and the blade by themselves. The airflow above the blade will have a
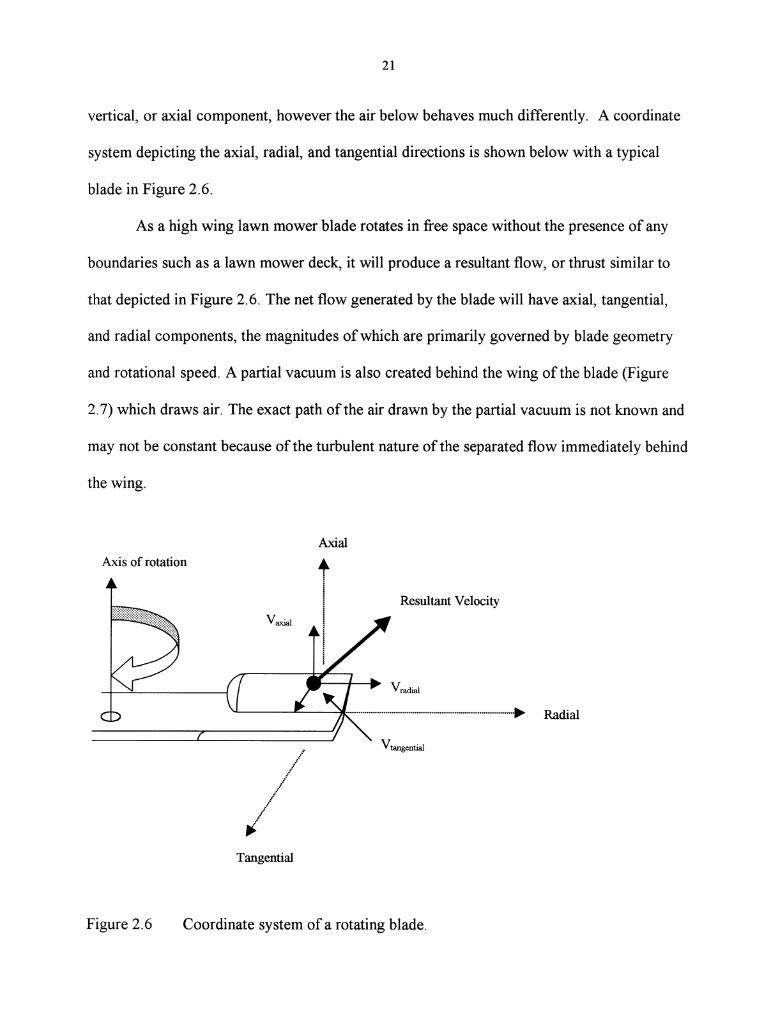
21
vertical, or axial component, however the air below behaves much differently. A coordinate
system depicting the axial, radial, and tangential directions is shown below with a typical
blade in Figure 2.6.
As a high wing lawn mower blade rotates in free space without the presence of any
boundaries such as a lawn mower deck, it will produce a resultant flow, or thrust similar to
that depicted in Figure 2.6. The net flow generated by the blade will have axial, tangential,
and radial components, the magnitudes of which are primarily governed by blade geometry
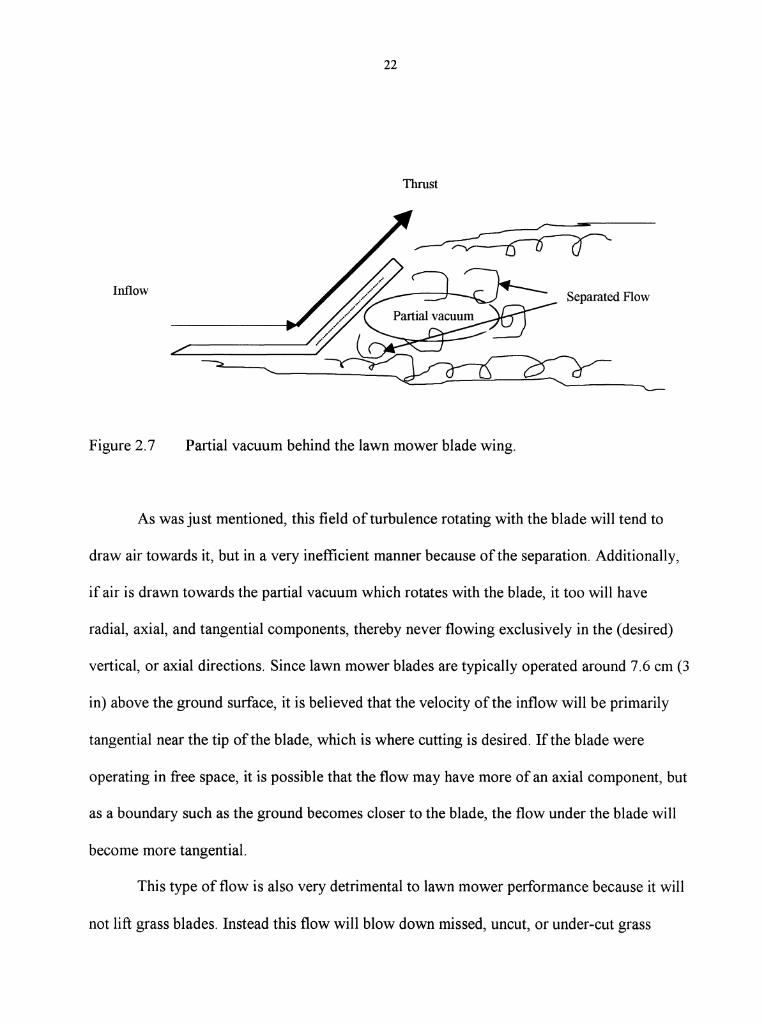
and rotational speed. A partial vacuum is also created behind the wing of the blade (Figure
2. 7) which draws air. The exact path of the air drawn by the partial vacuum is not known and
may not be constant because of the turbulent nature of the separated flow immediately behind
the wing.
Axial
v axial
i I
Resultant Velocity
Axis of rotation
Radial
I "' Tangential
Figure 2.6 Coordinate system of a rotating blade.
22
Thrust
Inflow Separated Flow
Figure 2.7 Partial vacuum behind the lawn mower blade wing.
As was just mentioned, this field of turbulence rotating with the blade will tend to
draw air towards it, but in a very inefficient manner because of the separation. Additionally,
if air is drawn towards the partial vacuum which rotates with the blade, it too will have
radial, axial, and tangential components, thereby never flowing exclusively in the (desired)
vertical, or axial directions. Since lawn mower blades are typically operated around 7.6 em (3
in) above the ground surface, it is believed that the velocity of the inflow will be primarily
tangential near the tip of the blade, which is where cutting is desired. If the blade were
operating in free space, it is possible that the flow may have more of an axial component, but
as a boundary such as the ground becomes closer to the blade, the flow under the blade will
become more tangential.
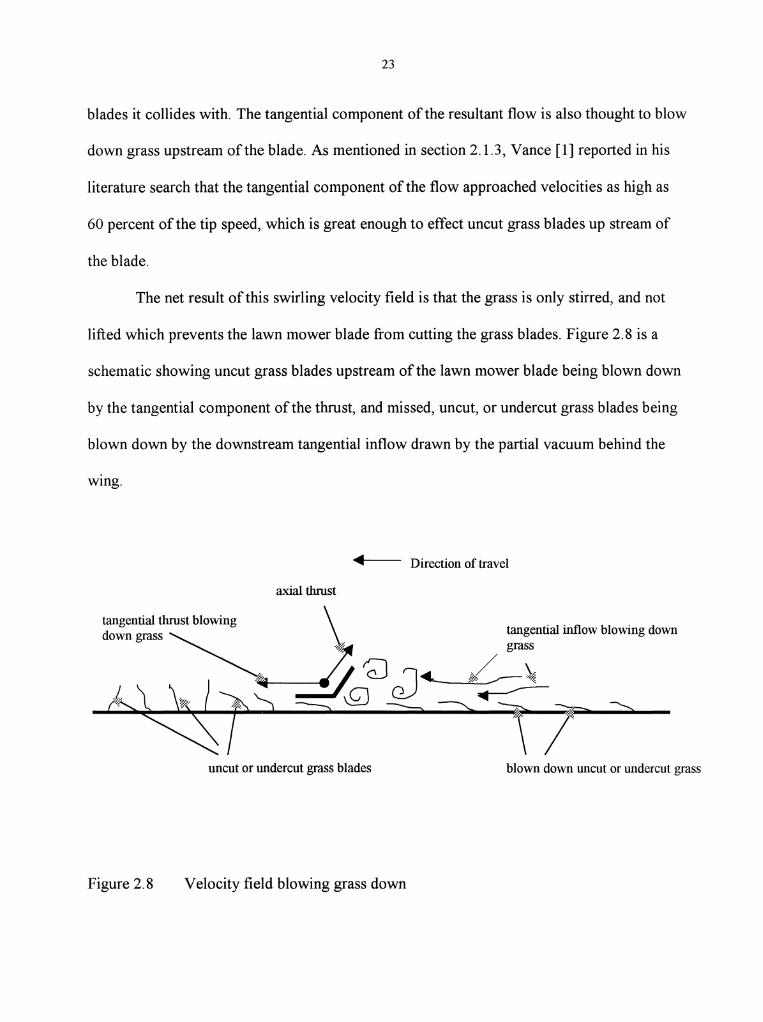
This type of flow is also very detrimental to lawn mower performance because it will
not lift grass blades. Instead this flow will blow down missed, uncut, or under-cut grass
23
blades it collides with. The tangential component of the resultant flow is also thought to blow
down grass upstream of the blade. As mentioned in section 2.1.3, Vance [1] reported in his
literature search that the tangential component of the flow approached velocities as high as
60 percent of the tip speed, which is great enough to effect uncut grass blades up stream of
the blade.
The net result of this swirling velocity field is that the grass is only stirred, and not
lifted which prevents the lawn mower blade from cutting the grass blades. Figure 2.8 is a
schematic showing uncut grass blades upstream of the lawn mower blade being blown down
by the tangential component of the thrust, and missed, uncut, or undercut grass blades being
blown down by the downstream tangential inflow drawn by the partial vacuum behind the
wmg.
tangential thrust blowing downgrass~
~~ ~
... Direction of travel
axial thrust
\. tangential inflow blowing down J==:f grass
.//g 'l ,../ \,: ?&J-5-.~~ :>
\I uncut or undercut grass blades blown down uncut or undercut grass
Figure 2.8 Velocity field blowing grass down
24
Some grass is inherently cut without an upward vertical flow, because some blades
are rigid or resilient enough due to dryness or breed to withstand the dynamic pressure of the
imparting air stream, or are not subjected to it. The amount and evenness of the grass that is
cut by this nature is unsatisfactory, especially with lawn mowers whose front tires of the
tractor depress the grass blades to the ground before the lawn mower blades ever have a
chance to cut them. Vance [ 1] theorized that vortices shed from the lawn mower blade tip
could also cause a downward flow that would certainly exacerbate this effect.
This type of flow is also cyclonic in nature, which results in a strong upward flow
near the axis of rotation. It was observed that this flow was in fact strong enough such that
grass blades directly under the spindle were literally tied in knots when the lawn mower
blades were running and the tractor was kept in a stationary position.
Since the lawn mower blade is incapable of generating a lifting flow by itself, it has
to occur by some other means if the ultimate performance goal of the lawn mower is to be
reached.
It was thought by Vance that inflow into the deck was important to cutting
performance although he could not verify this experimentally. This would seem to make
sense based on the fact that the flows produced near the ground under the lawn mower blades
alone are weak in comparison to the tip speed of the blade, and that a grass blade will
certainly not be moved much less lifted if there is little flow. If generating inflow is to help
cutting performance than it must augment the flow generated by the lawn mower blade in
such a way that the flow under the cutting surface becomes more vertical, or axial. One way
this could be occurring is if opposing flows are colliding, resulting in some net upward flow
(Figure 2.9).
Skirt
Desired upward flow
flow into deck
25
.. ...
flow upstream or downstream of blade
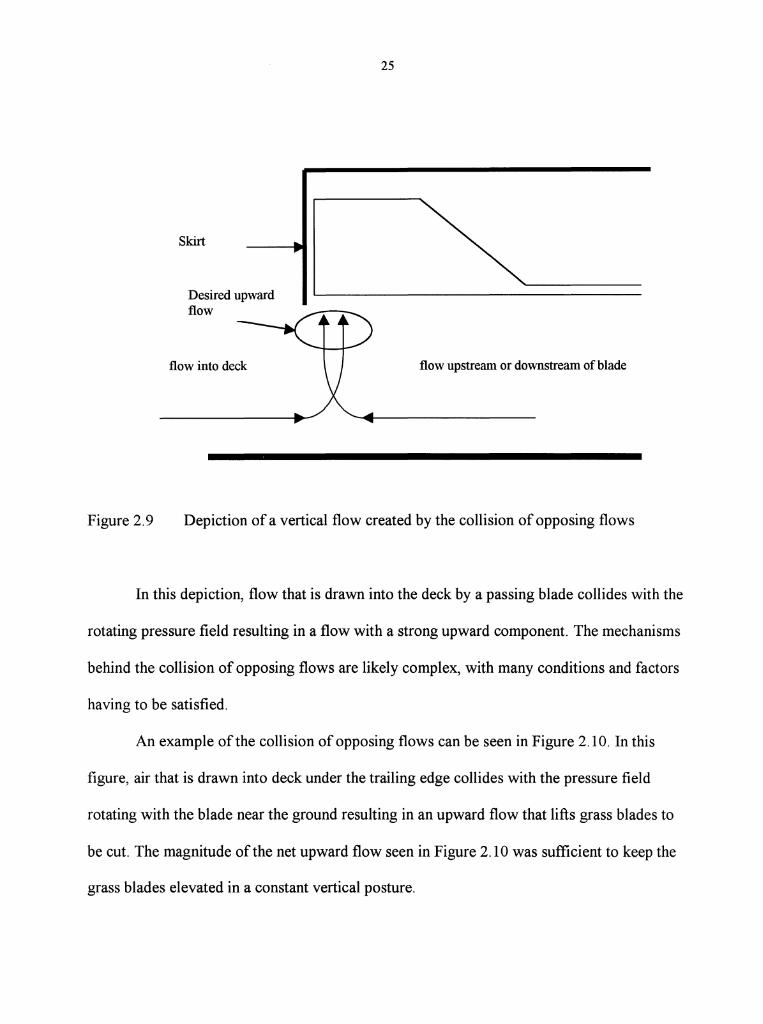
Figure 2.9 Depiction of a vertical flow created by the collision of opposing flows
In this depiction, flow that is drawn into the deck by a passing blade collides with the
rotating pressure field resulting in a flow with a strong upward component. The mechanisms
behind the collision of opposing flows are likely complex, with many conditions and factors
having to be satisfied.
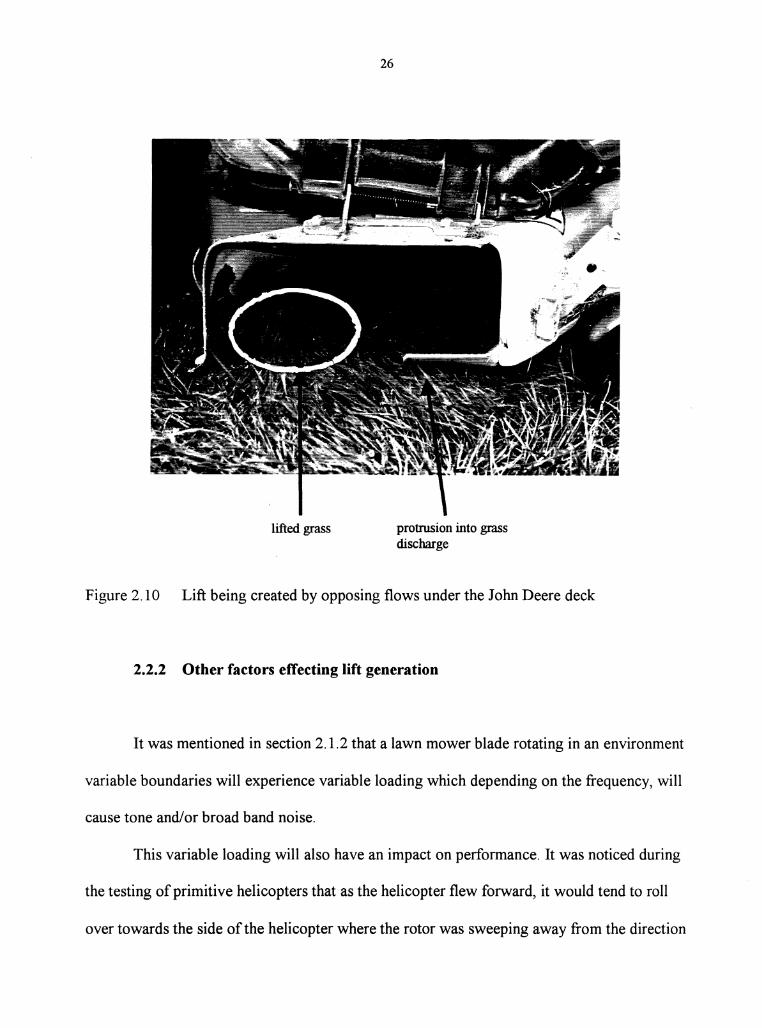
An example of the collision of opposing flows can be seen in Figure 2.10. In this
figure, air that is drawn into deck under the trailing edge collides with the pressure field
rotating with the blade near the ground resulting in an upward flow that lifts grass blades to
be cut. The magnitude of the net upward flow seen in Figure 2.10 was sufficient to keep the
grass blades elevated in a constant vertical posture.
26
lifted grass protrusion into grass discharge
Figure 2.10 Lift being created by opposing flows under the John Deere deck
2.2.2 Other factors effecting lift generation
It was mentioned in section 2.1.2 that a lawn mower blade rotating in an environment
variable boundaries will experience variable loading which depending on the frequency, will
cause tone and/or broad band noise.
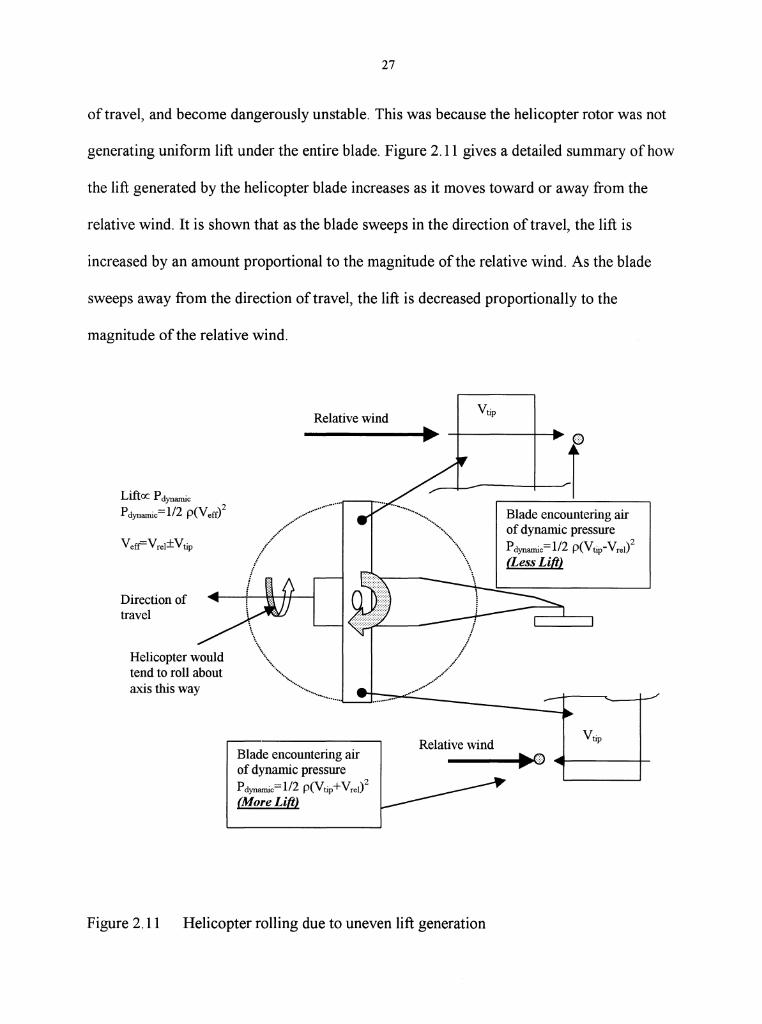
This variable loading will also have an impact on performance. It was noticed during
the testing of primitive helicopters that as the helicopter flew forward, it would tend to roll
over towards the side of the helicopter where the rotor was sweeping away from the direction
27
of travel, and become dangerously unstable. This was because the helicopter rotor was not
generating uniform lift under the entire blade. Figure 2.11 gives a detailed summary of how
the lift generated by the helicopter blade increases as it moves toward or away from the
relative wind. It is shown that as the blade sweeps in the direction of travel, the lift is
increased by an amount proportional to the magnitude of the relative wind. As the blade
sweeps away from the direction of travel, the lift is decreased proportionally to the
magnitude of the relative wind.
Liftoc P dynamic P dynamic= 112 p(Verr)2
Direction of travel
Helicopter would tend to roll about axis this way
Relative wind
Blade encountering air of dynamic pressure Pdynamic=l/2 p(Vtip+Vrei)2
(More Lift)
Vtip
.. ---i-_---t~f
Relative wind
Blade encountering air of dynamic pressure Pdynamic=l/2 p(Vtip-Vrell (Less Lift)
Figure 2.11 Helicopter rolling due to uneven lift generation
28
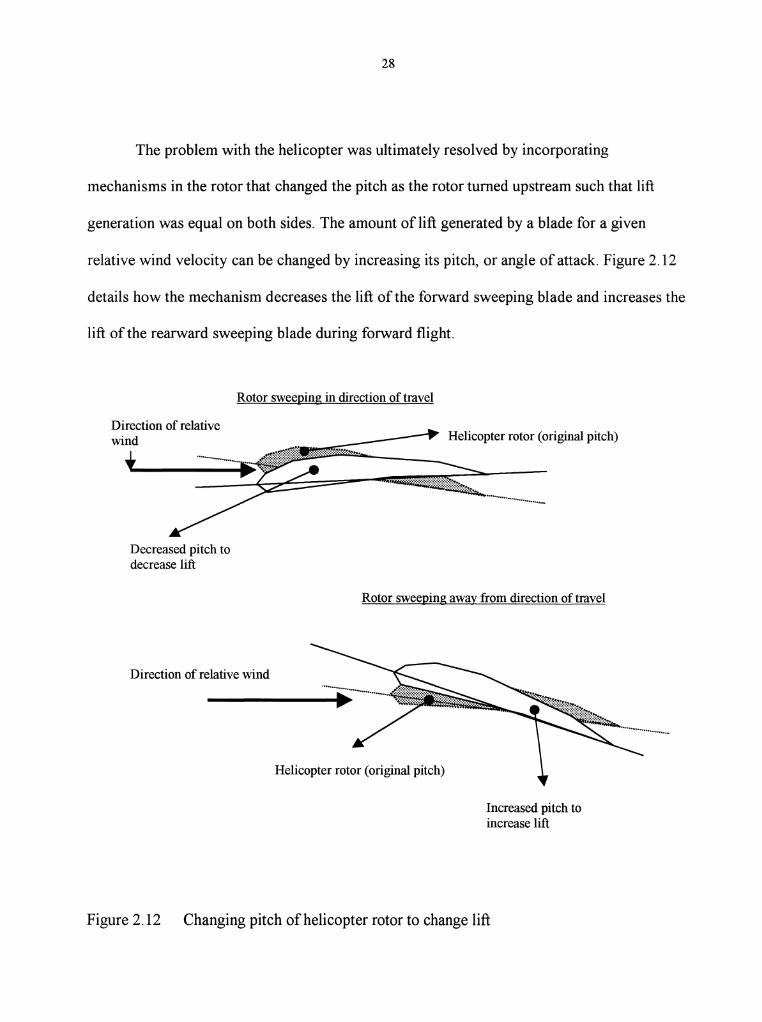
The problem with the helicopter was ultimately resolved by incorporating
mechanisms in the rotor that changed the pitch as the rotor turned upstream such that lift
generation was equal on both sides. The amount of lift generated by a blade for a given
relative wind velocity can be changed by increasing its pitch, or angle of attack. Figure 2.12
details how the mechanism decreases the lift of the forward sweeping blade and increases the
lift of the rearward sweeping blade during forward flight.
Rotor sweeping in direction of travel
wind • Decreased pitch to decrease lift
Direction of relative wind
Helicopter rotor (original pitch)
Rotor sweeping away from direction of travel
Helicopter rotor (original pitch)
Increased pitch to increase lift
Figure 2.12 Changing pitch of helicopter rotor to change lift
29
For a lawn mower blade, the strength of the partial vacuum behind the wing of the
blade will depend on the magnitude of the upstream pressure. Additionally, the velocity of air
that is brought into the deck is also dependent on the upstream pressure. Looking at figure
2.3, it is easily seen that the boundaries around the circumference of the blade tip path are not
constant. There are regions where there is little tip clearance, and regions where the blade tip
is rotating in local regions of free space. As the tip of a blade moves from a region without
boundaries towards a boundary such as the skirt, the loading or upstream pressure will
change effecting how strong of a vacuum is generated behind the blade and how much air is
drawn into the deck.
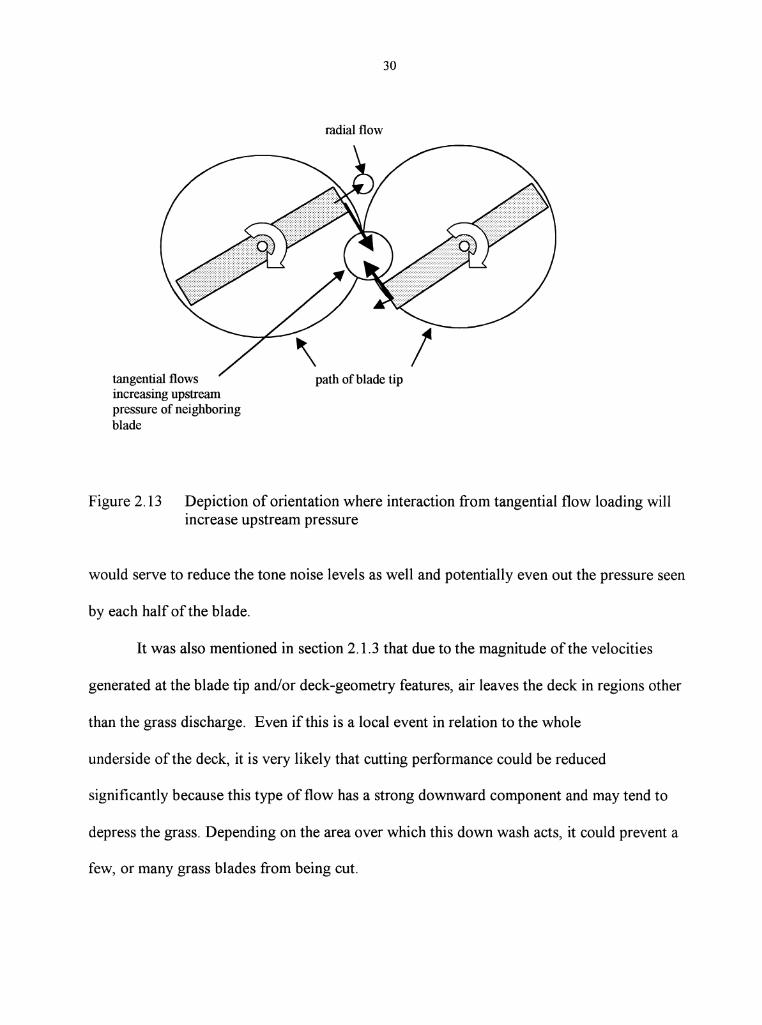
Figure 1.2 shows that there is no physical boundary separating the two rotating lawn
mower blades. Because of this, flows generated by the two blades will interact, and
depending on the instantaneous orientation, will change the loading. As mentioned
previously the airflow generated at the tip of the blade has a radial and rather large tangential
component, which under the right blade orientation (Figure 2.13), will dramatically alter the
loading of the neighboring blade, therefore effecting performance and noise generation.
Vance [1] reported that the John Deere mulching mower used in his research had consistently
poor cutting performance in the overlap region, and he hypothesized that this may be the
result of the variable loading from this flow interaction.
In situations such as these where there is no physical boundary between the blades, it
would make sense to wonder if there is on optimum angle of orientation such that the
interaction of the tangential and radial flows with the neighboring blades is minimized. This
30
radial flow
tangential flows increasing upstream pressure of neighboring blade
path of blade tip
Figure 2.13 Depiction of orientation where interaction from tangential flow loading will increase upstream pressure
would serve to reduce the tone noise levels as well and potentially even out the pressure seen
by each half of the blade.
It was also mentioned in section 2.1.3 that due to the magnitude of the velocities
generated at the blade tip and/or deck-geometry features, air leaves the deck in regions other
than the grass discharge. Even if this is a local event in relation to the whole
underside of the deck, it is very likely that cutting performance could be reduced
significantly because this type of flow has a strong downward component and may tend to
depress the grass. Depending on the area over which this down wash acts, it could prevent a
few, or many grass blades from being cut.
31
Another factor that effects performance is how the lawn mower deck interacts with
the ground [ 1]. As the lawn mower travels across the ground, the distance between the deck
and the ground will change because the topography of the ground is never constant. As the
mower encounters local depressions or mounds, the effective inlet area changes (Figure 2.5),
which will cause a change in airflow velocity under certain regions of the deck. In the case
where the velocity of the airflow is reduced, it is probable based on the theory discussed to
this point that performance could be reduced. This is likely one of the key reasons that lawn
mowing is not repeatable.
2.2.3 Mechanisms of grass cutting
As discussed in Chapter 2, lawn mower parameters that influence cutting
performance are the blade sharpness, tip speed, and how the air flows under the deck. Vance
[ 1] reported that grass is cut as the result of a high-speed impact of the law mower blade
cutting surface with the grass stalk. Typical tip-speeds are around 76 rn!s (15,000 fpm) [1]
with an upper bound based on ANSI regulations of97 m/s (19,000 fpm). The rotational
speed of the John Deere spindles used in this research was measured at 2750 rpm at the
highest throttle setting with a stroboscope. For the 48.9 em (19.25 in) diameter high wing
lawn mower blade used in this research this corresponds to a tip speed of70.4 m/s (13,860
fpm), a tip Mach number of0.20, and a tip Reynolds number of3.6(10)5 based on a chord
length of7.6 em (3 in). Vance also reported that determining the minimum speed necessary
for cutting is also very important as a design parameter because reducing speed reduces the
power requirement from the engine and noise radiated by the lawn mower deck and blades. It
32
is also possible that reducing speed could reduce the incidence or severity of down wash type
flows seen in Figure 2.4 as well as other airborne turbulence.
It is not known how rotational speeds for the spindles are decided upon by
manufacturers in general, but it is likely that experimentation is involved in the process. As
with many design parameters of lawn mowers and blades, the necessary tip speed may be an
assumed requirement based on tradition and or misconception. Vance found in literature that
cutting has been successful at speeds as low as 21 m/s (4100 fpm), but that John Deere found
that tip speeds around 61 m/s (12,000 fpm) provided consistent cut quality. It was not
mentioned how the mower in the 21 m/s case performed. This is important because if the low
tip speed mower had efficient lift generation without any down wash, then favorable cutting
at that tip speed could be feasible. It is also possible that the tip speeds are as high as they are
in order to give the lawn mower blades the maximum number of passes per forward distance
traveled, which again would not be necessary if lift was generated efficiently.
2.3 Conclusions based on the literature
Interactions from neighboring blades and boundaries alter the loading of the blade,
which has an effect on how the lawn mower blade creates a vacuum, draws air into the deck,
and also how the blade-deck system radiates noise. Interactions with the neighboring blade
will produce tone type noise since it is cyclic in nature, and may also help vacuum generation
because of the creation of local regions of large upstream pressure. Periodic interactions with
local regions of tight tip clearance may help draw in air, but may also create noise because
they appear as a discontinuity.
33
Rotating objects have a certain amount of inherent noise that is strongly related to
overall dimensions, operating speed, and overall aerodynamic quality, which is related to
specific blade geometry. Operating speed aside, as blades become less aerodynamic, different
mechanisms of tone and broad band noise will be intensified, thereby increasing overall
sound levels.
High wing lawn mower blades like the ones used in this research are not aerodynamic
by nature due to the many responsibilities placed upon them. Because of this, they are going
to effectively make already turbulent air more turbulent, thereby increasing noise and
potentially hindering performance.
There appears to be a large disregard for airflow in current lawn mower deck and
blade design. A lack of clear methods to consider how airflow can create noise and hinder
performance is the root of the problem. This may be fueled by lack of study, or as noted by
Vance [1], convenience. Assuming the basic design of a lawn mower blade may not change,
it is believed that improvements in performance and noise reductions are realistic if airflow is
studied further.

34
CHAPTER 3. EXPERIMENTAL METHODS
There were three main experimental procedures used for the research:
1) Sound power measurements.
2) Dynamic pressure distribution measurements.
3) Field performance tests.
The following section divides the measurement procedures into laboratory and field
measurements. While the goal of the research is to refine laboratory tests to predict field
performance, the field measurements were made to refine and validate the laboratory
measurements and analysis.
3.1 Laboratory tests
During the course of this research two laboratory experiments were employed to learn
more about the mechanisms of lawn mower blade noise and performance: sound power
measurements and dynamic pressure distribution measurements.
The first three subsections will describe the laboratory experimental setups used to
measure sound power and the dynamic pressure distribution, the forth will describe the data
acquisition system used to measure pressure, and the fifth will discuss how the pressure data
is presented.
35
3.1.1 Sound power experimental setup
Sound power was measured using the same experimental setup designed by Tauro [2]
for his research (Figure 3.1). The reader is referred to Tauro's thesis for more details. This
setup was designed to conform to the ANSI 12.35-1990 standard, Measurement
of Sound Power in a Free Field Over a Reflecting Plane in an Anechoic Room. This is also
designed to conform to ISO international measurement standards.
3.1.2 Dynamic pressure distribution measurement
The performance and noise created by a rotating lawn mower blade are related to how
it moves air. Information about how the air is moved by the lawn mower blade can be
determined by measuring the dynamic air pressure distribution under the lawn mower blades.
Whenever the velocity of a fluid particle changes, be it from rest or at a previous velocity, its
dynamic pressure changes from what it was before. Air from the surroundings, which is at
rest in comparison to the velocities encountered inside the mower deck is drawn towards
regions of reduced static pressure created by the rotating lawn mower blades. As the particles
gain velocity, the dynamic pressure changes, which can be calculated. Studying how the
dynamic pressure spatially varies under the lawn mower blades can reveal pertinent
information related to performance and noise generation. For example, measuring the
dynamic pressure may indicate where lift is or is not being generated, and identify the
presence and location of turbulence and down-wash as seen in Figure 2.4, and observed by
Vance [1].
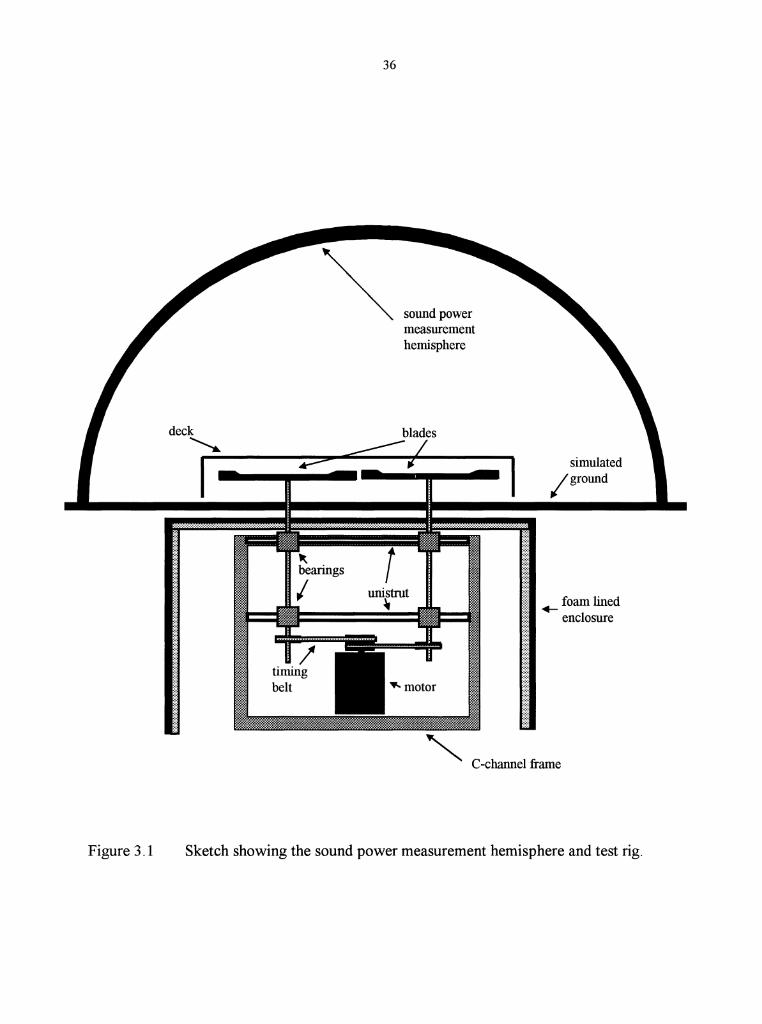
Figure 3.1
36
sound power measurement hemisphere
simulated /ground
._ foam lined enclosure
"" C-channel frame
Sketch showing the sound power measurement hemisphere and test rig.
37
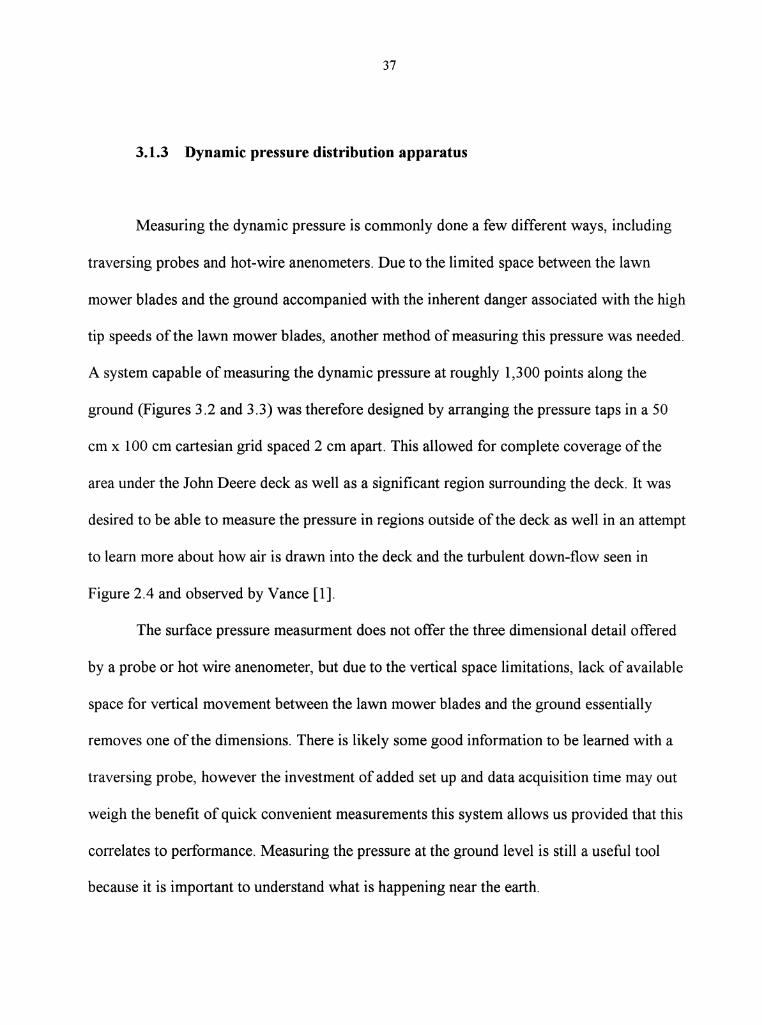
3.1.3 Dynamic pressure distribution apparatus
Measuring the dynamic pressure is commonly done a few different ways, including
traversing probes and hot-wire anenometers. Due to the limited space between the lawn
mower blades and the ground accompanied with the inherent danger associated with the high
tip speeds of the lawn mower blades, another method of measuring this pressure was needed.
A system capable of measuring the dynamic pressure at roughly 1,300 points along the
ground (Figures 3.2 and 3.3) was therefore designed by arranging the pressure taps in a 50
em x 100 em cartesian grid spaced 2 em apart. This allowed for complete coverage of the
area under the John Deere deck as well as a significant region surrounding the deck. It was
desired to be able to measure the pressure in regions outside of the deck as well in an attempt
to learn more about how air is drawn into the deck and the turbulent down-flow seen in
Figure 2.4 and observed by Vance [1].
The surface pressure measurment does not offer the three dimensional detail offered
by a probe or hot wire anenometer, but due to the vertical space limitations, lack of available
space for vertical movement between the lawn mower blades and the ground essentially
removes one of the dimensions. There is likely some good information to be learned with a
traversing probe, however the investment of added set up and data acquisition time may out
weigh the benefit of quick convenient measurements this system allows us provided that this
correlates to performance. Measuring the pressure at the ground level is still a useful tool
because it is important to understand what is happening near the earth.
Stainless steel taps (Hypodermic tubing)
38
I Gmund surlace (high · particle board)
Vinyl tubing to scanivalve
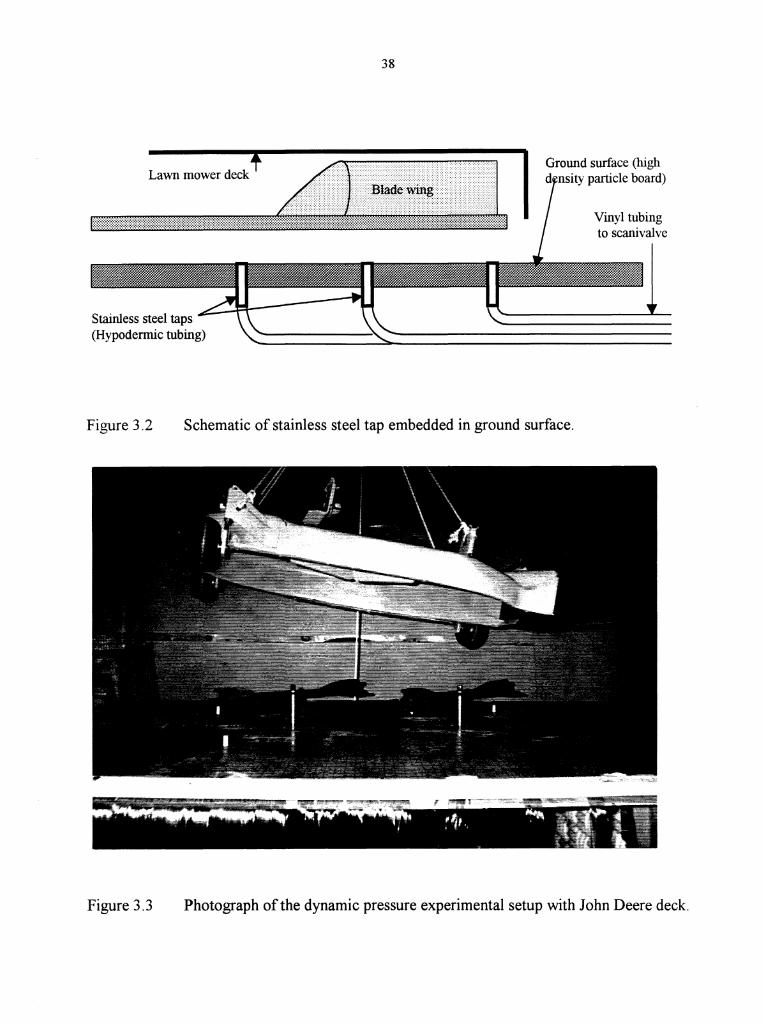
Figure 3.2 Schematic of stainless steel tap embedded in ground surface.
Figure 3.3 Photograph ofthe dynamic pressure experimental setup with John Deere deck.

39
The dynamic pressure platform, Figure 3.3, consists of a 191 em (75 inch) by 122 em
(48 inch), 0.64 em (0.25 inch) thick high density particle board into which the stainless steel
pressure taps are embedded. The pressure taps are cut to lengths of roughly 2.5 em (1 inch)
from standard wal119 gage (1.0922 mm OD) stainless steel hypodermic tubing stock. The
pressure taps are embedded into holes drilled with a 1.0414 mm (0.041 inch) diameter drill
bit and secured with epoxy. The pressure-taps are connected to a scanning pressure
transducer with 1.016 mm (0.040 inch) ID vinyl tubing. The stainless steel pressure taps and
vinyl tubing extend roughly 2 em from the bottom of the particle board. In order to prevent
crimping of the taps or tubing, the particle was elevated above the acoustic enclosure.
This was accomplished by attaching three 122 em long, 0.64 em thick, 4.5 em wide
strips of wood to the underside of the particle board on the left, right, and front sides of the
pressure tap grid (the vinyl tubing dangles from the back side of the grid as seen in Figure
3.3). A 122 em x122 em, 0.0635 em thick piece of plywood was attached to the front strip
with hinges and serves as a 'door' which contains all of the loose vinyl tubing.
3.1.4 Dynamic pressure measurement instrumentation
The instrument used to measure the dynamic pressure in this research is a Scanivalve
Corp model48S2-153 scanivalve (Figure 3.4). The scanivalve is coupled to a+/- 1.0 psid
pressure transducer. This type of instrument was chosen because it is able to measure the
pressure at 48 individual locations. An internal solenoid that is actuated by the controller
'steps', or rotates a rotor that exposes each individual port to the transducer as directed by a
40
connector ring
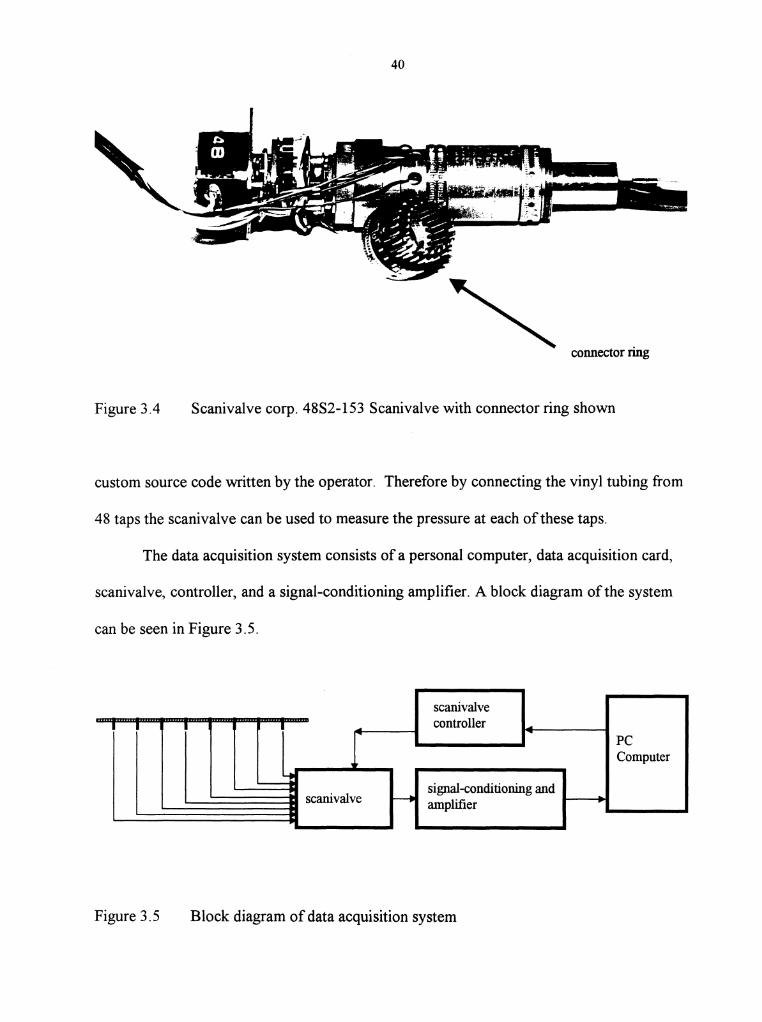
Figure 3.4 Scanivalve corp. 48S2-153 Scanivalve with connector ring shown
custom source code written by the operator. Therefore by connecting the vinyl tubing from
48 taps the scanivalve can be used to measure the pressure at each of these taps.
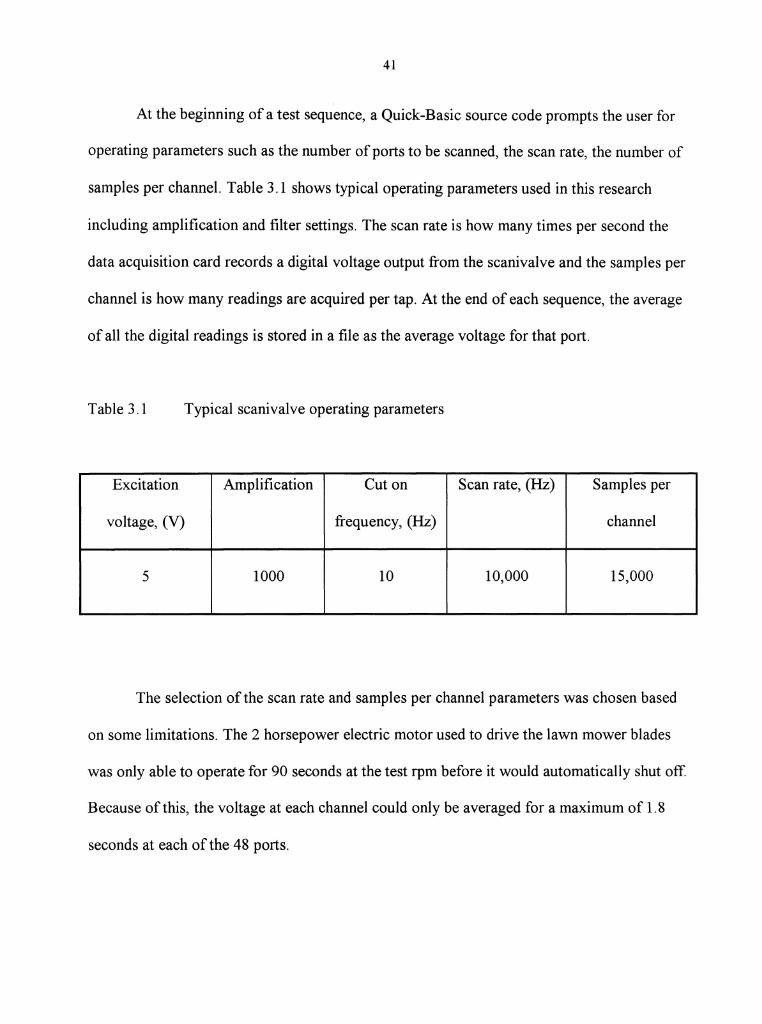
The data acquisition system consists of a personal computer, data acquisition card,
scanivalve, controller, and a signal-conditioning amplifier. A block diagram of the system
can be seen in Figure 3.5.
scanivalve controller
PC Computer
scanivalve r---. signal-conditioning and amplifier
Figure 3.5 Block diagram of data acquisition system
41
At the beginning of a test sequence, a Quick-Basic source code prompts the user for
operating parameters such as the number of ports to be scanned, the scan rate, the number of
samples per channel. Table 3.1 shows typical operating parameters used in this research
including amplification and filter settings. The scan rate is how many times per second the
data acquisition card records a digital voltage output from the scanivalve and the samples per
channel is how many readings are acquired per tap. At the end of each sequence, the average
of all the digital readings is stored in a file as the average voltage for that port.
Table 3.1 Typical scanivalve operating parameters
Excitation Amplification Cut on Scan rate, (Hz) Samples per
voltage, (V) frequency, (Hz) channel
5 1000 10 10,000 15,000
The selection of the scan rate and samples per channel parameters was chosen based
on some limitations. The 2 horsepower electric motor used to drive the lawn mower blades
was only able to operate for 90 seconds at the test rpm before it would automatically shut off.
Because of this, the voltage at each channel could only be averaged for a maximum of 1.8
seconds at each of the 48 ports.

42
The amount of time the scanivalve averages the voltage at each port, or scan duration
is determined by Equation 3 .1.
Scan duration (s) =Samples per channel/Scan rate 3.1
With the settings listed above in Table 3.1 the voltage at each tap was averaged for
1.5 seconds. This amount oftime was deemed acceptable because under normal operation the
mower is not stationary, but rather moves along the ground. Averaging for longer periods of
time would lend to greater repeatability since the flow at many of the ports is highly
unsteady, however this information would correlate less to actual performance because the
mower is not stationary, and it is the unsteadiness of the flow that contributes to poor
performance and mowing repeatability.
Once all of the information is entered, the program instructs the data acquisition card
(National Instruments Lab PC+) to prompt the scanivalve controller (model CTLR10P/S2-
S6) to step the scanivalve through its program sequence. The signal that is generated by the
scanivalve passes through a Vishay Instruments signal-conditioning amplifier (model231 0),
and is input to the data acquisition card.
3.1.5 Data presentation
As mentioned previously, the dynamic pressure measurement system was designed to
have the capability of measuring the pressure at up to 1,300 different locations under the
deck. The scanivalve is designed such that individual groups of 48 pressure taps can be
43
connected to it by way of a removable ring (Figure 3.4). Since at least 27 ofthese rings
would be needed to accommodate all 1,300 taps, a system was devised to quickly change
between groups of 48 taps, however it was not successful.
Because of this, it was decided to take preliminary data at 46 evenly spaced points
(Figure 3.6) under the John Deere deck (2 were reserved to monitor atmospheric pressure).
While this low resolution did not provide the detail that was hoped , the results were
determined to be acceptable to identify the overall impact of blade and deck parameter
changes because significant differences were observed between several blade combinations.
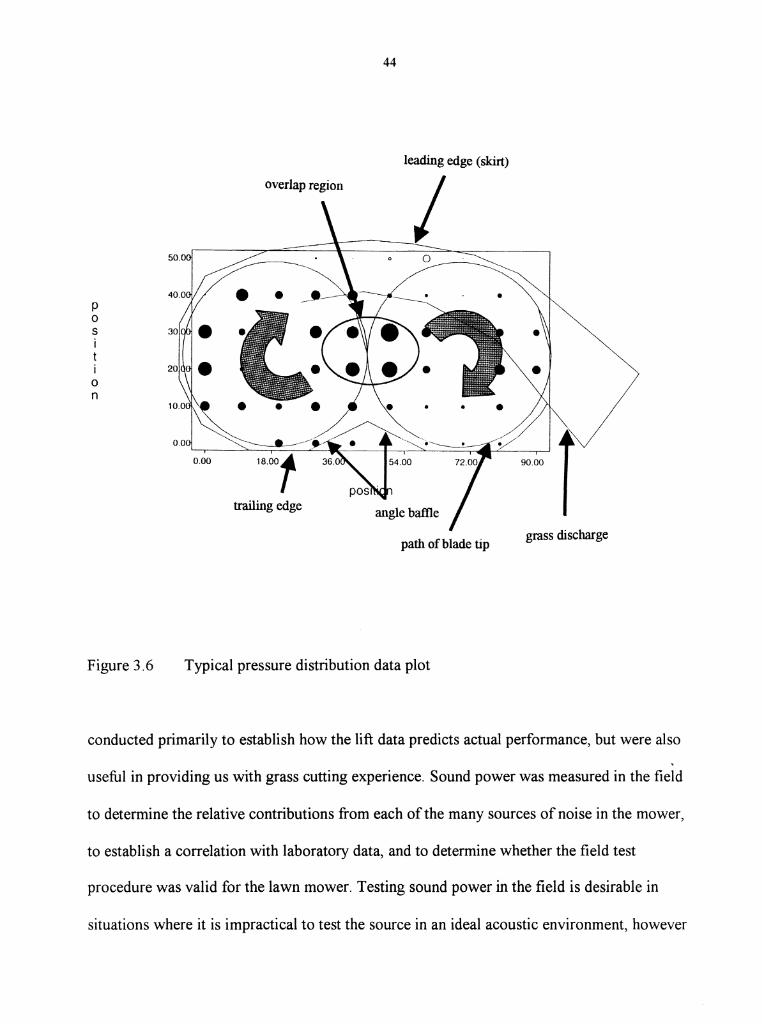
Figure 3.6 shows a typical plot ofthe data. The outline ofthe mower deck, blade tip
path, and grass discharge can be seen along with other significant features such as the
channel and the baffle. The channel and baffle are shown because they play a large role in
how air flows under the deck. An in-house Fortran program was used to import the data file
created by the Quick Basic data acquisition code, assign each pressure measurement to a
cartesian coordinate under the deck. The plot in Figure 3.6 represents the relative magnitude
of the pressure measured by the scanivalve linearly with the diameter of the dots. All figures
in this thesis are scaled to the same maximum allowing quantitative comparisons between
figures. The black and the white dots represent negative (suction) and positive (down wash)
gage pressures respectively.
3.2 Field tests
The performance and sound power of the John Deere lawn mower were also
measured in the field during the course of this research. Field performance tests were
p 0 s i t i 0 n
Figure 3.6
44
leading edge (skirt)
overlap region
trailing edge
path of blade tip grass discharge
Typical pressure distribution data plot
conducted primarily to establish how the lift data predicts actual performance, but were also
useful in providing us with grass cutting experience. Sound power was measured in the field
to determine the relative contributions from each of the many sources of noise in the mower,
to establish a correlation with laboratory data, and to determine whether the field test
procedure was valid for the lawn mower. Testing sound power in the field is desirable in
situations where it is impractical to test the source in an ideal acoustic environment, however
45
unique situational variables may exist that render field-test data invalid. The first subsection
will describe how the sound power was measured in the field, the second will describe the
visual performance evaluation method, and the third will introduce static testing.
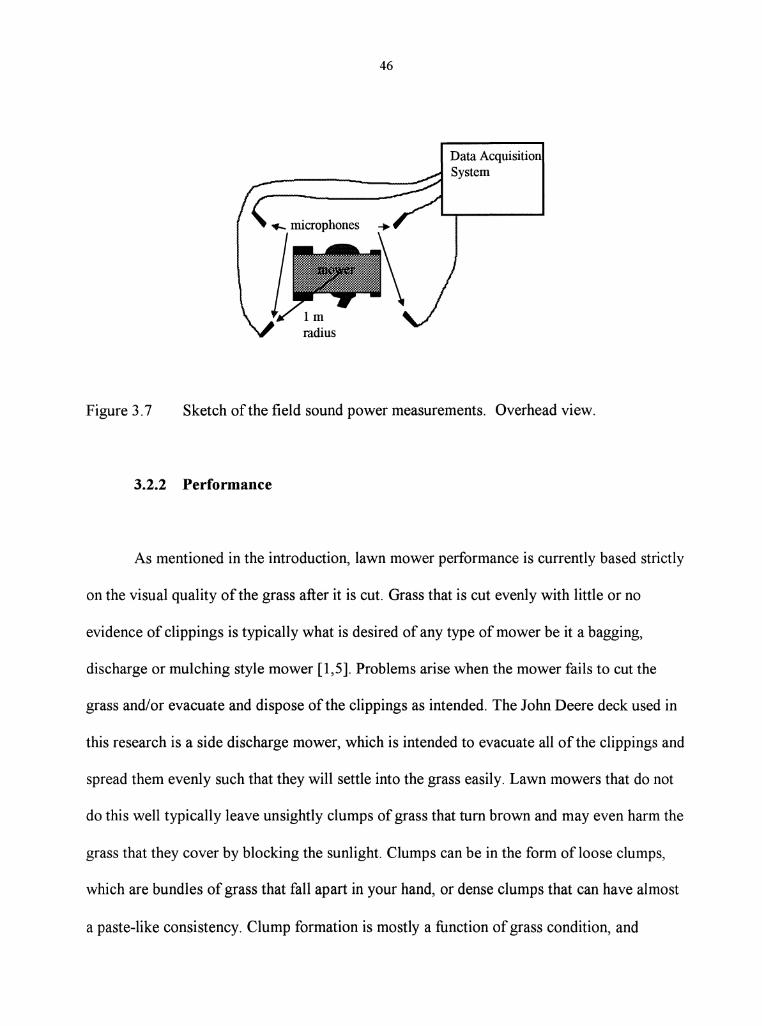
3.2.1 Sound power
Sound power was measured in the field in accordance with the ANSI 12.36-1990
standard Survey Methods for the Determination of Sound Power Levels of Noise Sources.
The lawn mower was positioned on a section of grass covered earth sufficiently far from
nearby structures. Data was taken with a personal computer running Lab View software with
a National Instruments Lab PC+ data acquisition card. Rockland series 2000 filters (model
2582) were used to both amplify and filter the microphone signals. An array of four ACO
Pacific W' microphones (model4012) were positioned on the surface of a 1m radius
measurement hemisphere centered at the intersection point of the two lawn mower blades
(Figure 3.7). The resulting microphone positions were 0.6 min elevation, and 0.8 m away
from the center of the measurement hemisphere with an orientation of 45 degrees from axes
intersecting the mower centerline and cross section.
The sound power, Lw, was then calculated by averaging the sound pressure, Lpi,
measured from each of the four microphones, Equation 3 .2,
[ 4 (Lpi)] L = 10log l."" 10 10 w 10 4..::::.... •
i=l 3.2
46
Data Acquisition System
,._ microphones --.
Figure 3.7 Sketch of the field sound power measurements. Overhead view.
3.2.2 Performance
As mentioned in the introduction, lawn mower performance is currently based strictly
on the visual quality of the grass after it is cut. Grass that is cut evenly with little or no
evidence of clippings is typically what is desired of any type of mower be it a bagging,
discharge or mulching style mower [1,5]. Problems arise when the mower fails to cut the
grass and/or evacuate and dispose of the clippings as intended. The John Deere deck used in
this research is a side discharge mower, which is intended to evacuate all ofthe clippings and
spread them evenly such that they will settle into the grass easily. Lawn mowers that do not
do this well typically leave unsightly clumps of grass that tum brown and may even harm the
grass that they cover by blocking the sunlight. Clumps can be in the form of loose clumps,
which are bundles of grass that fall apart in your hand, or dense clumps that can have almost
a paste-like consistency. Clump formation is mostly a function of grass condition, and
47
airflow. Grass that is too tall (over 18 em) or too moist will bog down the mower choking off
the airflow and fall straight down, or become stuck to the ceiling of the deck and fall down at
some later time. Features of the blade and deck geometry may create regions where the air
velocity is insufficient to keep the clippings in suspension until they get to the discharge, or
regions where excessive airflow keeps them in suspension until a clump grows to the point
that it is heavy enough to fall.
Grass that is not cut evenly or cleanly can be unsightly even to the untrained eye.
Unevenly cut grass most commonly appears in the form of' stripes', or 'streaks'. These are
rows of uncut or undercut grass, which can sometimes be several inches wide and of
indefinite length. Stripes are most prevalent in the tire track region but have also been
observed in other areas under the deck. Vance [ 1] reported that streaks are common in the
overlap region, and that grass is generally not cut in regions where the blade is sweeping
forward (in the direction of travel), or where air was not flowing into the mower deck. Uncut
or undercut grass can also appear in the form of patches, which are small groups of uncut
grass, or as individual random strands of grass, sometimes referred to as stragglers.
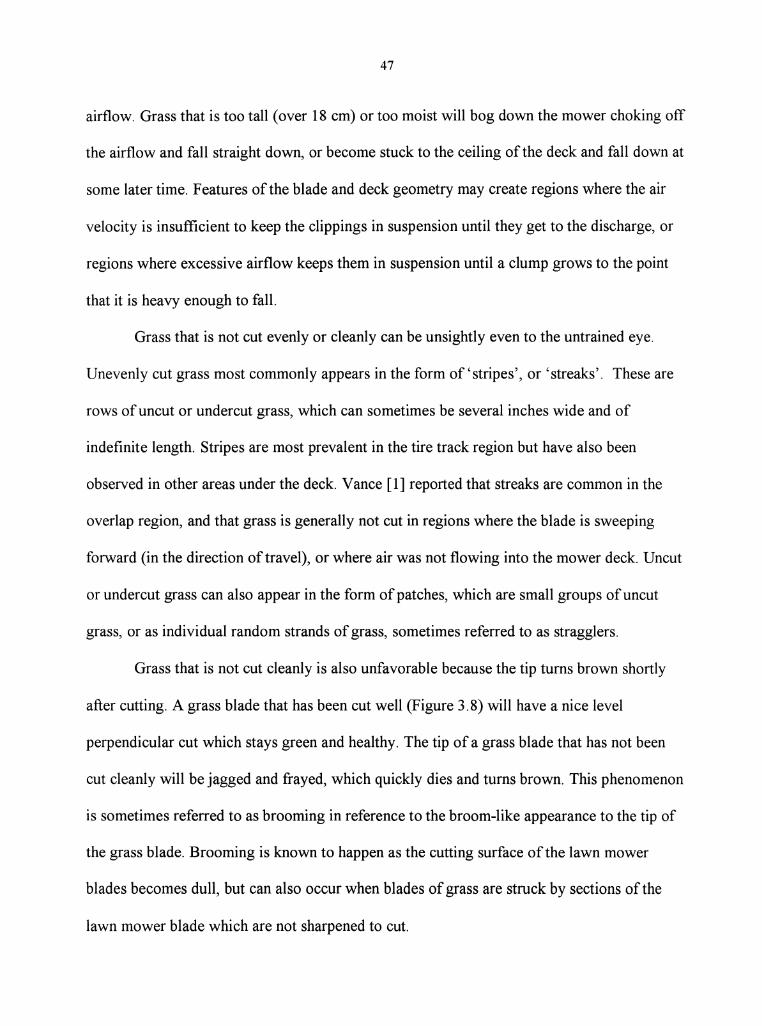
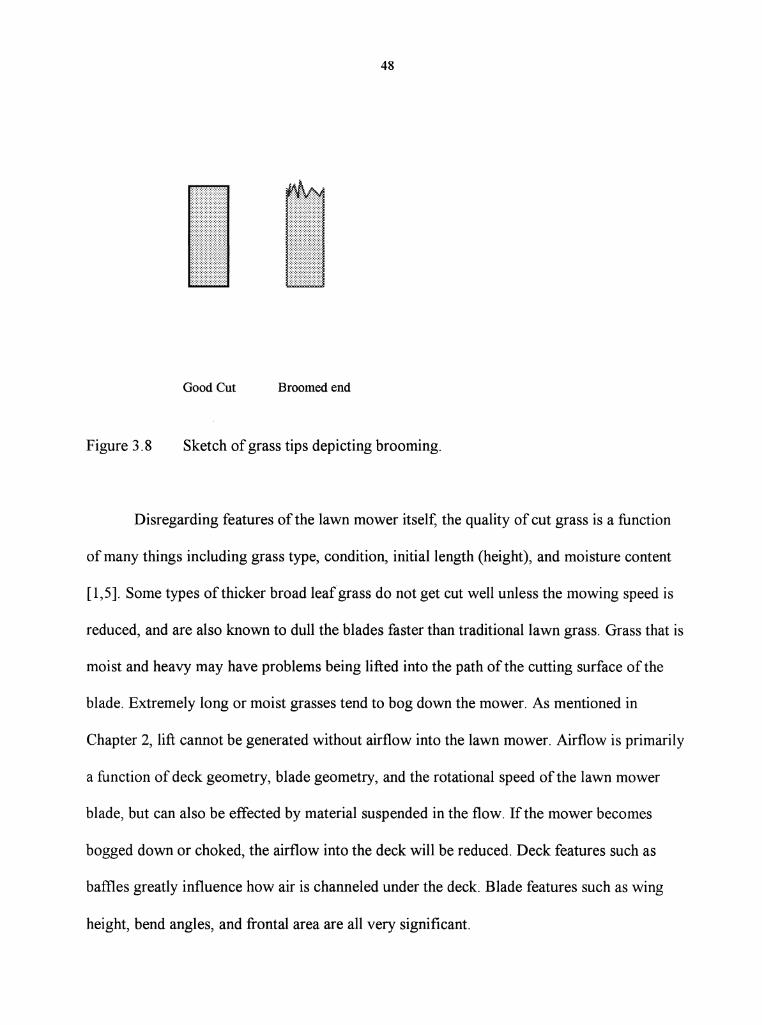
Grass that is not cut cleanly is also unfavorable because the tip turns brown shortly
after cutting. A grass blade that has been cut well (Figure 3.8) will have a nice level
perpendicular cut which stays green and healthy. The tip of a grass blade that has not been
cut cleanly will be jagged and frayed, which quickly dies and turns brown. This phenomenon
is sometimes referred to as brooming in reference to the broom-like appearance to the tip of
the grass blade. Brooming is known to happen as the cutting surface of the lawn mower
blades becomes dull, but can also occur when blades of grass are struck by sections of the
lawn mower blade which are not sharpened to cut.
48
Good Cut Broomed end
Figure 3.8 Sketch of grass tips depicting brooming.
Disregarding features of the lawn mower itself, the quality of cut grass is a function
of many things including grass type, condition, initial length (height), and moisture content
[1,5]. Some types of thicker broad leaf grass do not get cut well unless the mowing speed is
reduced, and are also known to dull the blades faster than traditional lawn grass. Grass that is
moist and heavy may have problems being lifted into the path of the cutting surface of the
blade. Extremely long or moist grasses tend to bog down the mower. As mentioned in
Chapter 2, lift cannot be generated without airflow into the lawn mower. Airflow is primarily
a function of deck geometry, blade geometry, and the rotational speed of the lawn mower
blade, but can also be effected by material suspended in the flow. If the mower becomes
bogged down or choked, the airflow into the deck will be reduced. Deck features such as
baffles greatly influence how air is channeled under the deck. Blade features such as wing
height, bend angles, and frontal area are all very significant.
49
The procedure employed for measuring lawn mower field performance was an
adaptation of the procedure used by Vance [ 1] with additional parameters based on input
from Has sin en [ 5]. The procedure Vance developed assigned numerical scores ranging from
1 to 10, 10 being the best, to human judgements of cut quality and mulch quality. Great care
had been taken on his part to remove error caused by changing grass conditions and bias
drift, which can be caused by the desensitizing nature of jury testing, by testing modification
combinations randomly and in small groups with a control (factory condition). He had hoped
that this would be an adequate measure of performance but it did not work as intended
primarily due to the subjective nature of the test, and the inability to accurately define and
quantify the error associated with human judgement. The end result was that the overall
scores did not vary much from run to run.
Based on this information, it was thought that devising a more comprehensive scoring
system would help separate better performances from worse performances. It was decided
that scores would be assigned to the severity of streaks, patches, randomly uncut grass,
clipping evacuation, and an overall subjective rating. These scores were then averaged. The
streak section was also broken down into tire track streaks and streaks anywhere else in the
cut region of the grass.
An important adaptation incorporated into our field performance testing was the
'morning after survey'. Hassinen [5] stated that the aesthetic appearance of newly cut grass
can be deceiving because uncut or undercut grass that was trampled by the tires or down
wash will tend to stand up during the night and be easily visible. This is apparently a large
problem with commercial mowers. Additionally, grass that has been broomed turns brown
during this period, and will add to the unsightly nature of a poorly cut lawn. After a round of
50
cutting tests, the jury would assemble at some point the next morning, and perform the visual
analysis again. Some consistency was desired with this but was not always feasible. After all
of the judging was complete, the scores were compiled, with the morning after results
receiving two-thirds of the weight.
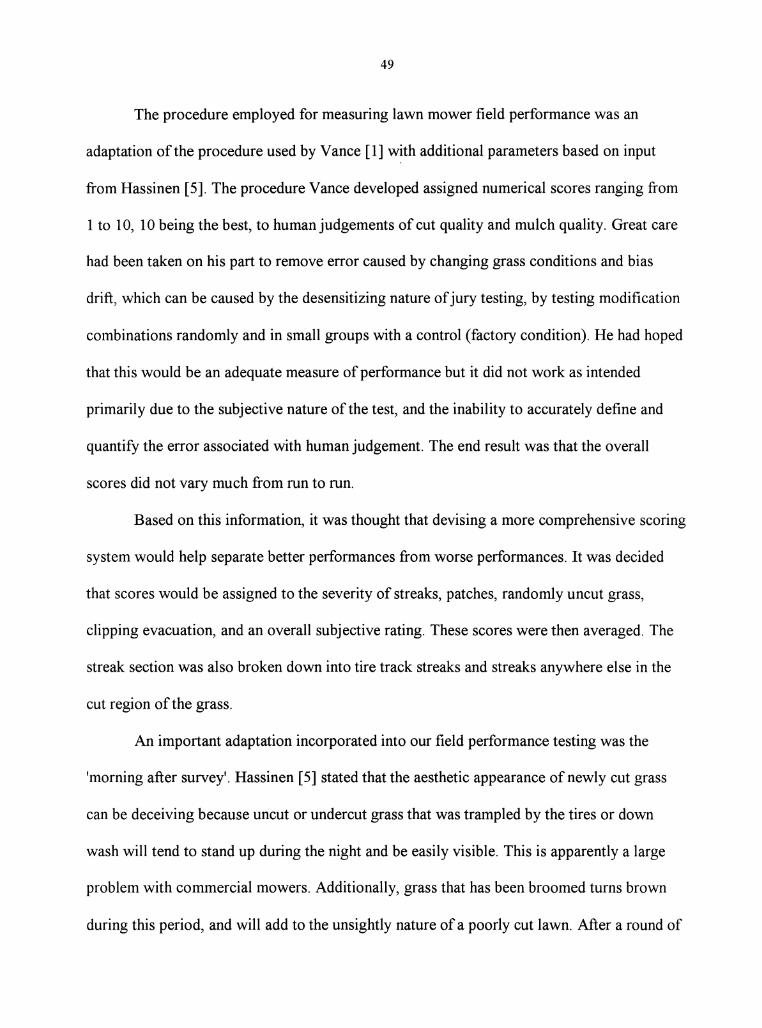
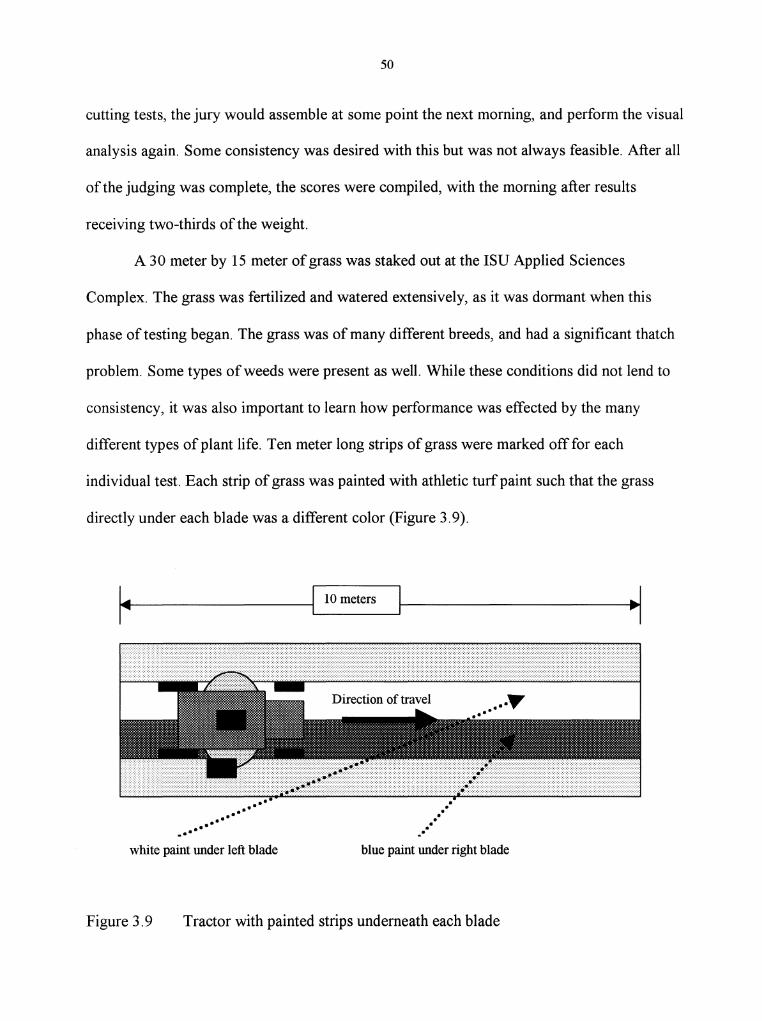
A 3 0 meter by 15 meter of grass was staked out at the ISU Applied Sciences
Complex. The grass was fertilized and watered extensively, as it was dormant when this
phase of testing began. The grass was of many different breeds, and had a significant thatch
problem. Some types of weeds were present as well. While these conditions did not lend to
consistency, it was also important to learn how performance was effected by the many
different types of plant life. Ten meter long strips of grass were marked off for each
individual test. Each strip of grass was painted with athletic turf paint such that the grass
directly under each blade was a different color (Figure 3.9).
I~ 10 meters
white paint under left blade blue paint under right blade
Figure 3.9 Tractor with painted strips underneath each blade
51
Vance [1] had mentioned that the John Deere mower used in his research had
significant streaking problems in the overlap region, and that clippings were migrating from
one chamber of the deck to another, indicating potential interaction problems. Painting the
grass allowed us to define the overlap region, and monitor clipping travel, for example if
grass from the left blade was deposited in the area of the right blade. During the first few
rounds of tests, sheets were also laid out next to the painted strip on the discharge side to
observe any patterns of clipping dispersal that might further provide information about
airflow. This proved to be ineffective due to sudden breezes that blew the clippings away.
A jury consisting both of people that were familiar with this research and those that
were not was selected before each round to judge the performance. Each were given a
scoring sheet (see Appendix) that addressed all of the previously mentioned criteria for
cutting performance and clipping evacuation.
3.2.3 Static tests
Another important idea tested in this research was static tests which are cutting tests
where the mower does not move. This is done merely by parking the mower on a region of
uncut grass, activating the blades for a fixed time period, turning the blades off, and then
moving the mower. This is somewhat easier said than done, and is likely not practical for
every tractor on the market. The mower could not be driven off the static test area because
the wheels would trample the grass, so it had to be manually lifted off of the test section. The
52
amount of time the blades needed to be operated to get the desired effect varied with grass
breed and condition, but 5 seconds was usually adequate.
The static test was conceptualized as a way to investigate the correlation between the
dynamic pressure distribution data, and how grass is being lifted or depressed by down wash
type flows. It was also hoped that this test would provide correlation between performance
when the mower is moving forward and when it is standing still, since the dynamic pressure
measurement laboratory tests are performed in a static condition.

53
CHAPTER 4. MEASURED DATA
This chapter describes the different measurements that were taken, and reveals how
airflow and noise radiation are related and effected by interactions between the lawn mower
blades and their surroundings. This data also shows that there is a good level of correlation
between the field and laboratory test procedures. The effect of interactions between the lawn
mower blades and deck are examined first. As discussed in Chapter 2, both tone and broad
band noise can be created when a rotating blade encounters regions of varying upstream
pressure. These variations in loading of the blade will also effect how air is drawn into the
deck. Ways to minimize this interaction through the use of timing belts and tip modification
are also explored.
Establishing a correlation between the field and laboratory test procedures is
important because it may not always be convenient to test a lawn mower in the laboratory, or
vice versa. Having the flexibility to test in one environment and being able to correlate the
results to the other is necessary for this reason.
4.1 Effect of lawn mower deck
As mentioned in Chapter 2, a lawn mower blade rotating above the ground without a
deck is incapable of producing airflow between the ground and the blade that is primarily
normal to the ground plane because of the rotation of the blade, and its proximity to the
ground. The flow under the blade near the ground will be week due to the separated flow

54
immediately behind the wing, and will be primarily tangent to the plane. In Chapter 2 it was
said that when a boundary such as a lawn mower deck surrounds the blade, the pressure
upstream of the blade will change, which will alter how the blade draws air behind it, and
how air is drawn into the deck.
The first subsection explores the effects that interactions between the blade and the
deck have on the pressure distribution and the second will discuss the effects of the blade-
deck interactions on sound power. The third subsection will discuss the effects of interactions
in the overlap region between neighboring blades on the pressure distribution, and the fourth
subsection will discuss the effects of overlap interactions on sound power. The points are
made by illustrating the difference in pressure distribution and sound power for single blades
and double blades with and without the presence of the lawn mower deck.
4.1.1 Effect of blade-deck interactions on the pressure distribution
Figure 2.3 shows that roughly 2/3 of the circumference of the left and 1/4 of the right
blade are bound by regions with minimum clearance between the deck and the blade-tip. The
effect the deck has on the pressure distribution for the left blade alone is shown in Figures 4.1
and 4.2. In Figure 4.1 the left blade is rotating with no deck. The outline of the deck is
included as a reference in Figure 4.1. In Figure 4.2, the left blade is rotating alone in the
deck. Both Figure 4.1 and 4.2 are scaled to the same value so that the smaller circles in
Figure 4.1 compared to Figure 4.2 indicate a smaller pressure.
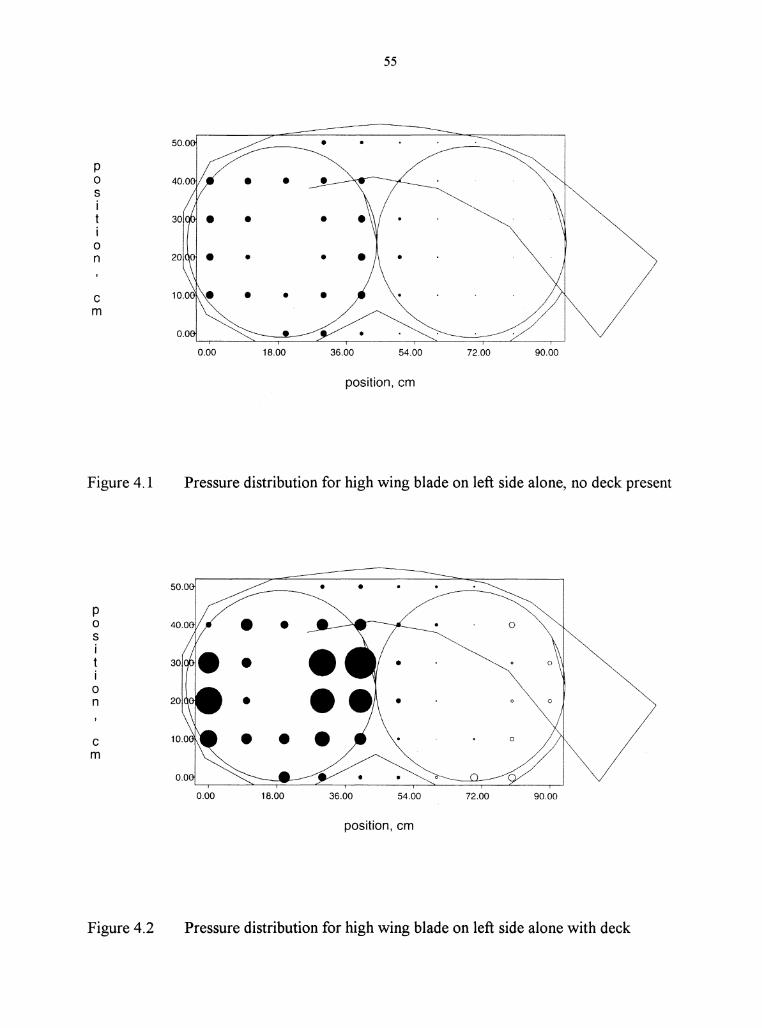
p 0 s
0 n
e m
Figure 4.1
p 0 s
0 n
e m
Figure 4.2
55
'~I .0l • • I~
• • \
~ • • •
I • • • I v 0.00 18.00 36.00 54.00 72.00 90.00
position, em
Pressure distribution for high wing blade on left side alone, no deck present
0.00 18.00 36.00 54.00 72.00 90.00
position, em
Pressure distribution for high wing blade on left side alone with deck

56
Figure 4.2 shows the effect that the presence ofthe deck has on the amount of suction
generated near the ground for the left blade. Vance [1] noted that in general air was flowing
into the deck in regions where the tip clearance is small, and was not flowing into the deck
where tip clearance was large. This small tip clearance over the majority of the
circumference of the left blade will tend to form a seal creating a compression stroke, similar
to the effect of a piston in a cylinder. The larger diameter black circles present under the left
blade in Figure 4.2, compared to Figure 4.1 show that the added compression from the
presence of the deck boundary helps to create local regions of increased suction under the left
blade due to the increased pressure difference.
The reader should also note in Figure 4.2 the presence of the clear circles near the
right half ofthe area where the right blade would be. As discussed in chapter 3, the clear
circles represent down wash flows, or flow that is impinging on the ground surface. In Figure
4.2, these clear circles are the result of tangential and axial components of the flow created
by the left lawn mower blade colliding with features of the interior of the deck and being
directed vertically down onto the pressure platform. The small black dots under the right
blade and leading edge show air that is being drawn towards the left blade along the surface
of the pressure platform.
Figures 4.3 and 4.4 show a comparison analogous to Figure 4.1 and 4.2 of the effect
of the deck with the right blade spinning alone. Figure 4.4 shows the effect that the presence
of the deck has on the amount of suction generated near the ground for the right blade. The
similar size black circles under the right blade for both Figure 4.3 and Figure 4.4 show that
there is little difference in suction generated by the right blade when the deck is present.
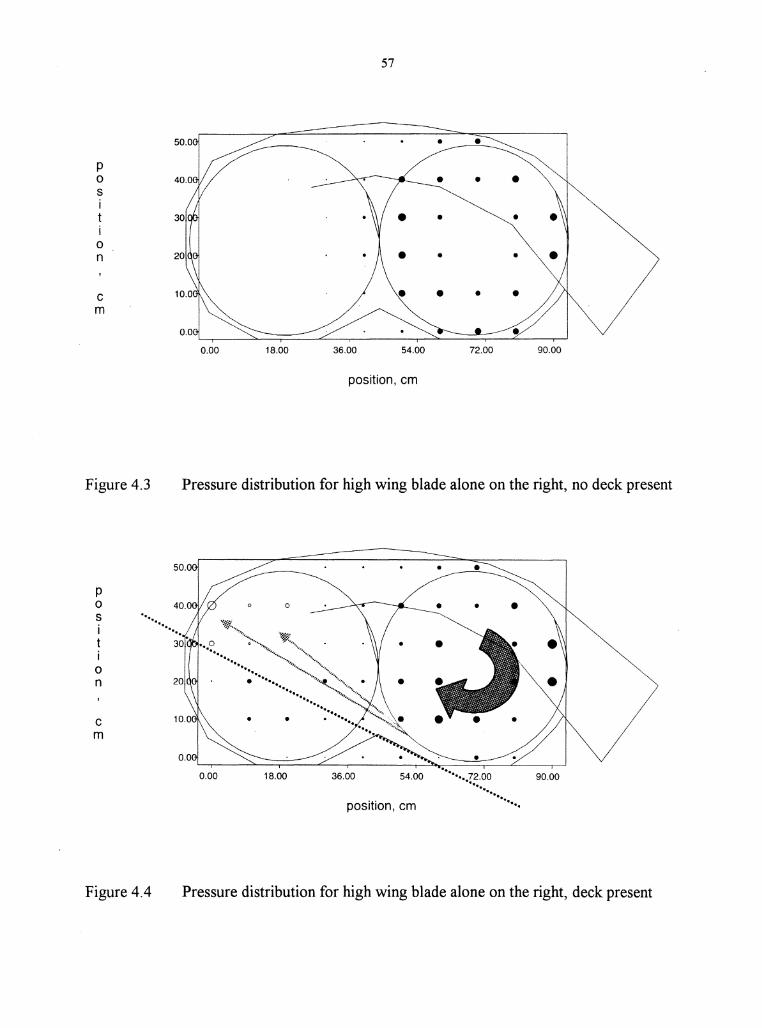
p 0 s i t i
0 n
e m
Figure 4.3
p 0 s i t i 0 n
e m
Figure 4.4
57
0.00 18.00 36.00 54.00 72.00 90.00
position, em
Pressure distribution for high wing blade alone on the right, no deck present
position, em
Pressure distribution for high wing blade alone on the right, deck present
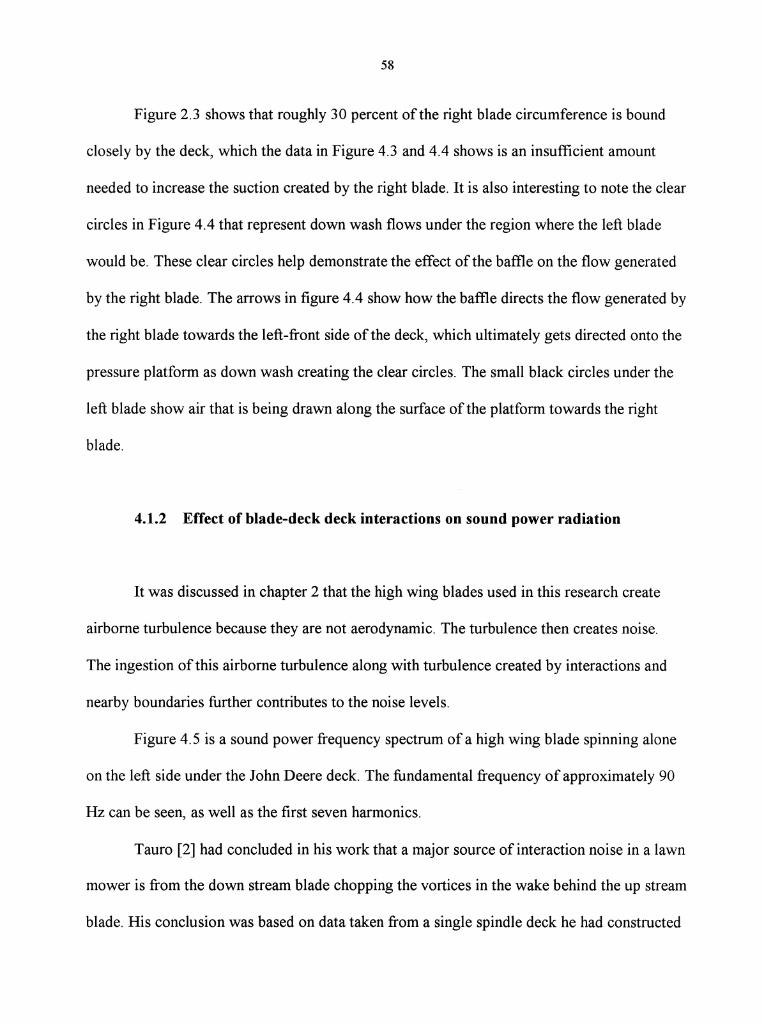
58
Figure 2.3 shows that roughly 30 percent of the right blade circumference is bound
closely by the deck, which the data in Figure 4.3 and 4.4 shows is an insufficient amount
needed to increase the suction created by the right blade. It is also interesting to note the clear
circles in Figure 4.4 that represent down wash flows under the region where the left blade
would be. These clear circles help demonstrate the effect of the baffie on the flow generated
by the right blade. The arrows in figure 4.4 show how the baffie directs the flow generated by
the right blade towards the left-front side of the deck, which ultimately gets directed onto the
pressure platform as down wash creating the clear circles. The small black circles under the
left blade show air that is being drawn along the surface of the platform towards the right
blade.
4.1.2 Effect of blade-deck deck interactions on sound power radiation
It was discussed in chapter 2 that the high wing blades used in this research create
airborne turbulence because they are not aerodynamic. The turbulence then creates noise.
The ingestion of this airborne turbulence along with turbulence created by interactions and
nearby boundaries further contributes to the noise levels.
Figure 4.5 is a sound power frequency spectrum of a high wing blade spinning alone
on the left side under the John Deere deck. The fundamental frequency of approximately 90
Hz can be seen, as well as the first seven harmonics.
Tauro [2] had concluded in his work that a major source of interaction noise in a lawn
mower is from the down stream blade chopping the vortices in the wake behind the up stream
blade. His conclusion was based on data taken from a single spindle deck he had constructed
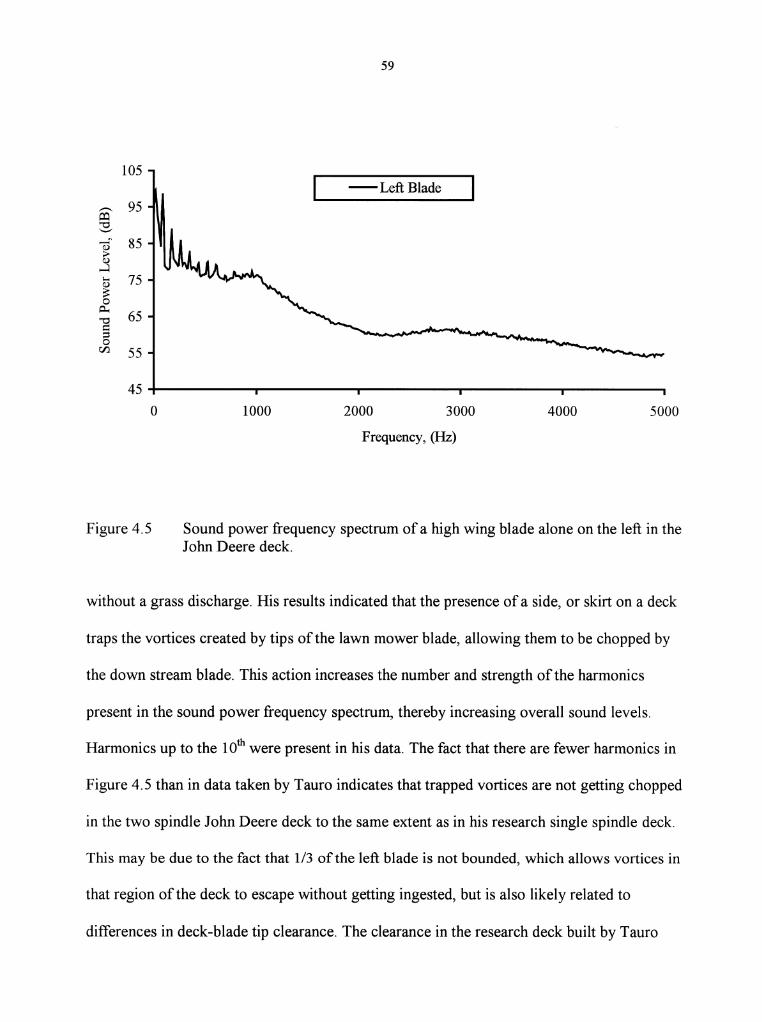
59
105 --Left Blade
~ 95 ~ "0 --- 85 ~
......:l 1-< 75 11)
~ 0
A-. 65 1 VJ 55
45 0 1000 2000 3000 4000 5000
Frequency, (Hz)
Figure 4.5 Sound power frequency spectrum of a high wing blade alone on the left in the John Deere deck.
without a grass discharge. His results indicated that the presence of a side, or skirt on a deck
traps the vortices created by tips of the lawn mower blade, allowing them to be chopped by
the down stream blade. This action increases the number and strength of the harmonics
present in the sound power frequency spectrum, thereby increasing overall sound levels.
Harmonics up to the 1Oth were present in his data. The fact that there are fewer harmonics in
Figure 4.5 than in data taken by Tauro indicates that trapped vortices are not getting chopped
in the two spindle John Deere deck to the same extent as in his research single spindle deck.
This may be due to the fact that 1/3 ofthe left blade is not bounded, which allows vortices in
that region of the deck to escape without getting ingested, but is also likely related to
differences in deck-blade tip clearance. The clearance in the research deck built by Tauro
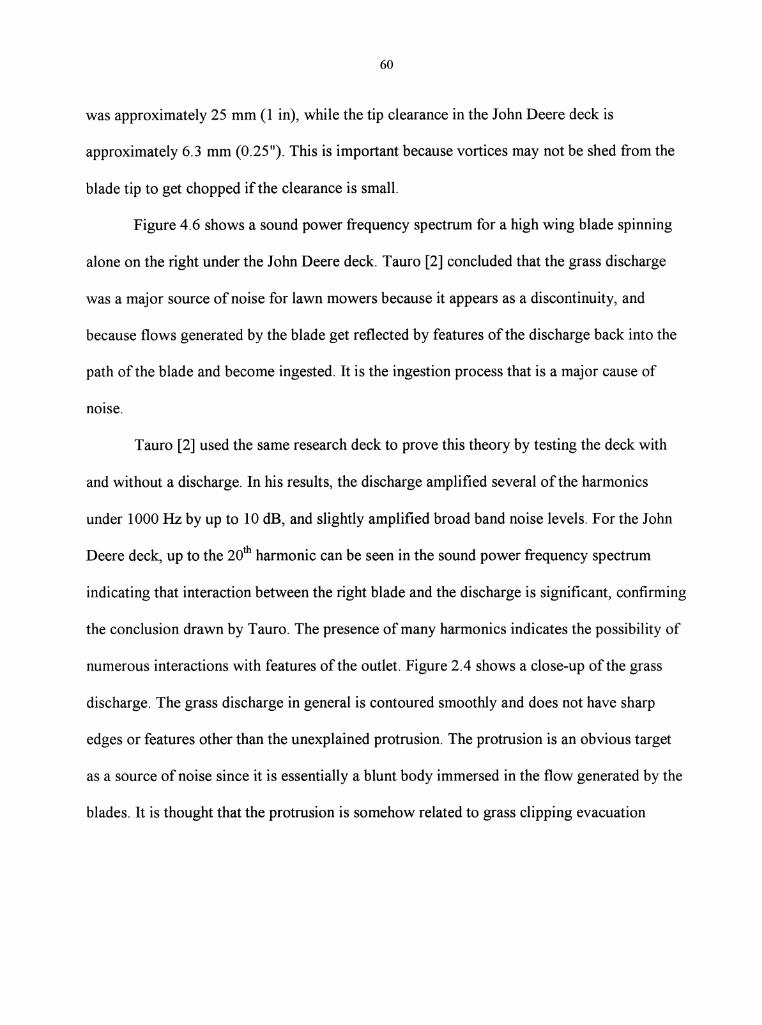
60
was approximately 25 mm (1 in), while the tip clearance in the John Deere deck is
approximately 6.3 mm (0.25"). This is important because vortices may not be shed from the
blade tip to get chopped if the clearance is small.
Figure 4.6 shows a sound power frequency spectrum for a high wing blade spinning
alone on the right under the John Deere deck. Tauro [2] concluded that the grass discharge
was a major source of noise for lawn mowers because it appears as a discontinuity, and
because flows generated by the blade get reflected by features of the discharge back into the
path of the blade and become ingested. It is the ingestion process that is a major cause of
nmse.
Tauro [2] used the same research deck to prove this theory by testing the deck with
and without a discharge. In his results, the discharge amplified several of the harmonics
under 1000Hz by up to 10 dB, and slightly amplified broad band noise levels. For the John
Deere deck, up to the 20th harmonic can be seen in the sound power frequency spectrum
indicating that interaction between the right blade and the discharge is significant, confirming
the conclusion drawn by Tauro. The presence of many harmonics indicates the possibility of
numerous interactions with features of the outlet. Figure 2.4 shows a close-up of the grass
discharge. The grass discharge in general is contoured smoothly and does not have sharp
edges or features other than the unexplained protrusion. The protrusion is an obvious target
as a source of noise since it is essentially a blunt body immersed in the flow generated by the
blades. It is thought that the protrusion is somehow related to grass clipping evacuation
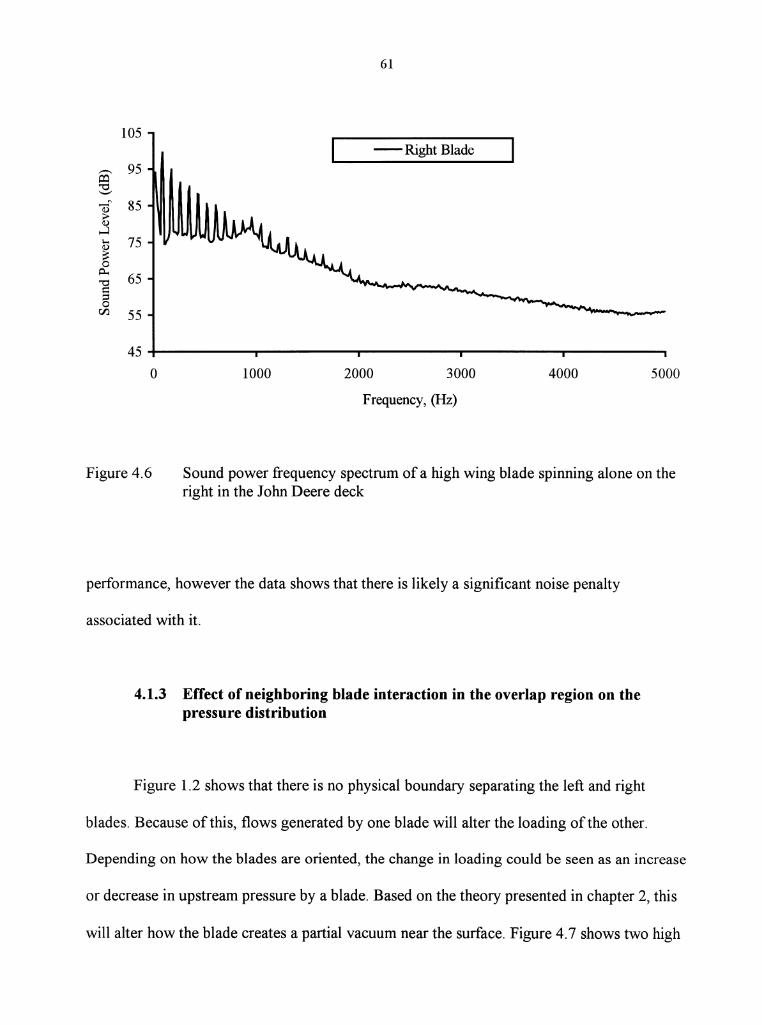
61
105 -Right Blade
~ 95 ~ "0 '-"
af 85 ;:;.. 11)
.....:l 1-< 75 11) ::: 0 p..
65 1 VJ 55
45 0 1000 2000 3000 4000 5000
Frequency, (Hz)
Figure 4.6 Sound power frequency spectrum of a high wing blade spinning alone on the right in the John Deere deck
performance, however the data shows that there is likely a significant noise penalty
associated with it.
4.1.3 Effect of neighboring blade interaction in the overlap region on the pressure distribution
Figure 1.2 shows that there is no physical boundary separating the left and right
blades. Because of this, flows generated by one blade will alter the loading of the other.
Depending on how the blades are oriented, the change in loading could be seen as an increase
or decrease in upstream pressure by a blade. Based on the theory presented in chapter 2, this
will alter how the blade creates a partial vacuum near the surface. Figure 4.7 shows two high
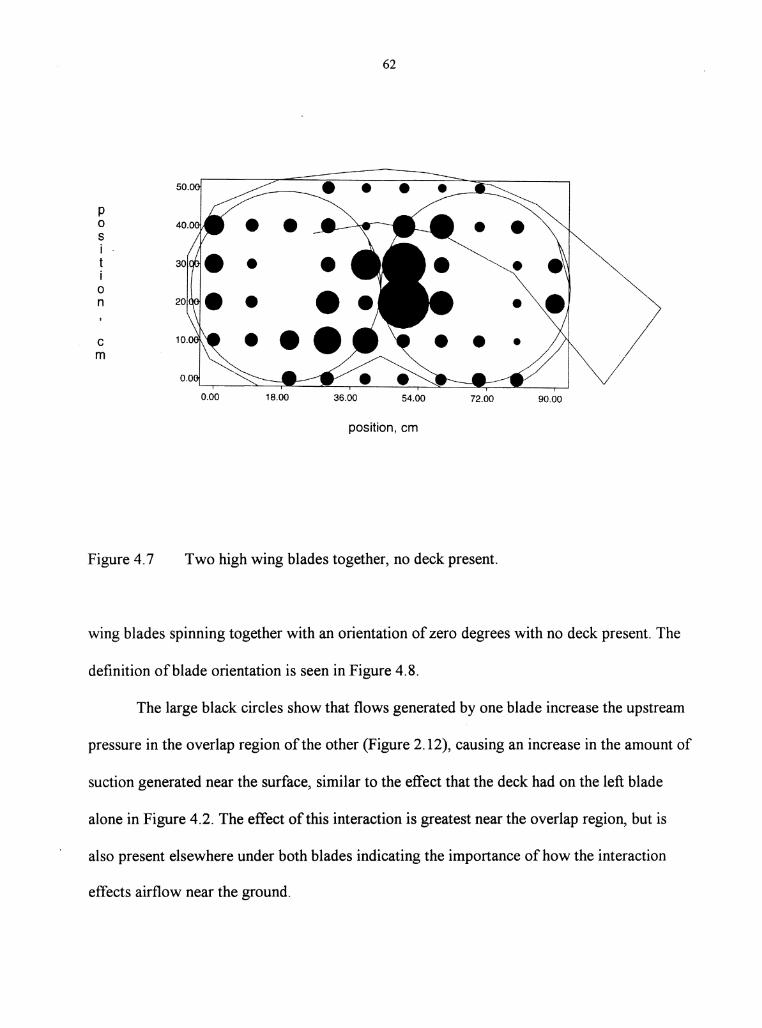
62
• • p 0 • • • • s
• i • • 0 n • • c • • • • m
0.00 18.00 36.00 54.00 72.00 90.00
position, em
Figure 4.7 Two high wing blades together, no deck present.
wing blades spinning together with an orientation of zero degrees with no deck present. The
definition of blade orientation is seen in Figure 4.8.
The large black circles show that flows generated by one blade increase the upstream
pressure in the overlap region ofthe other (Figure 2.12), causing an increase in the amount of
suction generated near the surface, similar to the effect that the deck had on the left blade
alone in Figure 4.2. The effect of this interaction is greatest near the overlap region, but is
also present elsewhere under both blades indicating the importance of how the interaction
effects airflow near the ground.
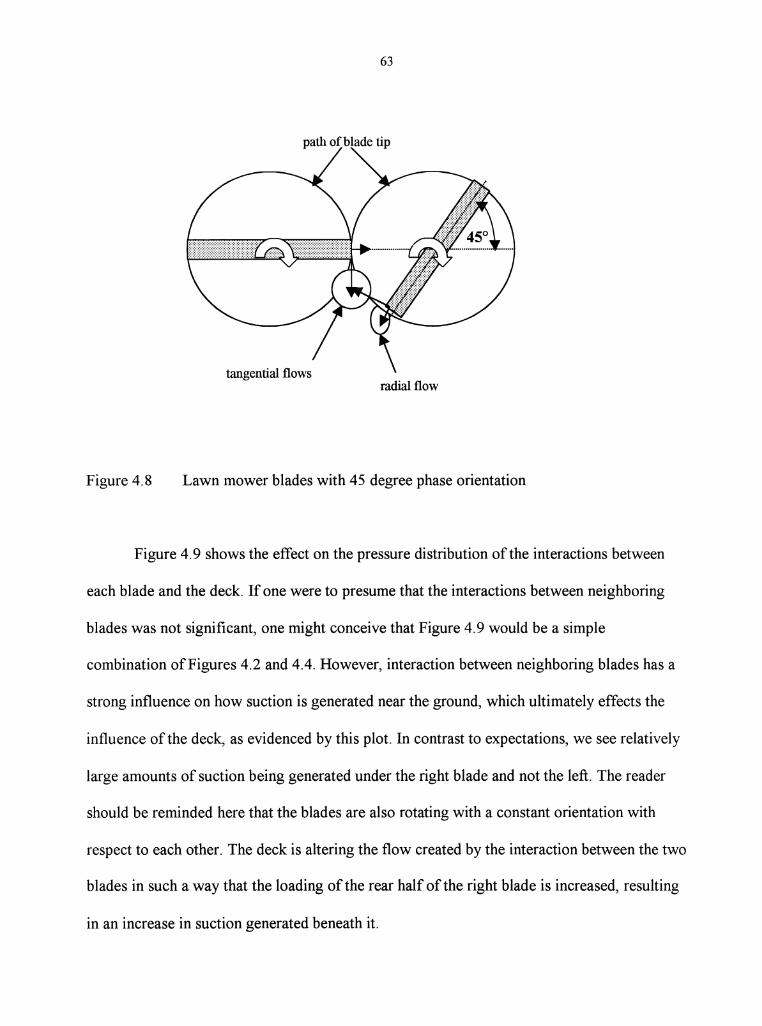
63
tangential flows radial flow
Figure 4.8 Lawn mower blades with 45 degree phase orientation
Figure 4.9 shows the effect on the pressure distribution of the interactions between
each blade and the deck. If one were to presume that the interactions between neighboring
blades was not significant, one might conceive that Figure 4.9 would be a simple
combination ofFigures 4.2 and 4.4. However, interaction between neighboring blades has a
strong influence on how suction is generated near the ground, which ultimately effects the
influence of the deck, as evidenced by this plot. In contrast to expectations, we see relatively
large amounts of suction being generated under the right blade and not the left. The reader
should be reminded here that the blades are also rotating with a constant orientation with
respect to each other. The deck is altering the flow created by the interaction between the two
blades in such a way that the loading of the rear half of the right blade is increased, resulting
in an increase in suction generated beneath it.
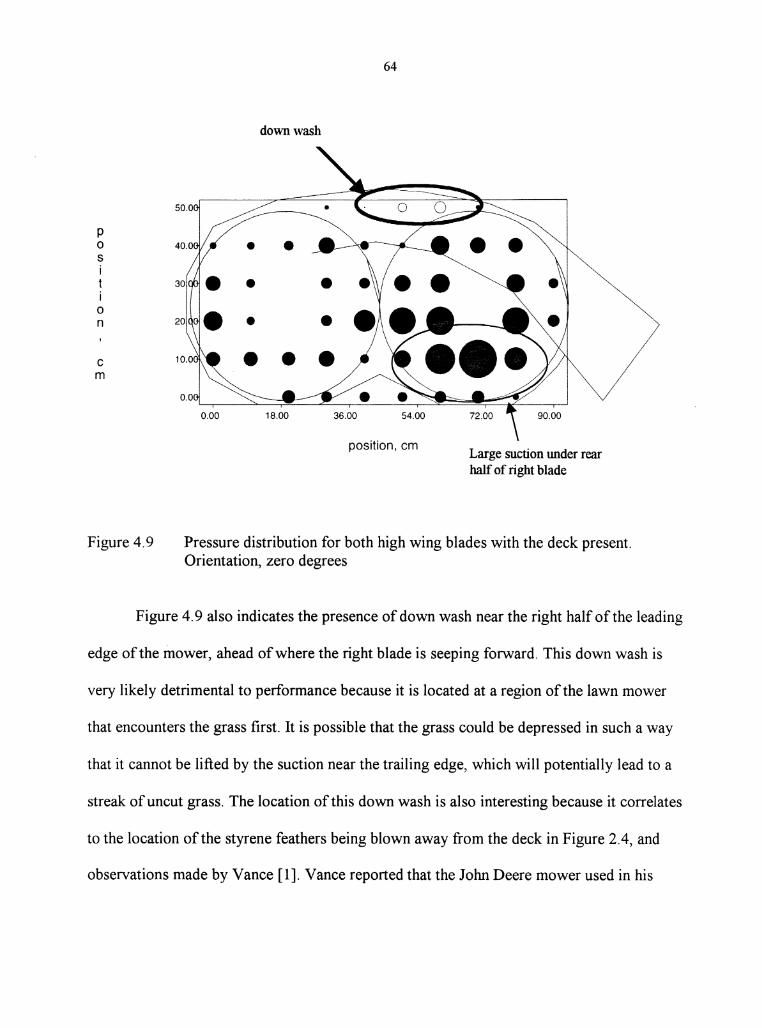
p 0 s i t i
0 n
c m
Figure 4.9
• • • •
down wash
• • •
• •
64
position, em Large suction under rear half of right blade
Pressure distribution for both high wing blades with the deck present. Orientation, zero degrees
Figure 4.9 also indicates the presence of down wash near the right half of the leading
edge of the mower, ahead of where the right blade is seeping forward. This down wash is
very likely detrimental to performance because it is located at a region of the lawn mower
that encounters the grass first. It is possible that the grass could be depressed in such a way
that it cannot be lifted by the suction near the trailing edge, which will potentially lead to a
streak of uncut grass. The location of this down wash is also interesting because it correlates
to the location of the styrene feathers being blown away from the deck in Figure 2.4, and
observations made by Vance [1]. Vance reported that the John Deere mower used in his
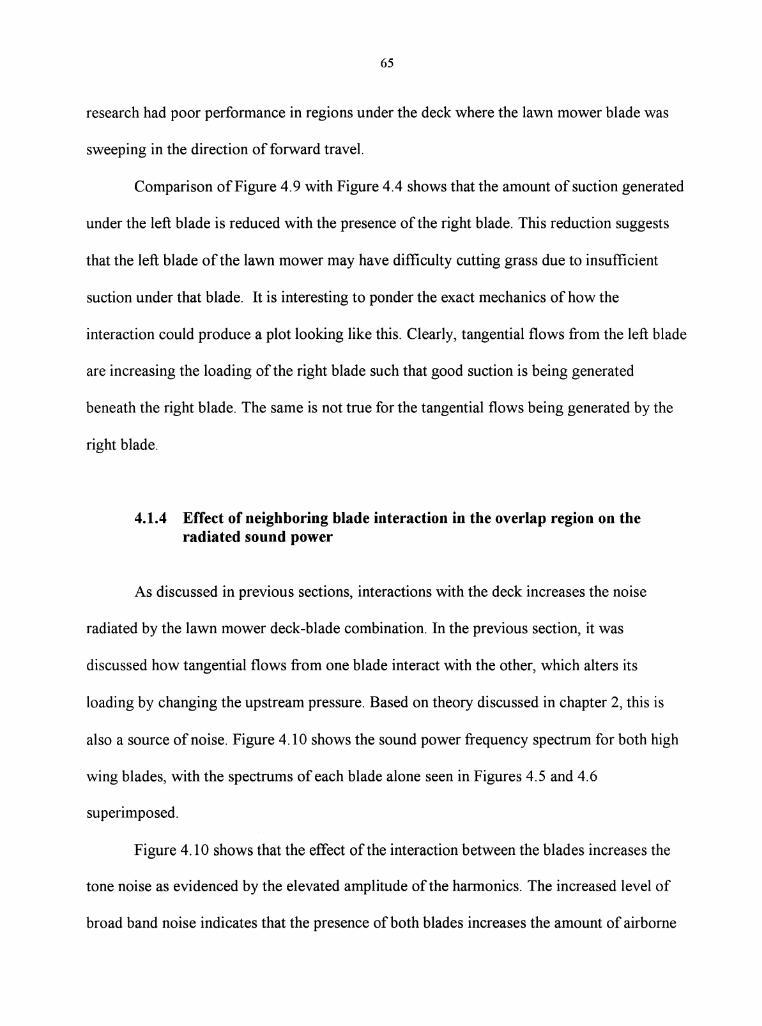
65
research had poor performance in regions under the deck where the lawn mower blade was
sweeping in the direction of forward travel.
Comparison of Figure 4.9 with Figure 4.4 shows that the amount of suction generated
under the left blade is reduced with the presence of the right blade. This reduction suggests
that the left blade of the lawn mower may have difficulty cutting grass due to insufficient
suction under that blade. It is interesting to ponder the exact mechanics of how the
interaction could produce a plot looking like this. Clearly, tangential flows from the left blade
are increasing the loading of the right blade such that good suction is being generated
beneath the right blade. The same is not true for the tangential flows being generated by the
right blade.
4.1.4 Effect of neighboring blade interaction in the overlap region on the radiated sound power
As discussed in previous sections, interactions with the deck increases the noise
radiated by the lawn mower deck-blade combination. In the previous section, it was
discussed how tangential flows from one blade interact with the other, which alters its
loading by changing the upstream pressure. Based on theory discussed in chapter 2, this is
also a source of noise. Figure 4.10 shows the sound power frequency spectrum for both high
wing blades, with the spectrums of each blade alone seen in Figures 4.5 and 4.6
superimposed.
Figure 4.10 shows that the effect of the interaction between the blades increases the
tone noise as evidenced by the elevated amplitude of the harmonics. The increased level of
broad band noise indicates that the presence of both blades increases the amount of airborne
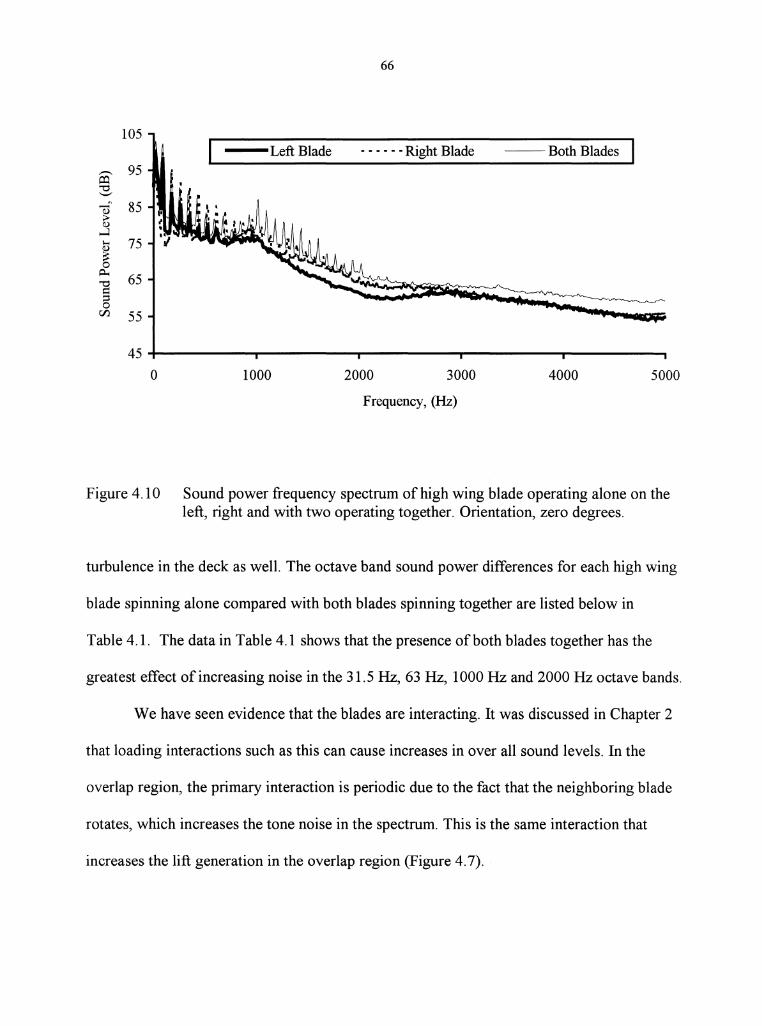
66
105 Left Blade - - - - - -Right Blade --Both Blades - 95
o:l "0 '-' ,....;' 85 <1) ;;;.
<1)
.....l ..... 75 <1)
:::: 0
A-. 65 ] g
VJ 55
45 0 1000 2000 3000 4000 5000
Frequency, (Hz)
Figure 4.10 Sound power frequency spectrum of high wing blade operating alone on the left, right and with two operating together. Orientation, zero degrees.
turbulence in the deck as well. The octave band sound power differences for each high wing
blade spinning alone compared with both blades spinning together are listed below in
Table 4.1. The data in Table 4.1 shows that the presence of both blades together has the
greatest effect of increasing noise in the 31.5 Hz, 63 Hz, 1000 Hz and 2000 Hz octave bands.
We have seen evidence that the blades are interacting. It was discussed in Chapter 2
that loading interactions such as this can cause increases in over all sound levels. In the
overlap region, the primary interaction is periodic due to the fact that the neighboring blade
rotates, which increases the tone noise in the spectrum. This is the same interaction that
increases the lift generation in the overlap region (Figure 4.7).
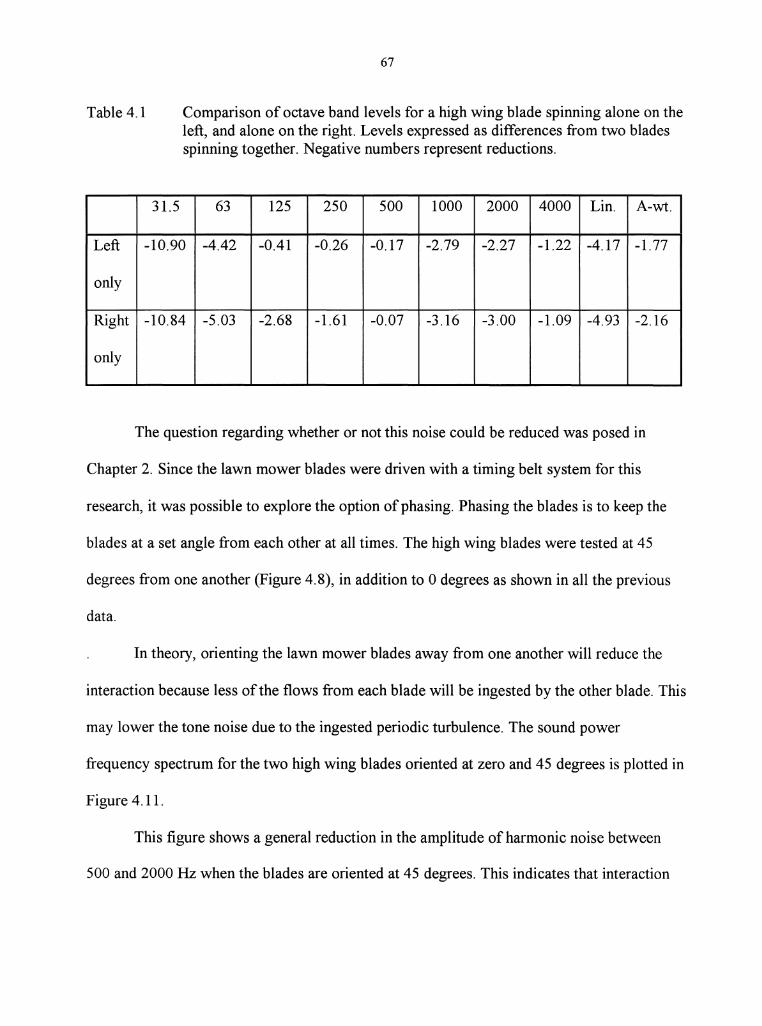
67
Table 4.1 Comparison of octave band levels for a high wing blade spinning alone on the left, and alone on the right. Levels expressed as differences from two blades spinning together. Negative numbers represent reductions.
31.5 63 125 250 500 1000 2000 4000 Lin. A-wt.
Left -10.90 -4.42 -0.41 -0.26 -0.17 -2.79 -2.27 -1.22 -4.17 -1.77
only
Right -10.84 -5.03 -2.68 -1.61 -0.07 -3.16 -3.00 -1.09 -4.93 -2.16
only
The question regarding whether or not this noise could be reduced was posed in
Chapter 2. Since the lawn mower blades were driven with a timing belt system for this
research, it was possible to explore the option of phasing. Phasing the blades is to keep the
blades at a set angle from each other at all times. The high wing blades were tested at 45
degrees from one another (Figure 4.8), in addition to 0 degrees as shown in all the previous
data.
In theory, orienting the lawn mower blades away from one another will reduce the
interaction because less of the flows from each blade will be ingested by the other blade. This
may lower the tone noise due to the ingested periodic turbulence. The sound power
frequency spectrum for the two high wing blades oriented at zero and 45 degrees is plotted in
Figure 4.11.
This figure shows a general reduction in the amplitude of harmonic noise between
500 and 2000Hz when the blades are oriented at 45 degrees. This indicates that interaction
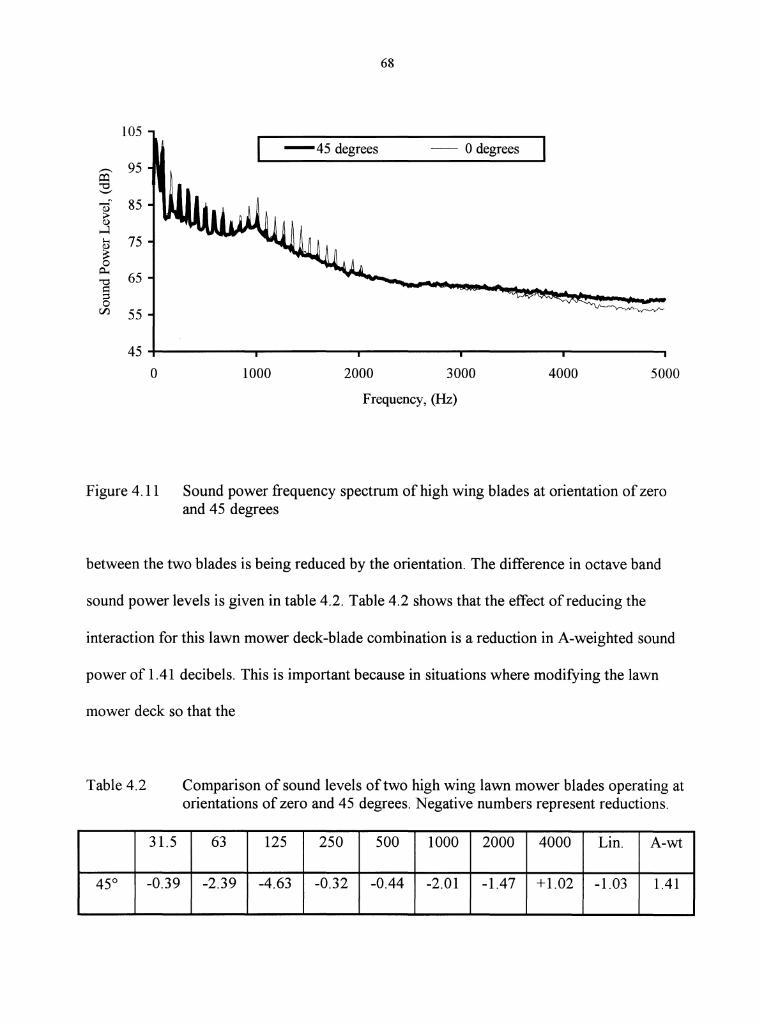
68
105 -45 degrees -- 0 degrees
---- 95 a:l "0 '-'
]n 85
......:l 1-< 75 (!)
~ 0
0.. 65 1 rJ:J 55
45 0 1000 2000 3000 4000 5000
Frequency, (Hz)
Figure 4.11 Sound power frequency spectrum ofhigh wing blades at orientation ofzero and 45 degrees
between the two blades is being reduced by the orientation. The difference in octave band
sound power levels is given in table 4.2. Table 4.2 shows that the effect of reducing the
interaction for this lawn mower deck-blade combination is a reduction in A-weighted sound
power of 1.41 decibels. This is important because in situations where modifying the lawn
mower deck so that the
Table 4.2
31.5
45° -0.39
Comparison of sound levels of two high wing lawn mower blades operating at orientations of zero and 45 degrees. Negative numbers represent reductions.
63 125 250 500 1000 2000 4000 Lin. A-wt
-2.39 -4.63 -0.32 -0.44 -2.01 -1.47 +1.02 -1.03 1.41

69
lawn mower blades are not interacting is not practical or undesirable, noise levels can be
reduced by ensuring a fixed orientation between the blades.
An important consequence of reducing the interaction between the neighboring blades
is the impact this will have on performance. By reducing the interaction, the instantaneous
loading of the neighboring blade in the overlap region is also reduced, which may also have
an effect on how suction is generated near the ground. The magnitude of the black circles in
Figure 4.7 demonstrates how strong the relationship is between suction near the ground and
interaction with the neighboring blade. Figure 4.12 shows the pressure distribution for the
high wing blades with an orientation 45 degrees.
Comparison of Figure 4.12 with Figure 4.9 shows that phasing the high wing blades
at 45 degrees has little effect on the pressure distribution. The magnitude ofboth the black
circles representing suction and the clear circles representing down wash are not significantly
changed. There is a slight reduction on the amount of suction generated near the overlap
region by the left blade, which may imply a reduction in performance, but in general the data
does not imply that performance would be dramatically effected.
4.2 Effect of manufacturing variability on the sound power radiation
An important concern among manufacturers is the repeatability of the manufacturing
process. Lawn mower blades are hot-formed, which is a process where a flat piece of steel is
heated, stamped in a die ofthe final shape while hot, and then quenched. This process has

70
0 p 0 s i t i 0 n
c m
0.00 18.00 36.00 54.00 72.00 90.00
position, em
Figure 4.12 Pressure distribution for the high wing blades. Orientation, 45 degrees.
variability associated with it that will result in some blades having slightly different
geometries. Because the airflow generated by a blade is sensitive to the different bends and
angles associated with the surface of the wing, it is possible that performance and sound
power radiation could be a function of manufacturing quality. This may be especially
important in the case of sound power because of the nature of the certification process that is
being created by the European Union.
Throughout this research, two individual high wing blades were used as a reference,
or control group. Other nominally similar high wing blades were made available to us after
the pressure distribution phase ofthe research, some ofwhich had noticeable geometrical
variations. In visual comparison to the high wing control blades, it appeared that the bend
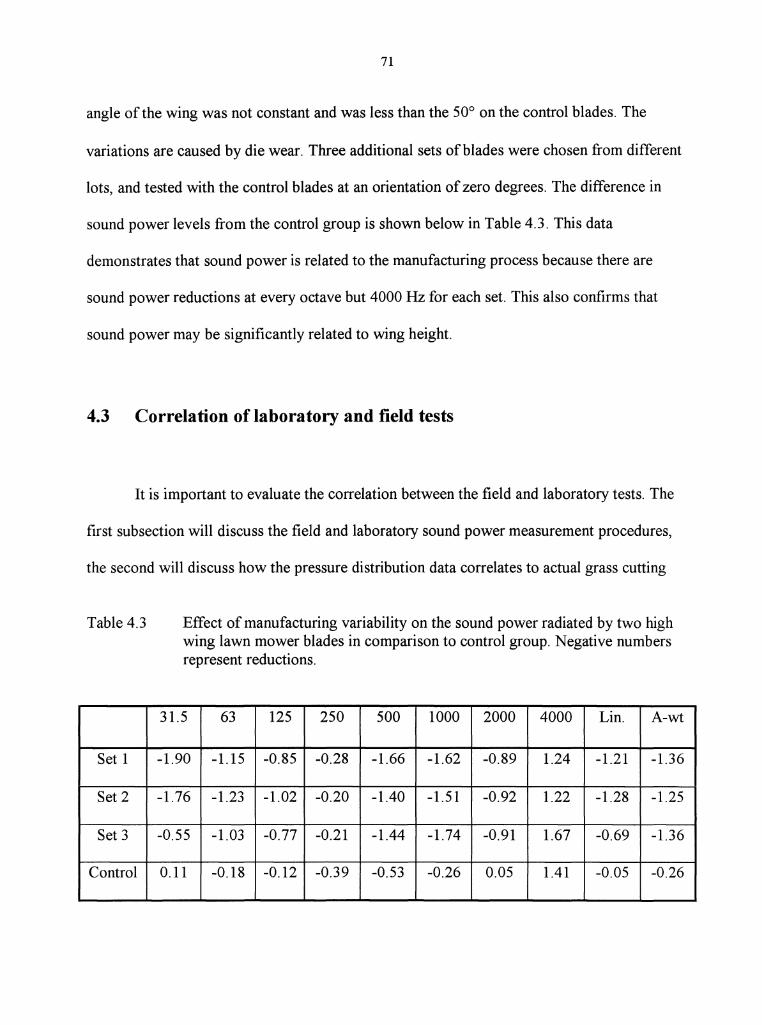
71
angle of the wing was not constant and was less than the 50° on the control blades. The
variations are caused by die wear. Three additional sets ofblades were chosen from different
lots, and tested with the control blades at an orientation of zero degrees. The difference in
sound power levels from the control group is shown below in Table 4.3. This data
demonstrates that sound power is related to the manufacturing process because there are
sound power reductions at every octave but 4000 Hz for each set. This also confirms that
sound power may be significantly related to wing height.
4.3 Correlation of laboratory and field tests
It is important to evaluate the correlation between the field and laboratory tests. The
first subsection will discuss the field and laboratory sound power measurement procedures,
the second will discuss how the pressure distribution data correlates to actual grass cutting
Table 4.3
Set 1
Set 2
Set 3
Control
Effect of manufacturing variability on the sound power radiated by two high wing lawn mower blades in comparison to control group. Negative numbers represent reductions.
31.5 63 125 250 500 1000 2000 4000 Lin. A-wt
-1.90 -1.15 -0.85 -0.28 -1.66 -1.62 -0.89 1.24 -1.21 -1.36
-1.76 -1.23 -1.02 -0.20 -1.40 -1.51 -0.92 1.22 -1.28 -1.25
-0.55 -1.03 -0.77 -0.21 -1.44 -1.74 -0.91 1.67 -0.69 -1.36
0.11 -0.18 -0.12 -0.39 -0.53 -0.26 0.05 1.41 -0.05 -0.26

72
tests, and the third will discuss how the pressure distribution data compares to the static
cutting tests.
4.3.1 Sound power
As described in Chapter 3, an ANSI 4 microphone survey method was used to
measure sound power in the field. This method is meant to approximate more accurate
methods when they are not feasible. Establishing a correlation with the laboratory sound
power measurements allows the flexibility of quickly testing new ideas or concepts outdoors
and being able to make accurate assessments of how the results would compare to the same
measurement in an ideal test environment.
An example of the correlation between the two sound power methods was
demonstrated in this research. Lawn mowers are complex pieces of machinery with many
sources of noise including the engine, exhaust, transmission, blade drive system (PTO), and
the lawn mower blades themselves. Literature cited by Tauro [2] in his thesis reported that
removal of the blades reduced noise levels from as little as 3 dB to as much as 1 OdB. Sound
power measurements were taken with various components of the John Deere mower in
operation in order to establish the relative contributions from each component. Table 4.4 lists
the data taken with each method.
This data shows that removing the blades reduces noise levels by 9.14 dB A in
comparison to the configuration with the engine and power take off (PTO) running, which
agrees with data reported by Tauro[2]. This also indicates that the blades are a major source
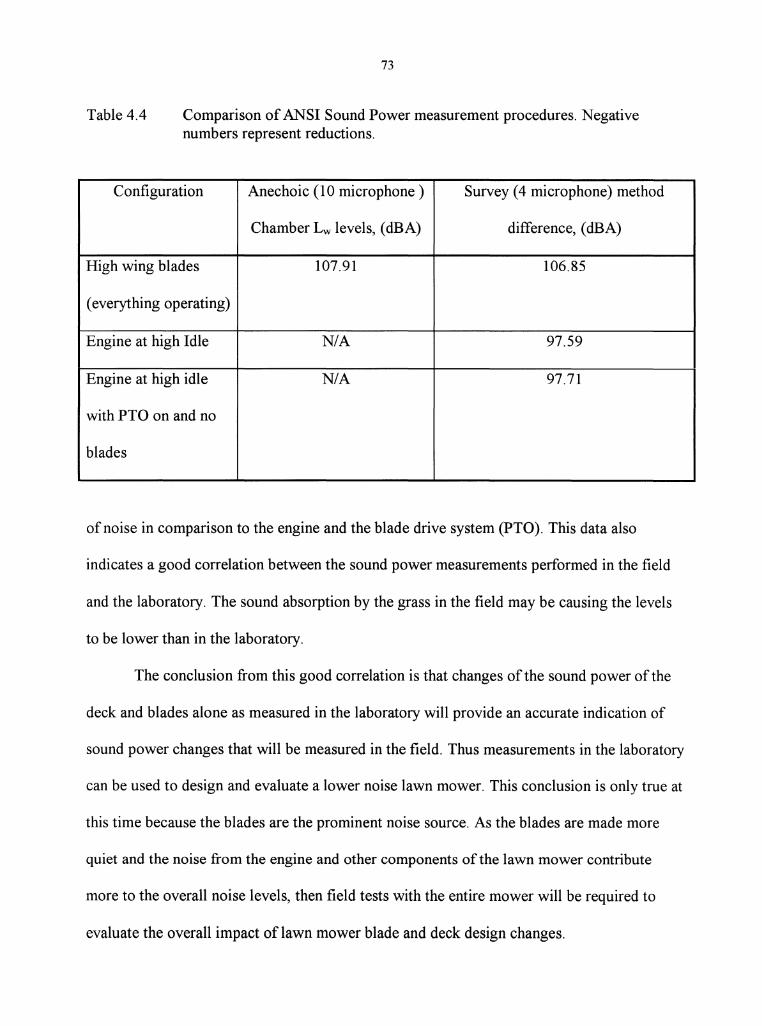
73
Table 4.4 Comparison of ANSI Sound Power measurement procedures. Negative numbers represent reductions.
Configuration Anechoic (10 microphone) Survey ( 4 microphone) method
Chamber Lw levels, (dB A) difference, (dB A)
High wing blades 107.91 106.85
(everything operating)
Engine at high Idle N/A 97.59
Engine at high idle N/A 97.71
with PTO on and no
blades
of noise in comparison to the engine and the blade drive system (PTO). This data also
indicates a good correlation between the sound power measurements performed in the field
and the laboratory. The sound absorption by the grass in the field may be causing the levels
to be lower than in the laboratory.
The conclusion from this good correlation is that changes of the sound power of the
deck and blades alone as measured in the laboratory will provide an accurate indication of
sound power changes that will be measured in the field. Thus measurements in the laboratory
can be used to design and evaluate a lower noise lawn mower. This conclusion is only true at
this time because the blades are the prominent noise source. As the blades are made more
quiet and the noise from the engine and other components of the lawn mower contribute
more to the overall noise levels, then field tests with the entire mower will be required to
evaluate the overall impact of lawn mower blade and deck design changes.

74
4.3.2 Performance
It was also desired to establish a correlation between field cutting tests and the
pressure distribution experiment developed for this research. Having a repeatable test that
correlates to actual performance will dramatically reduce the design and modification time
for lawn mower deck and blade systems because the number of iterations based on
insufficiently accurate data can be reduced, and testing is no longer dependent on the season
or weather.
Based on the pressure distribution data we were expecting to generally see poor
cutting under the left blade due to the lack of vacuum being generated (Figure 4.9). The data
suggested that we would get better cutting under the right blade because of the presence of
the large black circles, which indicates that a strong vacuum is being generated. While we
hypothesized that the down wash flow as indicated by the clear circles has a detrimental
effect on performance, it was thought that even if grass was being depressed that it may still
be picked up by the strong vacuum present behind the down wash.
Three rounds of jury tests were completed, each with far differing grass conditions.
The first round was conducted early in the summer with rather arid/dry grass that was
primarily dormant, and had a maximum height of 10 em (4in). The second round of tests was
conducted under the opposite extreme, the grass was full and lush with an average height of
18 em (7 in), with some as tall as 25 em (lOin). The third round was conducted with a grass
height between 15 and 18 em, which is generally the normal operating condition for this
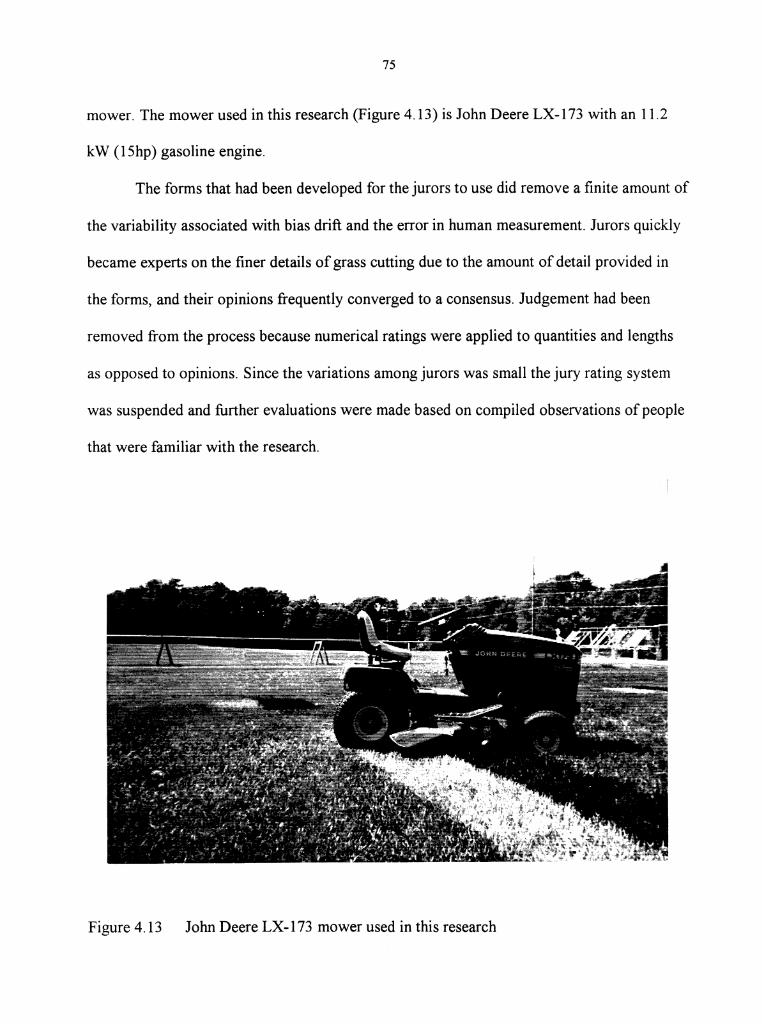
75
mower. The mower used in this research (Figure 4.13) is John Deere LX-173 with an 11.2
kW (15hp) gasoline engine.
The forms that had been developed for the jurors to use did remove a finite amount of
the variability associated with bias drift and the error in human measurement. Jurors quickly
became experts on the finer details of grass cutting due to the amount of detail provided in
the forms, and their opinions frequently converged to a consensus. Judgement had been
removed from the process because numerical ratings were applied to quantities and lengths
as opposed to opinions. Since the variations among jurors was small the jury rating system
was suspended and further evaluations were made based on compiled observations of people
that were familiar with the research.
Figure 4.13 John Deere LX-173 mower used in this research
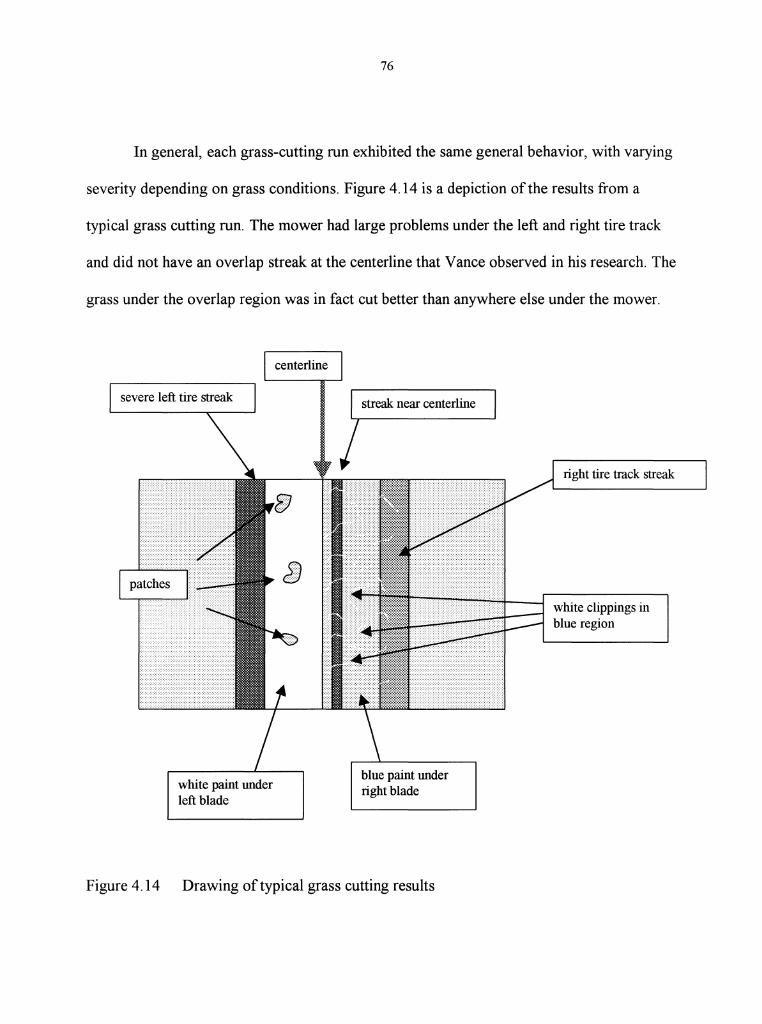
76
In general, each grass-cutting run exhibited the same general behavior, with varying
severity depending on grass conditions. Figure 4.14 is a depiction of the results from a
typical grass cutting run. The mower had large problems under the left and right tire track
and did not have an overlap streak at the centerline that Vance observed in his research. The
grass under the overlap region was in fact cut better than anywhere else under the mower.
white paint under left blade
centerline
Figure 4.14 Drawing of typical grass cutting results
right tire track streak
white clippings in blue region
77
The grass under the left blade was cut inconsistently outside of the tire track region,
with patches, or random groups of grass that were not cut well. A rather severe streak
roughly 7 em wide on average was located about 7 em on the discharge side of the centerline,
the location of the down wash seen in Figure 4.9. The grass under the right tire was generally
cut better than under the left, but was still poor on occasions. The mower had clipping
evacuation issues as well. There was always some incidence of white clippings deposited in
the blue paint signifying that there are local regions of insufficient flow, or flow in the wrong
direction under the deck. It is quite possible that the white clippings from the left blade were
becoming entrained in the same down wash that was causing the streak and being deposited
under the right blade
Having reviewed pressure distribution data and seen how grass was actually cut, the
first conclusion drawn was that the down wash as seen in Figure 4.9 is very detrimental to
performance. This conclusion is made because the area of down wash seen in Figure 4.9
corresponds to the location of the streak. It was also noticed that there was insufficient lift
being generated to cut the grass that had been depressed by the front tires. The presence of
the patches was also interesting because they appeared in a very random, non-repeatable
fashion. It is hypothesized that this may be a function of changing topography of the ground
as discussed in chapter 2. Although never verified, it is quite possible that the patches could
be occurring on ground that appears as a depression, or a recessed area. In these regions, it is
possible that lift could be reduced because of the increased distance from the blades and the
ground.
As mentioned earlier, the grass in the overlap region was cut better than anywhere
else. This is consistent with the large amounts of suction shown in the overlap region of
78
Figure 4.9. The large suction here is related to the blade interaction discussed earlier in this
chapter and in chapter 2.
Figure 4.9 also depicts that a similar amount of suction is being generated near the
back half of the right blade, which is apparently insufficient to account for the effects of the
down wash. Because of this it was decided to perform a mowing test in reverse. This
effectively turns what was the trailing edge into the leading edge, thereby exposing uncut
grass to suction first instead of down wash. The result the first time was the closest example
of a perfect cut that has been seen. There was no visible evidence of a streak near the
centerline, and the tire track streaks were reduced. The very small amount of inadequately cut
grass that did exist was mostly random in nature. When this was repeated however, the cut
was very poor, which gave us further evidence ofhow drastically performance can change
with changing grass conditions.
The lawn mower did not experience significant problems with clumping, even in the
tallest condition tested. An attempt was made to induce clumping by watering the grass for 5
minutes before cutting. It was hoped that this would cause clippings to adhere to the interior
of the deck until they became too heavy, and then fall back into the blade path, bogging
down the mower. The result was far different than expected. Some loose clumps did form,
but by far the most interesting result was that the cut had slightly improved. Grass was cut
more uniformly, and the severity of the streak had lessened. This could have resulted from
the moisture making the grass easier to cut, but is still unexplained.
Grass cutting was also performed at various speeds. The John Deere LX-173 has 5
forward speeds [4] ranging from 2.3 km/h (1.4 mph) to 8.4 km/h (5.2 mph) and one reverse
speed of3.8 km/h (2.3 mph). Hassinen [5] said this type of mower is considered a residential
79
mower, and that while it is normally operated in 3rd gear (5.1 kmlh), operation at faster
speeds is common. As forward velocity increases, the mower will have less time to lift grass
at a given location. Additionally, the blades will have fewer passes per forward distance
traveled to cut the blades once they are lifted. Because of this, it is easy to presume that
performance will degrade at the higher transmission settings. Tests were conducted during
the third round (normal grass) in 2nd, 3rd, and 4th gear to evaluate the effect of forward speed.
There was no apparent benefit to be had by slowing down to 2nd gear. There was still a streak
that was occasionally wider than the streak typically observed in 3rd gear, and clipping
evacuation did not improve. The difference between 3rd and 4th gear was very noticeable.
Both the tire track streaks and streak near the centerline became much worse. There was very
little grass cut under the left blade in generaL
This data is important because it indicates that improving the quality of lift generation
is the most important step to improving performance because allowing the mower more time
to cut over a given location was not effective. The negative effects ofblade and deck-blade
interaction were still dominant.
4.3.3 Static tests
Static tests were devised due to the poor repeatability of grass cutting in motion.
Accurate assessments of how or where under the deck the mower was actually lifting grass
while in motion could not easily be made because of all of the changing variables.
The static test became a useful tool to equate pressure distribution data and lift
because of the amount of agreement between them. The grass that was under the trailing edge
80
was cut excessively to the point that it had become broomed because of the many times the
grass blades came in contact with the lawn mower blade during the static test. This indicated
that sufficient lift was being generated there as suggested by Figure 4.9. The grass was cut
similarly in the overlap region. The grass that was under the leading edge, and the front half
of the right blade had been depressed firmly enough that it did not stand up for some time
after the mower was removed. This was the result of the down wash seen along the leading
edge ofFigure 4.9. Grass under the left blade was swirled in the direction of blade rotation,
however, the tips of some of the grass blades had been cut suggesting some lift was present,
just not enough to result in an acceptable cut.

81
CHAPTER 5. SUMMARY
5.1 Conclusions of the research
An important goal of this research was to develop and build a scientific experiment
that provides information about how a specific lawn mower moves air, and from that
information to identify possible design solutions for poor performance and unacceptable
noise levels.
The theory emphasizes that deck-blade interactions and interactions between
neighboring blades greatly effect performance and sound radiation. The data presented in
chapter four confirmed that in fact for the two-spindle lawn mower, blade-blade interaction is
a source of tone noise, and also strongly influences how the lawn mower blade creates a
vacuum under the blade and draws air into the deck.
It was desired to learn more about how a lawn mower lifts grass. This is important
because lawn mower performance is unsatisfactory to many customers, and it is thought that
lift generation will help performance. Understanding how lift could be generated is also
important because traditional philosophies, such as increasing wing height or tip speed to
create more lift, are in reality not always effective, and are often detrimental.
Necessary tip speeds and wing height for optimum cut quality is a function of airflow
quality. Excessive tip speeds and wing height are commonly used to compensate for grass
that is not lifted. Because the lack of lift is typically caused by down wash, increasing the
blade wing height or tip speed only increases the down wash since the wing and tip speed

82
were creating the down wash. This results in some grass getting over-cut and some not
getting cut at all. A lawn mower that has a uniform, efficient lift generation without the
presence of down wash will require less wing height or tip speed, or less of both. This will
result in lower noise levels and reduced power requirement. The test procedure developed in
this research can enable one to make design modifications to the deck and or blades based on
the data, and improve the blade-deck geometry such that efficiency is increased and down
wash is reduced.
As confirmed by Vance [1] and Tauro [2] it is concluded that for optimum
performance, a deck and lawn mower should be designed together. Since the interactions of
the blades and the blades with the deck have been proven to play a large role in performance
and noise, the blade and deck designs must focus on reducing the negative effects of
interactions and increasing the positive effects of interactions. There is however, still work to
be done to better understand and quantify the interactions.
5.2 Recommendations of future work
The pressure distribution system used in this research is two-dimensional, which
leads to the extrapolation of two-dimensional ideas into three dimensions. There is a certain
amount of error associated with the extrapolation that can be overcome with cutting
experience. Therefore it is recommended to develop measurements ofthe vertical component
of the airflow and to measure at more surfaces than the ground. An ultimate goal would be to
measure the airflow at every possible location under the deck. Using other three-dimensional

83
measurement systems will therefore have some scientific interest. However implementing
such a system will require a significant investment of time and money.
Since the flow under the lawn mower is unsteady over large regions, measuring the
pressure in real time would help immensely as an evaluation tool. Currently, pressure is
averaged over a short amount of time. An averaged value that reflects suction could in fact be
unsteady enough that a grass blade is not lifted efficiently, or in a repeatable fashion which
would result in grass that is cut intermittently. Being able to see our data in real time would
identify the location of unsteady ports and the distribution of these ports would also help
identify the cause of the unsteadiness.
This test was originally designed to measure 1,300 ports under the John Deere deck,
however time limitations prevented us from overcoming the technical limitations of
measuring all1,300 ports. It was hoped that this high level of resolution would help provide
direction as well as magnitude of the air through the presence of isobars, or lines of constant
pressure. For example, this information could indicate the presence of vortex filaments,
which are believed to exist under the leading edge skirt. It is recommended that a system be
acquired to measure a large number of taps. Systems are commercially available, but at a
large cost.

84
REFERENCES
[1] Vance, J., "Design of a Three Spindle Mulching Lawn Mower," Masters Thesis, The
University ofWisconsin-Madison, 1996
[2] Tauro, D. J., "Influence of Specified parameters on the Noise Radiated by
Lawnmower Blades," Masters Thesis, Iowa State University, 1996
[3] Metzger, B., F., "A Review ofPropeller Noise Prediction Methodology 1919-1994,"
Metzger Technology Services, Simsbury, CT, 1995
[ 4] Operator's Manual, LX172, LX173, LX176, LX178, and LX188 Lawn Tractors. John
Deere Horicon Works, Horicon, Wisconsin, 1996
[5] Hassinen John, Lund International. Personal Correspondence, 1997
[ 6] Miller, C. J., "Optimally Designed Propellers Constrained by Noise," Doctoral
Dissertation, Purdue University, 1985

85
APPENDIX
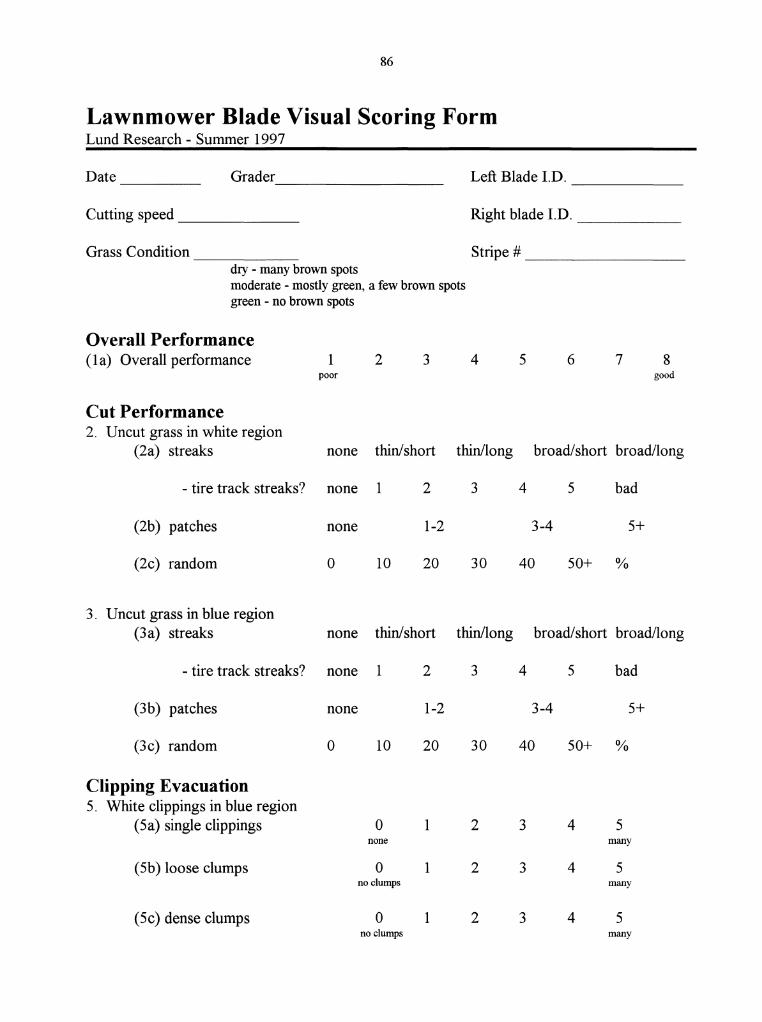
86
Lawnmower Blade Visual Scoring Form Lund Research - Summer 1997
Date Grader Left Blade I.D.
Cutting speed Right blade I.D.
Grass Condition Stripe# dry - many brown spots moderate - mostly green, a few brown spots green - no brown spots
Overall Performance ( 1 a) Overall performance 1 2 3 4 5 6 7 8
poor good
Cut Performance 2. Uncut grass in white region
(2a) streaks none thin/short thin/long broad/short broad/long
- tire track streaks? none 1 2 3 4 5 bad
(2b) patches none 1-2 3-4 5+
(2c) random 0 10 20 30 40 50+ %
3. Uncut grass in blue region (3a) streaks none thin/short thin/long broad/short broad/long
- tire track streaks? none 1 2 3 4 5 bad
(3b) patches none 1-2 3-4 5+
(3c) random 0 10 20 30 40 50+ %
Clipping Evacuation 5. White clippings in blue region
(Sa) single clippings 0 1 2 3 4 5 none many
( Sb) loose clumps 0 1 2 3 4 5 no clumps many
(5c) dense clumps 0 1 2 3 4 5 no clumps many
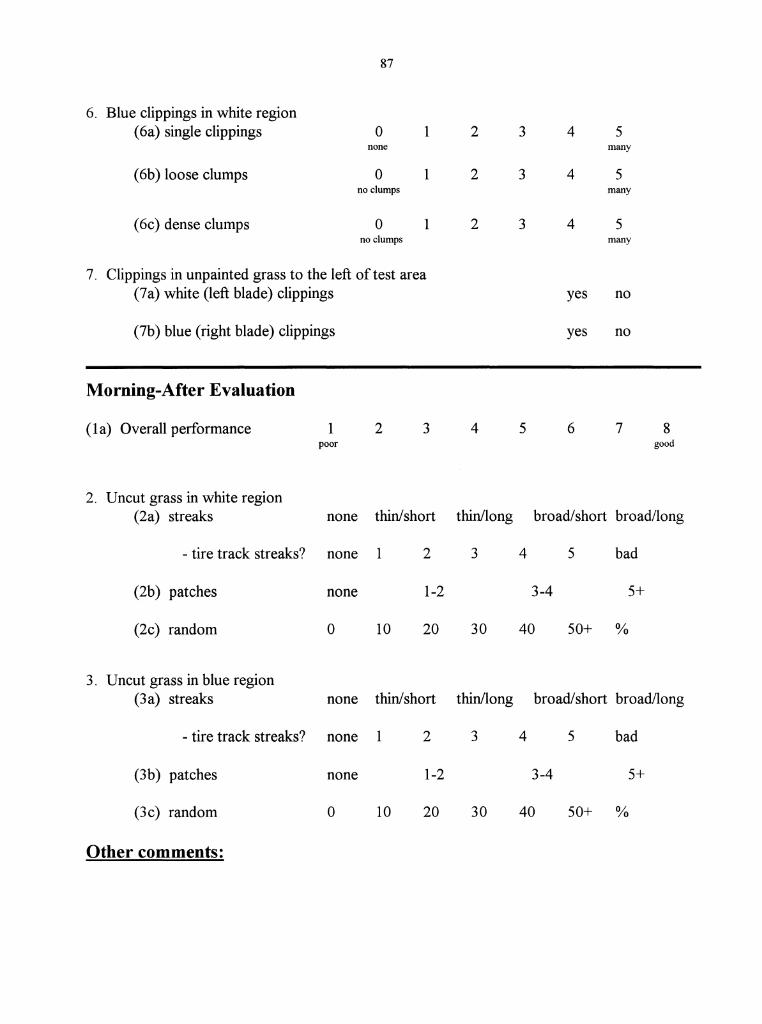
87
6. Blue clippings in white region (6a) single clippings 0 1 2 3 4 5
none many
( 6b) loose clumps 0 1 2 3 4 5 no clumps many
( 6c) dense clumps 0 1 2 3 4 5 no clumps many
7. Clippings in unpainted grass to the left of test area (7a) white (left blade) clippings yes no
(7b) blue (right blade) clippings yes no
Morning-After Evaluation
( 1 a) Overall performance 1 2 3 4 5 6 7 8 poor good
2. Uncut grass in white region (2a) streaks none thin/short thin/long broad/short broad/long
-tire track streaks? none 1 2 3 4 5 bad
(2b) patches none 1-2 3-4 5+
(2c) random 0 10 20 30 40 50+ %
3. Uncut grass in blue region (3a) streaks none thin/short thin/long broad/short broad/long
-tire track streaks? none 1 2 3 4 5 bad
(3b) patches none 1-2 3-4 5+
(3c) random 0 10 20 30 40 50+ %
Other comments: