Embed Size (px)
Citation preview

Illinois State Water SurveyPrairie Research InstituteUniversity of Illinois at Urbana-Champaign
Champaign, Illinois
Miscellaneous Publication 198
Measured Solar Radiation Over Illinois
Wayne M. Wendland and Robert W. Scott
December 2011

1
MEASURED SOLAR RADIATION OVER ILLINOIS
Wayne M. Wendland
and
Robert W. Scott
Illinois State Water Survey University of Illinois at Urbana-Champaign
Champaign, Illinois
2
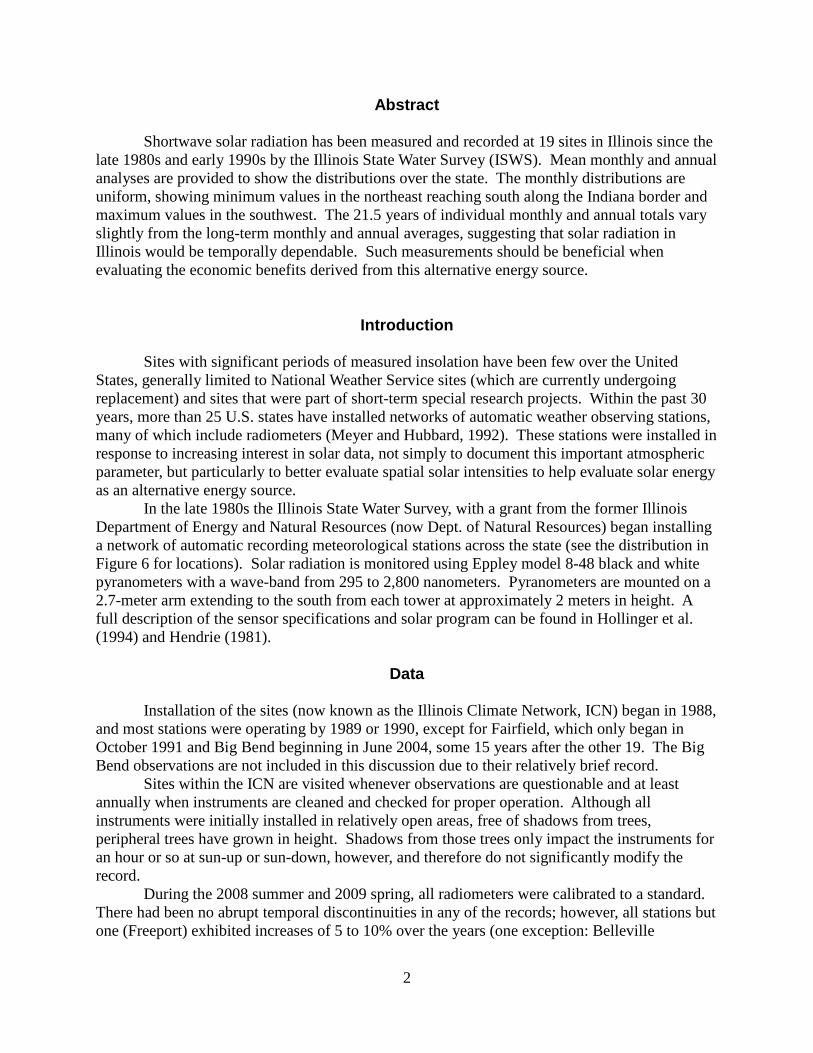
Abstract
Shortwave solar radiation has been measured and recorded at 19 sites in Illinois since the late 1980s and early 1990s by the Illinois State Water Survey (ISWS). Mean monthly and annual analyses are provided to show the distributions over the state. The monthly distributions are uniform, showing minimum values in the northeast reaching south along the Indiana border and maximum values in the southwest. The 21.5 years of individual monthly and annual totals vary slightly from the long-term monthly and annual averages, suggesting that solar radiation in Illinois would be temporally dependable. Such measurements should be beneficial when evaluating the economic benefits derived from this alternative energy source.
Introduction
Sites with significant periods of measured insolation have been few over the United States, generally limited to National Weather Service sites (which are currently undergoing replacement) and sites that were part of short-term special research projects. Within the past 30 years, more than 25 U.S. states have installed networks of automatic weather observing stations, many of which include radiometers (Meyer and Hubbard, 1992). These stations were installed in response to increasing interest in solar data, not simply to document this important atmospheric parameter, but particularly to better evaluate spatial solar intensities to help evaluate solar energy as an alternative energy source.
In the late 1980s the Illinois State Water Survey, with a grant from the former Illinois Department of Energy and Natural Resources (now Dept. of Natural Resources) began installing a network of automatic recording meteorological stations across the state (see the distribution in Figure 6 for locations). Solar radiation is monitored using Eppley model 8-48 black and white pyranometers with a wave-band from 295 to 2,800 nanometers. Pyranometers are mounted on a 2.7-meter arm extending to the south from each tower at approximately 2 meters in height. A full description of the sensor specifications and solar program can be found in Hollinger et al. (1994) and Hendrie (1981).
Data
Installation of the sites (now known as the Illinois Climate Network, ICN) began in 1988, and most stations were operating by 1989 or 1990, except for Fairfield, which only began in October 1991 and Big Bend beginning in June 2004, some 15 years after the other 19. The Big Bend observations are not included in this discussion due to their relatively brief record.
Sites within the ICN are visited whenever observations are questionable and at least annually when instruments are cleaned and checked for proper operation. Although all instruments were initially installed in relatively open areas, free of shadows from trees, peripheral trees have grown in height. Shadows from those trees only impact the instruments for an hour or so at sun-up or sun-down, however, and therefore do not significantly modify the record.
During the 2008 summer and 2009 spring, all radiometers were calibrated to a standard. There had been no abrupt temporal discontinuities in any of the records; however, all stations but one (Freeport) exhibited increases of 5 to 10% over the years (one exception: Belleville
3
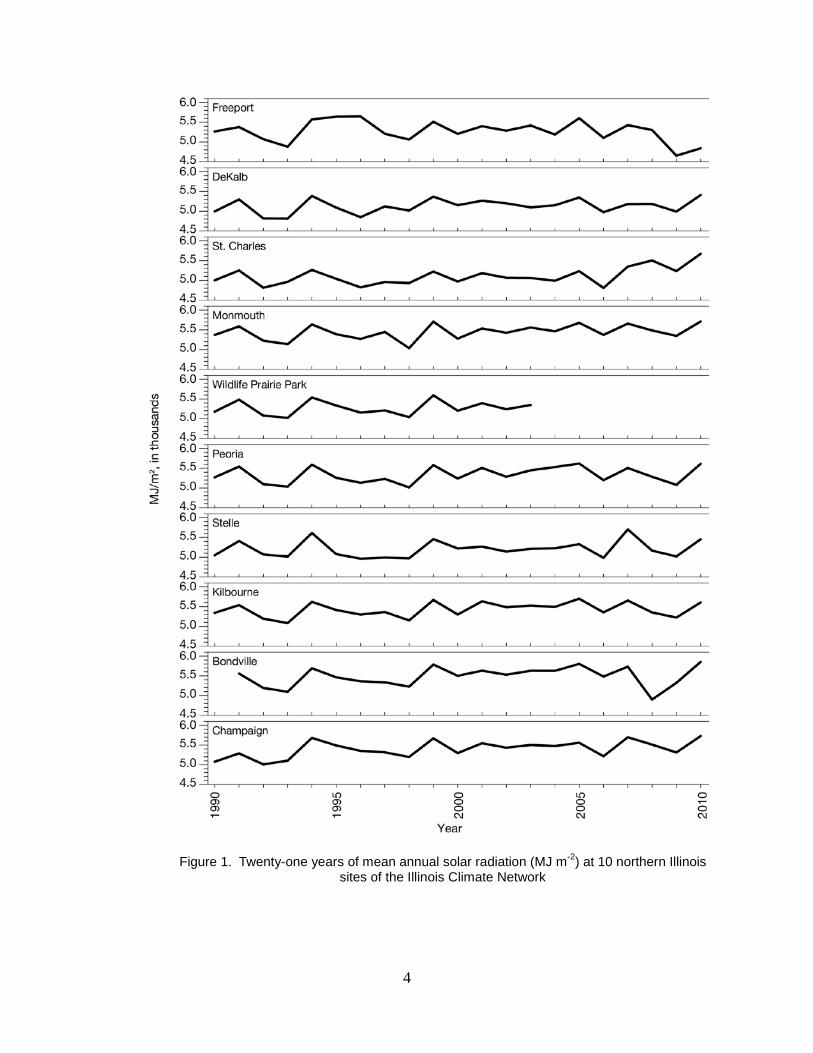
increased by 28%). The increases were not continuous, but rather like spring temperatures, increasing with time, an episode of a few days with warming, followed by a few days with cooling, another warming, etc. The relatively high values of 2010 were equaled or exceeded in a few previous years at some of the stations. For example, in 2006, six sites in central and southern Illinois exceeded the values in 2010 by a few percent. Similar situations were found in 1994 (4 sites), 1999 (3), and 2001 (2).
The standard radiometer was moved to all sites every few weeks between April and August to ensure that some relatively high solar angles were observed. Differences from the standard were 4% or less at all stations except Carbondale (5%), DeKalb and Brownstown (6% each), Perry (7%), and Springfield (8%). Annual local maxima were observed at most stations in 1992, 1994, 1995, 1999, 2001, 2005, and 2007. Relative minima occurred in 1993, 1998, 2000, 2006, and 2009.
The absence of abrupt discontinuities in the temporal records could not identify a time or character of any calibration changes at any site. The instruments were presumed calibrated by the manufacturer at the time of installation and therefore any change must have occurred thereafter. Without further information, 1/20th of the total calibration magnitude was added to each successive year after 1990 to each of the five sites which exhibited 5% or more calibration change over 20 years. Observations at the other 14 sites were not adjusted. The monthly and annual results are presented in Figures 3–6.
4
Figure 1. Twenty-one years of mean annual solar radiation (MJ m-2) at 10 northern Illinois sites of the Illinois Climate Network
5
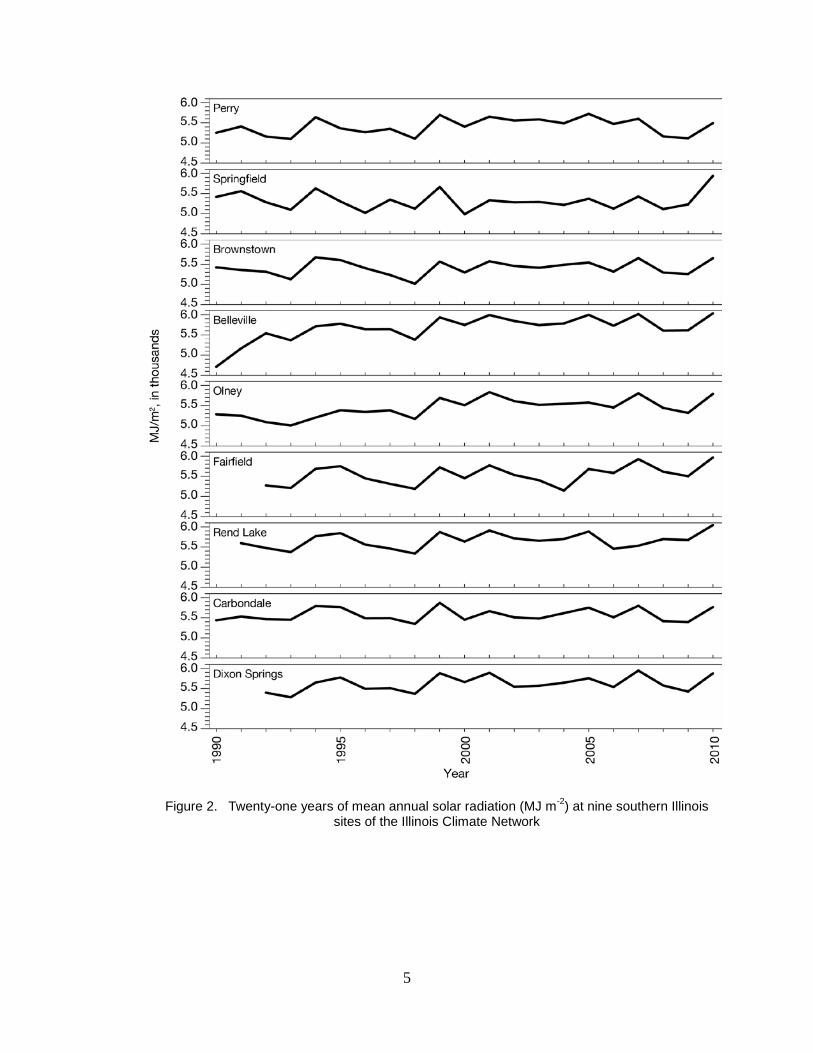
Figure 2. Twenty-one years of mean annual solar radiation (MJ m-2) at nine southern Illinois sites of the Illinois Climate Network
6
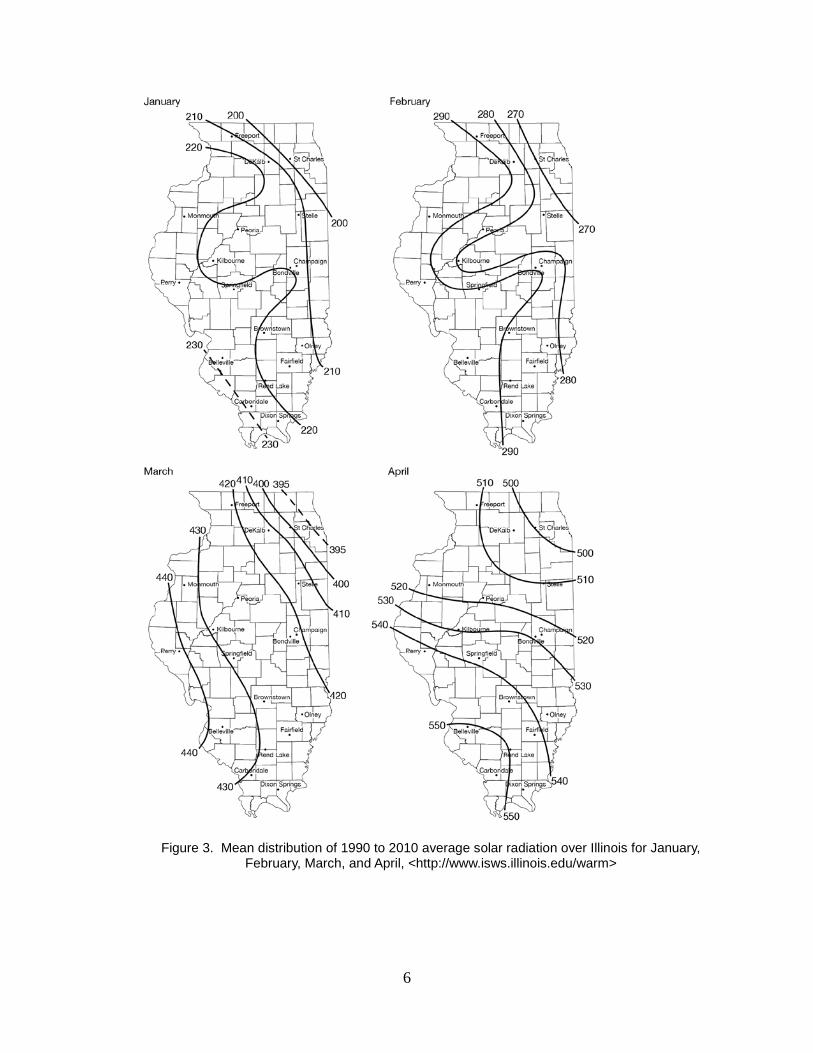
Figure 3. Mean distribution of 1990 to 2010 average solar radiation over Illinois for January, February, March, and April, <http://www.isws.illinois.edu/warm>
7
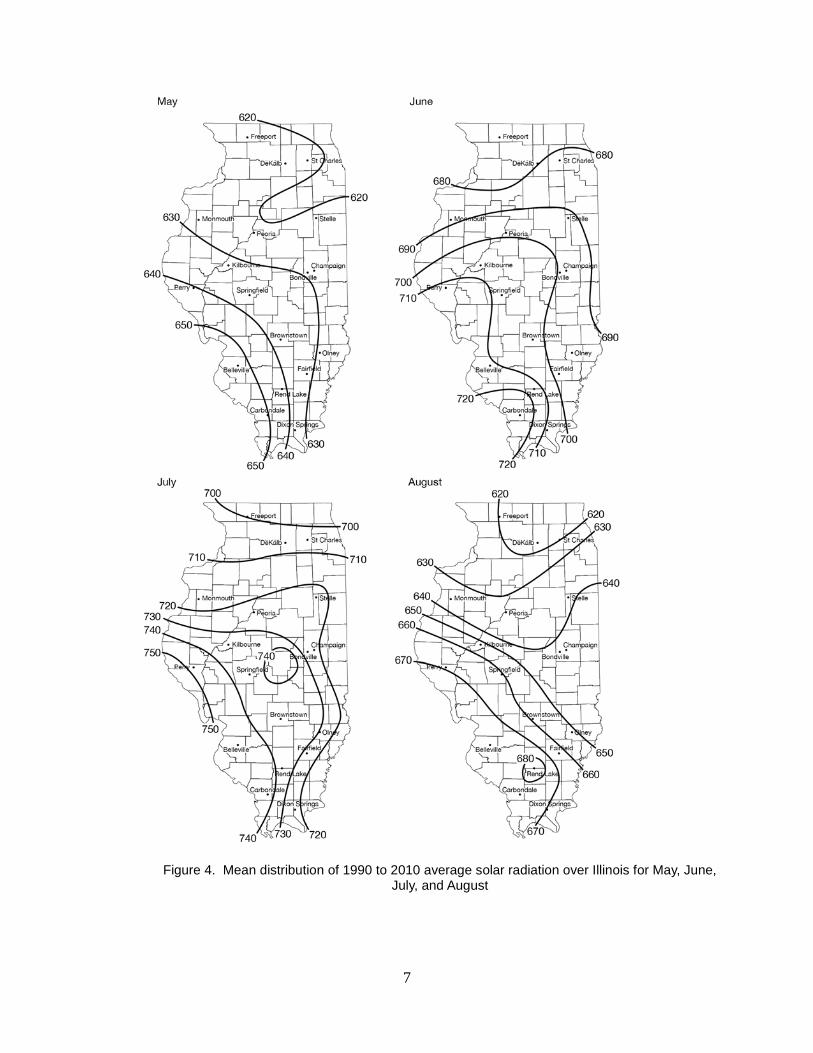
Figure 4. Mean distribution of 1990 to 2010 average solar radiation over Illinois for May, June, July, and August
8
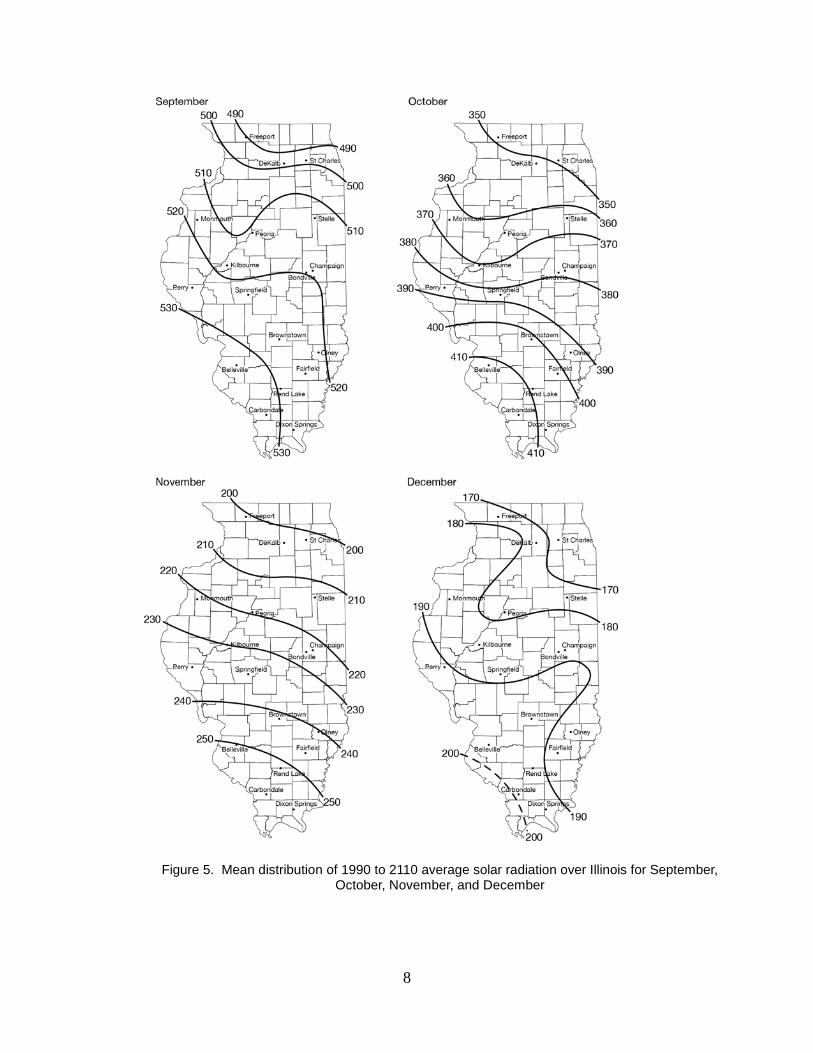
Figure 5. Mean distribution of 1990 to 2110 average solar radiation over Illinois for September, October, November, and December
9
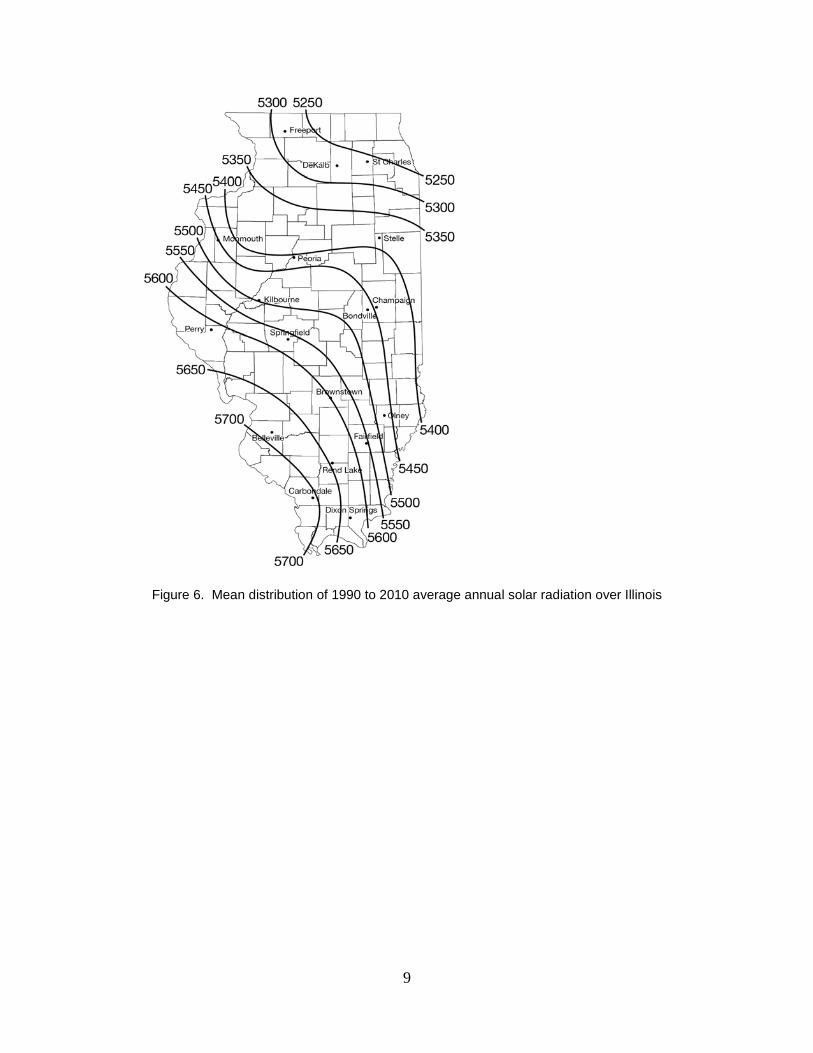
Figure 6. Mean distribution of 1990 to 2010 average annual solar radiation over Illinois
10
Discussion
Based on data from January 1990 through July 2011 (Anon., 1989–2011), the overall configuration of the monthly and annual solar radiation contours (Figures 3–6) are similar to each other in that (1) the lowest values found in northeastern Illinois extend south along the state's eastern boundary, (2) a minor area of minimum values extends from east-central into central Illinois, and (3) maximum solar radiation in southwestern Illinois extends north along the western state border. These features are particularly pronounced during winter months. The southwest-to-northeast gradient over Illinois was also found by the National Weather Service National Solar Radiation Data Base, with averages based on 1961–1990 data (Anon., n.d.). The minimum in the northeast is likely due to higher particulate and aerosol concentrations from the Chicago metro area, supplemented by greater mean cloud cover in eastern Illinois (Anon., 1993), which also supports the relative values found along the Illinois-Indiana border. Maximum solar radiation is found in southwestern Illinois, consistent with the heaviest mean cloud cover found over eastern counties.
The overall southwest-northeast gradient follows that shown by the analyses of Knapp et al. (1980); however, the present analyses offer greater spatial resolution due to the greater number of observation sites. The southwest-to-northeast gradient over the state is weakest from December through February, at 25–30 mega Joules per square meter (MJ m-2), and greatest in April, August, October, and November at 55–60 MJ m-2. (1 MJ m-2 = 23.9 cal cm-2 = 88.06 BTU ft-2).
The lowest mean monthly solar radiation of all sites is found in December, ranging from about 165 in northeastern Illinois to about 200 MJ m-2 in the southwest (Figure 5). The greatest monthly solar radiation is found in July (Figure 4), varying from about 680 in the northeast to 720 MJ m-2 in the southwest. July accumulations surpass those of June due to the additional day compared to June and a climatological trend toward decreasing cloud cover from spring to summer. Annual insolation totals (Figure 6) ranged from about 5,250 in the northeast to about 5,700 MJ m-2 in the southwest.
Deviations from the mean monthly and annual station values were relatively small and uniform throughout the months and years. The greatest monthly deviations of any of the 21 years were 110 to 112% of each of the 19 station monthly means, and the lowest were 83 to 94%. Uniformity for these two periods is likely due to the relatively large number of daily values from which the monthly and annual averages are derived, i.e., 28–31 and 365–366, respectively. Daily radiation data exhibit a much greater variability as daily solar radiation is subject to the day’s dominating air mass and cloud cover. The daily maxima were 117 to 205% of the mean and the daily minima varied from 13 to 48% of the mean. These solar radiation analyses and extremes provide a means to quantitatively assess the financial advantages of using solar power in Illinois. They likely offer the greatest potential when assessing solar power benefits in rural areas without access to existing power lines (see Rockett and Scott, 2006).
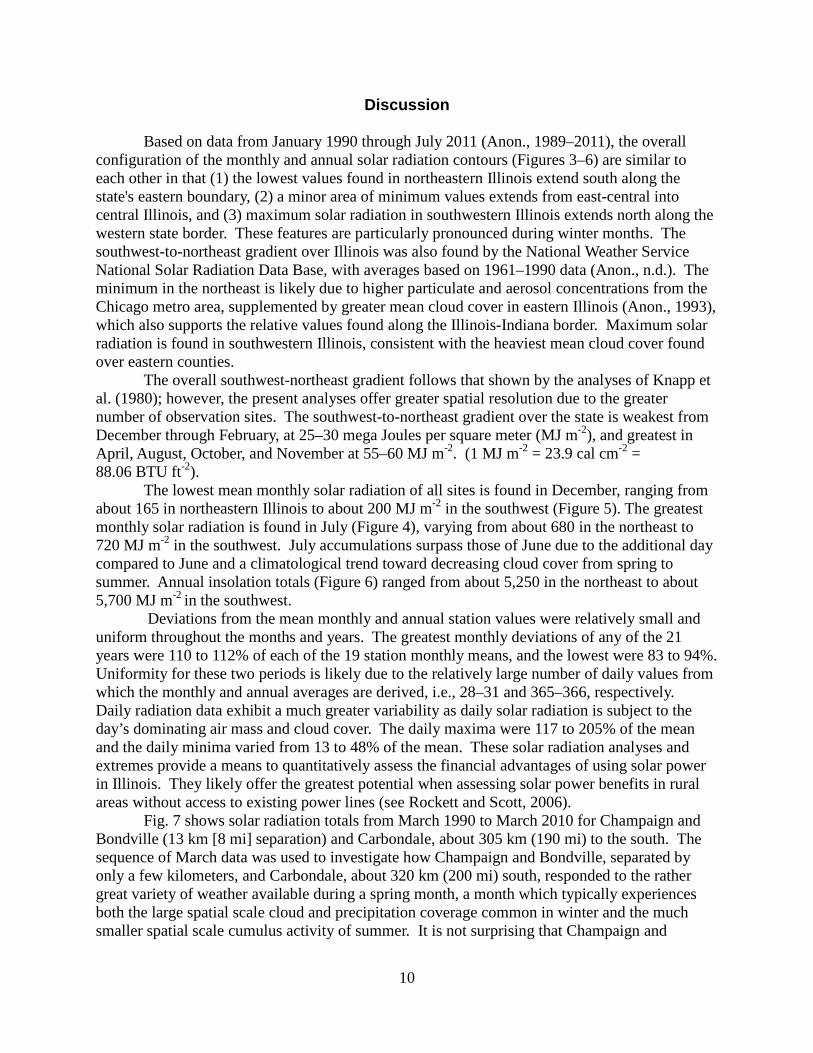
Fig. 7 shows solar radiation totals from March 1990 to March 2010 for Champaign and Bondville (13 km [8 mi] separation) and Carbondale, about 305 km (190 mi) to the south. The sequence of March data was used to investigate how Champaign and Bondville, separated by only a few kilometers, and Carbondale, about 320 km (200 mi) south, responded to the rather great variety of weather available during a spring month, a month which typically experiences both the large spatial scale cloud and precipitation coverage common in winter and the much smaller spatial scale cumulus activity of summer. It is not surprising that Champaign and
11
Bondville closely track each other due to their slight separation. Carbondale is sufficiently far away so that summer synoptic patterns (primarily cumulous clouds typically covering only a small percentage of the sky) generally do not affect both east-central and southern Illinois. Interestingly, Carbondale’s monthly radiation in March 1996, 1998, 1999, 2008, 2010, and 2011 were all less than those of either Champaign or Bondville.
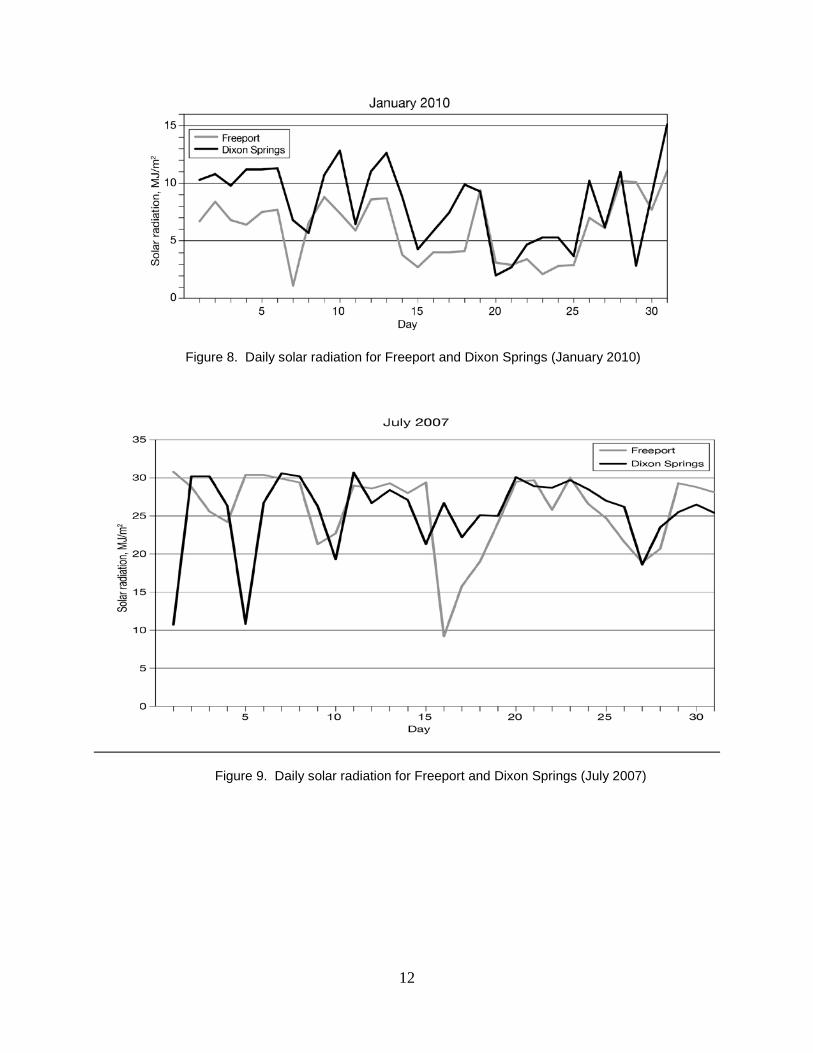
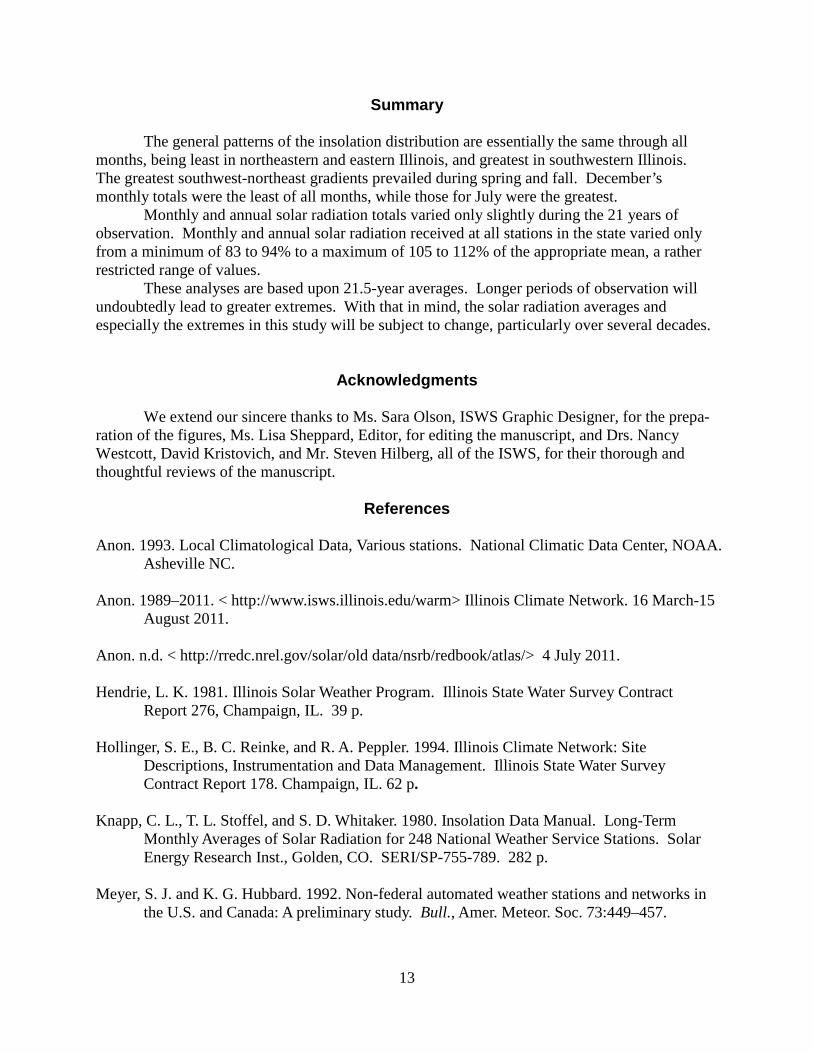
Figures 8 and 9 show the daily solar radiation totals for Freeport, near the Wisconsin border, and Dixon Springs some 530 km (330 mi) to the south in January 2010 and July 2007, respectively. In January, radiation at Dixon Springs is equal to or greater than that at Freeport, as expected. Only on one day, January 29, was the reverse true, undoubtedly due to the distribution of clouds. The July differences between these two sites are most interesting. On both July 1 and 5, Dixon Springs’ radiation was much less than that at Freeport. July 1 was overcast at Dixon Springs with about 1 mm (0.05 in) of rain, whereas on July 5 it was overcast again with 82 mm (3.2 inches) of rain during the 24-hour period. On July 16, radiation at Freeport was somewhat lower than the previous two cases, associated with 77 mm (3 inches) of rain that fell over the three days bracketing the 16th.
Figure 7. Total solar radiation for Champaign, Bondville, and Dixon Springs (March 1990–2010)
12
Figure 8. Daily solar radiation for Freeport and Dixon Springs (January 2010)
Figure 9. Daily solar radiation for Freeport and Dixon Springs (July 2007)
13
Summary
The general patterns of the insolation distribution are essentially the same through all months, being least in northeastern and eastern Illinois, and greatest in southwestern Illinois. The greatest southwest-northeast gradients prevailed during spring and fall. December’s monthly totals were the least of all months, while those for July were the greatest.
Monthly and annual solar radiation totals varied only slightly during the 21 years of observation. Monthly and annual solar radiation received at all stations in the state varied only from a minimum of 83 to 94% to a maximum of 105 to 112% of the appropriate mean, a rather restricted range of values. These analyses are based upon 21.5-year averages. Longer periods of observation will undoubtedly lead to greater extremes. With that in mind, the solar radiation averages and especially the extremes in this study will be subject to change, particularly over several decades.
Acknowledgments
We extend our sincere thanks to Ms. Sara Olson, ISWS Graphic Designer, for the prepa-
ration of the figures, Ms. Lisa Sheppard, Editor, for editing the manuscript, and Drs. Nancy Westcott, David Kristovich, and Mr. Steven Hilberg, all of the ISWS, for their thorough and thoughtful reviews of the manuscript.
References
Anon. 1993. Local Climatological Data, Various stations. National Climatic Data Center, NOAA.
Asheville NC. Anon. 1989–2011. < http://www.isws.illinois.edu/warm> Illinois Climate Network. 16 March-15
August 2011. Anon. n.d. < http://rredc.nrel.gov/solar/old data/nsrb/redbook/atlas/> 4 July 2011. Hendrie, L. K. 1981. Illinois Solar Weather Program. Illinois State Water Survey Contract
Report 276, Champaign, IL. 39 p. Hollinger, S. E., B. C. Reinke, and R. A. Peppler. 1994. Illinois Climate Network: Site
Descriptions, Instrumentation and Data Management. Illinois State Water Survey Contract Report 178. Champaign, IL. 62 p.
Knapp, C. L., T. L. Stoffel, and S. D. Whitaker. 1980. Insolation Data Manual. Long-Term
Monthly Averages of Solar Radiation for 248 National Weather Service Stations. Solar Energy Research Inst., Golden, CO. SERI/SP-755-789. 282 p.
Meyer, S. J. and K. G. Hubbard. 1992. Non-federal automated weather stations and networks in
the U.S. and Canada: A preliminary study. Bull., Amer. Meteor. Soc. 73:449–457.

14
Rockett, A. and R. Scott. 2006. Evaluation of the Potential for Photovoltaic Power Generation in Illinois. Illinois State Water Survey, Champaign, IL. 15 p.


![Specificity of Antigens on UV Radiation-induced …...(CANCER RESEARCH 49. 1207-1213, March 1, 1989] Specificity of Antigens on UV Radiation-induced Antigenic Tumor Cell Variants Measured](https://img.pdfslide.us/doc/110x75/5eae9c8d1d3f1078676606a2/specificity-of-antigens-on-uv-radiation-induced-cancer-research-49-1207-1213.jpg)