Embed Size (px)
Citation preview
CODES AND STANDARDS ENHANCEMENT INITIATIVE (CASE)
Residential Lighting
2013 California Building Energy Efficiency Standards
California Utilities Statewide Codes and Standards Team October 2011
This report was prepared by the California Statewide Utility Codes and Standards Program and funded by the California utility customers under the
auspices of the California Public Utilities Commission.
Copyright 2011 Pacific Gas and Electric Company, Southern California Edison, SoCalGas, SDG&E.
All rights reserved, except that this document may be used, copied, and distributed without modification.
Neither PG&E, SCE, SoCalGas, SDG&E, nor any of its employees makes any warranty, express of implied; or assumes any legal liability or
responsibility for the accuracy, completeness or usefulness of any data, information, method, product, policy or process disclosed in this document;
or represents that its use will not infringe any privately-owned rights including, but not limited to, patents, trademarks or copyrights
Measure Information Template Page 2
2011 California Building Energy Efficiency Standards [October 2011]
CONTENTS
CODES AND STANDARDS ENHANCEMENT INITIATIVE (CASE) ....................... 1
1. Overview ....................................................................................................................... 5
2. Methodology............................................................................................................... 12
2.1 Data Collection .........................................................................................................................12
2.2 Energy Savings .........................................................................................................................12
2.3 Lifecycle Cost (LCC) Analysis ................................................................................................13
2.4 Statewide Savings Estimates ....................................................................................................13
2.5 Stakeholder Meeting Process....................................................................................................13
3. Analysis and Results ................................................................................................. 15
3.1 Analysis of 2010 New Home Energy Survey Lighting Data ...................................................15
3.1.1 Total Lighting Power Density ............................................................................................15
3.1.2 Lighting Power per Room ..................................................................................................16
3.1.3 Lamp Types in Use ............................................................................................................16
3.1.4 Hours of Use ......................................................................................................................19
3.2 Energy Savings .........................................................................................................................20
3.2.1 Recessed Downlights .........................................................................................................20
3.2.2 Bathroom Lighting .............................................................................................................21
3.2.3 Kitchen Lighting ................................................................................................................23
3.2.4 Garage, Laundry Room, Closet and Utility Room Lighting ..............................................25
3.2.5 Hallway Lighting ...............................................................................................................27
3.3 Cost Effectiveness and Statewide Savings ...............................................................................29
3.3.1 Cost Effectiveness of Luminaires ......................................................................................29
3.3.2 Cost Effectiveness of Controls...........................................................................................31
3.3.3 Cost Effectiveness of Non Line of Sight Vacancy Sensors ...............................................34
3.3.4 Statewide Savings ..............................................................................................................34
3.4 Materials Impacts .....................................................................................................................37
4. Recommended Language for the Standards Document, ACM Manuals, and the Reference Appendices ....................................................................................................... 39
4.1 Summary of Code Change Proposals .......................................................................................39
4.1.1 Recessed Downlights .........................................................................................................39
Measure Information Template Page 3
2011 California Building Energy Efficiency Standards [October 2011]
4.1.2 Efficacy and Controls Requirements in Bathrooms...........................................................39
4.1.3 Relocation of Low Efficacy Allowance for Kitchens ........................................................39
4.1.4 Eliminate Exceptions and Require Controls in Garages, Laundry Rooms, Closets and
Utility Rooms ..................................................................................................................................39
4.1.5 Decorative Requirements for Hallways .............................................................................39
4.1.6 Require All High Efficacy Lighting for Reach Code ........................................................39
4.2 Code Language Recommended by the Investor-Owned Utilities Codes and Standards Team 40
4.2.1 Section 150(k) ....................................................................................................................40
4.3 Code Language Proposed by the California Energy Commission ...........................................41
4.4 Differences between the Recommended and Proposed Language ...........................................43
4.4.1 Removal of the requirement that recessed luminaires should not have medium screw
bases. 43
4.5 Recommended Reach Code Language .....................................................................................46
5. Bibliography and Other Research ............................................................................ 47
6. Appendices ................................................................................................................ 48
6.1 Residential Construction Forecast Details ................................................................................48
6.1.1 Summary ............................................................................................................................48
6.1.2 Additional Details ..............................................................................................................49
6.1.3 Citation ...............................................................................................................................49
6.2 Data for Materials Impacts .......................................................................................................50
Mercury and Lead ...........................................................................................................................50
Copper, Steel and Plastics ...............................................................................................................51
FIGURES
Figure 1: House Area vs Installed Wattage .......................................................................................... 15
Figure 2: Average Lighting Watts (permanently installed and portable) per room type ...................... 16
Figure 3: Percentage of Residential lamp sources (by Wattage) .......................................................... 17
Figure 4: Permanently Installed vs Portable Lighting Wattage ............................................................ 17
Figure 5: Percentage of Portable Lighting sources (by Wattage) ......................................................... 18
Figure 6: Percentage of Permanently Installed Lighting sources (by Wattage) ................................... 19
Figure 7: Average Daily Hours of Use for Residential Space Types ................................................... 19
Figure 8: Medium screw-base recessed downlight sources (by wattage) ............................................. 20
Measure Information Template Page 4
2011 California Building Energy Efficiency Standards [October 2011]
Figure 9: Master bathroom lamp sources (by wattage) ........................................................................ 21
Figure 10: Secondary bathroom lamp sources (by wattage) ................................................................. 22
Figure 11: Powder room lamp sources (by wattage) ............................................................................ 22
Figure 12: Percentage of permanently installed lamp sources in kitchens (by wattage) ...................... 24
Figure 13: Kitchen lighting wattage with proposed thresholds ............................................................ 24
Figure 14: Low and High Efficacy Lighting Power in Kitchens .......................................................... 25
Figure 15: Percentage of permanently installed lamp sources in Utility Rooms (by wattage) ............. 26
Figure 16: Percentage of permanently installed lamp sources in Closets (by wattage) ........................ 27
Figure 17: Percentage of permanently installed lamp sources in Hallways (by Wattage) ................... 28
Figure 18: Luminaire First Cost ............................................................................................................ 29
Figure 19: Cost and wattage assumptions for lamp types..................................................................... 29
Figure 20: Cost Effectiveness Analysis for GU-24 downlight with dimmer........................................ 30
Figure 21: Cost Effectiveness Analysis for pin-based compact fluorescent downlights ...................... 30
Figure 22: Cost Effectiveness Analysis for LED under-cabinet lighting ............................................. 31
Figure 23: Cost Effectiveness for LED decorative pendants ................................................................ 31
Figure 24: Cost Effectiveness Analysis for LED recessed downlights ................................................ 31
Figure 25: Cost and savings estimates for control devices ................................................................... 32
Figure 26: Cost Effectiveness Analysis for vacancy sensors ................................................................ 32
Figure 27: Cost Effectiveness Analysis for manual dimming .............................................................. 33
Figure 28: Cost Effectiveness Analysis for high efficacy luminaire with vacancy sensor ................... 33
Figure 29: Cost Effectiveness Analysis for ultrasonic vacancy sensor ................................................ 34
Figure 30: Combined Life-Cycle Cost Savings for Residential Measures ........................................... 34
Figure 31: Statewide Savings for all proposed measures ..................................................................... 35
Figure 32: Average Room Type Quantities per Dwelling Unit ............................................................ 36
Figure 33. Basis for Calculation of Materials Impacts ......................................................................... 37
Figure 34. Statewide Materials Impact ................................................................................................. 38
Figure 36: Savings from High Efficacy Lighting ................................................................................. 46
Figure 37: Potential Savings from High Efficacy Lighting for a Typical Dwelling Unit .................... 46
Figure 38. Materials Content of Typical Lighting Components, by Weight ........................................ 50
Measure Information Template Page 5
2011 California Building Energy Efficiency Standards [October 2011]
1. Overview
a. Measure
Title
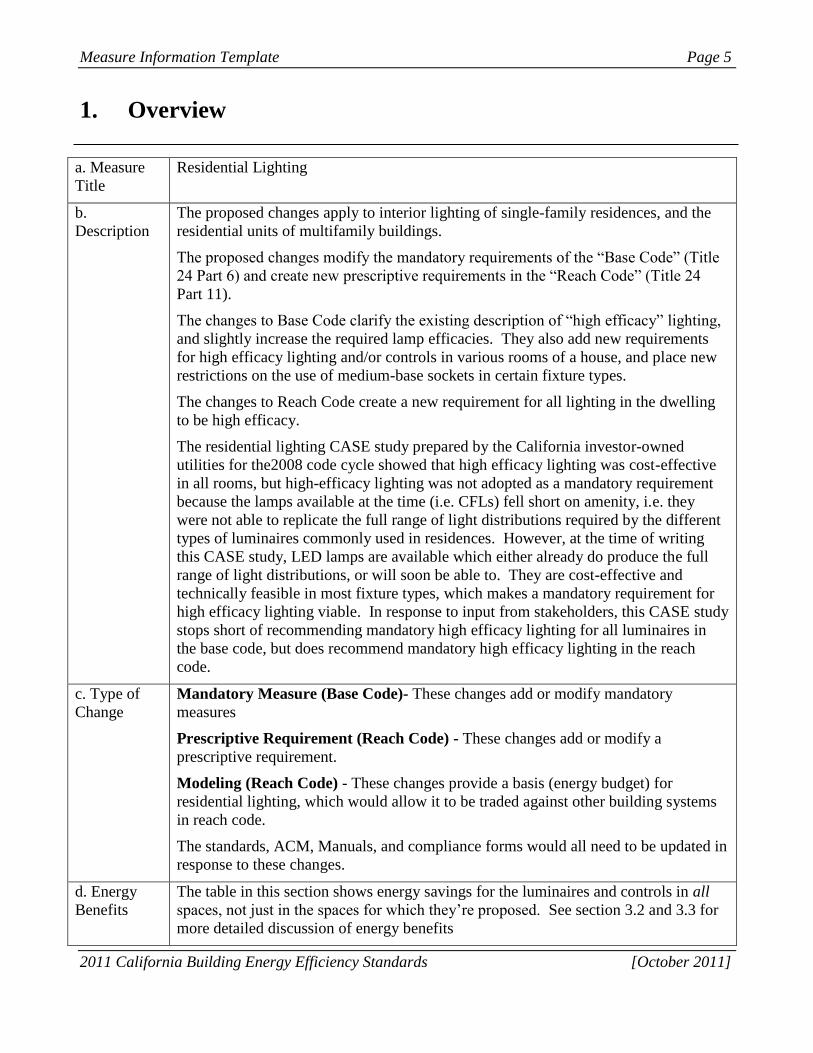
Residential Lighting
b.
Description
The proposed changes apply to interior lighting of single-family residences, and the
residential units of multifamily buildings.
The proposed changes modify the mandatory requirements of the “Base Code” (Title
24 Part 6) and create new prescriptive requirements in the “Reach Code” (Title 24
Part 11).
The changes to Base Code clarify the existing description of “high efficacy” lighting,
and slightly increase the required lamp efficacies. They also add new requirements
for high efficacy lighting and/or controls in various rooms of a house, and place new
restrictions on the use of medium-base sockets in certain fixture types.
The changes to Reach Code create a new requirement for all lighting in the dwelling
to be high efficacy.
The residential lighting CASE study prepared by the California investor-owned
utilities for the2008 code cycle showed that high efficacy lighting was cost-effective
in all rooms, but high-efficacy lighting was not adopted as a mandatory requirement
because the lamps available at the time (i.e. CFLs) fell short on amenity, i.e. they
were not able to replicate the full range of light distributions required by the different
types of luminaires commonly used in residences. However, at the time of writing
this CASE study, LED lamps are available which either already do produce the full
range of light distributions, or will soon be able to. They are cost-effective and
technically feasible in most fixture types, which makes a mandatory requirement for
high efficacy lighting viable. In response to input from stakeholders, this CASE study
stops short of recommending mandatory high efficacy lighting for all luminaires in
the base code, but does recommend mandatory high efficacy lighting in the reach
code.
c. Type of
Change
Mandatory Measure (Base Code)- These changes add or modify mandatory
measures
Prescriptive Requirement (Reach Code) - These changes add or modify a
prescriptive requirement.
Modeling (Reach Code) - These changes provide a basis (energy budget) for
residential lighting, which would allow it to be traded against other building systems
in reach code.
The standards, ACM, Manuals, and compliance forms would all need to be updated in
response to these changes.
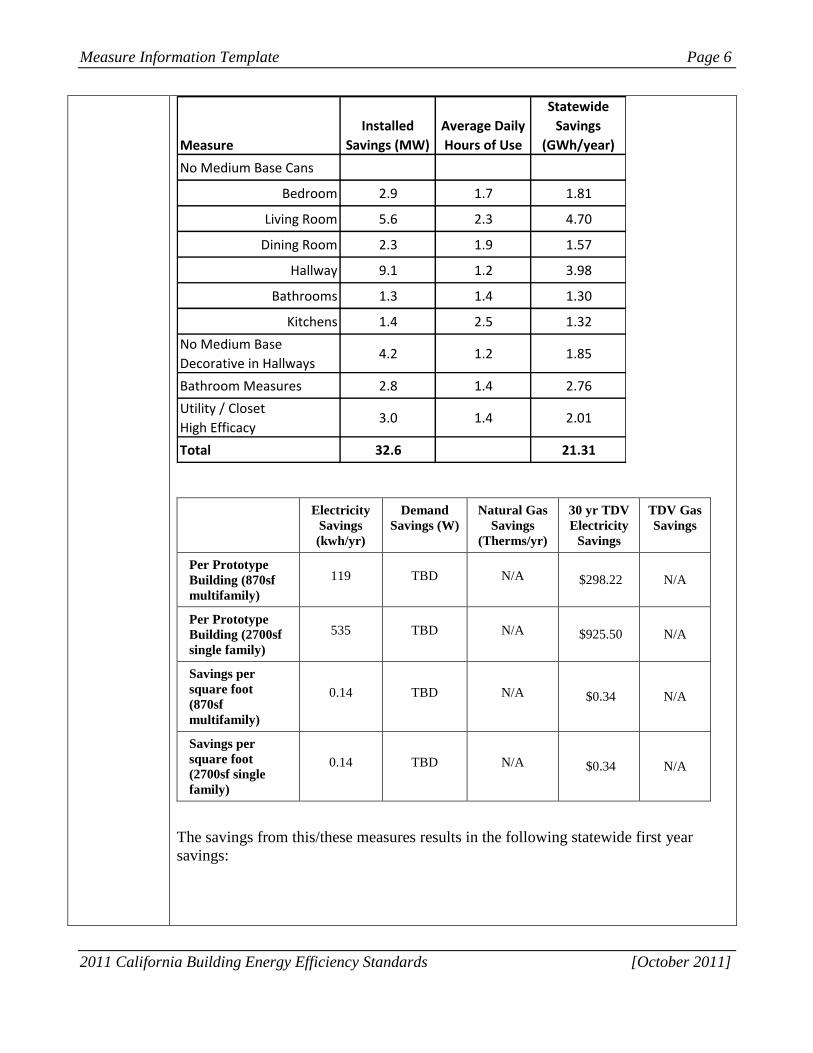
d. Energy
Benefits
The table in this section shows energy savings for the luminaires and controls in all
spaces, not just in the spaces for which they’re proposed. See section 3.2 and 3.3 for
more detailed discussion of energy benefits
Measure Information Template Page 6
2011 California Building Energy Efficiency Standards [October 2011]
Electricity
Savings
(kwh/yr)
Demand
Savings (W)
Natural Gas
Savings
(Therms/yr)
30 yr TDV
Electricity
Savings
TDV Gas
Savings
Per Prototype
Building (870sf
multifamily)
119 TBD N/A $298.22 N/A
Per Prototype
Building (2700sf
single family)
535 TBD N/A $925.50 N/A
Savings per
square foot
(870sf
multifamily)
0.14 TBD N/A $0.34 N/A
Savings per
square foot
(2700sf single
family)
0.14 TBD N/A $0.34 N/A
The savings from this/these measures results in the following statewide first year
savings:
Measure
Installed
Savings (MW)
Average Daily
Hours of Use
Statewide
Savings
(GWh/year)
No Medium Base Cans
Bedroom 2.9 1.7 1.81
Living Room 5.6 2.3 4.70
Dining Room 2.3 1.9 1.57
Hallway 9.1 1.2 3.98
Bathrooms 1.3 1.4 1.30
Kitchens 1.4 2.5 1.32
No Medium Base
Decorative in Hallways4.2 1.2 1.85
Bathroom Measures 2.8 1.4 2.76
Utility / Closet
High Efficacy3.0 1.4 2.01
Total 32.6 21.31
Measure Information Template Page 7
2011 California Building Energy Efficiency Standards [October 2011]
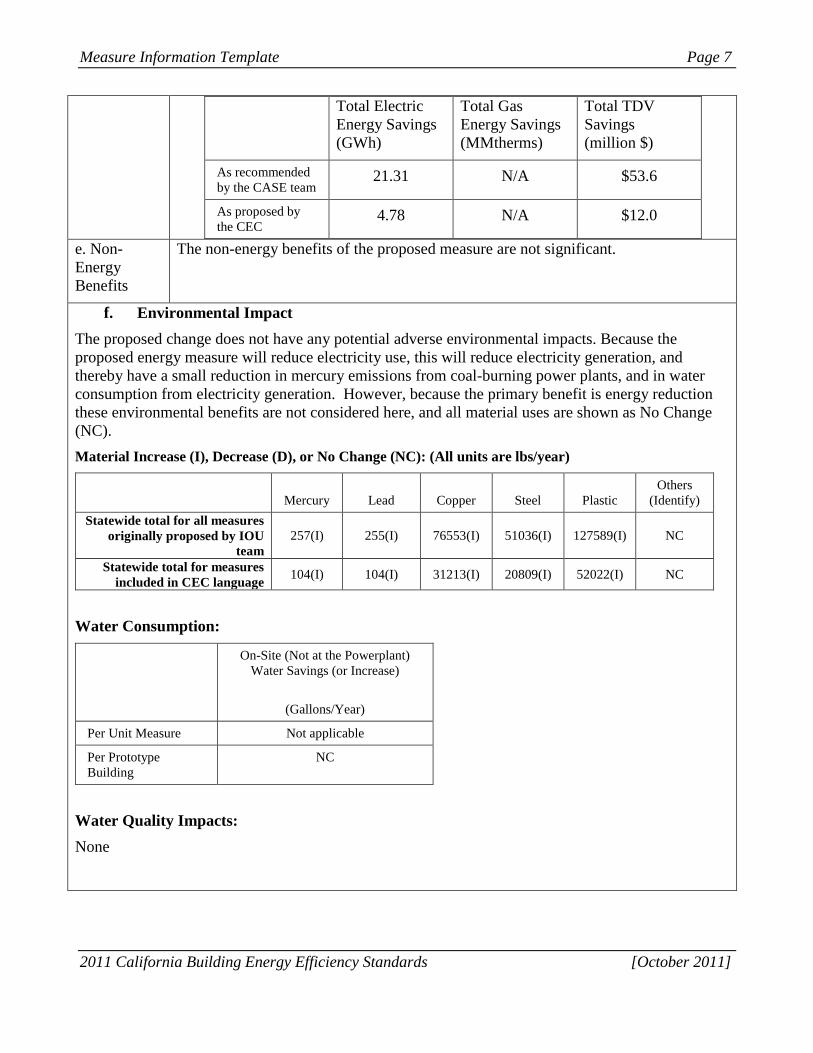
Total Electric
Energy Savings
(GWh)
Total Gas
Energy Savings
(MMtherms)
Total TDV
Savings
(million $)
As recommended
by the CASE team 21.31 N/A $53.6
As proposed by
the CEC 4.78 N/A $12.0
e. Non-
Energy
Benefits
The non-energy benefits of the proposed measure are not significant.
f. Environmental Impact
The proposed change does not have any potential adverse environmental impacts. Because the
proposed energy measure will reduce electricity use, this will reduce electricity generation, and
thereby have a small reduction in mercury emissions from coal-burning power plants, and in water
consumption from electricity generation. However, because the primary benefit is energy reduction
these environmental benefits are not considered here, and all material uses are shown as No Change
(NC).
Material Increase (I), Decrease (D), or No Change (NC): (All units are lbs/year)
Mercury Lead Copper Steel Plastic
Others
(Identify)
Statewide total for all measures
originally proposed by IOU
team
257(I) 255(I) 76553(I) 51036(I) 127589(I) NC
Statewide total for measures
included in CEC language 104(I) 104(I) 31213(I) 20809(I) 52022(I) NC
Water Consumption:
On-Site (Not at the Powerplant)
Water Savings (or Increase)
(Gallons/Year)
Per Unit Measure Not applicable
Per Prototype
Building
NC
Water Quality Impacts:
None
Measure Information Template Page 8
2011 California Building Energy Efficiency Standards [October 2011]
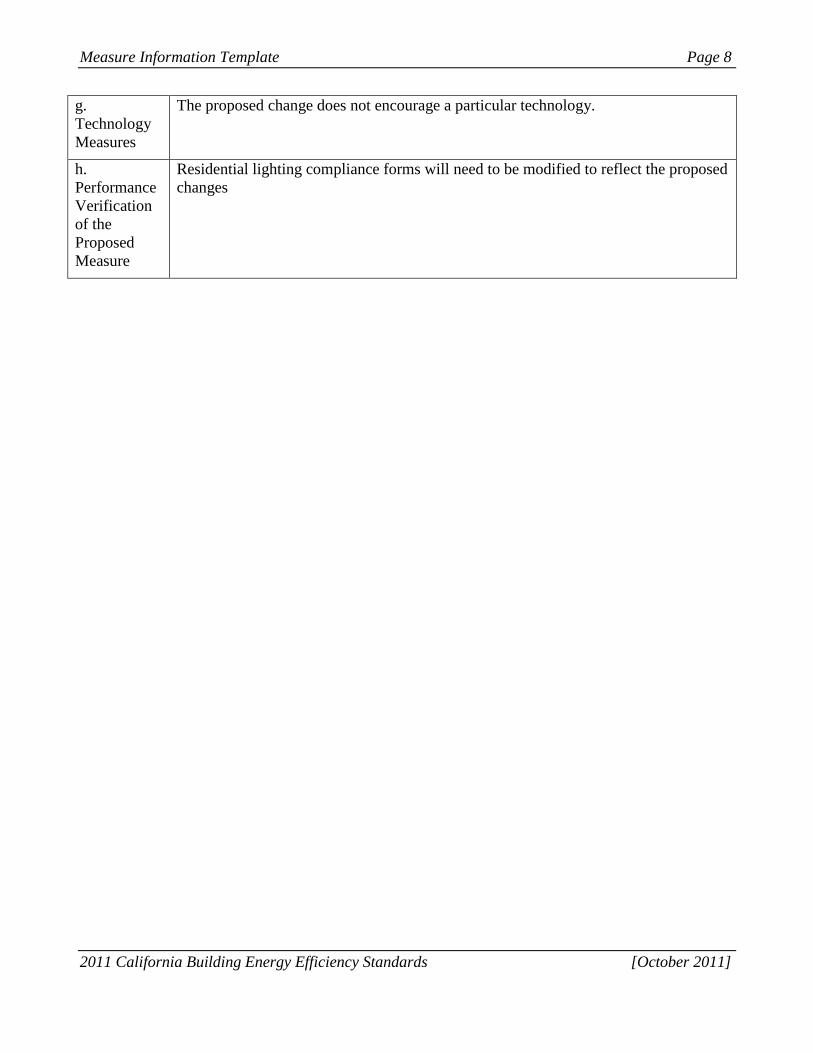
g.
Technology
Measures
The proposed change does not encourage a particular technology.
h.
Performance
Verification
of the
Proposed
Measure
Residential lighting compliance forms will need to be modified to reflect the proposed
changes
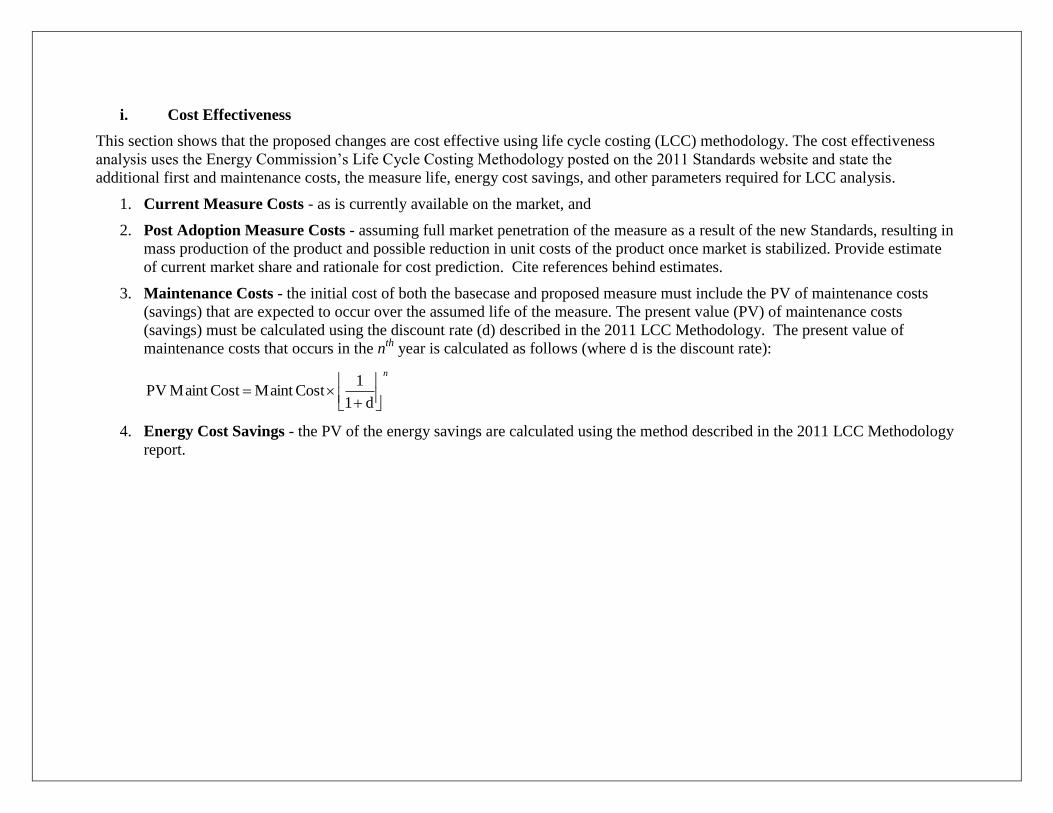
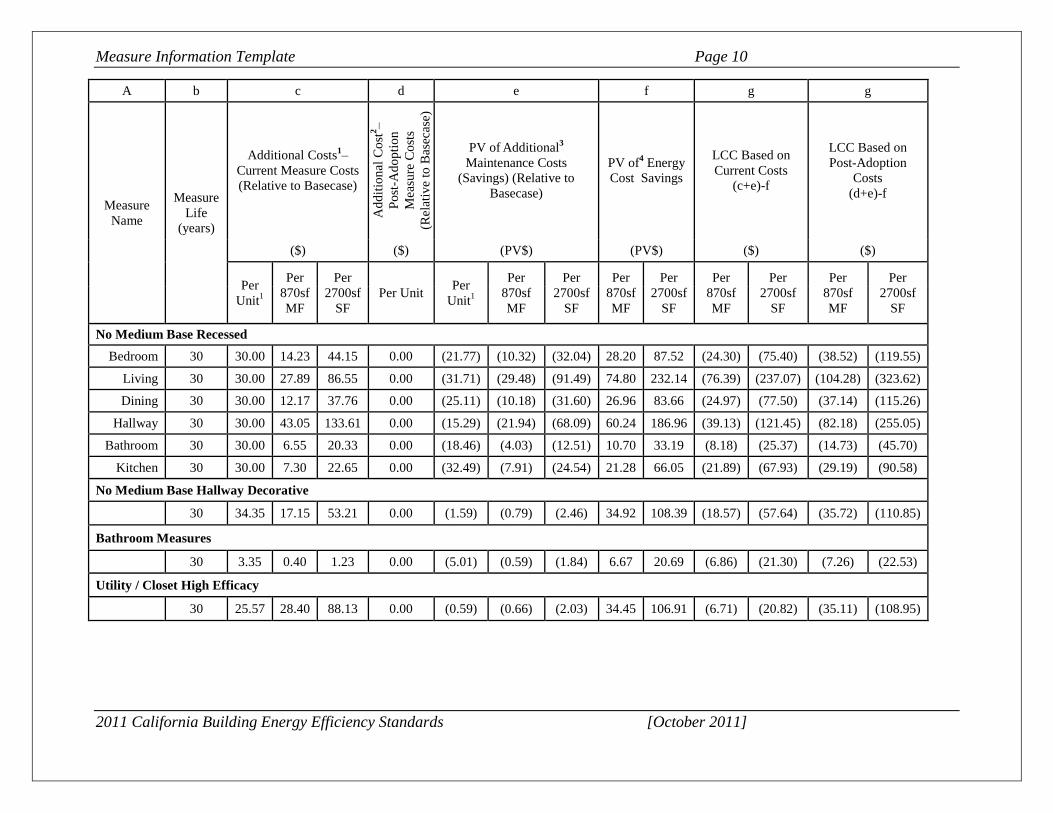
i. Cost Effectiveness
This section shows that the proposed changes are cost effective using life cycle costing (LCC) methodology. The cost effectiveness
analysis uses the Energy Commission’s Life Cycle Costing Methodology posted on the 2011 Standards website and state the
additional first and maintenance costs, the measure life, energy cost savings, and other parameters required for LCC analysis.
1. Current Measure Costs - as is currently available on the market, and
2. Post Adoption Measure Costs - assuming full market penetration of the measure as a result of the new Standards, resulting in
mass production of the product and possible reduction in unit costs of the product once market is stabilized. Provide estimate
of current market share and rationale for cost prediction. Cite references behind estimates.
3. Maintenance Costs - the initial cost of both the basecase and proposed measure must include the PV of maintenance costs
(savings) that are expected to occur over the assumed life of the measure. The present value (PV) of maintenance costs
(savings) must be calculated using the discount rate (d) described in the 2011 LCC Methodology. The present value of
maintenance costs that occurs in the nth
year is calculated as follows (where d is the discount rate):
n
d1
1Cost Maint Cost Maint PV
4. Energy Cost Savings - the PV of the energy savings are calculated using the method described in the 2011 LCC Methodology
report.
Measure Information Template Page 10
2011 California Building Energy Efficiency Standards [October 2011]
A b c d e f g g
Measure
Name
Measure
Life
(years)
Additional Costs1–
Current Measure Costs
(Relative to Basecase)
Ad
dit
ion
al C
ost
2–
Po
st-A
do
pti
on
Mea
sure
Co
sts
(Rel
ativ
e to
Bas
ecas
e)
PV of Additional
3
Maintenance Costs
(Savings) (Relative to
Basecase)
PV of4 Energy
Cost Savings
LCC Based on
Current Costs
(c+e)-f
LCC Based on
Post-Adoption
Costs
(d+e)-f
($) ($) (PV$) (PV$) ($) ($)
Per
Unit1
Per
870sf
MF
Per
2700sf
SF
Per Unit Per
Unit1
Per
870sf
MF
Per
2700sf
SF
Per
870sf
MF
Per
2700sf
SF
Per
870sf
MF
Per
2700sf
SF
Per
870sf
MF
Per
2700sf
SF
No Medium Base Recessed
Bedroom 30 30.00 14.23 44.15 0.00 (21.77) (10.32) (32.04) 28.20 87.52 (24.30) (75.40) (38.52) (119.55)
Living 30 30.00 27.89 86.55 0.00 (31.71) (29.48) (91.49) 74.80 232.14 (76.39) (237.07) (104.28) (323.62)
Dining 30 30.00 12.17 37.76 0.00 (25.11) (10.18) (31.60) 26.96 83.66 (24.97) (77.50) (37.14) (115.26)
Hallway 30 30.00 43.05 133.61 0.00 (15.29) (21.94) (68.09) 60.24 186.96 (39.13) (121.45) (82.18) (255.05)
Bathroom 30 30.00 6.55 20.33 0.00 (18.46) (4.03) (12.51) 10.70 33.19 (8.18) (25.37) (14.73) (45.70)
Kitchen 30 30.00 7.30 22.65 0.00 (32.49) (7.91) (24.54) 21.28 66.05 (21.89) (67.93) (29.19) (90.58)
No Medium Base Hallway Decorative
30 34.35 17.15 53.21 0.00 (1.59) (0.79) (2.46) 34.92 108.39 (18.57) (57.64) (35.72) (110.85)
Bathroom Measures
30 3.35 0.40 1.23 0.00 (5.01) (0.59) (1.84) 6.67 20.69 (6.86) (21.30) (7.26) (22.53)
Utility / Closet High Efficacy
30 25.57 28.40 88.13 0.00 (0.59) (0.66) (2.03) 34.45 106.91 (6.71) (20.82) (35.11) (108.95)
j. Analysis
Tools
This measure is proposed as mandatory, so analysis tools are not relevant, since the
measure would not be subject to whole building performance trade-offs.
k.
Relationship
to Other
Measures
This measure will not have a significant impact on other measures.
Measure Information Template Page 12
2011 California Building Energy Efficiency Standards [October 2011]
2. Methodology
The primary goal of this code change proposal is to simplify the residential lighting requirements
while continuing to improve energy efficient practices. Analysis of existing installed lighting and
hours-of-use data has identified areas where efficiency measures could achieve additional savings.
2.1 Data Collection
The data used in this analysis was collected primarily from two main sources. The 2010 New Home
Energy Survey (CEC, 2010) provided an inventory of all luminaire and lamp types in an 80-dwelling-
unit representative sample of new residential construction in the IOU territories in California. All of
the dwelling units in this sample were permitted under Title 24 2005, representing an example of
residential construction practices using recent code requirements.
In addition, detailed hours of use data was provided by the 2010 Upstream Lighting Program Final
Evaluation Report (CPUC, 2010). Hours of use data available (to date) from the 2010 Upstream
Lighting Program Final Evaluation was limited to compact fluorescent sources. Because the inclusion
of only compact fluorescent hours of use may overlook the use of certain luminaire types such as
bathroom vanity lighting and other decorative lighting that tend to use incandescent and halogen
sources, the 1997 California Baseline Lighting Efficiency Technology Report was also used as a basis
for residential lighting hours of use, because this report included hours of use data from all lamp types
in the residence, including incandescent (CEC, 1997).
These data sets were combined and analyzed in various ways to determine the viability of the various
code change proposals.
Cost information for various lighting products and technologies was also gathered and analyzed for
this analysis. Cost information used is based on retail prices collected from online retailers and large
home improvement stores, with prices verified by industry stakeholders. These prices are appropriate
for residential lighting because they are typically the same prices paid by homeowners or contractors,
i.e. large contractor discounts are not available in all residential projects (as they typically are for
nonresidential projects).
2.2 Energy Savings
To predict the energy savings from the proposed measures, lighting inventory data from the 2010
New Home Energy Survey was combined with average daily hours-of-use data from the 2010
Upstream Lighting Program Final Evaluation Report. Average hours-of-use data was broken down
by room type, and by the number of bathrooms in the dwelling unit. Because the Upstream Lighting
Program Final Evaluation Report did not record square footage for the surveyed dwelling units the
number of bathrooms was used as a proxy for house size in order to compare the data to New Home
Energy Survey Data. Each luminaire and lamp type in the survey inventory was assigned an hours-
of-use number based on the corresponding room type, and the number of bathrooms in the dwelling
unit. Combining these data sets produced annual energy use predictions for each luminaire, and by
extension, for each dwelling unit.
Measure Information Template Page 13
2011 California Building Energy Efficiency Standards [October 2011]
2.3 Lifecycle Cost (LCC) Analysis
HMG calculated lifecycle cost analysis using methodology explained in the California Energy
Commission report Life Cycle Cost Methodology 2013 California Building Energy Efficiency
Standards, written by Architectural Energy Corporation, using the following equation:
–
ΔLCC ΔC – (PVTDV-E * ΔTDVE + PVTDV-G * ΔTDVG)
Where:
ΔLCC change in life-cycle cost
ΔC cost premium associated with the measure, relative to the base case
PVTDV-E present value of a TDV unit of electricity (3% discount rate)
PVTDV-G present value of a TDV unit of gas (3% discount rate)
ΔTDVE TDV of electricity
ΔTDVG TDV of gas
We used a 30-year lifecycle as per the LCC methodology for residential lighting control measures,
taking into account rated life of the various lighting technologies. We have not included any
interactions effects from the proposed measure (e.g. reductions in air conditioning energy, or
increases in heating energy).
2.4 Statewide Savings Estimates
The statewide energy savings associated with the proposed measures will be calculated by
multiplying the per unit estimate with the statewide estimate of new construction in 2014. Details on
the method and data source of the residential construction forecast are in Appendix section 6.1.
2.5 Stakeholder Meeting Process
All of the main approaches, assumptions and methods of analysis used in this proposal have been
presented for review at one of three public Lighting Stakeholder Meetings.
At each meeting, the utilities' CASE team invited feedback on the proposed language and analysis
thus far, and sent out a summary of what was discussed at the meeting, along with a summary of
outstanding questions and issues.
A record of the Stakeholder Meeting presentations, summaries and other supporting documents can be
found at www.calcodesgroup.com. Stakeholder meetings were held on the following dates and
locations:
First Lighting Stakeholder Meeting: March 18th, 2010, Pacific Energy Center, San Francisco,
CA
Second Lighting Stakeholder Meeting: September 21st 2010, California Lighting Technology
Center, Davis, CA
Measure Information Template Page 14
2011 California Building Energy Efficiency Standards [October 2011]
Third Lighting Stakeholder Meeting: February 24th, 2011, UC Davis Alumni Center, Davis
CA
In addition to the Stakeholder Meetings, five Stakeholder Work Sessions were conducted to allow
detailed review of specific technical issues. These meetings were held on the following dates:
October 29th 2010: Residential lighting stakeholder work session
Measure Information Template Page 15
2011 California Building Energy Efficiency Standards [October 2011]
3. Analysis and Results
The sections below outline the analysis and results from the various data sources, cost effectiveness
assessments, and recommended proposals for residential lighting measures.
3.1 Analysis of 2010 New Home Energy Survey Lighting Data
As described in section 2.1, above, the data collected by the 2010 New Home Energy Survey
represents the best available data on how recent code requirements are being applied in residential
construction, as well as snapshot of typical residential lighting practice. HMG obtained the raw
survey data from the survey authors, and analyzed the lighting inventory of the surveyed homes in a
wide variety of ways.
3.1.1 Total Lighting Power Density
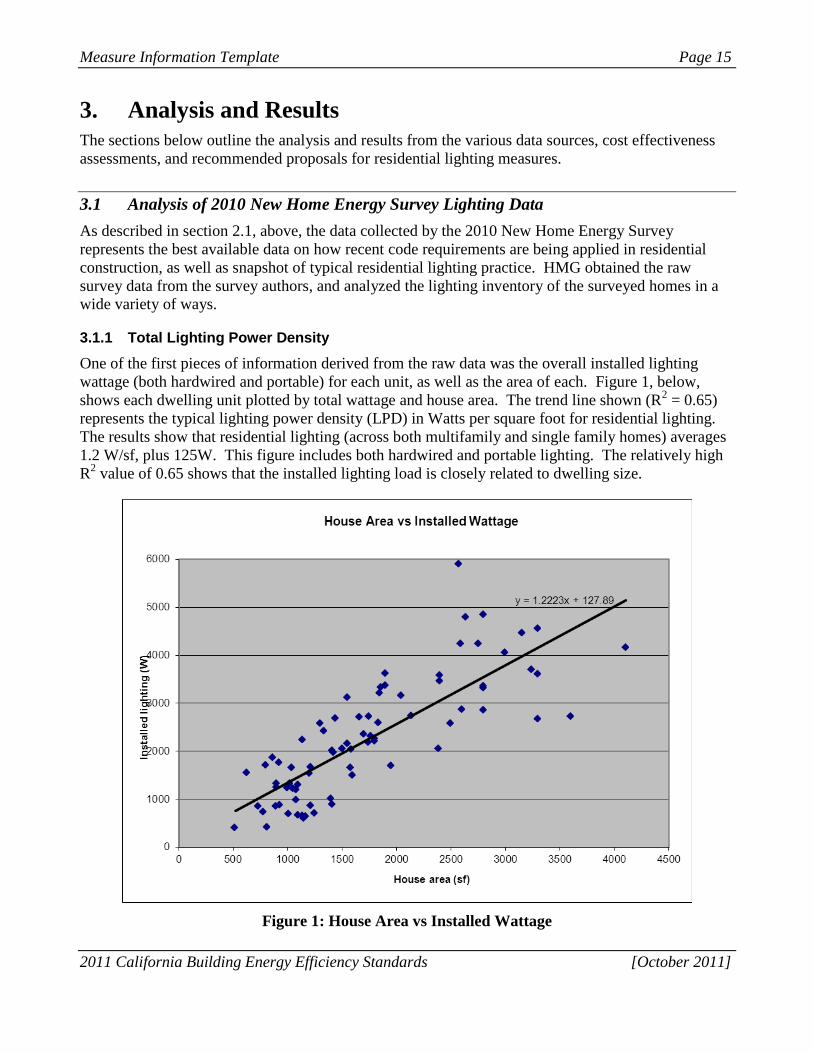
One of the first pieces of information derived from the raw data was the overall installed lighting
wattage (both hardwired and portable) for each unit, as well as the area of each. Figure 1, below,
shows each dwelling unit plotted by total wattage and house area. The trend line shown (R2 = 0.65)
represents the typical lighting power density (LPD) in Watts per square foot for residential lighting.
The results show that residential lighting (across both multifamily and single family homes) averages
1.2 W/sf, plus 125W. This figure includes both hardwired and portable lighting. The relatively high
R2 value of 0.65 shows that the installed lighting load is closely related to dwelling size.
Figure 1: House Area vs Installed Wattage
Measure Information Template Page 16
2011 California Building Energy Efficiency Standards [October 2011]
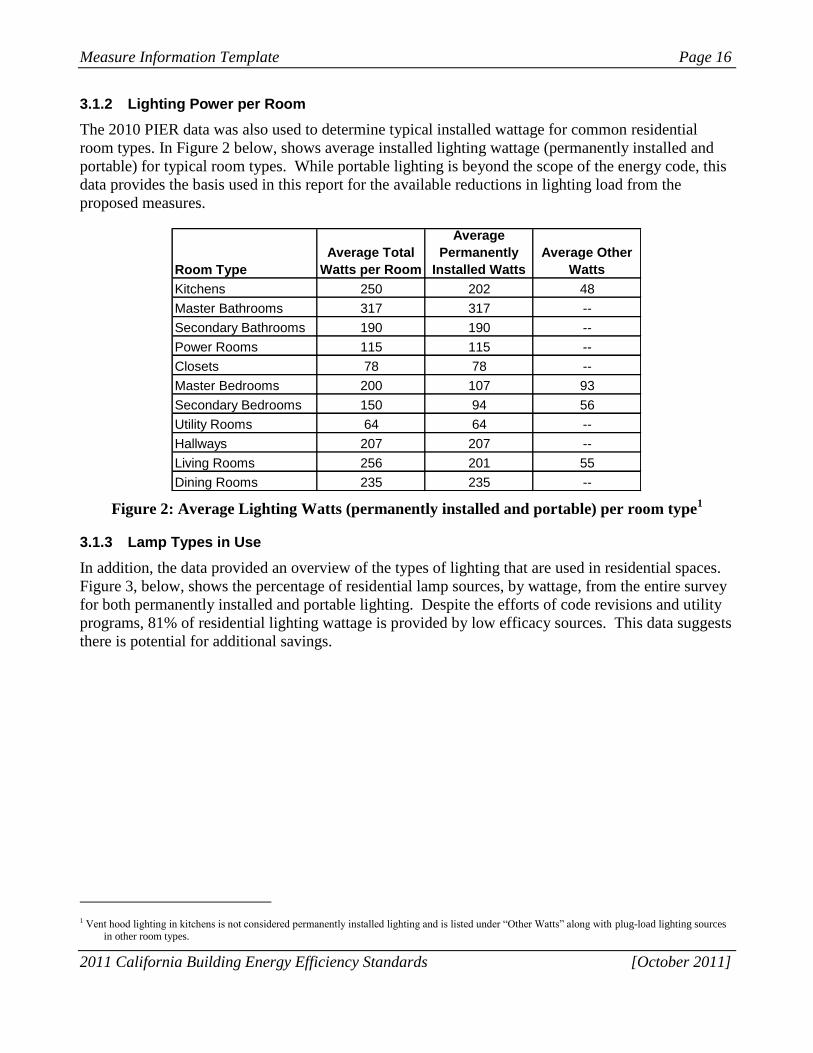
3.1.2 Lighting Power per Room
The 2010 PIER data was also used to determine typical installed wattage for common residential
room types. In Figure 2 below, shows average installed lighting wattage (permanently installed and
portable) for typical room types. While portable lighting is beyond the scope of the energy code, this
data provides the basis used in this report for the available reductions in lighting load from the
proposed measures.
Figure 2: Average Lighting Watts (permanently installed and portable) per room type1
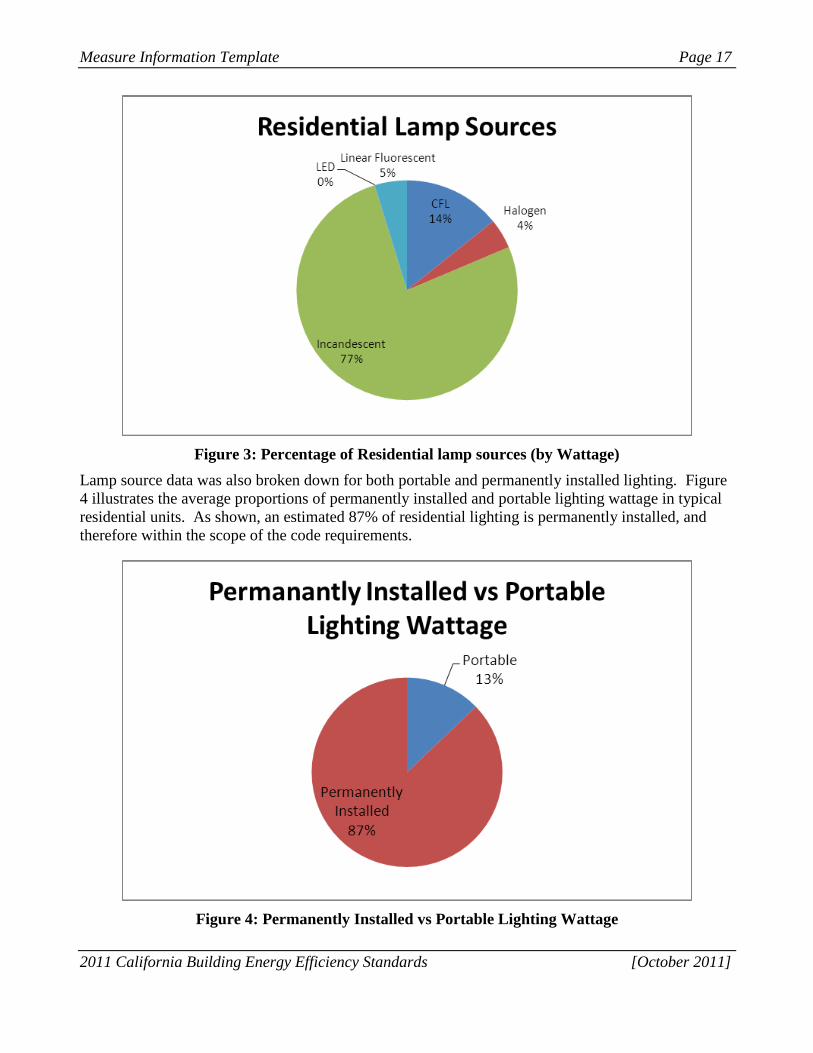
3.1.3 Lamp Types in Use
In addition, the data provided an overview of the types of lighting that are used in residential spaces.
Figure 3, below, shows the percentage of residential lamp sources, by wattage, from the entire survey
for both permanently installed and portable lighting. Despite the efforts of code revisions and utility
programs, 81% of residential lighting wattage is provided by low efficacy sources. This data suggests
there is potential for additional savings.
1 Vent hood lighting in kitchens is not considered permanently installed lighting and is listed under “Other Watts” along with plug-load lighting sources
in other room types.
Room Type
Average Total
Watts per Room
Average
Permanently
Installed Watts
Average Other
Watts
Kitchens 250 202 48
Master Bathrooms 317 317 --
Secondary Bathrooms 190 190 --
Power Rooms 115 115 --
Closets 78 78 --
Master Bedrooms 200 107 93
Secondary Bedrooms 150 94 56
Utility Rooms 64 64 --
Hallways 207 207 --
Living Rooms 256 201 55
Dining Rooms 235 235 --
Measure Information Template Page 17
2011 California Building Energy Efficiency Standards [October 2011]
Figure 3: Percentage of Residential lamp sources (by Wattage)
Lamp source data was also broken down for both portable and permanently installed lighting. Figure
4 illustrates the average proportions of permanently installed and portable lighting wattage in typical
residential units. As shown, an estimated 87% of residential lighting is permanently installed, and
therefore within the scope of the code requirements.
Figure 4: Permanently Installed vs Portable Lighting Wattage
Measure Information Template Page 18
2011 California Building Energy Efficiency Standards [October 2011]
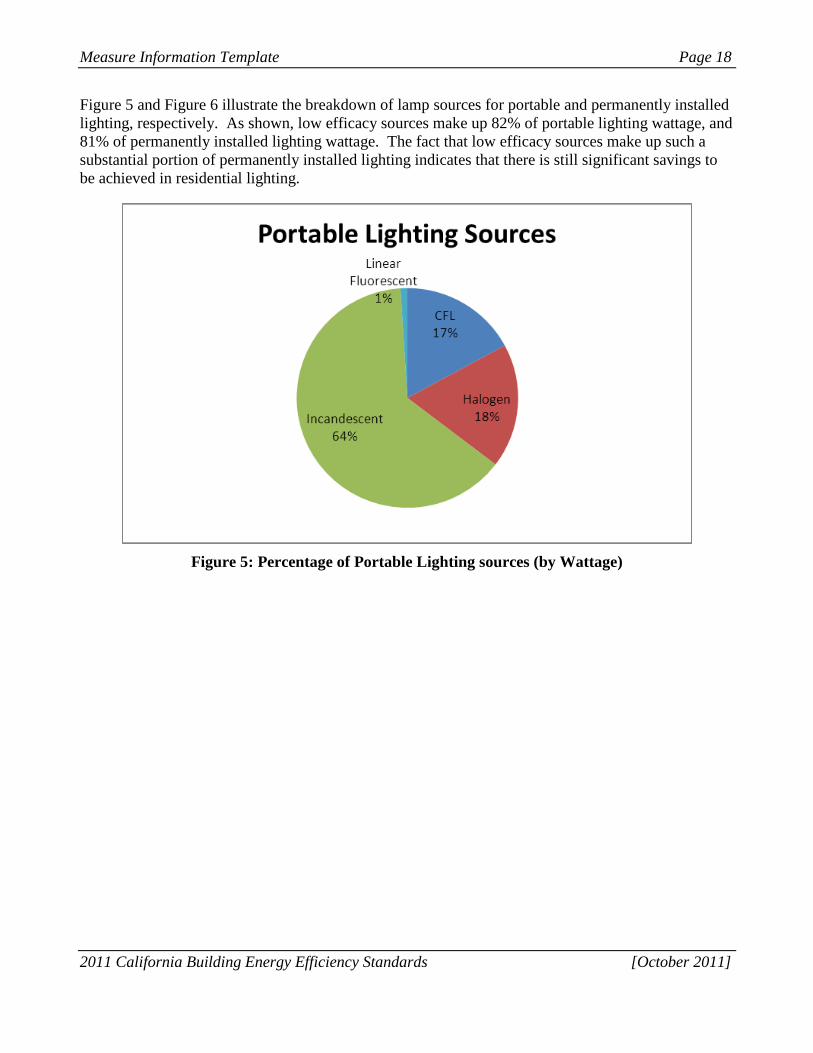
Figure 5 and Figure 6 illustrate the breakdown of lamp sources for portable and permanently installed
lighting, respectively. As shown, low efficacy sources make up 82% of portable lighting wattage, and
81% of permanently installed lighting wattage. The fact that low efficacy sources make up such a
substantial portion of permanently installed lighting indicates that there is still significant savings to
be achieved in residential lighting.
Figure 5: Percentage of Portable Lighting sources (by Wattage)
Measure Information Template Page 19
2011 California Building Energy Efficiency Standards [October 2011]
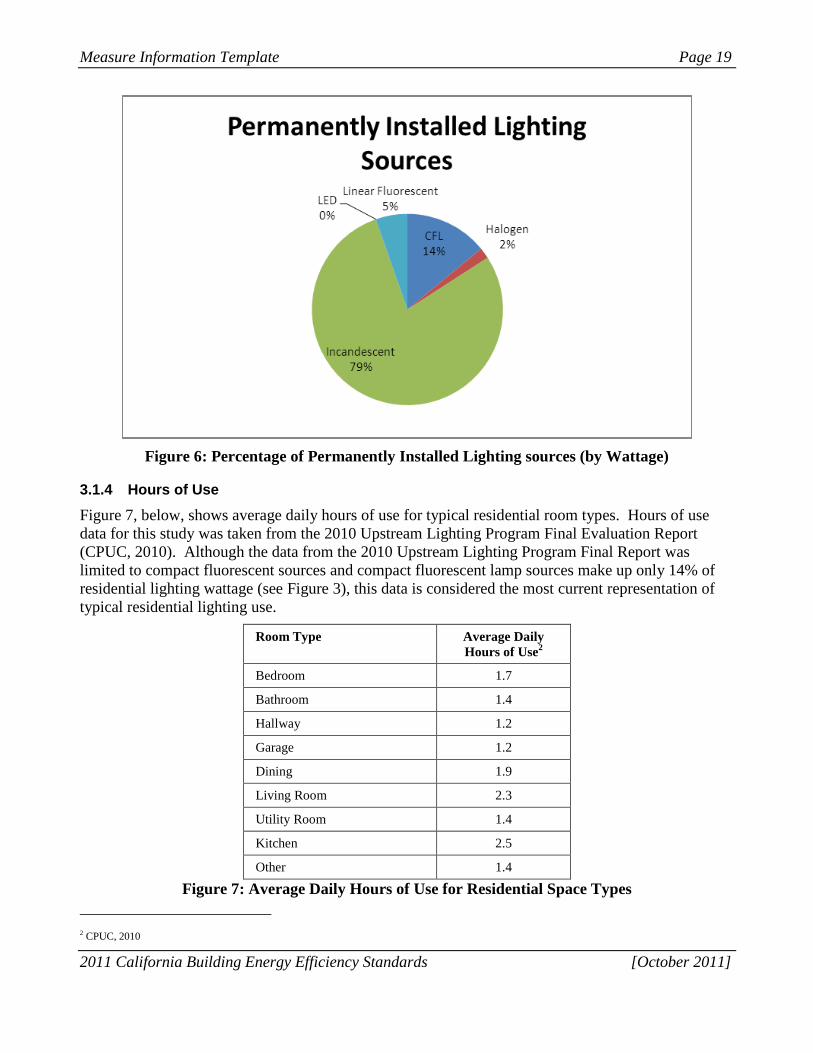
Figure 6: Percentage of Permanently Installed Lighting sources (by Wattage)
3.1.4 Hours of Use
Figure 7, below, shows average daily hours of use for typical residential room types. Hours of use
data for this study was taken from the 2010 Upstream Lighting Program Final Evaluation Report
(CPUC, 2010). Although the data from the 2010 Upstream Lighting Program Final Report was
limited to compact fluorescent sources and compact fluorescent lamp sources make up only 14% of
residential lighting wattage (see Figure 3), this data is considered the most current representation of
typical residential lighting use.
Room Type Average Daily
Hours of Use2
Bedroom 1.7
Bathroom 1.4
Hallway 1.2
Garage 1.2
Dining 1.9
Living Room 2.3
Utility Room 1.4
Kitchen 2.5
Other 1.4
Figure 7: Average Daily Hours of Use for Residential Space Types
2 CPUC, 2010
Measure Information Template Page 20
2011 California Building Energy Efficiency Standards [October 2011]
3.2 Energy Savings
This section sets out the energy savings available from each of the room categories used in Title 24.
For convenience, we have summarized the proposed changes to code at the end of each section.
Note that Title 24 does not break out “hallways” as a separate room type, but in this proposal we have
identified specific requirements that we believe are appropriate for hallway lighting.
3.2.1 Recessed Downlights
This section outlines the current use of recessed downlights in residential lighting, as well as the
proposed code change recommendation.
Current code requires high efficacy lighting in all residential spaces, unless the luminaires are
controlled by a dimmer. Based on this existing requirement and the increasing availability of a wide
range of LED products, we had originally considered requiring high efficacy lighting for all
permanently installed residential lighting. However, feedback from stakeholders suggested that there
are not sufficient high efficacy products currently available to replace all low efficacy lighting
applications. As a result, we developed a proposed measure for only recessed downlights, a luminaire
type with proven high efficacy options using both compact fluorescent and LED sources.
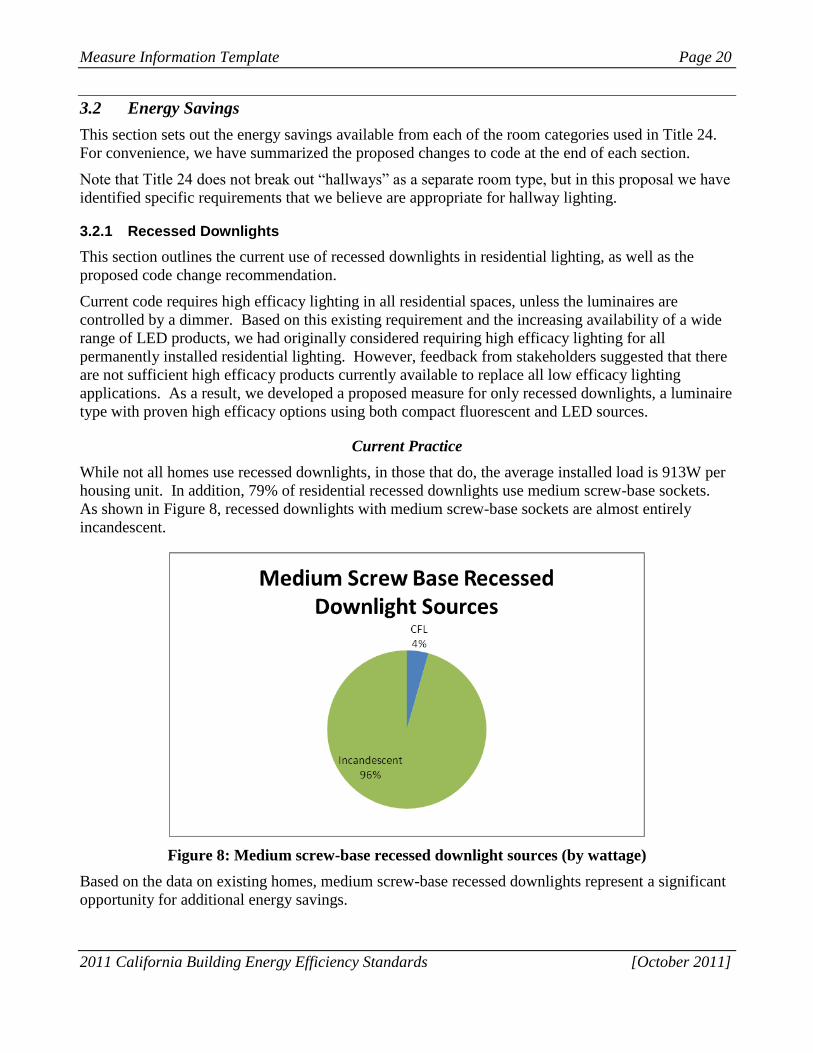
Current Practice
While not all homes use recessed downlights, in those that do, the average installed load is 913W per
housing unit. In addition, 79% of residential recessed downlights use medium screw-base sockets.
As shown in Figure 8, recessed downlights with medium screw-base sockets are almost entirely
incandescent.
Figure 8: Medium screw-base recessed downlight sources (by wattage)
Based on the data on existing homes, medium screw-base recessed downlights represent a significant
opportunity for additional energy savings.
Measure Information Template Page 21
2011 California Building Energy Efficiency Standards [October 2011]
Recommendations
Based on the findings shown above, as well as the input from stakeholders, and the cost effectiveness
data in section 3.3, below, we are proposing the following luminaire requirement:
Recessed downlights shall not contain medium screw base sockets.
This requirement would provide the flexibility to encourage high efficacy recessed downlights, while
still allowing for low efficacy options such as pin base MR-16 luminaires. This requirement would
also allow for the use of GU-24 base recessed downlights if they are combined with a manual dimmer
or vacancy sensor.
3.2.2 Bathroom Lighting
This section outlines the typical current practice for residential bathroom lighting, as well as the
proposed code change recommendations.
Current Practice
Using data from the 2010 New Home Energy Survey, typical residential bathroom lighting was
assessed. The 80-dwelling-unit sample contained 71 master bathrooms, 100 "secondary" (non-
master) full baths, and 25 powder rooms. The average installed lighting wattage across all bathrooms
types is 227 Watts. Master bathrooms have an average of 317 Watts, while secondary bathrooms
have an average of 190 Watts, and powder rooms have an average of 115 Watts.
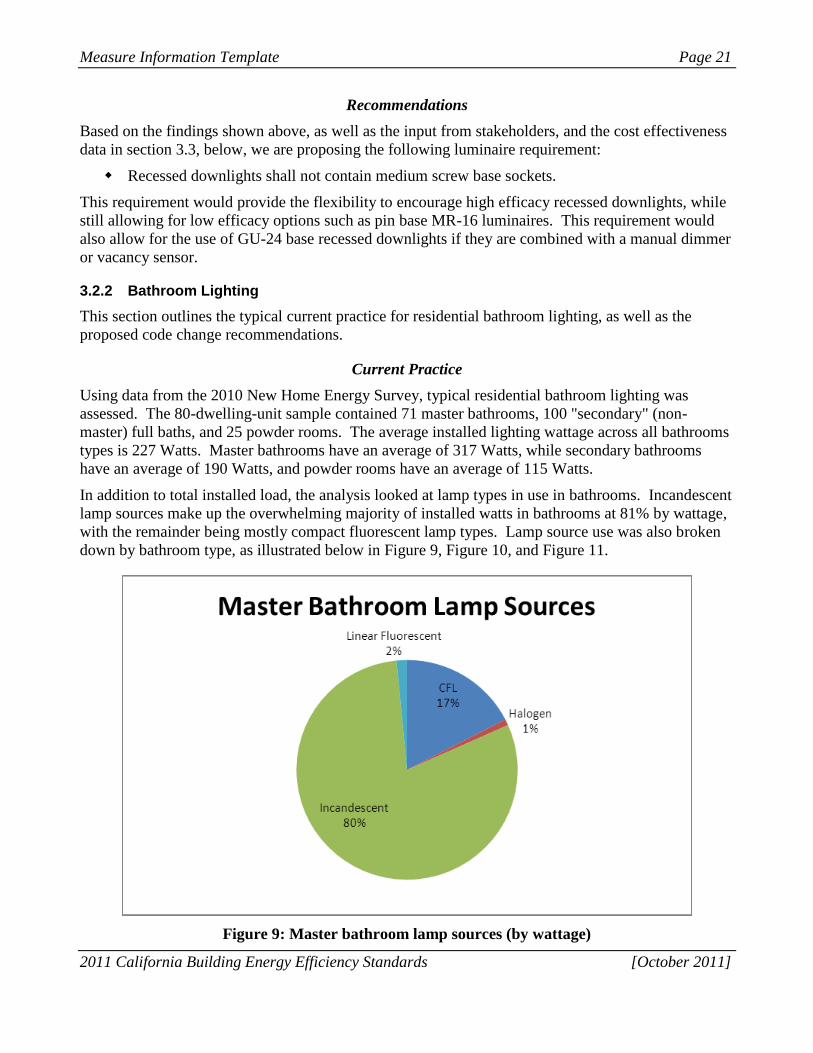
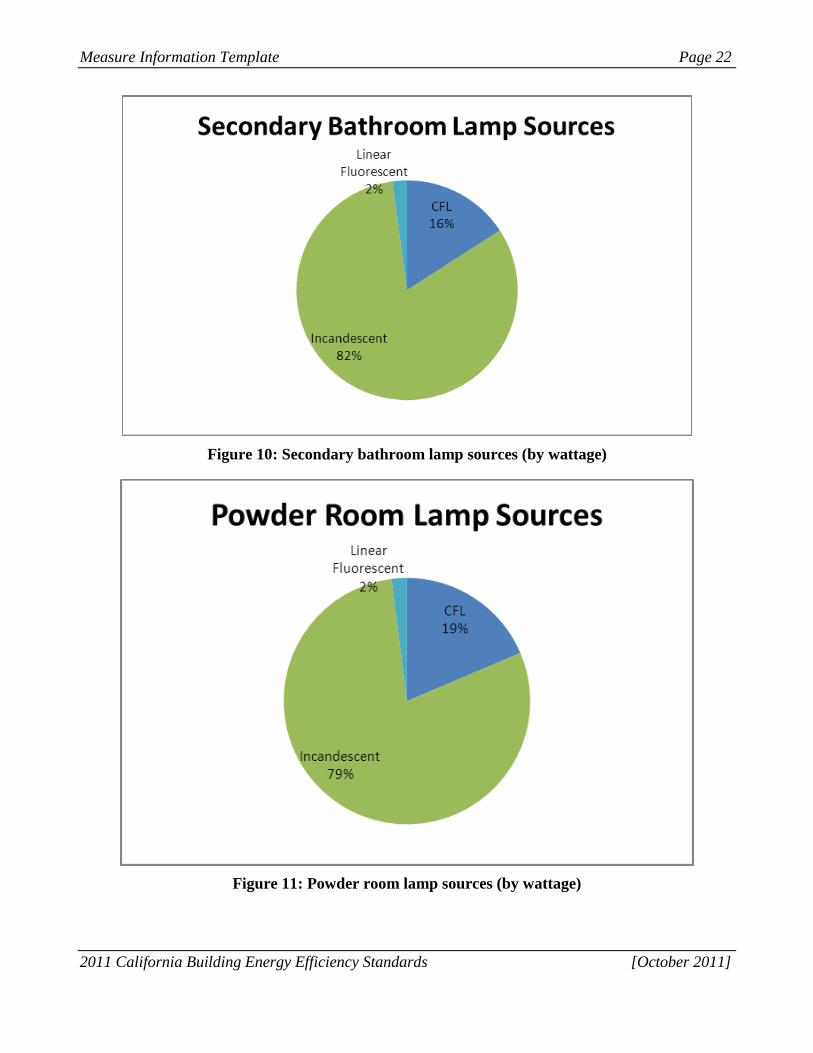
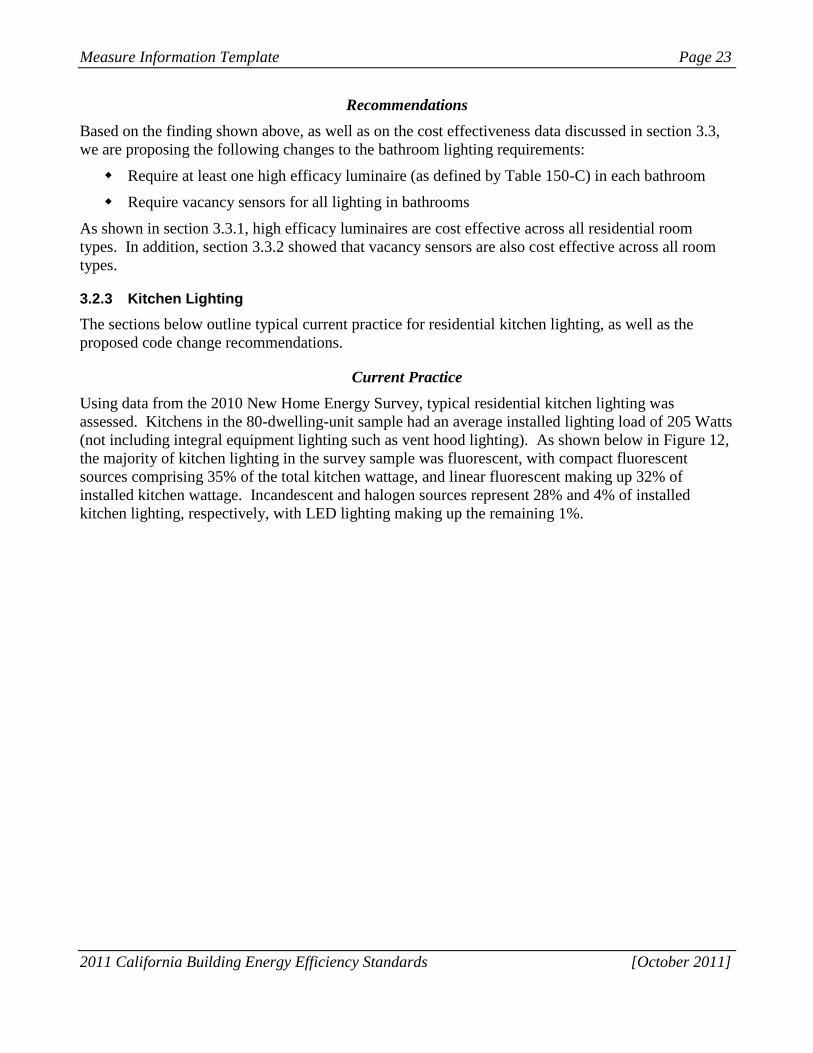
In addition to total installed load, the analysis looked at lamp types in use in bathrooms. Incandescent
lamp sources make up the overwhelming majority of installed watts in bathrooms at 81% by wattage,
with the remainder being mostly compact fluorescent lamp types. Lamp source use was also broken
down by bathroom type, as illustrated below in Figure 9, Figure 10, and Figure 11.
Figure 9: Master bathroom lamp sources (by wattage)
Measure Information Template Page 22
2011 California Building Energy Efficiency Standards [October 2011]
Figure 10: Secondary bathroom lamp sources (by wattage)
Figure 11: Powder room lamp sources (by wattage)
Measure Information Template Page 23
2011 California Building Energy Efficiency Standards [October 2011]
Recommendations
Based on the finding shown above, as well as on the cost effectiveness data discussed in section 3.3,
we are proposing the following changes to the bathroom lighting requirements:
Require at least one high efficacy luminaire (as defined by Table 150-C) in each bathroom
Require vacancy sensors for all lighting in bathrooms
As shown in section 3.3.1, high efficacy luminaires are cost effective across all residential room
types. In addition, section 3.3.2 showed that vacancy sensors are also cost effective across all room
types.
3.2.3 Kitchen Lighting
The sections below outline typical current practice for residential kitchen lighting, as well as the
proposed code change recommendations.
Current Practice
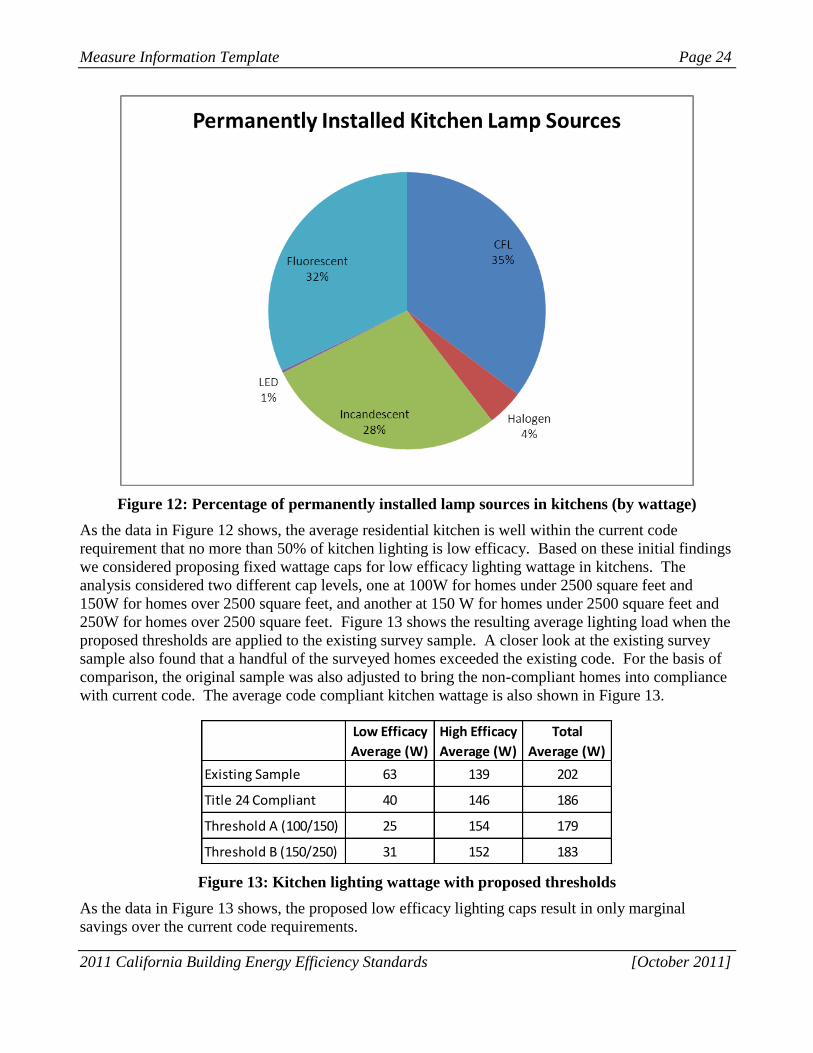
Using data from the 2010 New Home Energy Survey, typical residential kitchen lighting was
assessed. Kitchens in the 80-dwelling-unit sample had an average installed lighting load of 205 Watts
(not including integral equipment lighting such as vent hood lighting). As shown below in Figure 12,
the majority of kitchen lighting in the survey sample was fluorescent, with compact fluorescent
sources comprising 35% of the total kitchen wattage, and linear fluorescent making up 32% of
installed kitchen wattage. Incandescent and halogen sources represent 28% and 4% of installed
kitchen lighting, respectively, with LED lighting making up the remaining 1%.
Measure Information Template Page 24
2011 California Building Energy Efficiency Standards [October 2011]
Figure 12: Percentage of permanently installed lamp sources in kitchens (by wattage)
As the data in Figure 12 shows, the average residential kitchen is well within the current code
requirement that no more than 50% of kitchen lighting is low efficacy. Based on these initial findings
we considered proposing fixed wattage caps for low efficacy lighting wattage in kitchens. The
analysis considered two different cap levels, one at 100W for homes under 2500 square feet and
150W for homes over 2500 square feet, and another at 150 W for homes under 2500 square feet and
250W for homes over 2500 square feet. Figure 13 shows the resulting average lighting load when the
proposed thresholds are applied to the existing survey sample. A closer look at the existing survey
sample also found that a handful of the surveyed homes exceeded the existing code. For the basis of
comparison, the original sample was also adjusted to bring the non-compliant homes into compliance
with current code. The average code compliant kitchen wattage is also shown in Figure 13.
Figure 13: Kitchen lighting wattage with proposed thresholds
As the data in Figure 13 shows, the proposed low efficacy lighting caps result in only marginal
savings over the current code requirements.
Low Efficacy
Average (W)
High Efficacy
Average (W)
Total
Average (W)
Existing Sample 63 139 202
Title 24 Compliant 40 146 186
Threshold A (100/150) 25 154 179
Threshold B (150/250) 31 152 183
Measure Information Template Page 25
2011 California Building Energy Efficiency Standards [October 2011]
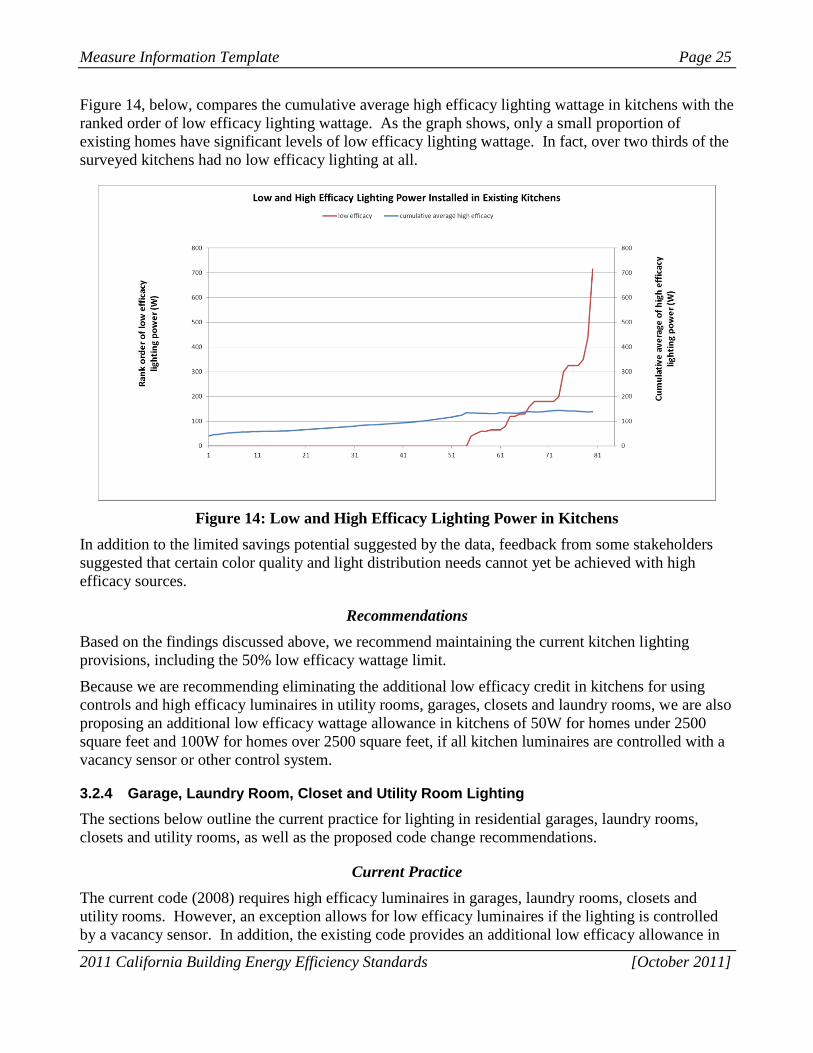
Figure 14, below, compares the cumulative average high efficacy lighting wattage in kitchens with the
ranked order of low efficacy lighting wattage. As the graph shows, only a small proportion of
existing homes have significant levels of low efficacy lighting wattage. In fact, over two thirds of the
surveyed kitchens had no low efficacy lighting at all.
Figure 14: Low and High Efficacy Lighting Power in Kitchens
In addition to the limited savings potential suggested by the data, feedback from some stakeholders
suggested that certain color quality and light distribution needs cannot yet be achieved with high
efficacy sources.
Recommendations
Based on the findings discussed above, we recommend maintaining the current kitchen lighting
provisions, including the 50% low efficacy wattage limit.
Because we are recommending eliminating the additional low efficacy credit in kitchens for using
controls and high efficacy luminaires in utility rooms, garages, closets and laundry rooms, we are also
proposing an additional low efficacy wattage allowance in kitchens of 50W for homes under 2500
square feet and 100W for homes over 2500 square feet, if all kitchen luminaires are controlled with a
vacancy sensor or other control system.
3.2.4 Garage, Laundry Room, Closet and Utility Room Lighting
The sections below outline the current practice for lighting in residential garages, laundry rooms,
closets and utility rooms, as well as the proposed code change recommendations.
Current Practice
The current code (2008) requires high efficacy luminaires in garages, laundry rooms, closets and
utility rooms. However, an exception allows for low efficacy luminaires if the lighting is controlled
by a vacancy sensor. In addition, the existing code provides an additional low efficacy allowance in
Measure Information Template Page 26
2011 California Building Energy Efficiency Standards [October 2011]
kitchens if all garage, laundry room, closet and utility room lighting is high efficacy and controlled by
vacancy sensors.
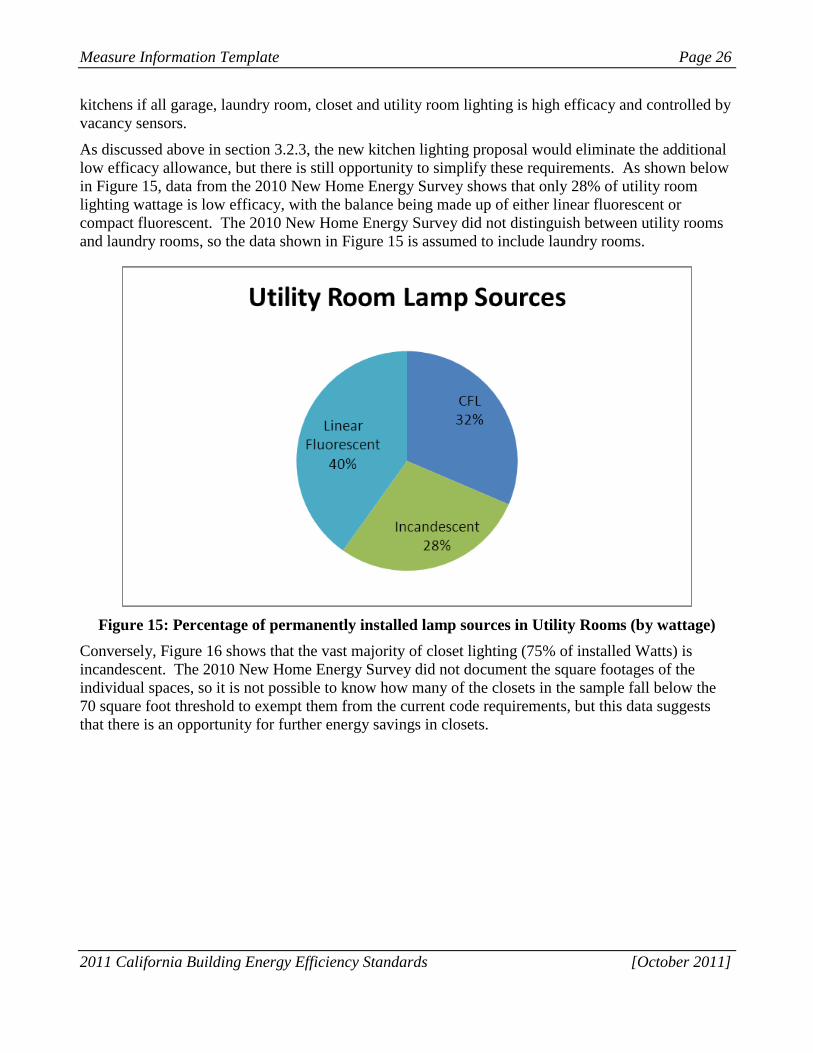
As discussed above in section 3.2.3, the new kitchen lighting proposal would eliminate the additional
low efficacy allowance, but there is still opportunity to simplify these requirements. As shown below
in Figure 15, data from the 2010 New Home Energy Survey shows that only 28% of utility room
lighting wattage is low efficacy, with the balance being made up of either linear fluorescent or
compact fluorescent. The 2010 New Home Energy Survey did not distinguish between utility rooms
and laundry rooms, so the data shown in Figure 15 is assumed to include laundry rooms.
Figure 15: Percentage of permanently installed lamp sources in Utility Rooms (by wattage)
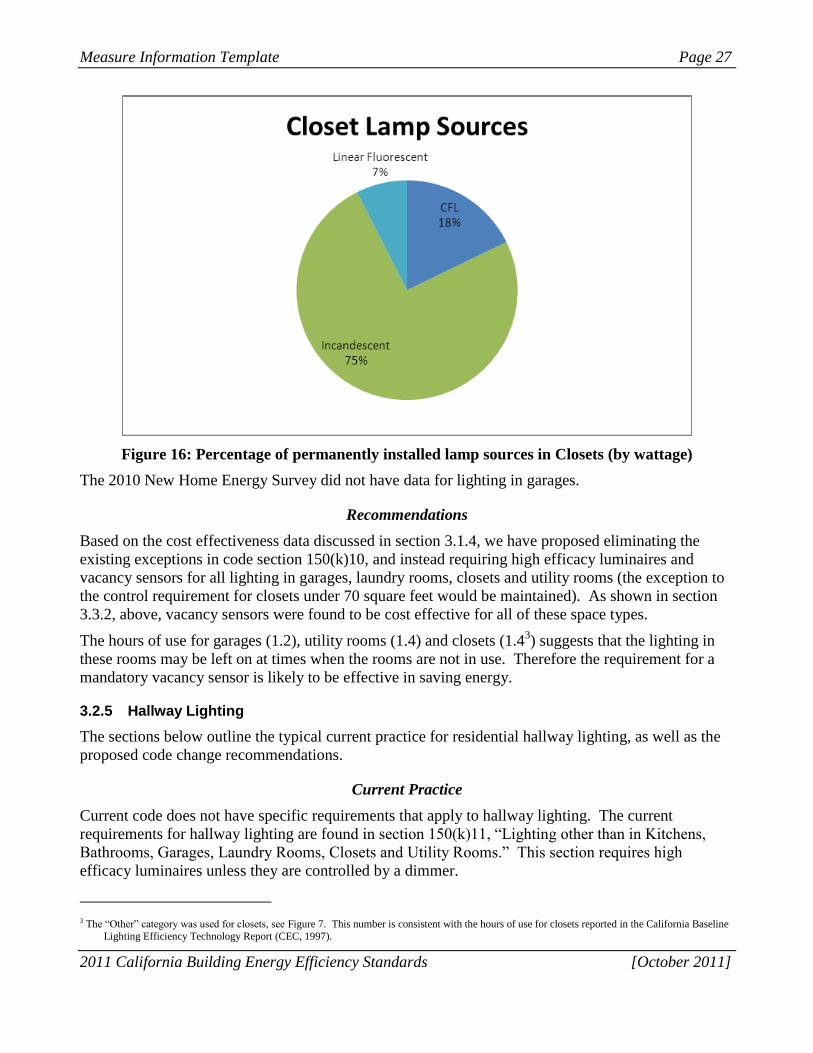
Conversely, Figure 16 shows that the vast majority of closet lighting (75% of installed Watts) is
incandescent. The 2010 New Home Energy Survey did not document the square footages of the
individual spaces, so it is not possible to know how many of the closets in the sample fall below the
70 square foot threshold to exempt them from the current code requirements, but this data suggests
that there is an opportunity for further energy savings in closets.
Measure Information Template Page 27
2011 California Building Energy Efficiency Standards [October 2011]
Figure 16: Percentage of permanently installed lamp sources in Closets (by wattage)
The 2010 New Home Energy Survey did not have data for lighting in garages.
Recommendations
Based on the cost effectiveness data discussed in section 3.1.4, we have proposed eliminating the
existing exceptions in code section 150(k)10, and instead requiring high efficacy luminaires and
vacancy sensors for all lighting in garages, laundry rooms, closets and utility rooms (the exception to
the control requirement for closets under 70 square feet would be maintained). As shown in section
3.3.2, above, vacancy sensors were found to be cost effective for all of these space types.
The hours of use for garages (1.2), utility rooms (1.4) and closets (1.43) suggests that the lighting in
these rooms may be left on at times when the rooms are not in use. Therefore the requirement for a
mandatory vacancy sensor is likely to be effective in saving energy.
3.2.5 Hallway Lighting
The sections below outline the typical current practice for residential hallway lighting, as well as the
proposed code change recommendations.
Current Practice
Current code does not have specific requirements that apply to hallway lighting. The current
requirements for hallway lighting are found in section 150(k)11, “Lighting other than in Kitchens,
Bathrooms, Garages, Laundry Rooms, Closets and Utility Rooms.” This section requires high
efficacy luminaires unless they are controlled by a dimmer.
3 The “Other” category was used for closets, see Figure 7. This number is consistent with the hours of use for closets reported in the California Baseline
Lighting Efficiency Technology Report (CEC, 1997).
Measure Information Template Page 28
2011 California Building Energy Efficiency Standards [October 2011]
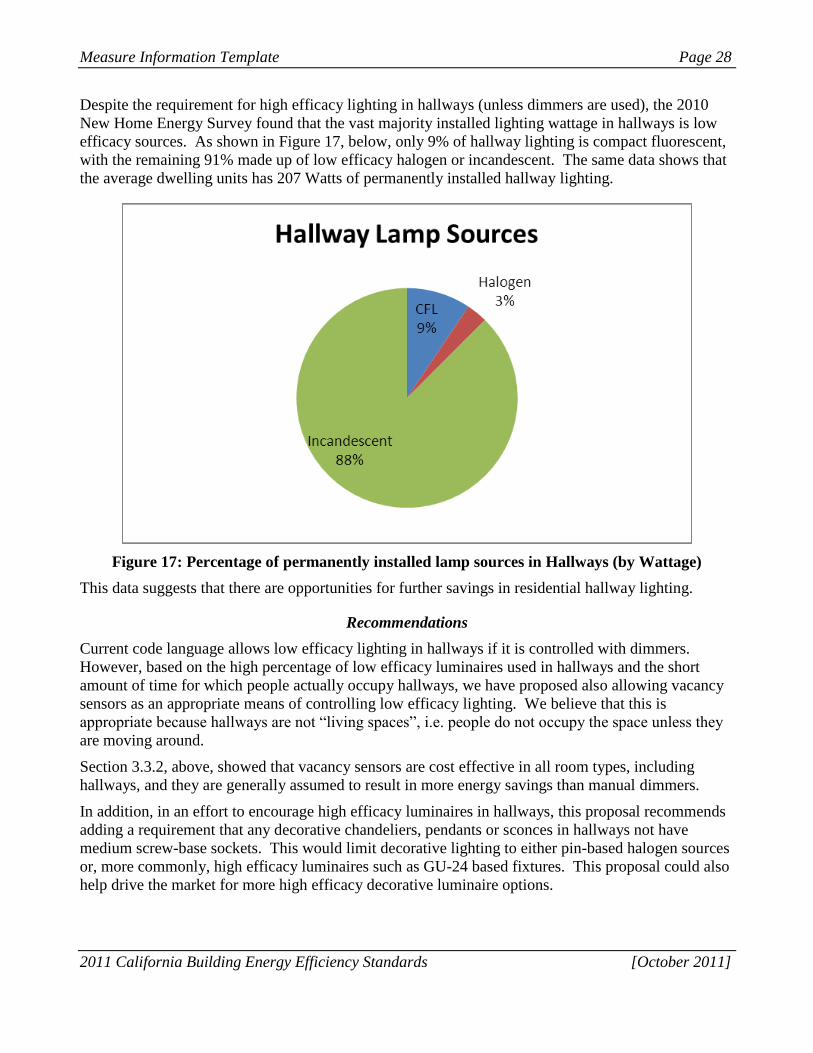
Despite the requirement for high efficacy lighting in hallways (unless dimmers are used), the 2010
New Home Energy Survey found that the vast majority installed lighting wattage in hallways is low
efficacy sources. As shown in Figure 17, below, only 9% of hallway lighting is compact fluorescent,
with the remaining 91% made up of low efficacy halogen or incandescent. The same data shows that
the average dwelling units has 207 Watts of permanently installed hallway lighting.
Figure 17: Percentage of permanently installed lamp sources in Hallways (by Wattage)
This data suggests that there are opportunities for further savings in residential hallway lighting.
Recommendations
Current code language allows low efficacy lighting in hallways if it is controlled with dimmers.
However, based on the high percentage of low efficacy luminaires used in hallways and the short
amount of time for which people actually occupy hallways, we have proposed also allowing vacancy
sensors as an appropriate means of controlling low efficacy lighting. We believe that this is
appropriate because hallways are not “living spaces”, i.e. people do not occupy the space unless they
are moving around.
Section 3.3.2, above, showed that vacancy sensors are cost effective in all room types, including
hallways, and they are generally assumed to result in more energy savings than manual dimmers.
In addition, in an effort to encourage high efficacy luminaires in hallways, this proposal recommends
adding a requirement that any decorative chandeliers, pendants or sconces in hallways not have
medium screw-base sockets. This would limit decorative lighting to either pin-based halogen sources
or, more commonly, high efficacy luminaires such as GU-24 based fixtures. This proposal could also
help drive the market for more high efficacy decorative luminaire options.
Measure Information Template Page 29
2011 California Building Energy Efficiency Standards [October 2011]
3.3 Cost Effectiveness and Statewide Savings
The cost effectiveness of the proposed residential lighting requirements is examined below. Analysis
of cost effectiveness is based on average hours of lighting use for each type of space.
3.3.1 Cost Effectiveness of Luminaires
Although high efficacy luminaires have been proven cost effective in previous code cycles, cost
effectiveness for various high efficacy luminaire types was analyzed for this proposal based on new
product cost and energy cost data. The analysis includes basic approaches like pin-base compact
fluorescent luminaires, but it also includes more specialized or advanced technologies like decorative
LED pendants, LED under-cabinet lighting and LED alternatives to halogen PAR and reflector lamps.
Cost effectiveness of dimmers and vacancy sensors was also examined.
Each luminaire and control type was analyzed by room type based on the hours of use data shown
above in Figure 7. Cost effectiveness analysis is a per-luminaire assessment, based on a 30-year life
cycle for residential measures, and use conservative average TDV values to estimate savings. As
described in section 2.1, cost data is based on retail pricing, and confirmed by lighting industry
stakeholders. The retail pricing is assumed to be a conservative cost estimate because contractors and
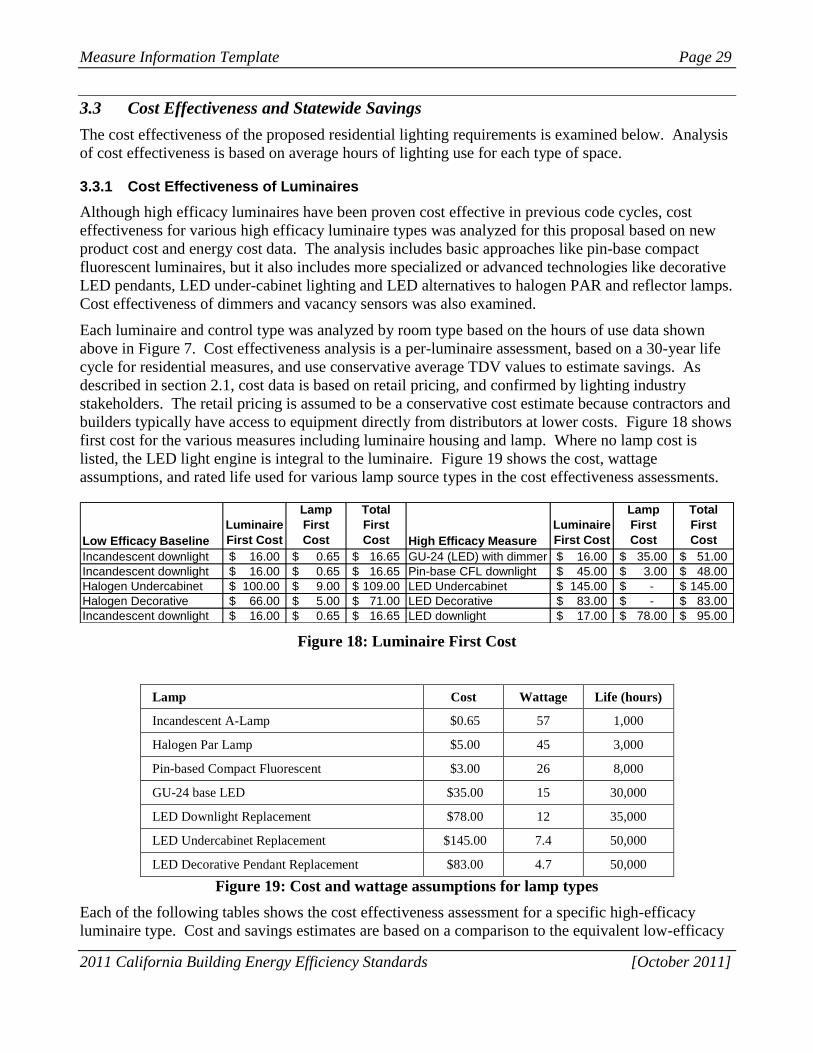
builders typically have access to equipment directly from distributors at lower costs. Figure 18 shows
first cost for the various measures including luminaire housing and lamp. Where no lamp cost is
listed, the LED light engine is integral to the luminaire. Figure 19 shows the cost, wattage
assumptions, and rated life used for various lamp source types in the cost effectiveness assessments.
Figure 18: Luminaire First Cost
Lamp Cost Wattage Life (hours)
Incandescent A-Lamp $0.65 57 1,000
Halogen Par Lamp $5.00 45 3,000
Pin-based Compact Fluorescent $3.00 26 8,000
GU-24 base LED $35.00 15 30,000
LED Downlight Replacement $78.00 12 35,000
LED Undercabinet Replacement $145.00 7.4 50,000
LED Decorative Pendant Replacement $83.00 4.7 50,000
Figure 19: Cost and wattage assumptions for lamp types
Each of the following tables shows the cost effectiveness assessment for a specific high-efficacy
luminaire type. Cost and savings estimates are based on a comparison to the equivalent low-efficacy
Low Efficacy Baseline
Luminaire
First Cost
Lamp
First
Cost
Total
First
Cost High Efficacy Measure
Luminaire
First Cost
Lamp
First
Cost
Total
First
Cost
Incandescent downlight 16.00$ 0.65$ 16.65$ GU-24 (LED) with dimmer 16.00$ 35.00$ 51.00$
Incandescent downlight 16.00$ 0.65$ 16.65$ Pin-base CFL downlight 45.00$ 3.00$ 48.00$
Halogen Undercabinet 100.00$ 9.00$ 109.00$ LED Undercabinet 145.00$ -$ 145.00$
Halogen Decorative 66.00$ 5.00$ 71.00$ LED Decorative 83.00$ -$ 83.00$
Incandescent downlight 16.00$ 0.65$ 16.65$ LED downlight 17.00$ 78.00$ 95.00$
Measure Information Template Page 30
2011 California Building Energy Efficiency Standards [October 2011]
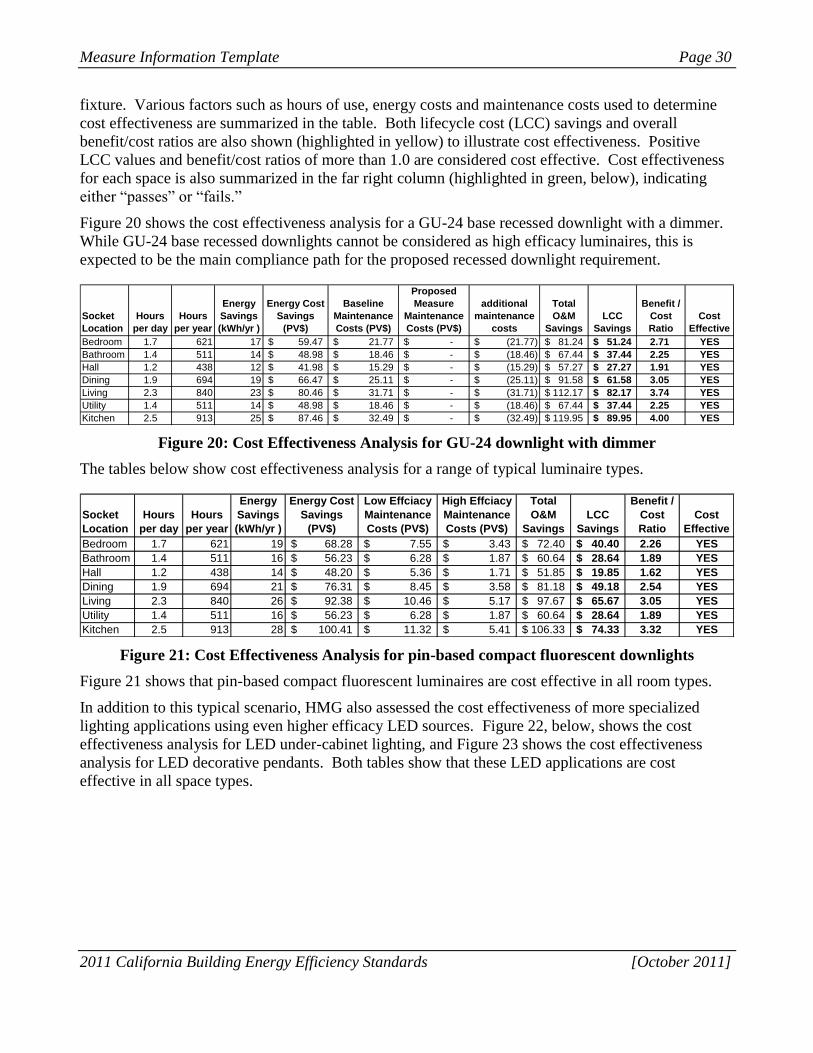
fixture. Various factors such as hours of use, energy costs and maintenance costs used to determine
cost effectiveness are summarized in the table. Both lifecycle cost (LCC) savings and overall
benefit/cost ratios are also shown (highlighted in yellow) to illustrate cost effectiveness. Positive
LCC values and benefit/cost ratios of more than 1.0 are considered cost effective. Cost effectiveness
for each space is also summarized in the far right column (highlighted in green, below), indicating
either “passes” or “fails.”
Figure 20 shows the cost effectiveness analysis for a GU-24 base recessed downlight with a dimmer.
While GU-24 base recessed downlights cannot be considered as high efficacy luminaires, this is
expected to be the main compliance path for the proposed recessed downlight requirement.
Figure 20: Cost Effectiveness Analysis for GU-24 downlight with dimmer
The tables below show cost effectiveness analysis for a range of typical luminaire types.
Figure 21: Cost Effectiveness Analysis for pin-based compact fluorescent downlights
Figure 21 shows that pin-based compact fluorescent luminaires are cost effective in all room types.
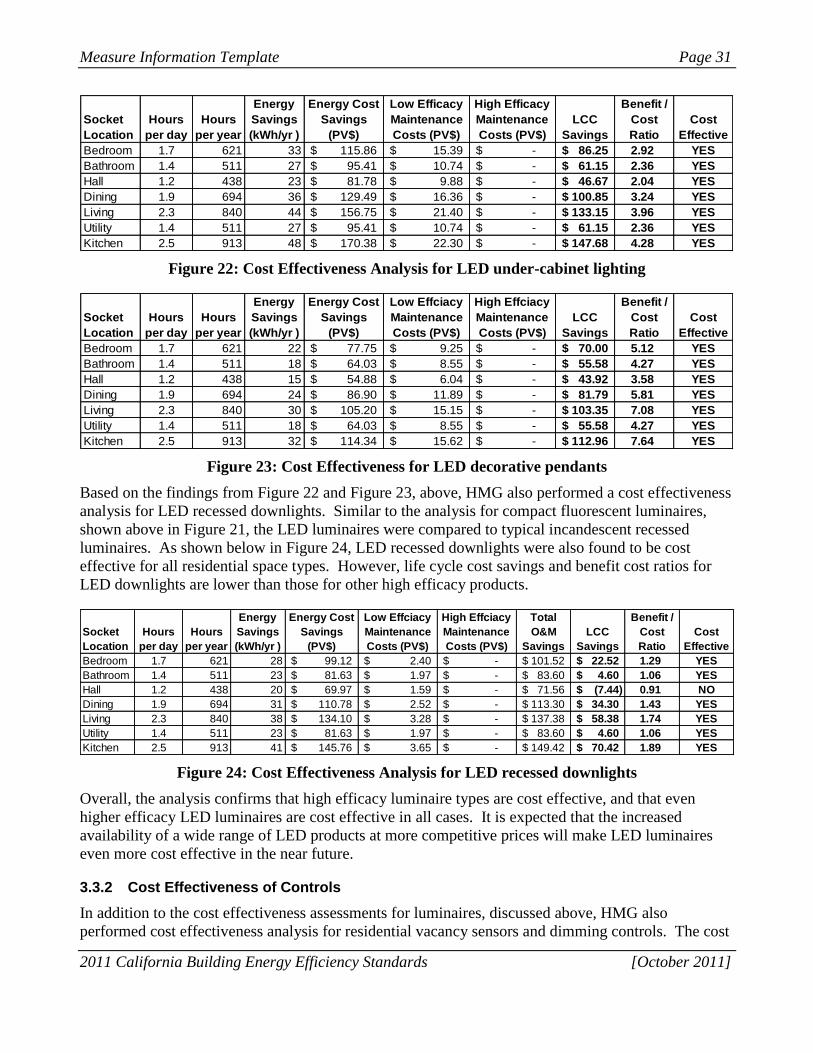
In addition to this typical scenario, HMG also assessed the cost effectiveness of more specialized
lighting applications using even higher efficacy LED sources. Figure 22, below, shows the cost
effectiveness analysis for LED under-cabinet lighting, and Figure 23 shows the cost effectiveness
analysis for LED decorative pendants. Both tables show that these LED applications are cost
effective in all space types.
Socket
Location
Hours
per day
Hours
per year
Energy
Savings
(kWh/yr )
Energy Cost
Savings
(PV$)
Baseline
Maintenance
Costs (PV$)
Proposed
Measure
Maintenance
Costs (PV$)
additional
maintenance
costs
Total
O&M
Savings
LCC
Savings
Benefit /
Cost
Ratio
Cost
Effective
Bedroom 1.7 621 17 59.47$ 21.77$ -$ (21.77)$ 81.24$ 51.24$ 2.71 YES
Bathroom 1.4 511 14 48.98$ 18.46$ -$ (18.46)$ 67.44$ 37.44$ 2.25 YES
Hall 1.2 438 12 41.98$ 15.29$ -$ (15.29)$ 57.27$ 27.27$ 1.91 YES
Dining 1.9 694 19 66.47$ 25.11$ -$ (25.11)$ 91.58$ 61.58$ 3.05 YES
Living 2.3 840 23 80.46$ 31.71$ -$ (31.71)$ 112.17$ 82.17$ 3.74 YES
Utility 1.4 511 14 48.98$ 18.46$ -$ (18.46)$ 67.44$ 37.44$ 2.25 YES
Kitchen 2.5 913 25 87.46$ 32.49$ -$ (32.49)$ 119.95$ 89.95$ 4.00 YES
Socket
Location
Hours
per day
Hours
per year
Energy
Savings
(kWh/yr )
Energy Cost
Savings
(PV$)
Low Effciacy
Maintenance
Costs (PV$)
High Effciacy
Maintenance
Costs (PV$)
Total
O&M
Savings
LCC
Savings
Benefit /
Cost
Ratio
Cost
Effective
Bedroom 1.7 621 19 68.28$ 7.55$ 3.43$ 72.40$ 40.40$ 2.26 YES
Bathroom 1.4 511 16 56.23$ 6.28$ 1.87$ 60.64$ 28.64$ 1.89 YES
Hall 1.2 438 14 48.20$ 5.36$ 1.71$ 51.85$ 19.85$ 1.62 YES
Dining 1.9 694 21 76.31$ 8.45$ 3.58$ 81.18$ 49.18$ 2.54 YES
Living 2.3 840 26 92.38$ 10.46$ 5.17$ 97.67$ 65.67$ 3.05 YES
Utility 1.4 511 16 56.23$ 6.28$ 1.87$ 60.64$ 28.64$ 1.89 YES
Kitchen 2.5 913 28 100.41$ 11.32$ 5.41$ 106.33$ 74.33$ 3.32 YES
Measure Information Template Page 31
2011 California Building Energy Efficiency Standards [October 2011]
Figure 22: Cost Effectiveness Analysis for LED under-cabinet lighting
Figure 23: Cost Effectiveness for LED decorative pendants
Based on the findings from Figure 22 and Figure 23, above, HMG also performed a cost effectiveness
analysis for LED recessed downlights. Similar to the analysis for compact fluorescent luminaires,
shown above in Figure 21, the LED luminaires were compared to typical incandescent recessed
luminaires. As shown below in Figure 24, LED recessed downlights were also found to be cost
effective for all residential space types. However, life cycle cost savings and benefit cost ratios for
LED downlights are lower than those for other high efficacy products.
Figure 24: Cost Effectiveness Analysis for LED recessed downlights
Overall, the analysis confirms that high efficacy luminaire types are cost effective, and that even
higher efficacy LED luminaires are cost effective in all cases. It is expected that the increased
availability of a wide range of LED products at more competitive prices will make LED luminaires
even more cost effective in the near future.
3.3.2 Cost Effectiveness of Controls
In addition to the cost effectiveness assessments for luminaires, discussed above, HMG also
performed cost effectiveness analysis for residential vacancy sensors and dimming controls. The cost
Socket
Location
Hours
per day
Hours
per year
Energy
Savings
(kWh/yr )
Energy Cost
Savings
(PV$)
Low Efficacy
Maintenance
Costs (PV$)
High Efficacy
Maintenance
Costs (PV$)
LCC
Savings
Benefit /
Cost
Ratio
Cost
Effective
Bedroom 1.7 621 33 115.86$ 15.39$ -$ 86.25$ 2.92 YES
Bathroom 1.4 511 27 95.41$ 10.74$ -$ 61.15$ 2.36 YES
Hall 1.2 438 23 81.78$ 9.88$ -$ 46.67$ 2.04 YES
Dining 1.9 694 36 129.49$ 16.36$ -$ 100.85$ 3.24 YES
Living 2.3 840 44 156.75$ 21.40$ -$ 133.15$ 3.96 YES
Utility 1.4 511 27 95.41$ 10.74$ -$ 61.15$ 2.36 YES
Kitchen 2.5 913 48 170.38$ 22.30$ -$ 147.68$ 4.28 YES
Socket
Location
Hours
per day
Hours
per year
Energy
Savings
(kWh/yr )
Energy Cost
Savings
(PV$)
Low Effciacy
Maintenance
Costs (PV$)
High Effciacy
Maintenance
Costs (PV$)
LCC
Savings
Benefit /
Cost
Ratio
Cost
Effective
Bedroom 1.7 621 22 77.75$ 9.25$ -$ 70.00$ 5.12 YES
Bathroom 1.4 511 18 64.03$ 8.55$ -$ 55.58$ 4.27 YES
Hall 1.2 438 15 54.88$ 6.04$ -$ 43.92$ 3.58 YES
Dining 1.9 694 24 86.90$ 11.89$ -$ 81.79$ 5.81 YES
Living 2.3 840 30 105.20$ 15.15$ -$ 103.35$ 7.08 YES
Utility 1.4 511 18 64.03$ 8.55$ -$ 55.58$ 4.27 YES
Kitchen 2.5 913 32 114.34$ 15.62$ -$ 112.96$ 7.64 YES
Socket
Location
Hours
per day
Hours
per year
Energy
Savings
(kWh/yr )
Energy Cost
Savings
(PV$)
Low Effciacy
Maintenance
Costs (PV$)
High Effciacy
Maintenance
Costs (PV$)
Total
O&M
Savings
LCC
Savings
Benefit /
Cost
Ratio
Cost
Effective
Bedroom 1.7 621 28 99.12$ 2.40$ -$ 101.52$ 22.52$ 1.29 YES
Bathroom 1.4 511 23 81.63$ 1.97$ -$ 83.60$ 4.60$ 1.06 YES
Hall 1.2 438 20 69.97$ 1.59$ -$ 71.56$ (7.44)$ 0.91 NO
Dining 1.9 694 31 110.78$ 2.52$ -$ 113.30$ 34.30$ 1.43 YES
Living 2.3 840 38 134.10$ 3.28$ -$ 137.38$ 58.38$ 1.74 YES
Utility 1.4 511 23 81.63$ 1.97$ -$ 83.60$ 4.60$ 1.06 YES
Kitchen 2.5 913 41 145.76$ 3.65$ -$ 149.42$ 70.42$ 1.89 YES
Measure Information Template Page 32
2011 California Building Energy Efficiency Standards [October 2011]
effectiveness assessments below are similar to the luminaire analysis above, except that rather than
comparing low efficacy and high efficacy sources, the analysis below compares controlled and
uncontrolled scenarios. The analysis for both control types is based on controlling a single 57 Watt
incandescent luminaire, i.e. the cost-effectiveness of controls is assessed relative to a low-efficacy
luminaire, and the cost-effectiveness of converting that luminaire to high efficacy (see section 3.3.1)
is assessed based on the reduced energy use of the fixture, adjusted for controls.
This cost analysis is conservative because it is based on only one luminaire being controlled, whereas
vacancy sensors or dimmers typically control multiple luminaires in a space.
The analysis for vacancy sensors assumes they will achieve an energy savings of 30% over standard
manual switching. This assumption is based on a commercial meta-study (study of studies)
performed by the Lighting Research Center that estimated savings of 25% in private offices, 30% in
shared spaces with scheduled use (e.g. school classrooms), and 40% in shared spaces with non-
scheduled use (e.g. open offices, corridors, restrooms, etc.) (LRC, 2003). A later study for Southern
California Edison found that the 40% estimate was optimistic for open offices (depending heavily on
how the lighting is circuited) (SCE, 2009). Based on these studies, 30% savings was determined to
represent an average savings across space types. Savings in residential are expected to be at least as
high as these commercial examples, since dwelling units typically have fewer occupants, and are
usually not occupied during the day (note that this value is not the same as the conservative Power
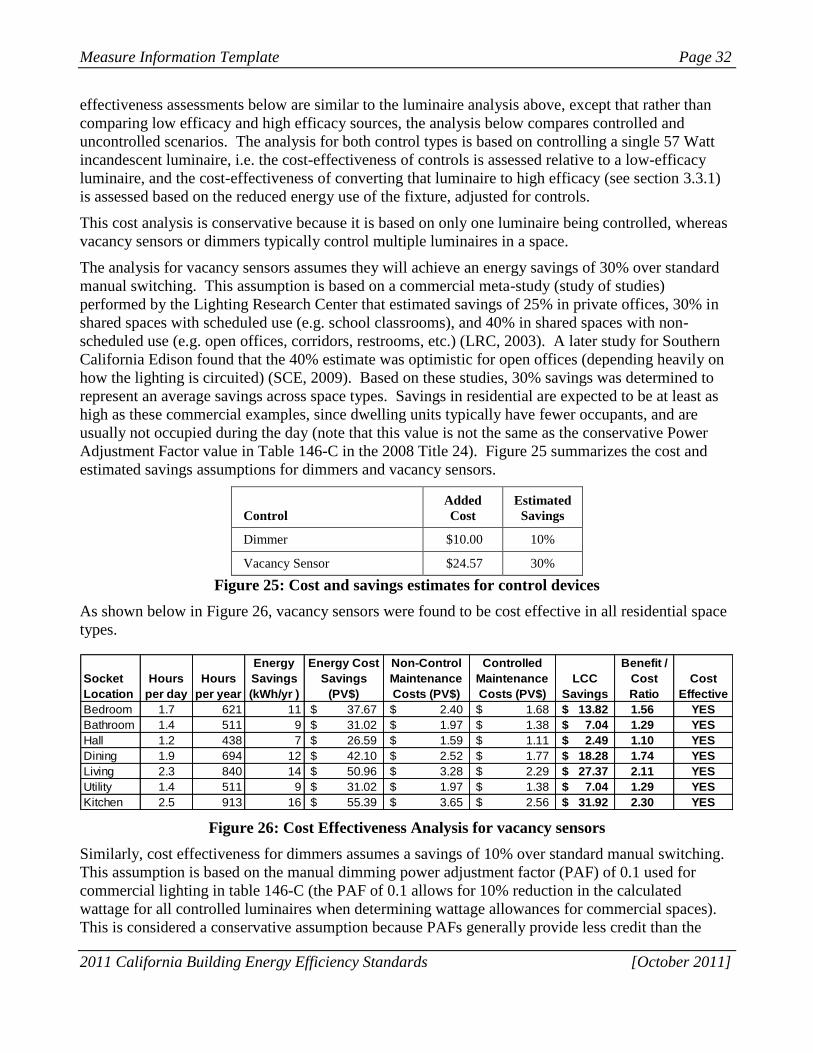
Adjustment Factor value in Table 146-C in the 2008 Title 24). Figure 25 summarizes the cost and
estimated savings assumptions for dimmers and vacancy sensors.
Control
Added
Cost
Estimated
Savings
Dimmer $10.00 10%
Vacancy Sensor $24.57 30%
Figure 25: Cost and savings estimates for control devices
As shown below in Figure 26, vacancy sensors were found to be cost effective in all residential space
types.
Figure 26: Cost Effectiveness Analysis for vacancy sensors
Similarly, cost effectiveness for dimmers assumes a savings of 10% over standard manual switching.
This assumption is based on the manual dimming power adjustment factor (PAF) of 0.1 used for
commercial lighting in table 146-C (the PAF of 0.1 allows for 10% reduction in the calculated
wattage for all controlled luminaires when determining wattage allowances for commercial spaces).
This is considered a conservative assumption because PAFs generally provide less credit than the
Socket
Location
Hours
per day
Hours
per year
Energy
Savings
(kWh/yr )
Energy Cost
Savings
(PV$)
Non-Control
Maintenance
Costs (PV$)
Controlled
Maintenance
Costs (PV$)
LCC
Savings
Benefit /
Cost
Ratio
Cost
Effective
Bedroom 1.7 621 11 37.67$ 2.40$ 1.68$ 13.82$ 1.56 YES
Bathroom 1.4 511 9 31.02$ 1.97$ 1.38$ 7.04$ 1.29 YES
Hall 1.2 438 7 26.59$ 1.59$ 1.11$ 2.49$ 1.10 YES
Dining 1.9 694 12 42.10$ 2.52$ 1.77$ 18.28$ 1.74 YES
Living 2.3 840 14 50.96$ 3.28$ 2.29$ 27.37$ 2.11 YES
Utility 1.4 511 9 31.02$ 1.97$ 1.38$ 7.04$ 1.29 YES
Kitchen 2.5 913 16 55.39$ 3.65$ 2.56$ 31.92$ 2.30 YES
Measure Information Template Page 33
2011 California Building Energy Efficiency Standards [October 2011]
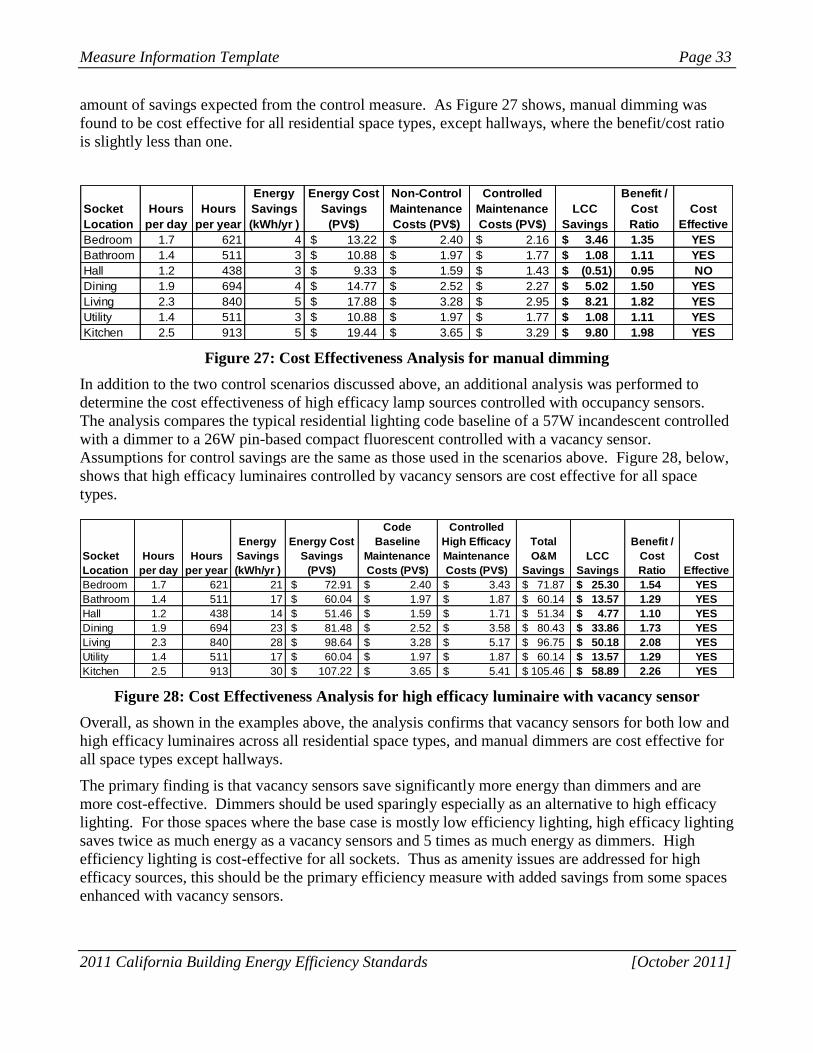
amount of savings expected from the control measure. As Figure 27 shows, manual dimming was
found to be cost effective for all residential space types, except hallways, where the benefit/cost ratio
is slightly less than one.
Figure 27: Cost Effectiveness Analysis for manual dimming
In addition to the two control scenarios discussed above, an additional analysis was performed to
determine the cost effectiveness of high efficacy lamp sources controlled with occupancy sensors.
The analysis compares the typical residential lighting code baseline of a 57W incandescent controlled
with a dimmer to a 26W pin-based compact fluorescent controlled with a vacancy sensor.
Assumptions for control savings are the same as those used in the scenarios above. Figure 28, below,
shows that high efficacy luminaires controlled by vacancy sensors are cost effective for all space
types.
Figure 28: Cost Effectiveness Analysis for high efficacy luminaire with vacancy sensor
Overall, as shown in the examples above, the analysis confirms that vacancy sensors for both low and
high efficacy luminaires across all residential space types, and manual dimmers are cost effective for
all space types except hallways.
The primary finding is that vacancy sensors save significantly more energy than dimmers and are
more cost-effective. Dimmers should be used sparingly especially as an alternative to high efficacy
lighting. For those spaces where the base case is mostly low efficiency lighting, high efficacy lighting
saves twice as much energy as a vacancy sensors and 5 times as much energy as dimmers. High
efficiency lighting is cost-effective for all sockets. Thus as amenity issues are addressed for high
efficacy sources, this should be the primary efficiency measure with added savings from some spaces
enhanced with vacancy sensors.
Socket
Location
Hours
per day
Hours
per year
Energy
Savings
(kWh/yr )
Energy Cost
Savings
(PV$)
Non-Control
Maintenance
Costs (PV$)
Controlled
Maintenance
Costs (PV$)
LCC
Savings
Benefit /
Cost
Ratio
Cost
Effective
Bedroom 1.7 621 4 13.22$ 2.40$ 2.16$ 3.46$ 1.35 YES
Bathroom 1.4 511 3 10.88$ 1.97$ 1.77$ 1.08$ 1.11 YES
Hall 1.2 438 3 9.33$ 1.59$ 1.43$ (0.51)$ 0.95 NO
Dining 1.9 694 4 14.77$ 2.52$ 2.27$ 5.02$ 1.50 YES
Living 2.3 840 5 17.88$ 3.28$ 2.95$ 8.21$ 1.82 YES
Utility 1.4 511 3 10.88$ 1.97$ 1.77$ 1.08$ 1.11 YES
Kitchen 2.5 913 5 19.44$ 3.65$ 3.29$ 9.80$ 1.98 YES
Socket
Location
Hours
per day
Hours
per year
Energy
Savings
(kWh/yr )
Energy Cost
Savings
(PV$)
Code
Baseline
Maintenance
Costs (PV$)
Controlled
High Efficacy
Maintenance
Costs (PV$)
Total
O&M
Savings
LCC
Savings
Benefit /
Cost
Ratio
Cost
Effective
Bedroom 1.7 621 21 72.91$ 2.40$ 3.43$ 71.87$ 25.30$ 1.54 YES
Bathroom 1.4 511 17 60.04$ 1.97$ 1.87$ 60.14$ 13.57$ 1.29 YES
Hall 1.2 438 14 51.46$ 1.59$ 1.71$ 51.34$ 4.77$ 1.10 YES
Dining 1.9 694 23 81.48$ 2.52$ 3.58$ 80.43$ 33.86$ 1.73 YES
Living 2.3 840 28 98.64$ 3.28$ 5.17$ 96.75$ 50.18$ 2.08 YES
Utility 1.4 511 17 60.04$ 1.97$ 1.87$ 60.14$ 13.57$ 1.29 YES
Kitchen 2.5 913 30 107.22$ 3.65$ 5.41$ 105.46$ 58.89$ 2.26 YES
Measure Information Template Page 34
2011 California Building Energy Efficiency Standards [October 2011]
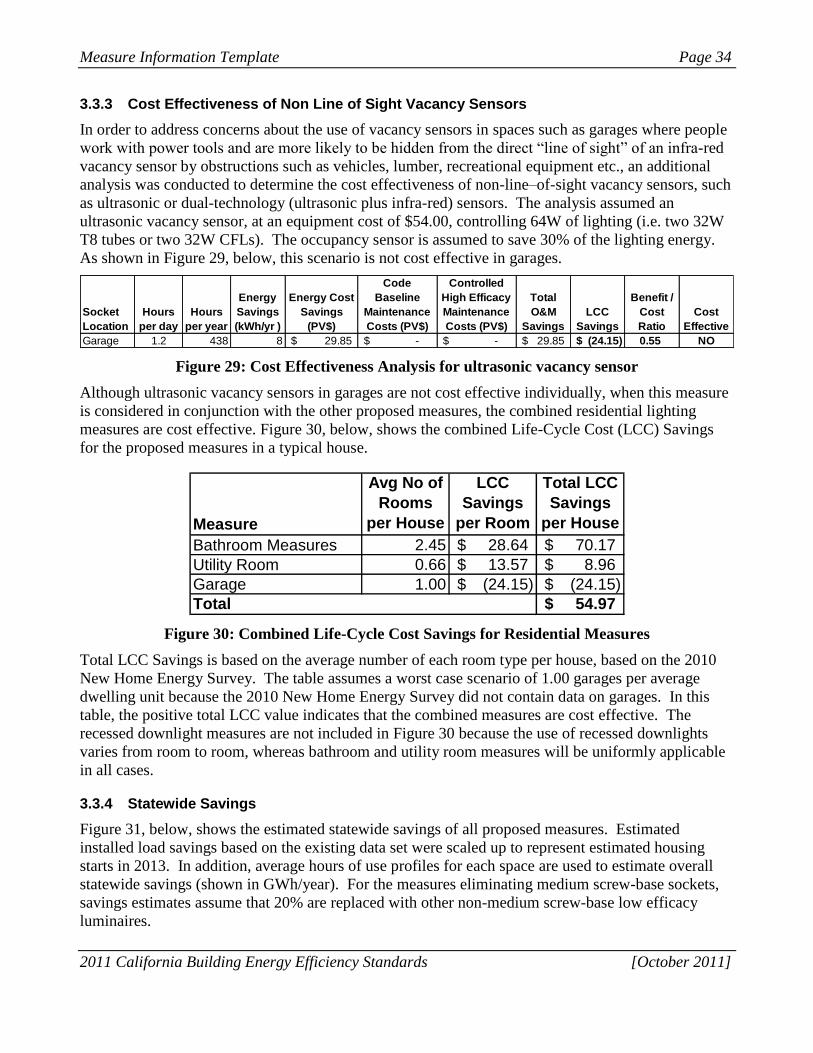
3.3.3 Cost Effectiveness of Non Line of Sight Vacancy Sensors
In order to address concerns about the use of vacancy sensors in spaces such as garages where people
work with power tools and are more likely to be hidden from the direct “line of sight” of an infra-red
vacancy sensor by obstructions such as vehicles, lumber, recreational equipment etc., an additional
analysis was conducted to determine the cost effectiveness of non-line–of-sight vacancy sensors, such
as ultrasonic or dual-technology (ultrasonic plus infra-red) sensors. The analysis assumed an
ultrasonic vacancy sensor, at an equipment cost of $54.00, controlling 64W of lighting (i.e. two 32W
T8 tubes or two 32W CFLs). The occupancy sensor is assumed to save 30% of the lighting energy.
As shown in Figure 29, below, this scenario is not cost effective in garages.
Figure 29: Cost Effectiveness Analysis for ultrasonic vacancy sensor
Although ultrasonic vacancy sensors in garages are not cost effective individually, when this measure
is considered in conjunction with the other proposed measures, the combined residential lighting
measures are cost effective. Figure 30, below, shows the combined Life-Cycle Cost (LCC) Savings
for the proposed measures in a typical house.
Figure 30: Combined Life-Cycle Cost Savings for Residential Measures
Total LCC Savings is based on the average number of each room type per house, based on the 2010
New Home Energy Survey. The table assumes a worst case scenario of 1.00 garages per average
dwelling unit because the 2010 New Home Energy Survey did not contain data on garages. In this
table, the positive total LCC value indicates that the combined measures are cost effective. The
recessed downlight measures are not included in Figure 30 because the use of recessed downlights
varies from room to room, whereas bathroom and utility room measures will be uniformly applicable
in all cases.
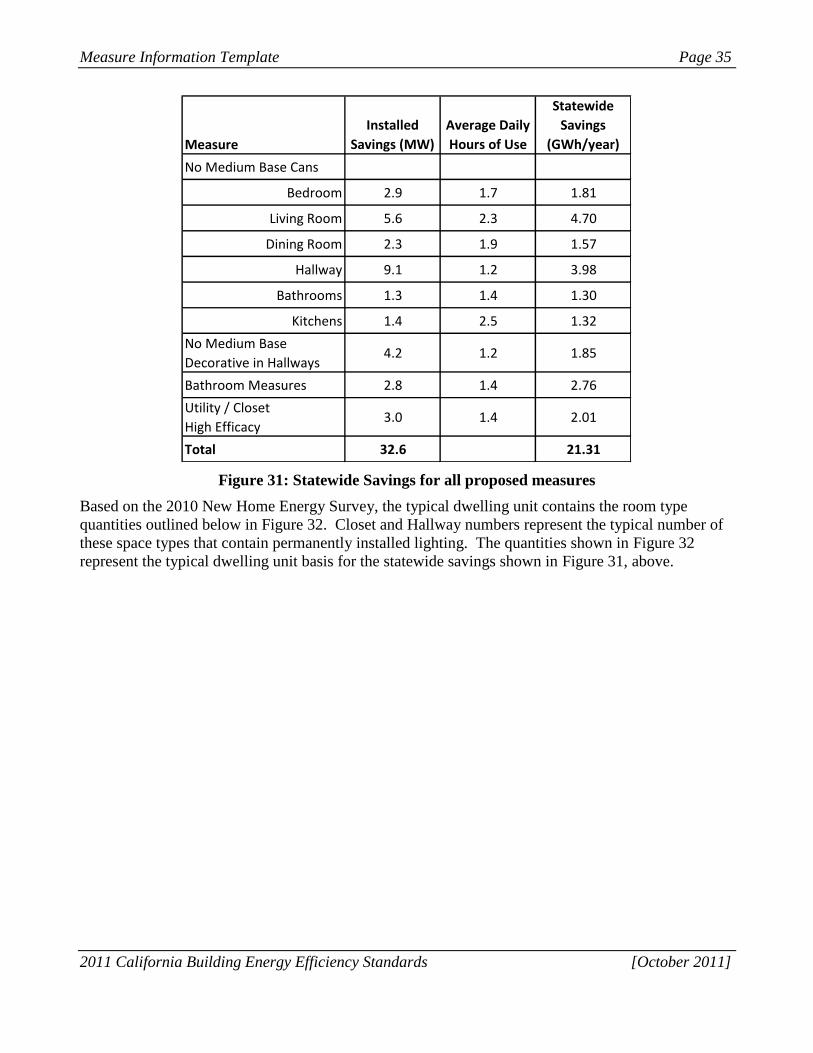
3.3.4 Statewide Savings
Figure 31, below, shows the estimated statewide savings of all proposed measures. Estimated
installed load savings based on the existing data set were scaled up to represent estimated housing
starts in 2013. In addition, average hours of use profiles for each space are used to estimate overall
statewide savings (shown in GWh/year). For the measures eliminating medium screw-base sockets,
savings estimates assume that 20% are replaced with other non-medium screw-base low efficacy
luminaires.
Socket
Location
Hours
per day
Hours
per year
Energy
Savings
(kWh/yr )
Energy Cost
Savings
(PV$)
Code
Baseline
Maintenance
Costs (PV$)
Controlled
High Efficacy
Maintenance
Costs (PV$)
Total
O&M
Savings
LCC
Savings
Benefit /
Cost
Ratio
Cost
Effective
Garage 1.2 438 8 29.85$ -$ -$ 29.85$ (24.15)$ 0.55 NO
Measure
Avg No of
Rooms
per House
LCC
Savings
per Room
Total LCC
Savings
per House
Bathroom Measures 2.45 28.64$ 70.17$
Utility Room 0.66 13.57$ 8.96$
Garage 1.00 (24.15)$ (24.15)$
54.97$ Total
Measure Information Template Page 35
2011 California Building Energy Efficiency Standards [October 2011]
Figure 31: Statewide Savings for all proposed measures
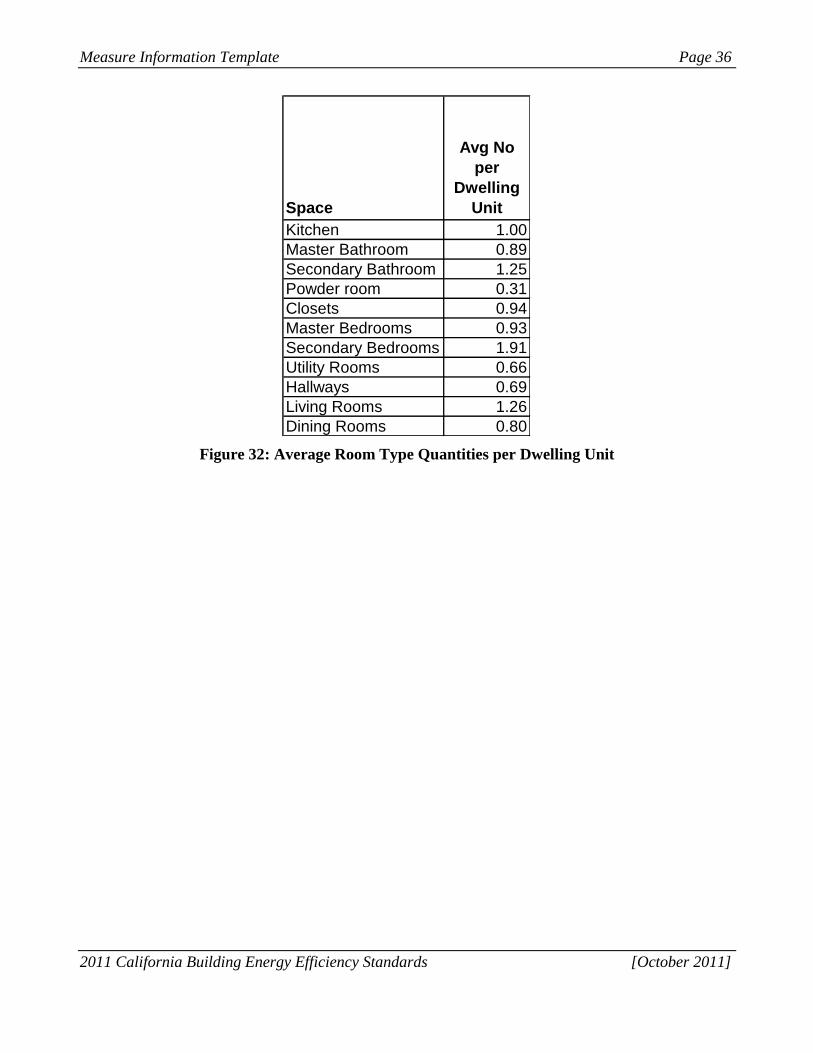
Based on the 2010 New Home Energy Survey, the typical dwelling unit contains the room type
quantities outlined below in Figure 32. Closet and Hallway numbers represent the typical number of
these space types that contain permanently installed lighting. The quantities shown in Figure 32
represent the typical dwelling unit basis for the statewide savings shown in Figure 31, above.
Measure
Installed
Savings (MW)
Average Daily
Hours of Use
Statewide
Savings
(GWh/year)
No Medium Base Cans
Bedroom 2.9 1.7 1.81
Living Room 5.6 2.3 4.70
Dining Room 2.3 1.9 1.57
Hallway 9.1 1.2 3.98
Bathrooms 1.3 1.4 1.30
Kitchens 1.4 2.5 1.32
No Medium Base
Decorative in Hallways4.2 1.2 1.85
Bathroom Measures 2.8 1.4 2.76
Utility / Closet
High Efficacy3.0 1.4 2.01
Total 32.6 21.31
Measure Information Template Page 36
2011 California Building Energy Efficiency Standards [October 2011]
Figure 32: Average Room Type Quantities per Dwelling Unit
Space
Avg No
per
Dwelling
Unit
Kitchen 1.00
Master Bathroom 0.89
Secondary Bathroom 1.25
Powder room 0.31
Closets 0.94
Master Bedrooms 0.93
Secondary Bedrooms 1.91
Utility Rooms 0.66
Hallways 0.69
Living Rooms 1.26
Dining Rooms 0.80
Measure Information Template Page 37
2011 California Building Energy Efficiency Standards [October 2011]
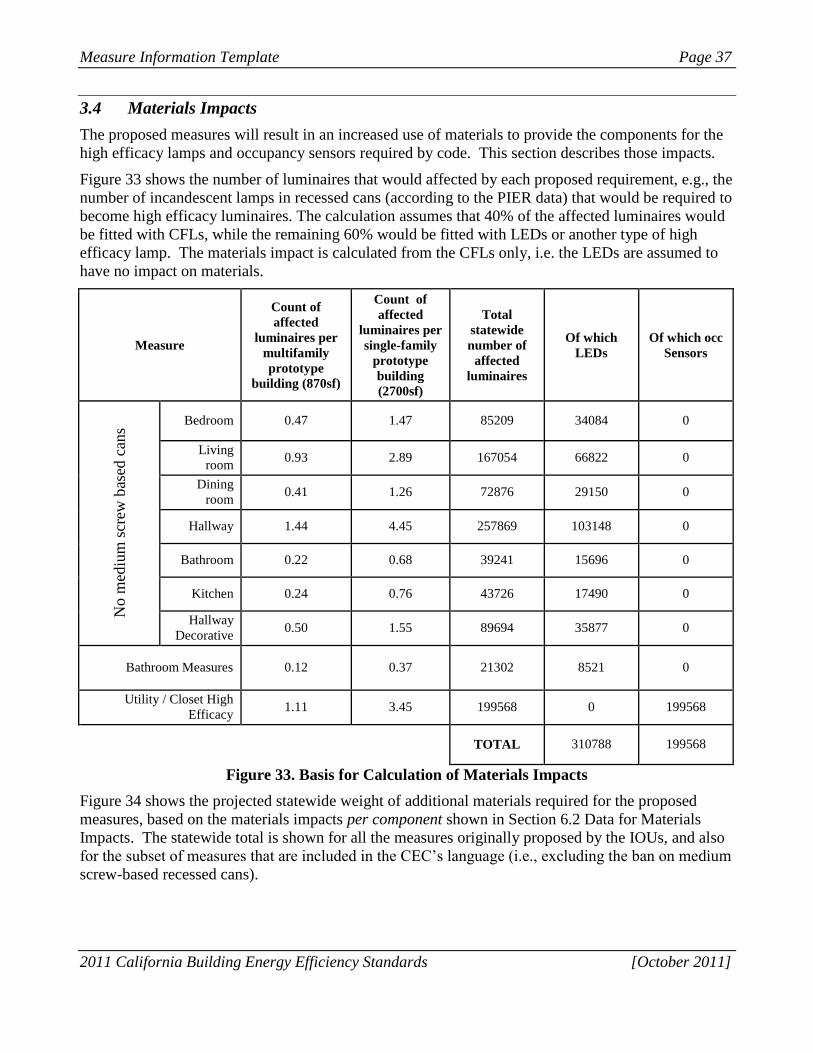
3.4 Materials Impacts
The proposed measures will result in an increased use of materials to provide the components for the
high efficacy lamps and occupancy sensors required by code. This section describes those impacts.
Figure 33 shows the number of luminaires that would affected by each proposed requirement, e.g., the
number of incandescent lamps in recessed cans (according to the PIER data) that would be required to
become high efficacy luminaires. The calculation assumes that 40% of the affected luminaires would
be fitted with CFLs, while the remaining 60% would be fitted with LEDs or another type of high
efficacy lamp. The materials impact is calculated from the CFLs only, i.e. the LEDs are assumed to
have no impact on materials.
Measure
Count of
affected
luminaires per
multifamily
prototype
building (870sf)
Count of
affected
luminaires per
single-family
prototype
building
(2700sf)
Total
statewide
number of
affected
luminaires
Of which
LEDs
Of which occ
Sensors
No m
ediu
m s
crew
bas
ed c
ans
Bedroom 0.47 1.47 85209 34084 0
Living
room 0.93 2.89 167054 66822 0
Dining
room 0.41 1.26 72876 29150 0
Hallway 1.44 4.45 257869 103148 0
Bathroom 0.22 0.68 39241 15696 0
Kitchen 0.24 0.76 43726 17490 0
Hallway
Decorative 0.50 1.55 89694 35877 0
Bathroom Measures 0.12 0.37 21302 8521 0
Utility / Closet High
Efficacy 1.11 3.45 199568 0 199568
TOTAL 310788 199568
Figure 33. Basis for Calculation of Materials Impacts
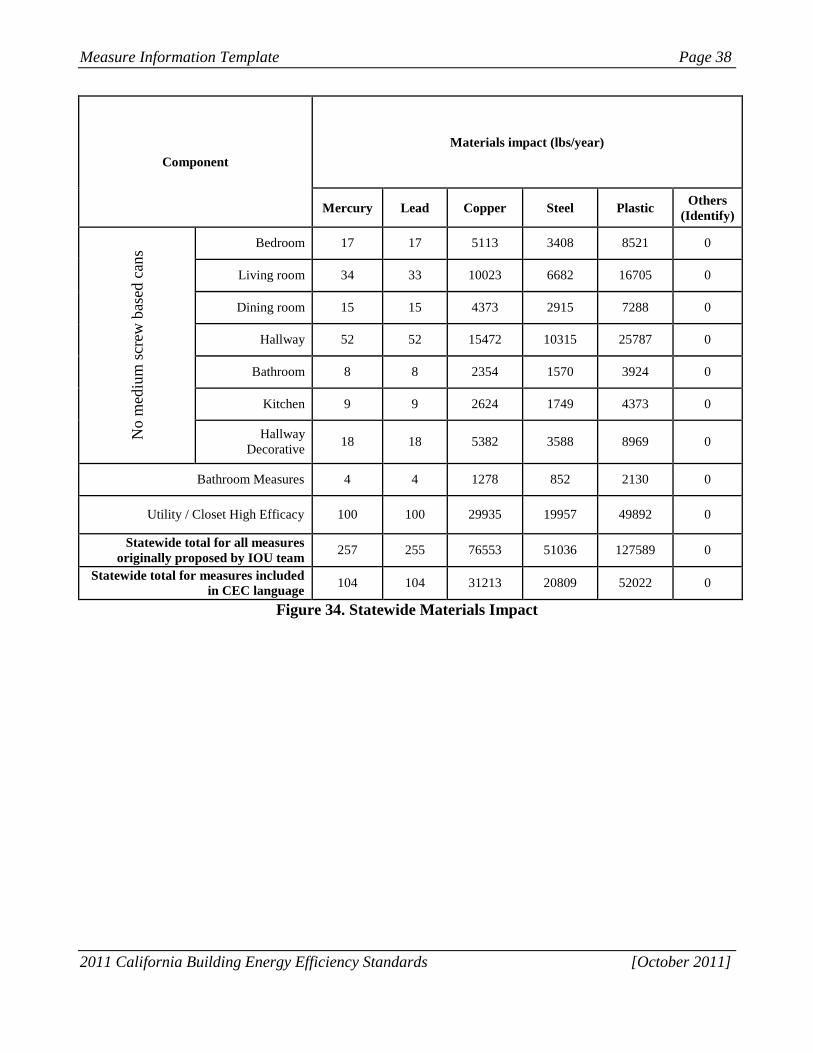
Figure 34 shows the projected statewide weight of additional materials required for the proposed
measures, based on the materials impacts per component shown in Section 6.2 Data for Materials
Impacts. The statewide total is shown for all the measures originally proposed by the IOUs, and also
for the subset of measures that are included in the CEC’s language (i.e., excluding the ban on medium
screw-based recessed cans).
Measure Information Template Page 38
2011 California Building Energy Efficiency Standards [October 2011]
Component
Materials impact (lbs/year)
Mercury Lead Copper Steel Plastic Others
(Identify)
No m
ediu
m s
crew
bas
ed c
ans
Bedroom 17 17 5113 3408 8521 0
Living room 34 33 10023 6682 16705 0
Dining room 15 15 4373 2915 7288 0
Hallway 52 52 15472 10315 25787 0
Bathroom 8 8 2354 1570 3924 0
Kitchen 9 9 2624 1749 4373 0
Hallway
Decorative 18 18 5382 3588 8969 0
Bathroom Measures 4 4 1278 852 2130 0
Utility / Closet High Efficacy 100 100 29935 19957 49892 0
Statewide total for all measures
originally proposed by IOU team 257 255 76553 51036 127589 0
Statewide total for measures included
in CEC language 104 104 31213 20809 52022 0
Figure 34. Statewide Materials Impact
Measure Information Template Page 39
2011 California Building Energy Efficiency Standards [October 2011]
4. Recommended Language for the Standards Document,
ACM Manuals, and the Reference Appendices
4.1 Summary of Code Change Proposals
Residential lighting requirements are located in code section 150(k). All proposed changes are
contained in that section. Recommendations discussed above are summarized in the sections below.
4.1.1 Recessed Downlights
We have proposed required that all recessed downlights shall not have medium screw-base sockets.
4.1.2 Efficacy and Controls Requirements in Bathrooms
We have proposed creating a distinct section for bathroom lighting (currently combined with garages,
laundry rooms, closets and utility rooms in section 150(k)10) with the following changes:
Require at least one high efficacy luminaire (as defined by Table 150-C) in each bathroom
Require vacancy sensors for all lighting in bathrooms
See section 3.2 for detailed discussion.
4.1.3 Relocation of Low Efficacy Allowance for Kitchens
Because we have proposed eliminating the existing low efficacy kitchen wattage allowance for using
controls in garages, laundry rooms, closets and utility rooms, we are proposing adding the same
allowance for using controls in kitchens.
4.1.4 Eliminate Exceptions and Require Controls in Garages, Laundry Rooms, Closets and Utility Rooms
We have proposed eliminating the existing exceptions in code section 150(k)10, and instead requiring
high efficacy luminaires and vacancy sensors for all lighting in garages, laundry rooms, closets and
utility rooms (the exception to the control requirement for closets under 70 square feet would be
maintained). See section 3.2.4 for detailed discussion.
4.1.5 Decorative Requirements for Hallways
We have proposed creating a distinct section for hallway lighting (separate from the current
requirements in current section 150(k)11) which would require high efficacy lighting, or allow for
low efficacy luminaires if dimmers or vacancy sensors are installed. This proposal also recommends
adding a requirement that any decorative chandeliers, pendants or sconces in hallways not have
medium screw-base sockets.
See section 3.2.5 for detailed discussion.
4.1.6 Require All High Efficacy Lighting for Reach Code
HMG has also performed research and analysis to support proposals for residential lighting
requirements in the Reach Code. Cost effectiveness analysis presented in section 0 show that high
efficacy lighting is cost effective in all residential space types. Therefore, we have proposed that the
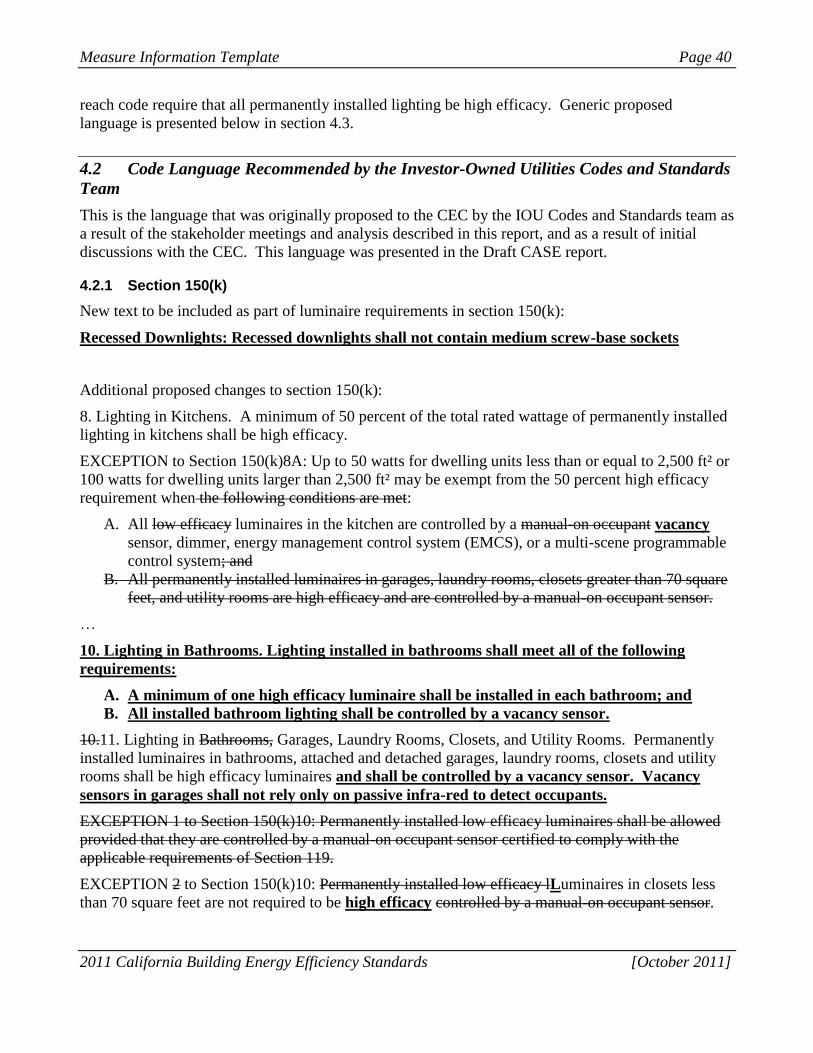
Measure Information Template Page 40
2011 California Building Energy Efficiency Standards [October 2011]
reach code require that all permanently installed lighting be high efficacy. Generic proposed
language is presented below in section 4.3.
4.2 Code Language Recommended by the Investor-Owned Utilities Codes and Standards
Team
This is the language that was originally proposed to the CEC by the IOU Codes and Standards team as
a result of the stakeholder meetings and analysis described in this report, and as a result of initial
discussions with the CEC. This language was presented in the Draft CASE report.
4.2.1 Section 150(k)
New text to be included as part of luminaire requirements in section 150(k):
Recessed Downlights: Recessed downlights shall not contain medium screw-base sockets
Additional proposed changes to section 150(k):
8. Lighting in Kitchens. A minimum of 50 percent of the total rated wattage of permanently installed
lighting in kitchens shall be high efficacy.
EXCEPTION to Section 150(k)8A: Up to 50 watts for dwelling units less than or equal to 2,500 ft² or
100 watts for dwelling units larger than 2,500 ft² may be exempt from the 50 percent high efficacy
requirement when the following conditions are met:
A. All low efficacy luminaires in the kitchen are controlled by a manual-on occupant vacancy
sensor, dimmer, energy management control system (EMCS), or a multi-scene programmable
control system; and
B. All permanently installed luminaires in garages, laundry rooms, closets greater than 70 square
feet, and utility rooms are high efficacy and are controlled by a manual-on occupant sensor.
…
10. Lighting in Bathrooms. Lighting installed in bathrooms shall meet all of the following
requirements:
A. A minimum of one high efficacy luminaire shall be installed in each bathroom; and
B. All installed bathroom lighting shall be controlled by a vacancy sensor.
10.11. Lighting in Bathrooms, Garages, Laundry Rooms, Closets, and Utility Rooms. Permanently
installed luminaires in bathrooms, attached and detached garages, laundry rooms, closets and utility
rooms shall be high efficacy luminaires and shall be controlled by a vacancy sensor. Vacancy
sensors in garages shall not rely only on passive infra-red to detect occupants.
EXCEPTION 1 to Section 150(k)10: Permanently installed low efficacy luminaires shall be allowed
provided that they are controlled by a manual-on occupant sensor certified to comply with the
applicable requirements of Section 119.
EXCEPTION 2 to Section 150(k)10: Permanently installed low efficacy lLuminaires in closets less
than 70 square feet are not required to be high efficacy controlled by a manual-on occupant sensor.
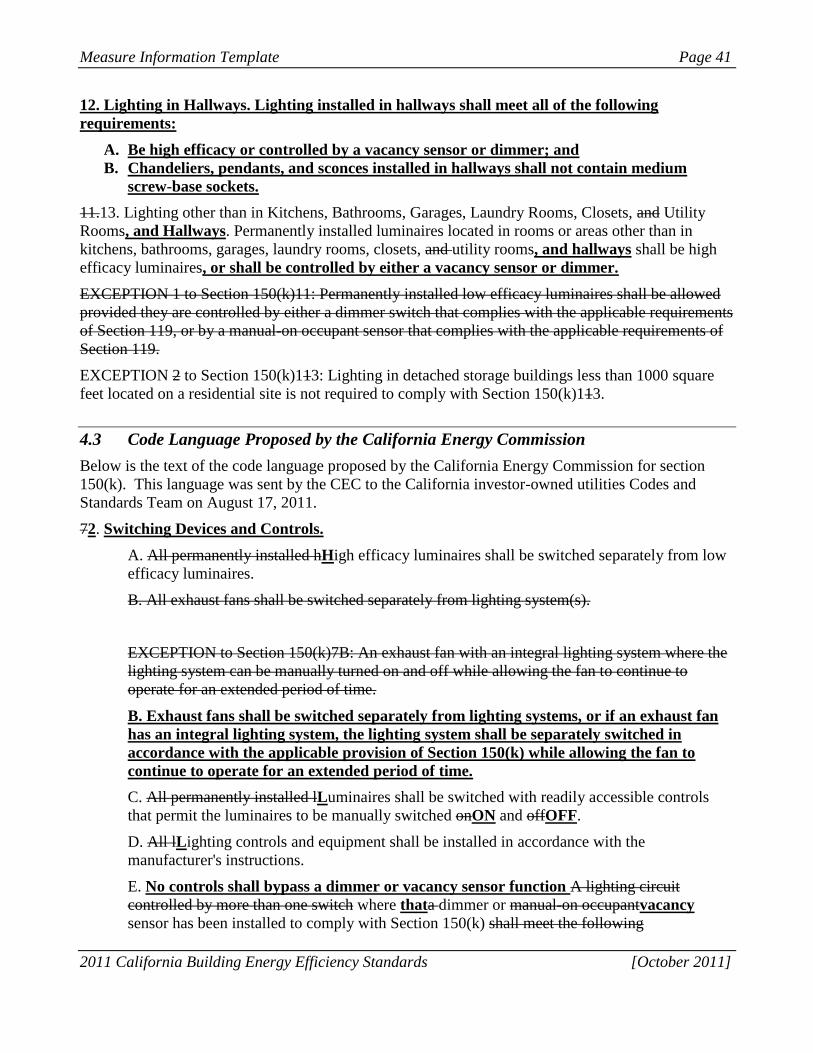
Measure Information Template Page 41
2011 California Building Energy Efficiency Standards [October 2011]
12. Lighting in Hallways. Lighting installed in hallways shall meet all of the following
requirements:
A. Be high efficacy or controlled by a vacancy sensor or dimmer; and
B. Chandeliers, pendants, and sconces installed in hallways shall not contain medium
screw-base sockets.
11.13. Lighting other than in Kitchens, Bathrooms, Garages, Laundry Rooms, Closets, and Utility
Rooms, and Hallways. Permanently installed luminaires located in rooms or areas other than in
kitchens, bathrooms, garages, laundry rooms, closets, and utility rooms, and hallways shall be high
efficacy luminaires, or shall be controlled by either a vacancy sensor or dimmer.
EXCEPTION 1 to Section 150(k)11: Permanently installed low efficacy luminaires shall be allowed
provided they are controlled by either a dimmer switch that complies with the applicable requirements
of Section 119, or by a manual-on occupant sensor that complies with the applicable requirements of
Section 119.
EXCEPTION 2 to Section 150(k)113: Lighting in detached storage buildings less than 1000 square
feet located on a residential site is not required to comply with Section 150(k)113.
4.3 Code Language Proposed by the California Energy Commission
Below is the text of the code language proposed by the California Energy Commission for section
150(k). This language was sent by the CEC to the California investor-owned utilities Codes and
Standards Team on August 17, 2011.
72. Switching Devices and Controls.
A. All permanently installed hHigh efficacy luminaires shall be switched separately from low
efficacy luminaires.
B. All exhaust fans shall be switched separately from lighting system(s).
EXCEPTION to Section 150(k)7B: An exhaust fan with an integral lighting system where the
lighting system can be manually turned on and off while allowing the fan to continue to
operate for an extended period of time.
B. Exhaust fans shall be switched separately from lighting systems, or if an exhaust fan
has an integral lighting system, the lighting system shall be separately switched in
accordance with the applicable provision of Section 150(k) while allowing the fan to
continue to operate for an extended period of time.
C. All permanently installed lLuminaires shall be switched with readily accessible controls
that permit the luminaires to be manually switched onON and offOFF.
D. All lLighting controls and equipment shall be installed in accordance with the
manufacturer's instructions.
E. No controls shall bypass a dimmer or vacancy sensor function A lighting circuit
controlled by more than one switch where thata dimmer or manual-on occupantvacancy
sensor has been installed to comply with Section 150(k) shall meet the following
Measure Information Template Page 42
2011 California Building Energy Efficiency Standards [October 2011]
conditions:
i. No controls shall bypass the dimmer or manual-on occupant sensor function.
ii. The dimmer or manual-on occupant sensor shall comply with the applicable requirements
of Section 119.
F. Manual-on occupant sensors, motion sensors, and dimmersLighting controls installed to
comply with Section 150(k) shall comply with the applicable requirements of Section 119.
G. An Energy Management Control System may be used to comply with dimmer
requirements in Section 150(k) if at a minimum it provides the functionality of a dimmer
in accordance with Section 119, meets the acceptance test requirements in Section 134
for dimming lighting control systems, and complies with all of the applicable
requirements in Section 150(k)2.
H. An Energy Management Control System may be used to comply with vacancy sensor
requirements in Section 150(k) if at a minimum it provides the functionality of a vacancy
sensor in accordance with Section 119, meets the acceptance test requirements in Section
134 for vacancy sensor lighting control systems, and complies with all of the applicable
requirements in Section 150(k)2.
I. A multi-scene programmable controller may be used to comply with dimmer
requirements in Section 150(k) if at a minimum it provides the functionality of a dimmer
in accordance with Section 119, and complies with all of the applicable requirements in
Section 150(k)2.
3. Lighting in Kitchens. A minimum of 50 percent of the total rated wattage of permanently installed
lighting in kitchens shall be high efficacy.
EXCEPTION to Section 150(k)3: Up to 50 watts for dwelling units less than or equal to 2,500 ft² or
100 watts for dwelling units larger than 2,500 ft² may be exempt from the 50 percent high efficacy
requirement when the following conditions are met:
A. Aall low efficacy luminaires lighting in the kitchen is controlled in accordance with the
applicable provisions in Section 150(k)2, and is are also controlled by a manual-on occupant
vacancy sensors, or dimmers,. energy management control system (EMCS), or a multi-scene
programmable control system; and
B. All permanently installed luminaires in garages, laundry rooms, closets greater than 70 square
feet, and utility rooms are high efficacy and are controlled by a manual-on occupant sensor.
NOTE: For the purpose of this requirement compliance with Section 150(k), kitchen lighting
includes all permanently installed lighting in the kitchen except for lighting that is internal to cabinets
for the purpose of illuminating only the inside of the cabinets. Lighting in areas adjacent to the
kitchen, including but not limited to dining and nook areas, are considered kitchen lighting if they are
not separately switched from kitchen lighting.…
5. Lighting in Bathrooms. Lighting installed in bathrooms shall meet the following
requirements:
A. A minimum of one high efficacy luminaire shall be installed in each bathroom; and
B. All other lighting installed in each bathroom shall be high efficacy or controlled by
vacancy sensors.
Measure Information Template Page 43
2011 California Building Energy Efficiency Standards [October 2011]
6. Lighting in Bathrooms, Garages, Laundry Rooms, Closets, and Utility Rooms. Permanently
Lighting installed luminaires in bathrooms, attached and detached garages, laundry rooms, closets
and utility rooms shall be high efficacy luminaires and shall be controlled by vacancy sensors.
Vacancy sensors in garages shall use ultrasonic, dual technology, or other methods for occupant
detection which do not rely solely on line of sight.
EXCEPTION 1 to Section 150(k)10: Permanently installed low efficacy luminaires shall be allowed
provided that they are controlled by a manual on occupant sensor certified to comply with the
applicable requirements of Section 119.
EXCEPTION 2 to Section 150(k)10: Permanently installed low efficacy luminaires in closets less
than 70 square feet are not required to be controlled by a manual-on occupant sensor.
7. Lighting other than in Kitchens, Bathrooms, Garages, Laundry Rooms, Closets, and Utility Rooms.
Permanently Lighting installed luminaires located in rooms or areas other than in kitchens,
bathrooms, garages, laundry rooms, closets, and utility rooms shall be high efficacy luminaires, or
shall be controlled by either dimmers or vacancy sensors.
EXCEPTION 1 to Section 150(k)7: Luminaires in closets less than 70 square feet.
EXCEPTION 1 to Section 150(k)11: Permanently installed low efficacy luminaires shall be allowed
provided they are controlled by either a dimmer switch that complies with the applicable requirements
of Section 119, or by a manual-on occupant sensor that complies with the applicable requirements of
Section 119.
EXCEPTION 2 to Section 150(k)117: Lighting in detached storage buildings less than 1000 square
feet located on a residential site is not required to comply with Section 150(k)11.
4.4 Differences between the Recommended and Proposed Language
This section highlights the key differences between the language recommended by the IOU team
(Section 4.2) and the language proposed by the CEC (Section 4.3).
4.4.1 Removal of the requirement that recessed luminaires should not have medium screw bases.
The removal of this measure eliminates almost all of the potential savings from residential lighting
(14.68 out of 21.31 GWh/yr, see Figure 31).
Despite the stated intention of the CEC to remove this requirement, we believe that it should still be
included in Code, and so we have maintained it in our final report. The rationale for the requirement
was that the measure is cost-effective, and does not impinge on the ability of lighting designers to
provide full-spectrum or warm color temperature lighting; it merely requires the vast majority of
general lighting in production homes to be high efficacy. The text of the requirement was developed
in discussion between the IOU team, the American Lighting Association (ALA), and the California
Lighting Technology Center. We requested from the CEC a summary of the reasons why the
requirement was dropped from the proposed language, but did not receive an explanation.
After the initial requirement had been agreed in discussion with the ALA, CEC received a written
communication from the ALA opposing the requirement. We have reproduced (below) the memo
from ALA and the responses provided by the IOU team to the ALA’s concerns, which was sent to
Measure Information Template Page 44
2011 California Building Energy Efficiency Standards [October 2011]
both the ALA and CEC on May 17 2011. We do not believe that the ALA concerns are valid; the
concerns listed were factually incorrect, unsubstantiated, or irrelevant to the proposed measure.
Concerns Raised by ALA over the Proposed Requirement that Recessed Downlights should not have
Medium Screw Bases
There is already a “low-efficacy” classification, without exception, on E-26 sockets in Title 24
so the quantity of defined low-efficacy luminaires in residences is already being regulated.
• IOU team response: Actually the quantity of low efficacy luminaires in residences is not
“regulated”; any number of low efficacy luminaires can be installed as long as they have
dimmers. New residential portable luminaires are similarly regulated via Title 20, of
course.
For downlight luminaires, an E-26 ban could also potentially limit homeowners from using
new high-efficacy products in the future as such products are typically developed first by
manufacturers with E-26 bases so as to take advantage of the large number of E-26 sockets
already present in residential buildings nationwide.
• IOU team response: There is already a well-developed market for leading-edge LED and
CFL lamps with both GU-24 and proprietary lamp holders. These are widely available in
home improvement stores. There appears to be no market lag for these products at
present, and requiring them in new construction will help to support this market in future.
There is no indication that E-26 sockets will become obsolete in the foreseeable future.
Indeed, the current practice of developing new and leading-edge high-efficacy light source
products first for E-26 sockets is expected to continue. The U.S. DOE “L Prize Competition”
is an example of that practice.
• IOU team response: Agreed. We are not trying to eliminate the market for the ES lamp
holder. The market for ES lamps will remain strong indefinitely due to the retrofit market
and because they will be allowed in all fixture types except recessed downlights under
Title 24 2013.
The E-26 socket has a 100-year history of safety, reliability and capability to hold and operate
light sources properly even under conditions of vibration, shock, high and low ambient
temperatures and other adverse conditions including fire and earthquake. No other light
source socket has this record. The E-26 socket is one of the most tested of all electrical
components in the history of lighting.
• IOU team response. All lamp holders have to meet the same UL safety requirements.
Has ALA lodged a complaint with UL regarding the sufficiency of the safety requirements
for GU-24 and other lamp holders?
Since consumers are very familiar with E-26 sockets, they tend to favor energy-efficient
products with E-26 bases since they know installation of those products will not be difficult.
• IOU team response: The installation of GU-24 lamps is just as easy as ES lamps, since
the sockets have the same form factor and are the same size. No additional actions are
required to replace a GU-24 lamp compared to an ES lamp. Manufacturers make a variety
of proprietary LED lamp holders, and these luminaires all come with instructions for lamp
replacement.
Measure Information Template Page 45
2011 California Building Energy Efficiency Standards [October 2011]
Concerns about E-26 sockets “ending up with incandescent lamps in them” are misplaced as
consumers learn more about the importance of energy-efficient lighting and standard
incandescent bulbs are phased out according to existing legislative requirements.
• IOU team response: ES sockets will “end up with incandescent lamps in them”
indefinitely into the future, because there is no current or proposed Federal or State
legislation to ban incandescent lamps. If there was a realistic prospect of incandescent
lamps being banned, there would be no need to propose this change to Title 24. We agree
that “standard” incandescent lamps will be phased out according to Federal standards, but
the more-efficient incandescent lamps required by that standard do not even meet the
current Title 24 definition of “high efficacy” and will be three to four times less efficient
than the most efficient lamps available at the time the Federal standard goes into effect.
There are some lighting applications in residences where a “low-efficacy” downlight equipped
with a screw-base halogen reflector lamp remains the best choice for the proper application of
light and where the “application efficacy” of the system is not properly measured by the light
source efficacy. That choice should remain available to home owners.
• IOU team response: Through the stakeholder process we have considered a wide range of
residential lighting applications, and opinion among designers is split regarding whether
LED lamps give sufficient color quality for all applications. Designers who want to
continue to use incandescent lamps can do so, by using any type of luminaire except a
recessed downlight. If the Energy Commission receives comments from designers that
they would like to use halogen lamps in recessed fixtures, then we recommend that the
language should require that those fixtures be adjustable (not fixed angle) fixtures.]
CEC language adds text in the Exception to 150(k)3 (Kitchen lighting)
The added text says “is controlled in accordance with the applicable provisions in Section 150(k)2,”
and removes EMCS and multi-scene programmable control systems as control options in the
exception. This change is simply to clarify the language, and does not affect the code requirement.
CEC language revised vacancy sensor language in requirements for Garages
This amendment requires that sensors must not rely solely on line of sight for occupant detection.
The amendment was made to ensure that people in garages can be detected by vacancy sensors even if
the person is working underneath a car or behind some other kind of obstruction. This amendment
was made to enhance safety and does not affect energy savings. The amended requirement requires a
slightly more expensive type of vacancy sensor, but this is still cost-effective, as set out in Section
3.3.2.
CEC language removes “Closets” from room types under 150(k) 6 (Garages, Laundry Rooms,
Utility Rooms)
This amendment makes closets fall under 150(k)7 (Lighting other than in Kitchens, Bathrooms,
Garages, Utility Rooms, Laundry Rooms), so that they require high efficacy lighting, or dimmers or
vacancy sensors, with an exception for closets under 70 square feet. This amendment was made
because closets over 70 square feet should be considered “dressing rooms” and therefore low-efficacy
lighting with dimmers should be allowed. This change does not significantly affect energy savings.
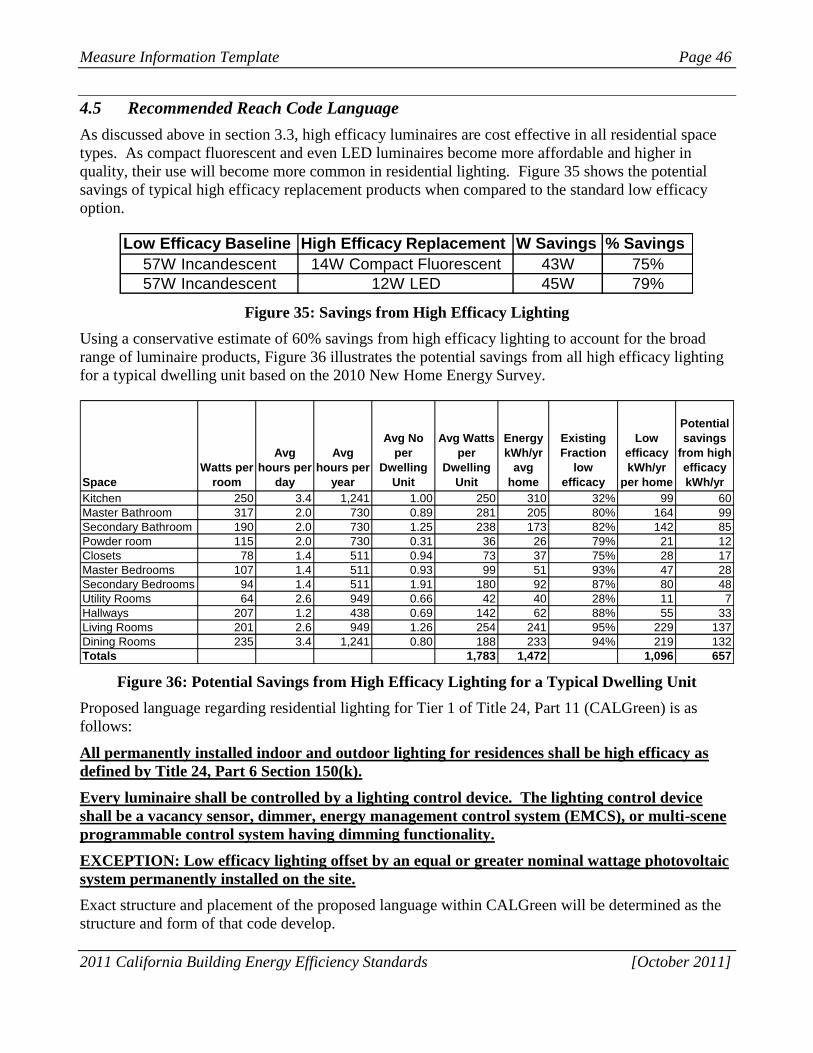
Measure Information Template Page 46
2011 California Building Energy Efficiency Standards [October 2011]
4.5 Recommended Reach Code Language
As discussed above in section 3.3, high efficacy luminaires are cost effective in all residential space
types. As compact fluorescent and even LED luminaires become more affordable and higher in
quality, their use will become more common in residential lighting. Figure 35 shows the potential
savings of typical high efficacy replacement products when compared to the standard low efficacy
option.
Figure 35: Savings from High Efficacy Lighting
Using a conservative estimate of 60% savings from high efficacy lighting to account for the broad
range of luminaire products, Figure 36 illustrates the potential savings from all high efficacy lighting
for a typical dwelling unit based on the 2010 New Home Energy Survey.
Figure 36: Potential Savings from High Efficacy Lighting for a Typical Dwelling Unit
Proposed language regarding residential lighting for Tier 1 of Title 24, Part 11 (CALGreen) is as
follows:
All permanently installed indoor and outdoor lighting for residences shall be high efficacy as
defined by Title 24, Part 6 Section 150(k).
Every luminaire shall be controlled by a lighting control device. The lighting control device
shall be a vacancy sensor, dimmer, energy management control system (EMCS), or multi-scene
programmable control system having dimming functionality.
EXCEPTION: Low efficacy lighting offset by an equal or greater nominal wattage photovoltaic
system permanently installed on the site.
Exact structure and placement of the proposed language within CALGreen will be determined as the
structure and form of that code develop.
Low Efficacy Baseline High Efficacy Replacement W Savings % Savings
57W Incandescent 14W Compact Fluorescent 43W 75%
57W Incandescent 12W LED 45W 79%
Space
Watts per
room
Avg
hours per
day
Avg
hours per
year
Avg No
per
Dwelling
Unit
Avg Watts
per
Dwelling
Unit
Energy
kWh/yr
avg
home
Existing
Fraction
low
efficacy
Low
efficacy
kWh/yr
per home
Potential
savings
from high
efficacy
kWh/yr
Kitchen 250 3.4 1,241 1.00 250 310 32% 99 60
Master Bathroom 317 2.0 730 0.89 281 205 80% 164 99
Secondary Bathroom 190 2.0 730 1.25 238 173 82% 142 85
Powder room 115 2.0 730 0.31 36 26 79% 21 12
Closets 78 1.4 511 0.94 73 37 75% 28 17
Master Bedrooms 107 1.4 511 0.93 99 51 93% 47 28
Secondary Bedrooms 94 1.4 511 1.91 180 92 87% 80 48
Utility Rooms 64 2.6 949 0.66 42 40 28% 11 7
Hallways 207 1.2 438 0.69 142 62 88% 55 33
Living Rooms 201 2.6 949 1.26 254 241 95% 229 137
Dining Rooms 235 3.4 1,241 0.80 188 233 94% 219 132
Totals 1,783 1,472 1,096 657
Measure Information Template Page 47
2011 California Building Energy Efficiency Standards [October 2011]
5. Bibliography and Other Research
CEC (California Energy Commission). 1997. California Baseline: Lighting Efficiency Technology
Report. Report prepared by Heschong Mahone Group.
CEC (California Energy Commission), funded by a PIER Building Energy Research Grant, and co-
funded by the Statewide Utility Codes and Standards Program. 2010. California New Home Energy
Survey. Report prepared by Bruce Wilcox (not yet published).
CPUC (California Public Utilities Commission), Energy Division. 2010. Final Evaluation Report:
Upstream Lighting Program. Report prepared by KEMA, Inc., available at
http://calmac.org/publications/FinalUpstreamLightingEvaluationReport_Vol1_CALMAC_3.pdf
LRC (Lighting Research Center). 2003. Reducing Barriers to the Use of High Efficiency Lighting
Systems. Final Report: Year 2. Retrieved from
http://www.lrc.rpi.edu/researchAreas/reducingBarriers/pdf/year2FinalReport.pdf
SCE (Southern California Edison). 2009. Proximity of Workplace Lighting Controls CASE:
Literature Review. Unpublished. Submitted to SCE by the Heschong Mahone Group. Robert
Thompson SCE project manager.
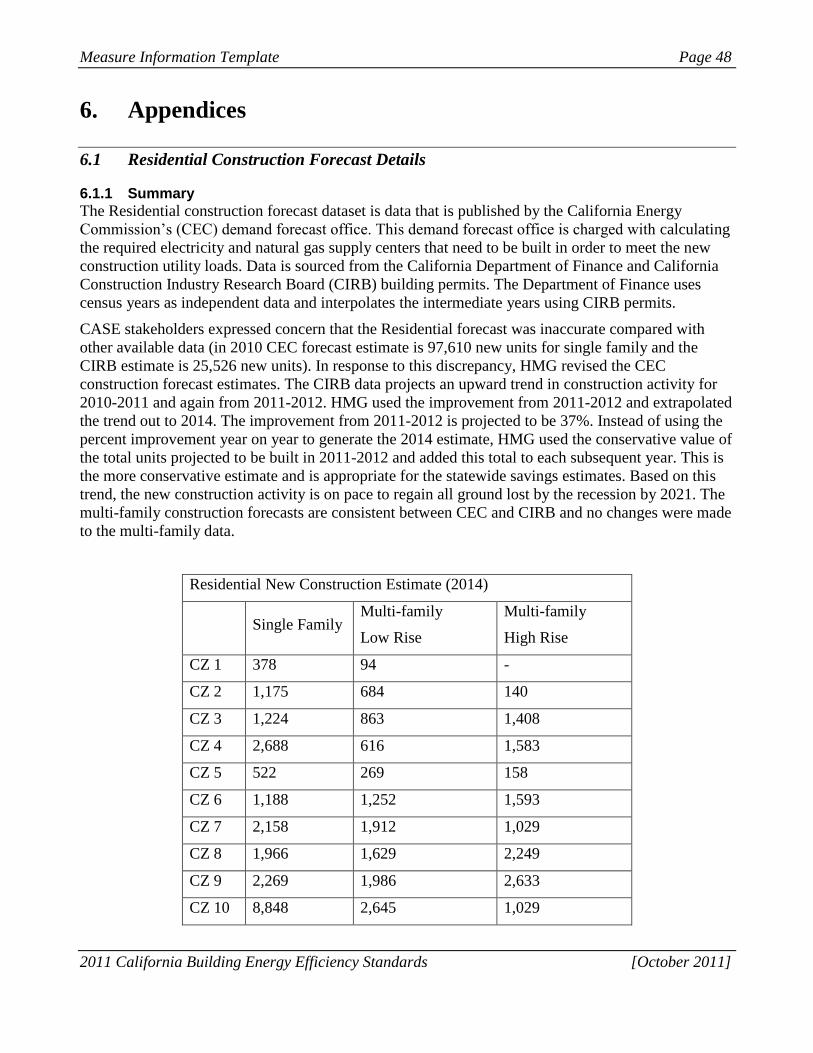
Measure Information Template Page 48
2011 California Building Energy Efficiency Standards [October 2011]
6. Appendices
6.1 Residential Construction Forecast Details
6.1.1 Summary
The Residential construction forecast dataset is data that is published by the California Energy
Commission’s (CEC) demand forecast office. This demand forecast office is charged with calculating
the required electricity and natural gas supply centers that need to be built in order to meet the new
construction utility loads. Data is sourced from the California Department of Finance and California
Construction Industry Research Board (CIRB) building permits. The Department of Finance uses
census years as independent data and interpolates the intermediate years using CIRB permits.
CASE stakeholders expressed concern that the Residential forecast was inaccurate compared with
other available data (in 2010 CEC forecast estimate is 97,610 new units for single family and the
CIRB estimate is 25,526 new units). In response to this discrepancy, HMG revised the CEC
construction forecast estimates. The CIRB data projects an upward trend in construction activity for
2010-2011 and again from 2011-2012. HMG used the improvement from 2011-2012 and extrapolated
the trend out to 2014. The improvement from 2011-2012 is projected to be 37%. Instead of using the
percent improvement year on year to generate the 2014 estimate, HMG used the conservative value of
the total units projected to be built in 2011-2012 and added this total to each subsequent year. This is
the more conservative estimate and is appropriate for the statewide savings estimates. Based on this
trend, the new construction activity is on pace to regain all ground lost by the recession by 2021. The
multi-family construction forecasts are consistent between CEC and CIRB and no changes were made
to the multi-family data.
Residential New Construction Estimate (2014)
Single Family
Multi-family
Low Rise
Multi-family
High Rise
CZ 1 378 94 -
CZ 2 1,175 684 140
CZ 3 1,224 863 1,408
CZ 4 2,688 616 1,583
CZ 5 522 269 158
CZ 6 1,188 1,252 1,593
CZ 7 2,158 1,912 1,029
CZ 8 1,966 1,629 2,249
CZ 9 2,269 1,986 2,633
CZ 10 8,848 2,645 1,029
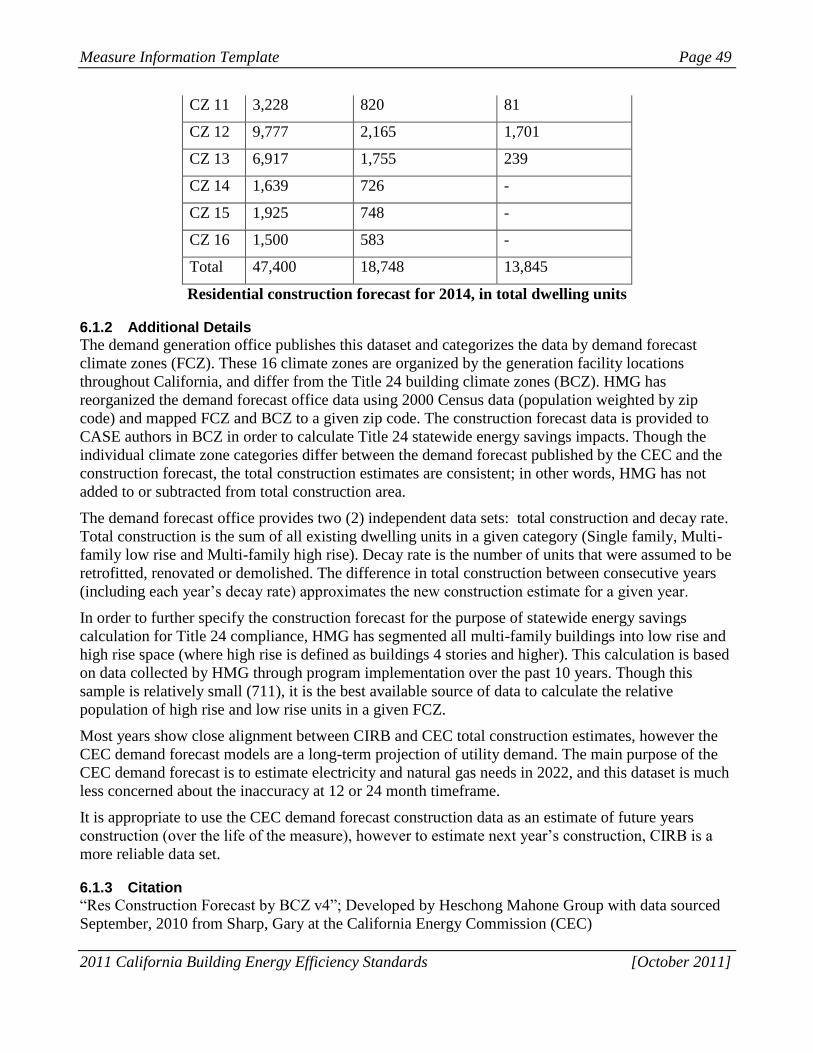
Measure Information Template Page 49
2011 California Building Energy Efficiency Standards [October 2011]
CZ 11 3,228 820 81
CZ 12 9,777 2,165 1,701
CZ 13 6,917 1,755 239
CZ 14 1,639 726 -
CZ 15 1,925 748 -
CZ 16 1,500 583 -
Total 47,400 18,748 13,845
Residential construction forecast for 2014, in total dwelling units
6.1.2 Additional Details
The demand generation office publishes this dataset and categorizes the data by demand forecast
climate zones (FCZ). These 16 climate zones are organized by the generation facility locations
throughout California, and differ from the Title 24 building climate zones (BCZ). HMG has
reorganized the demand forecast office data using 2000 Census data (population weighted by zip
code) and mapped FCZ and BCZ to a given zip code. The construction forecast data is provided to
CASE authors in BCZ in order to calculate Title 24 statewide energy savings impacts. Though the
individual climate zone categories differ between the demand forecast published by the CEC and the
construction forecast, the total construction estimates are consistent; in other words, HMG has not
added to or subtracted from total construction area.
The demand forecast office provides two (2) independent data sets: total construction and decay rate.
Total construction is the sum of all existing dwelling units in a given category (Single family, Multi-
family low rise and Multi-family high rise). Decay rate is the number of units that were assumed to be
retrofitted, renovated or demolished. The difference in total construction between consecutive years
(including each year’s decay rate) approximates the new construction estimate for a given year.
In order to further specify the construction forecast for the purpose of statewide energy savings
calculation for Title 24 compliance, HMG has segmented all multi-family buildings into low rise and
high rise space (where high rise is defined as buildings 4 stories and higher). This calculation is based
on data collected by HMG through program implementation over the past 10 years. Though this
sample is relatively small (711), it is the best available source of data to calculate the relative
population of high rise and low rise units in a given FCZ.
Most years show close alignment between CIRB and CEC total construction estimates, however the
CEC demand forecast models are a long-term projection of utility demand. The main purpose of the
CEC demand forecast is to estimate electricity and natural gas needs in 2022, and this dataset is much
less concerned about the inaccuracy at 12 or 24 month timeframe.
It is appropriate to use the CEC demand forecast construction data as an estimate of future years
construction (over the life of the measure), however to estimate next year’s construction, CIRB is a
more reliable data set.
6.1.3 Citation
“Res Construction Forecast by BCZ v4”; Developed by Heschong Mahone Group with data sourced
September, 2010 from Sharp, Gary at the California Energy Commission (CEC)
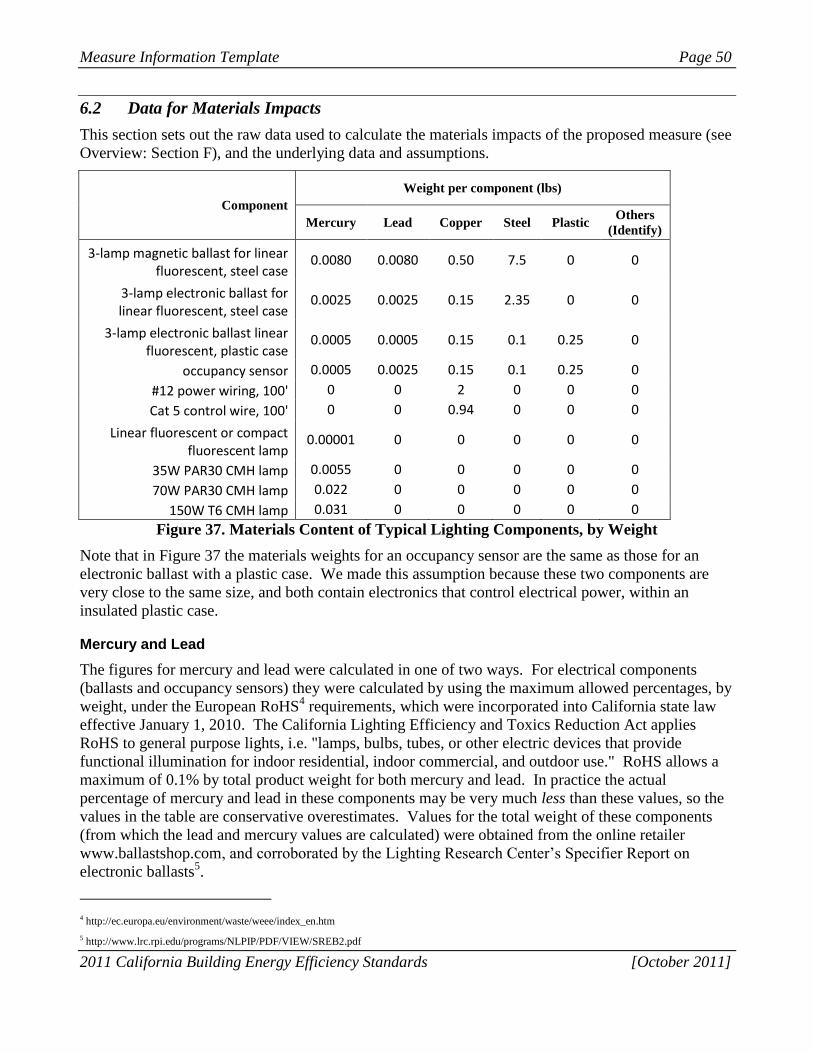
Measure Information Template Page 50
2011 California Building Energy Efficiency Standards [October 2011]
6.2 Data for Materials Impacts
This section sets out the raw data used to calculate the materials impacts of the proposed measure (see
Overview: Section F), and the underlying data and assumptions.
Component
Weight per component (lbs)
Mercury Lead Copper Steel Plastic Others
(Identify)
3-lamp magnetic ballast for linear fluorescent, steel case
0.0080 0.0080 0.50 7.5 0 0
3-lamp electronic ballast for linear fluorescent, steel case
0.0025 0.0025 0.15 2.35 0 0
3-lamp electronic ballast linear fluorescent, plastic case
0.0005 0.0005 0.15 0.1 0.25 0
occupancy sensor 0.0005 0.0025 0.15 0.1 0.25 0
#12 power wiring, 100' 0 0 2 0 0 0
Cat 5 control wire, 100' 0 0 0.94 0 0 0
Linear fluorescent or compact fluorescent lamp
0.00001 0 0 0 0 0
35W PAR30 CMH lamp 0.0055 0 0 0 0 0
70W PAR30 CMH lamp 0.022 0 0 0 0 0
150W T6 CMH lamp 0.031 0 0 0 0 0
Figure 37. Materials Content of Typical Lighting Components, by Weight
Note that in Figure 37 the materials weights for an occupancy sensor are the same as those for an
electronic ballast with a plastic case. We made this assumption because these two components are
very close to the same size, and both contain electronics that control electrical power, within an
insulated plastic case.
Mercury and Lead
The figures for mercury and lead were calculated in one of two ways. For electrical components
(ballasts and occupancy sensors) they were calculated by using the maximum allowed percentages, by
weight, under the European RoHS4 requirements, which were incorporated into California state law
effective January 1, 2010. The California Lighting Efficiency and Toxics Reduction Act applies
RoHS to general purpose lights, i.e. "lamps, bulbs, tubes, or other electric devices that provide
functional illumination for indoor residential, indoor commercial, and outdoor use." RoHS allows a
maximum of 0.1% by total product weight for both mercury and lead. In practice the actual
percentage of mercury and lead in these components may be very much less than these values, so the
values in the table are conservative overestimates. Values for the total weight of these components
(from which the lead and mercury values are calculated) were obtained from the online retailer
www.ballastshop.com, and corroborated by the Lighting Research Center’s Specifier Report on
electronic ballasts5.
4 http://ec.europa.eu/environment/waste/weee/index_en.htm
5 http://www.lrc.rpi.edu/programs/NLPIP/PDF/VIEW/SREB2.pdf
Measure Information Template Page 51
2011 California Building Energy Efficiency Standards [October 2011]
For lamps, the mercury content of the lamp is almost always given by the lamp manufacturer in
product cut sheets. The figures in the table are all based on high-volume products from the online
catalog for Philips lighting. The amount of lead in a lamp is assumed to be negligible; no information
on the presence of these substances in lamps could be found either from product manufacturers or
from online sources.
Copper, Steel and Plastics
For ballasts, the amount of copper and steel was estimated by comparing the weight of the electronic
plastic-cased ballast with the electronic steel-cased ballast, and assuming that the difference in weight
was due to the steel case (i.e., that the electronics inside the two ballasts were the same). For the
plastic ballast, a little more than half the weight of the component was assumed to come from the
case, with the remaining weight being made up by copper and steel. For the magnetic ballast, the
weights for copper and steel were scaled up from the electronic ballast, in proportion to the increase in
total component weight (from 2.5lbs up to 8lbs).
For wiring, the weight of copper was calculated using the cross-sectional area of the conductor wires,
and multiplying this by the nominal length (100’) and by the density of copper (8.94 g/cm3). The area
of the conductor wires was obtained from online sources6.
For lamps, the amount of copper, steel and plastic in a lamp is assumed to be negligible; no
information on the presence of these substances in lamps could be found either from product
manufacturers or from online sources.
6 http://en.wikipedia.org/wiki/American_wire_gauge, and http://en.wikipedia.org/wiki/Cat_5

![OMAR Online Replacement - California ISO€¦ · Owner: Lam, Rick Copyright 2012 California ISO Doc ID: GNFDMDEHU6BB-46-46 Page 6 of 67 Technology Template Version: [Template Version]](https://img.pdfslide.us/doc/110x75/5b6eef907f8b9a66338b4cd1/omar-online-replacement-california-iso-owner-lam-rick-copyright-2012-california.jpg)

![OMAR Online Replacement - California ISO · Owner: Lam, Rick Copyright 2012 California ISO Doc ID: GNFDMDEHU6BB-46-46 Page 6 of 67 Technology Template Version: [Template Version]](https://img.pdfslide.us/doc/110x75/5bddf36209d3f222578bb443/omar-online-replacement-california-owner-lam-rick-copyright-2012-california.jpg)


![Blank Template no numbers[1] - Santa Clarita, California](https://img.pdfslide.us/doc/110x75/626f26400f71187ad03b3ed3/blank-template-no-numbers1-santa-clarita-california.jpg)