Embed Size (px)
Citation preview
June 2009
This publication was prepared by J.E. Austin Associates, Inc. for the Business Growth Initiative
Project and financed by the Office of Economic Growth of EGAT/USAID. This report is also available
on the Business Growth Initiative project website at www.BusinessGrowthInitiative.org.
MEASURE: ETHIOPIA
THE ENTERPRISE DEVELOPMENT DIAGNOSTIC FOR USAID/ETHIOPIA
MEASURE: ETHIOPIA
THE ENTERPRISE DEVELOPMENT DIAGNOSTIC FOR USAID/ETHIOPIA
Authored by:
Carlton Jones
Submitted to:
USAID/EGAT/EG
Contract No.:
EEM-C-00-06-00022-00
June 2009
www.BusinessGrowthInitiative.org
DISCLAIMER
The authors’ views expressed in this publication do not necessarily reflect the views of the United States Agency for International Development or the United States Government.
Table of Contents
Executive Summary ...................................................................................................................... 1
Introduction and Purpose ............................................................................................................. 3 The MEASURE Framework ............................................................................................................. 4
Overview of Enterprises in Ethiopia ............................................................................................ 5
Ethiopia’s Indicators at a Glance ................................................................................................. 6 Other Strengths and Weaknesses identified by Enterprise Survey, not derived from Indicators ... 7
Measuring the State of Enterprise Development in Ethiopia .................................................... 8 Enterprise Performance ................................................................................................................... 8 Structure and Enterprise Landscape ............................................................................................. 10 Enterprise Sophistication ............................................................................................................... 11
Access to Finance, Equity and Venture Capital ....................................................................... 14
Workforce and Skills Development ........................................................................................... 15
Legal, Regulatory and Competitive Environment .................................................................... 17 Legal and Regulatory Environment ............................................................................................... 17 Competitive Environment .............................................................................................................. 18
Knowledge and Technology ....................................................................................................... 19
Enterprise Response ................................................................................................................... 19 Poor access to working capital ...................................................................................................... 20 Low productivity per employee and Poor Access to Business Services ....................................... 20 Poorly coordinated value chains .................................................................................................... 21
Conclusions ................................................................................................................................. 21 Measuring enterprise response over time ..................................................................................... 22
Appendix ...................................................................................................................................... 24 Appendix 1: Ethiopia‟s Indicators .................................................................................................. 24 Appendix 2: Explanation of MEASURE Indicators ....................................................................... 26 Appendix 3: The MEASURE Enterprise Survey ........................................................................... 29 Appendix 4: List of Enterprises Surveyed .................................................................................... 36
1
Executive Summary The Business Growth Initiative (BGI) project has developed an enterprise development diagnostic (MEASURE) to provide U.S. Agency for International Development (USAID) missions with a tool that assists them in understanding:
Changes in business performance;
Changes in business behavior and decision making; and
How those changes are impacted by changes in the business economic environment, focused on the firm level.
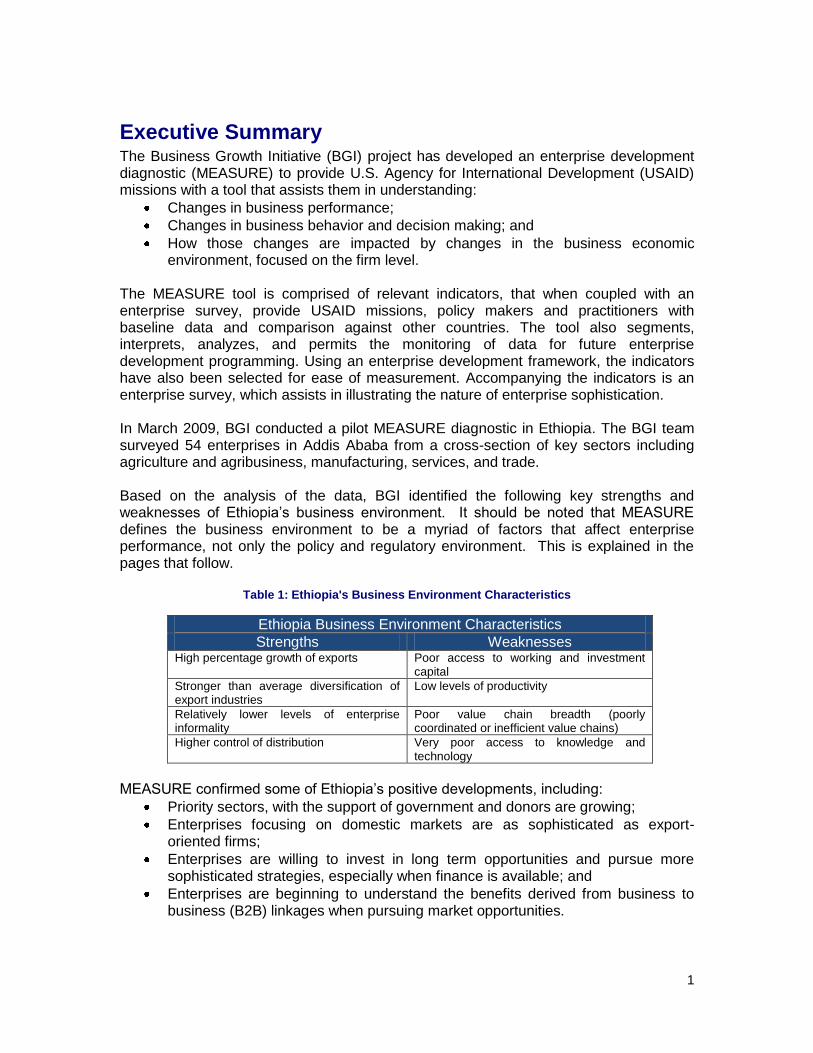
The MEASURE tool is comprised of relevant indicators, that when coupled with an enterprise survey, provide USAID missions, policy makers and practitioners with baseline data and comparison against other countries. The tool also segments, interprets, analyzes, and permits the monitoring of data for future enterprise development programming. Using an enterprise development framework, the indicators have also been selected for ease of measurement. Accompanying the indicators is an enterprise survey, which assists in illustrating the nature of enterprise sophistication. In March 2009, BGI conducted a pilot MEASURE diagnostic in Ethiopia. The BGI team surveyed 54 enterprises in Addis Ababa from a cross-section of key sectors including agriculture and agribusiness, manufacturing, services, and trade. Based on the analysis of the data, BGI identified the following key strengths and weaknesses of Ethiopia‟s business environment. It should be noted that MEASURE defines the business environment to be a myriad of factors that affect enterprise performance, not only the policy and regulatory environment. This is explained in the pages that follow.
Table 1: Ethiopia's Business Environment Characteristics
Ethiopia Business Environment Characteristics
Strengths Weaknesses High percentage growth of exports Poor access to working and investment
capital
Stronger than average diversification of export industries
Low levels of productivity
Relatively lower levels of enterprise informality
Poor value chain breadth (poorly coordinated or inefficient value chains)
Higher control of distribution Very poor access to knowledge and technology
MEASURE confirmed some of Ethiopia‟s positive developments, including:
Priority sectors, with the support of government and donors are growing;
Enterprises focusing on domestic markets are as sophisticated as export-oriented firms;
Enterprises are willing to invest in long term opportunities and pursue more sophisticated strategies, especially when finance is available; and
Enterprises are beginning to understand the benefits derived from business to business (B2B) linkages when pursuing market opportunities.
2
Results from MEASURE also indicate that, in response to country weaknesses, Ethiopian firms have developed several coping strategies including:
Delaying expansion and new product offerings until financing is secure;
Seeking joint ventures, both from foreign and domestic investors;
Hiring outside consultants to improve productivity and solve operational inefficiencies;
Enhancing compensation/incentive plans with hopes of increasing per person productivity; and
Seeking opportunities to vertically integrate in order to drive down operating costs, improve value chain inefficiencies, or have better control of supply chains.
MEASURE is intended primarily as a diagnostic tool. When its results are applied in the context of analyzing business responses to changes in the firm-level business environment, logical entry-points emerge. By taking into consideration these entry-points, and expected business responses, USAID missions can utilize MEASURE as a resource for developing strategies and programs to improve enterprise development, and ultimately economic growth, for the country.
3
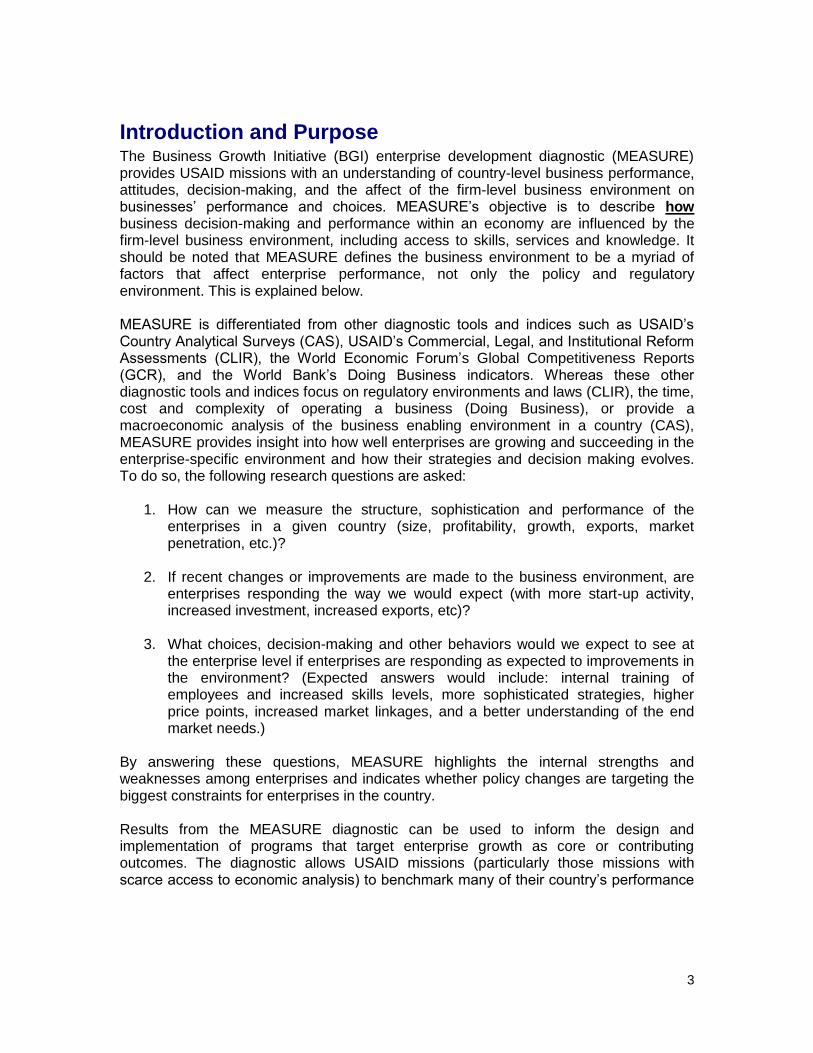
Introduction and Purpose The Business Growth Initiative (BGI) enterprise development diagnostic (MEASURE) provides USAID missions with an understanding of country-level business performance, attitudes, decision-making, and the affect of the firm-level business environment on businesses‟ performance and choices. MEASURE‟s objective is to describe how business decision-making and performance within an economy are influenced by the firm-level business environment, including access to skills, services and knowledge. It should be noted that MEASURE defines the business environment to be a myriad of factors that affect enterprise performance, not only the policy and regulatory environment. This is explained below. MEASURE is differentiated from other diagnostic tools and indices such as USAID‟s Country Analytical Surveys (CAS), USAID‟s Commercial, Legal, and Institutional Reform Assessments (CLIR), the World Economic Forum‟s Global Competitiveness Reports (GCR), and the World Bank‟s Doing Business indicators. Whereas these other diagnostic tools and indices focus on regulatory environments and laws (CLIR), the time, cost and complexity of operating a business (Doing Business), or provide a macroeconomic analysis of the business enabling environment in a country (CAS), MEASURE provides insight into how well enterprises are growing and succeeding in the enterprise-specific environment and how their strategies and decision making evolves. To do so, the following research questions are asked:
1. How can we measure the structure, sophistication and performance of the enterprises in a given country (size, profitability, growth, exports, market penetration, etc.)?
2. If recent changes or improvements are made to the business environment, are
enterprises responding the way we would expect (with more start-up activity, increased investment, increased exports, etc)?
3. What choices, decision-making and other behaviors would we expect to see at
the enterprise level if enterprises are responding as expected to improvements in the environment? (Expected answers would include: internal training of employees and increased skills levels, more sophisticated strategies, higher price points, increased market linkages, and a better understanding of the end market needs.)
By answering these questions, MEASURE highlights the internal strengths and weaknesses among enterprises and indicates whether policy changes are targeting the biggest constraints for enterprises in the country. Results from the MEASURE diagnostic can be used to inform the design and implementation of programs that target enterprise growth as core or contributing outcomes. The diagnostic allows USAID missions (particularly those missions with scarce access to economic analysis) to benchmark many of their country‟s performance
4
and business environment characteristics against those of comparison countries.1 Such comparisons provide opportunities to assess the enterprise-level impacts of various patterns and characteristics of firm-level business environments, and offer opportunities to learn and draw from model project activities and designs. MEASURE is designed to assist USAID in project design activities by identifying constraints within enterprises and in the relevant firm-level business environment in which they operate. Additional uses of the tool include: establishing baseline data from which to track and monitor the impact of improvements in the firm-level business environment on enterprise development (especially decision making) and helping USAID missions and others recognize possible actions to maximize greater enterprise development. BGI has developed a definition as well as a key objective and proposition for sustainable enterprise development drawing from an extensive literature review, along with input from thought leaders in economic and private sector development.
Definition: Enterprise development aims to improve business opportunities and incentives for individual firms and the private sector generally and to strengthen their capacity to create wealth, expand, and operate in the formal economy. Corollary #1: Enterprise development enhances private sector performance as a means to reduce poverty and foster a more equitable distribution of income by increasing rates of economic growth, enterprise growth, and employment. Corollary #2: Sustainable enterprise development initiatives include measures to improve the business enabling environment and strengthen vertical and horizontal linkages for improved performance.
The MEASURE Framework The core component of the MEASURE framework includes indicators of business behaviors and decision-making with respect to strategies, investment in human resources, willingness to collaborate, investment in productive processes and other factors of performance. The MEASURE framework looks at enterprise level responses to four enablers. Each enabler reinforces the development of enterprises, which is the centerpiece of the framework. The four enablers of the MEASURE framework focus on improving business opportunities and incentives, while strengthening the capacity to create and expand enterprises in the formal economy. These elements include: a supportive legal, regulatory, and competitive environment; access to finance; the presence of sophisticated knowledge and technology; and access to a workforce of educated and technically competent human capital. For each enabler, there are corresponding indicators. Together, these four enablers combine to support enterprise development and growth.
1Comparison countries can be selected based on characteristics such as: regional significance, income-
based, economic or structural similarities, countries of special interest, etc. For this diagnostic, the comparison countries are: Kenya, Uganda, and South Africa.

5
Through the lens of the enterprise development diagnostic framework, the MEASURE tool is comprised of relevant indicators, appropriate for segmentation, interpretation and analysis, and a corresponding enterprise survey. The indicators are selected for ease of measurement and comparability, and provide a snapshot of the enablers that support the state of enterprise in a given country. The enterprise survey provides depth, validation, and in some cases clarity, to the country indicators and illustrates the country‟s level of enterprise sophistication, performance and landscape. In March 2009, the BGI team surveyed 54 enterprises in Addis Ababa from a cross-section of key sectors including agriculture and agribusiness, manufacturing and industry, trade and services sectors.2 This report summarizes the information and findings from the study.
Overview of Enterprises in Ethiopia Ethiopia‟s economy is predominated by its agricultural sector. The sector constitutes 60% of Ethiopia‟s exports, 80% of total employment and 46% of its Gross Domestic Product (GDP). The rest of Ethiopia‟s economy is comprised of the services sector (40% of GDP) and Industry (13%).3 The BGI team made its best effort to mirror representative percentages of enterprises surveyed. However, because of the availability and location of respondents, this was not fully achieved. The industry percentage breakdown of the 54 enterprises surveyed by the MEASURE Team was:
2Ideally, MEASURE diagnostics target a minimum of 100 enterprises. As the initial pilot, with an abbreviated
schedule, fewer firms were surveyed. 3World Bank, WDI 2008.
6
Agriculture/agribusiness – 42.6%
Manufacturing/industry – 42.6%
Trading – 11.1%
Services – 5.6%.
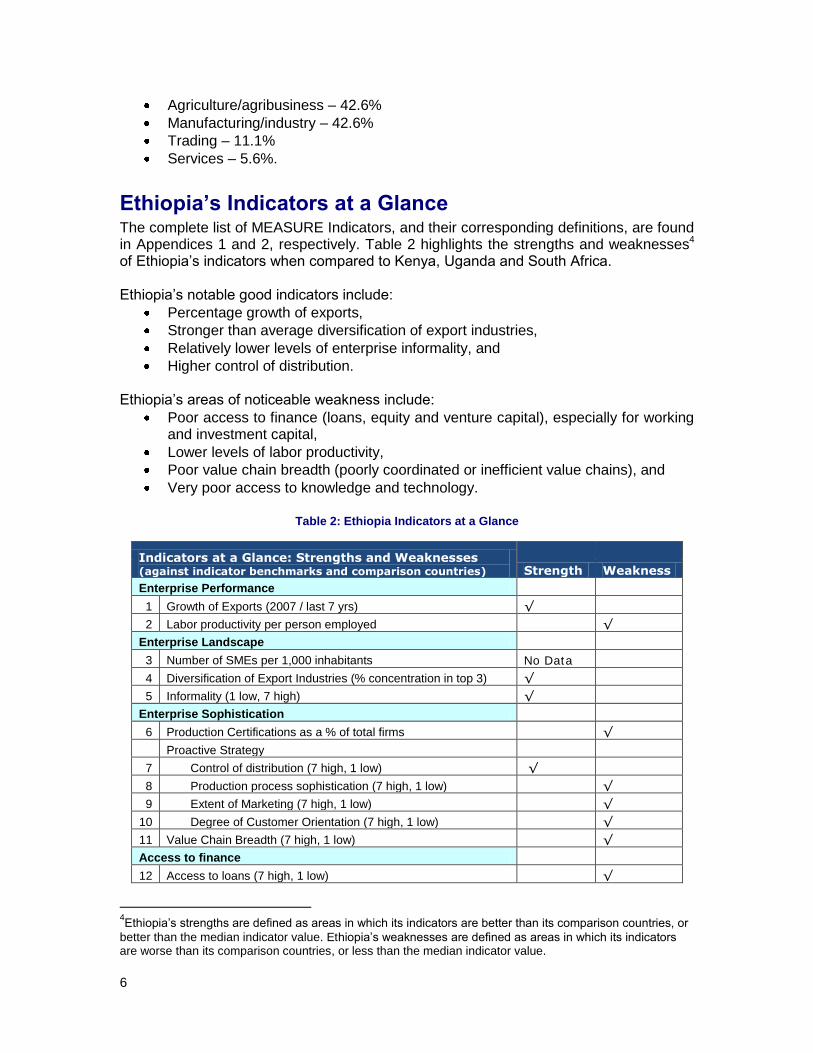
Ethiopia’s Indicators at a Glance The complete list of MEASURE Indicators, and their corresponding definitions, are found in Appendices 1 and 2, respectively. Table 2 highlights the strengths and weaknesses4 of Ethiopia‟s indicators when compared to Kenya, Uganda and South Africa. Ethiopia‟s notable good indicators include:
Percentage growth of exports,
Stronger than average diversification of export industries,
Relatively lower levels of enterprise informality, and
Higher control of distribution. Ethiopia‟s areas of noticeable weakness include:
Poor access to finance (loans, equity and venture capital), especially for working and investment capital,
Lower levels of labor productivity,
Poor value chain breadth (poorly coordinated or inefficient value chains), and
Very poor access to knowledge and technology.
Table 2: Ethiopia Indicators at a Glance
Indicators at a Glance: Strengths and Weaknesses (against indicator benchmarks and comparison countries) Strength Weakness
Enterprise Performance
1 Growth of Exports (2007 / last 7 yrs) √
2 Labor productivity per person employed √
Enterprise Landscape
3 Number of SMEs per 1,000 inhabitants No Data
4 Diversification of Export Industries (% concentration in top 3) √
5 Informality (1 low, 7 high) √
Enterprise Sophistication
6 Production Certifications as a % of total firms √
Proactive Strategy
7 Control of distribution (7 high, 1 low) √
8 Production process sophistication (7 high, 1 low) √
9 Extent of Marketing (7 high, 1 low) √
10 Degree of Customer Orientation (7 high, 1 low) √
11 Value Chain Breadth (7 high, 1 low) √
Access to finance
12 Access to loans (7 high, 1 low) √
4Ethiopia‟s strengths are defined as areas in which its indicators are better than its comparison countries, or
better than the median indicator value. Ethiopia‟s weaknesses are defined as areas in which its indicators are worse than its comparison countries, or less than the median indicator value.
7
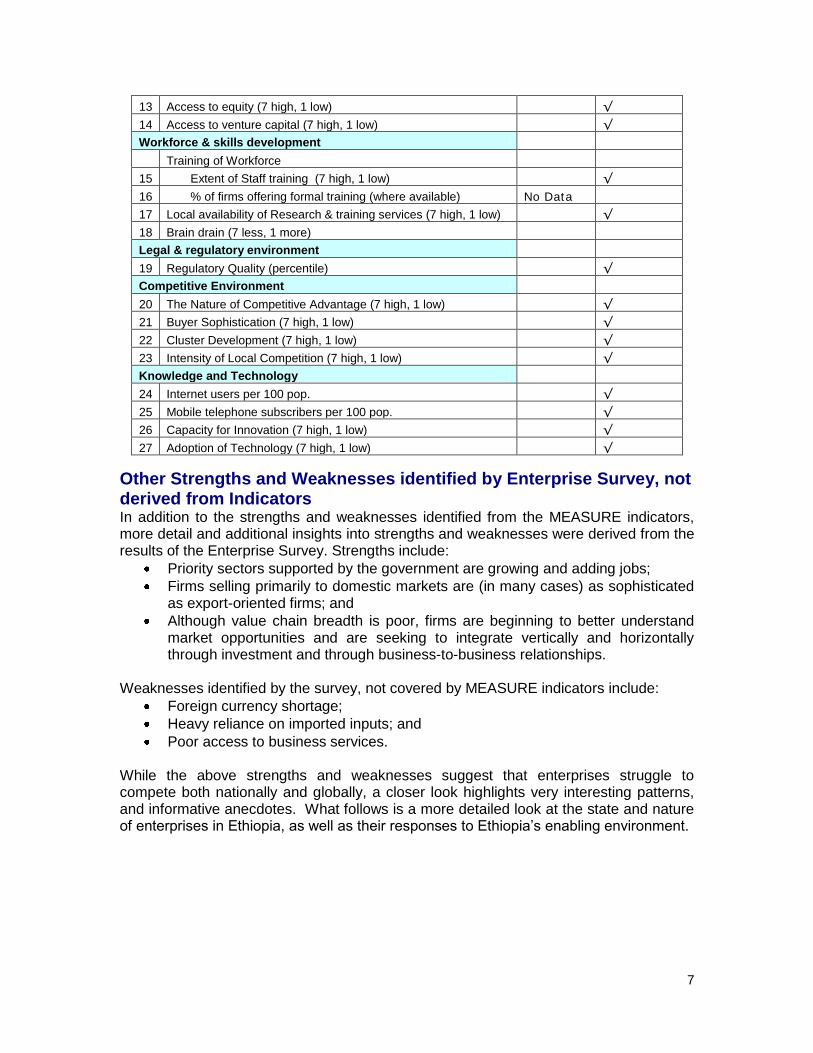
13 Access to equity (7 high, 1 low) √
14 Access to venture capital (7 high, 1 low) √
Workforce & skills development
Training of Workforce
15 Extent of Staff training (7 high, 1 low) √
16 % of firms offering formal training (where available) No Data
17 Local availability of Research & training services (7 high, 1 low) √
18 Brain drain (7 less, 1 more)
Legal & regulatory environment
19 Regulatory Quality (percentile) √
Competitive Environment
20 The Nature of Competitive Advantage (7 high, 1 low) √
21 Buyer Sophistication (7 high, 1 low) √
22 Cluster Development (7 high, 1 low) √
23 Intensity of Local Competition (7 high, 1 low) √
Knowledge and Technology
24 Internet users per 100 pop. √
25 Mobile telephone subscribers per 100 pop. √
26 Capacity for Innovation (7 high, 1 low) √
27 Adoption of Technology (7 high, 1 low) √
Other Strengths and Weaknesses identified by Enterprise Survey, not derived from Indicators In addition to the strengths and weaknesses identified from the MEASURE indicators, more detail and additional insights into strengths and weaknesses were derived from the results of the Enterprise Survey. Strengths include:
Priority sectors supported by the government are growing and adding jobs;
Firms selling primarily to domestic markets are (in many cases) as sophisticated as export-oriented firms; and
Although value chain breadth is poor, firms are beginning to better understand market opportunities and are seeking to integrate vertically and horizontally through investment and through business-to-business relationships.
Weaknesses identified by the survey, not covered by MEASURE indicators include:
Foreign currency shortage;
Heavy reliance on imported inputs; and
Poor access to business services. While the above strengths and weaknesses suggest that enterprises struggle to compete both nationally and globally, a closer look highlights very interesting patterns, and informative anecdotes. What follows is a more detailed look at the state and nature of enterprises in Ethiopia, as well as their responses to Ethiopia‟s enabling environment.
8
Measuring the State of
Enterprise Development in
Ethiopia MEASURE assesses the state of enterprise development by determining the performance of enterprises, the structure of enterprises and the landscape in which they operate, and, ultimately, the sophistication of those enterprises.
Enterprise Performance MEASURE interprets enterprise performance by the number and types of activities the enterprises are performing, the size and growth of exports, the labor productivity of those enterprises, and, the relative profitability of the enterprises in comparison to competitors in other economies. To assess these attributes, the following indicators are used:
Size & growth of exports and
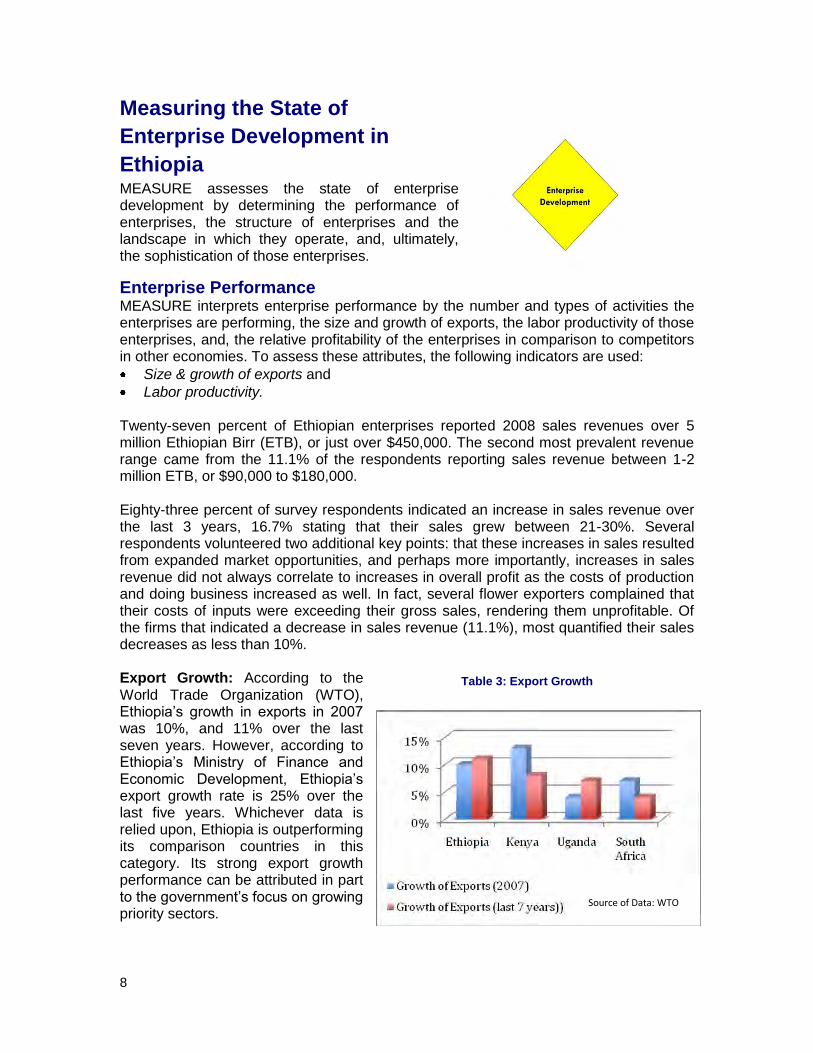
Labor productivity. Twenty-seven percent of Ethiopian enterprises reported 2008 sales revenues over 5 million Ethiopian Birr (ETB), or just over $450,000. The second most prevalent revenue range came from the 11.1% of the respondents reporting sales revenue between 1-2 million ETB, or $90,000 to $180,000. Eighty-three percent of survey respondents indicated an increase in sales revenue over the last 3 years, 16.7% stating that their sales grew between 21-30%. Several respondents volunteered two additional key points: that these increases in sales resulted from expanded market opportunities, and perhaps more importantly, increases in sales revenue did not always correlate to increases in overall profit as the costs of production and doing business increased as well. In fact, several flower exporters complained that their costs of inputs were exceeding their gross sales, rendering them unprofitable. Of the firms that indicated a decrease in sales revenue (11.1%), most quantified their sales decreases as less than 10%. Export Growth: According to the World Trade Organization (WTO), Ethiopia‟s growth in exports in 2007 was 10%, and 11% over the last seven years. However, according to Ethiopia‟s Ministry of Finance and Economic Development, Ethiopia‟s export growth rate is 25% over the last five years. Whichever data is relied upon, Ethiopia is outperforming its comparison countries in this category. Its strong export growth performance can be attributed in part to the government‟s focus on growing priority sectors.
Table 3: Export Growth
Source of Data: WTO
9
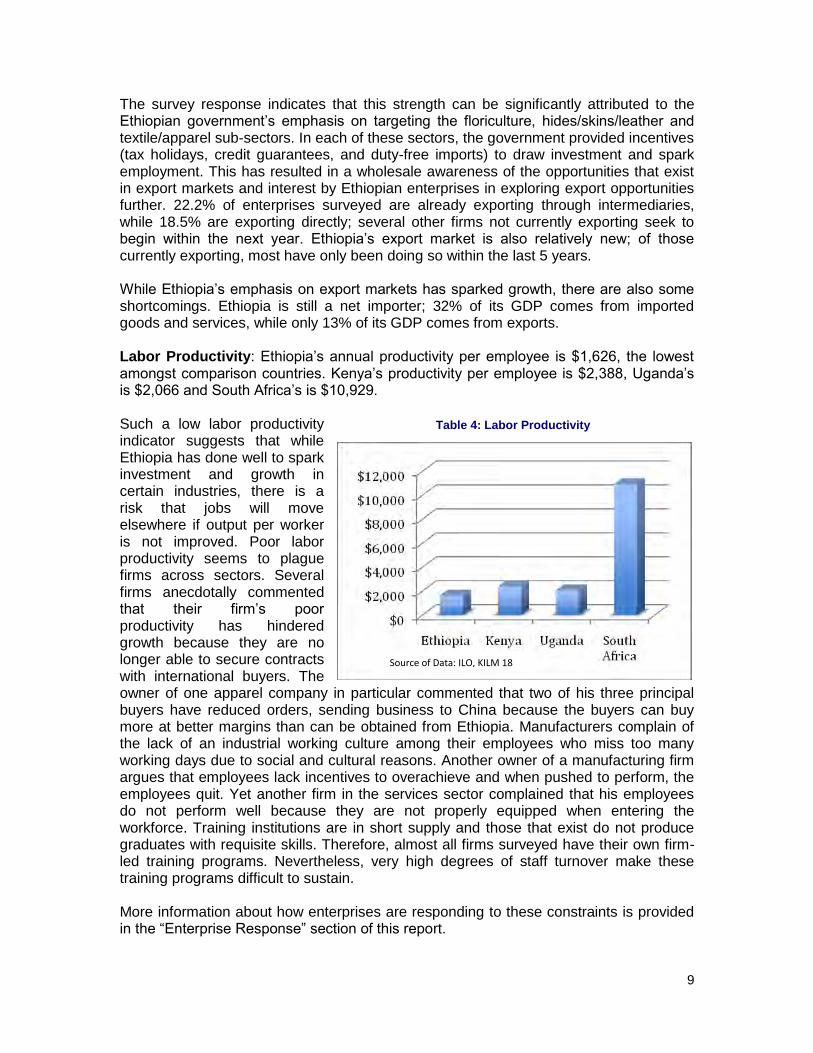
The survey response indicates that this strength can be significantly attributed to the Ethiopian government‟s emphasis on targeting the floriculture, hides/skins/leather and textile/apparel sub-sectors. In each of these sectors, the government provided incentives (tax holidays, credit guarantees, and duty-free imports) to draw investment and spark employment. This has resulted in a wholesale awareness of the opportunities that exist in export markets and interest by Ethiopian enterprises in exploring export opportunities further. 22.2% of enterprises surveyed are already exporting through intermediaries, while 18.5% are exporting directly; several other firms not currently exporting seek to begin within the next year. Ethiopia‟s export market is also relatively new; of those currently exporting, most have only been doing so within the last 5 years. While Ethiopia‟s emphasis on export markets has sparked growth, there are also some shortcomings. Ethiopia is still a net importer; 32% of its GDP comes from imported goods and services, while only 13% of its GDP comes from exports. Labor Productivity: Ethiopia‟s annual productivity per employee is $1,626, the lowest amongst comparison countries. Kenya‟s productivity per employee is $2,388, Uganda‟s is $2,066 and South Africa‟s is $10,929. Such a low labor productivity indicator suggests that while Ethiopia has done well to spark investment and growth in certain industries, there is a risk that jobs will move elsewhere if output per worker is not improved. Poor labor productivity seems to plague firms across sectors. Several firms anecdotally commented that their firm‟s poor productivity has hindered growth because they are no longer able to secure contracts with international buyers. The owner of one apparel company in particular commented that two of his three principal buyers have reduced orders, sending business to China because the buyers can buy more at better margins than can be obtained from Ethiopia. Manufacturers complain of the lack of an industrial working culture among their employees who miss too many working days due to social and cultural reasons. Another owner of a manufacturing firm argues that employees lack incentives to overachieve and when pushed to perform, the employees quit. Yet another firm in the services sector complained that his employees do not perform well because they are not properly equipped when entering the workforce. Training institutions are in short supply and those that exist do not produce graduates with requisite skills. Therefore, almost all firms surveyed have their own firm-led training programs. Nevertheless, very high degrees of staff turnover make these training programs difficult to sustain. More information about how enterprises are responding to these constraints is provided in the “Enterprise Response” section of this report.
Table 4: Labor Productivity
Source of Data: ILO, KILM 18
10
Structure and Enterprise Landscape The distribution and evolution of firm size, the degree of formality, entrepreneurship and private ownership, and, the density and diversification of export industries characterize the structure and landscape of enterprises. MEASURE assesses these indicators to determine the enterprise structure and landscape. The indicators are:
Firm size,
Diversification of export industries, and
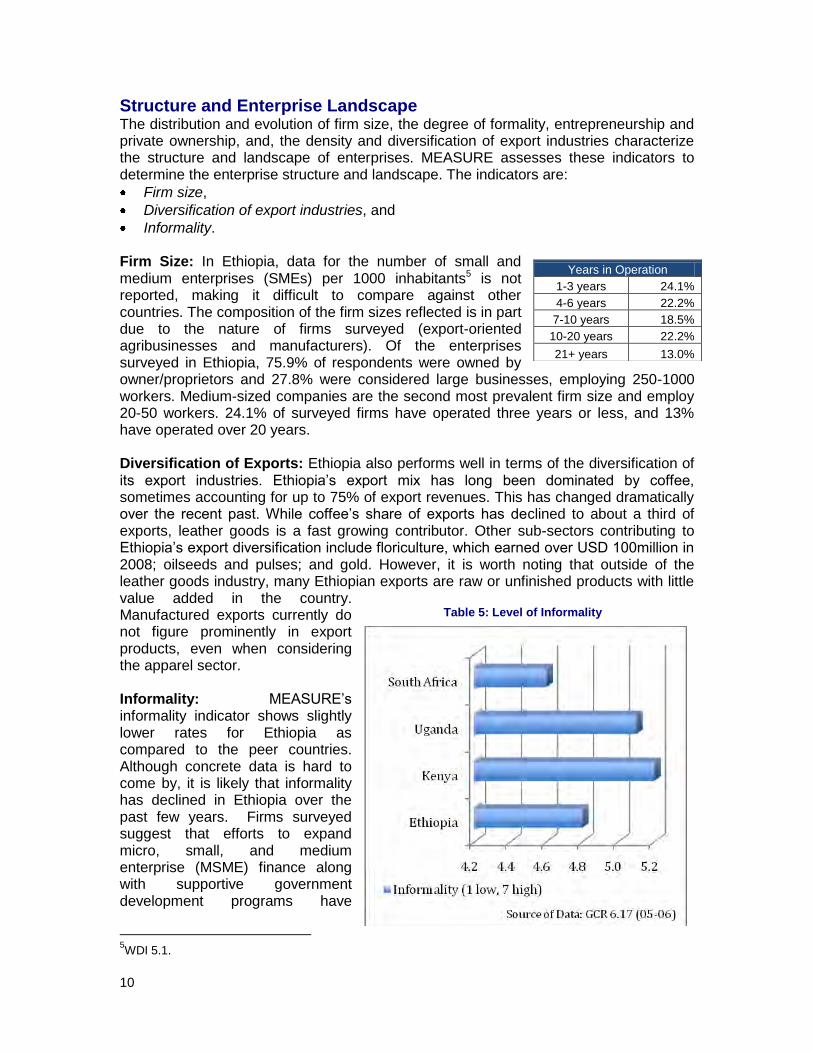
Informality. Firm Size: In Ethiopia, data for the number of small and medium enterprises (SMEs) per 1000 inhabitants5 is not reported, making it difficult to compare against other countries. The composition of the firm sizes reflected is in part due to the nature of firms surveyed (export-oriented agribusinesses and manufacturers). Of the enterprises surveyed in Ethiopia, 75.9% of respondents were owned by owner/proprietors and 27.8% were considered large businesses, employing 250-1000 workers. Medium-sized companies are the second most prevalent firm size and employ 20-50 workers. 24.1% of surveyed firms have operated three years or less, and 13% have operated over 20 years. Diversification of Exports: Ethiopia also performs well in terms of the diversification of its export industries. Ethiopia‟s export mix has long been dominated by coffee, sometimes accounting for up to 75% of export revenues. This has changed dramatically over the recent past. While coffee‟s share of exports has declined to about a third of exports, leather goods is a fast growing contributor. Other sub-sectors contributing to Ethiopia‟s export diversification include floriculture, which earned over USD 100million in 2008; oilseeds and pulses; and gold. However, it is worth noting that outside of the leather goods industry, many Ethiopian exports are raw or unfinished products with little value added in the country. Manufactured exports currently do not figure prominently in export products, even when considering the apparel sector. Informality: MEASURE‟s informality indicator shows slightly lower rates for Ethiopia as compared to the peer countries. Although concrete data is hard to come by, it is likely that informality has declined in Ethiopia over the past few years. Firms surveyed suggest that efforts to expand micro, small, and medium enterprise (MSME) finance along with supportive government development programs have
5WDI 5.1.
Years in Operation
1-3 years 24.1%
4-6 years 22.2%
7-10 years 18.5%
10-20 years 22.2%
21+ years 13.0%
Table 5: Level of Informality
11
contributed to lower rates of informality and higher numbers of taxpayers. Notwithstanding these declining informality trends, the informality of enterprises is still identified as a major problem constraining business growth. The World Bank‟s latest Investment Climate Assessment finds what it termed as “competition from the informal sector” as a major constraint to doing business in Ethiopia. Formally registered firms that pay value added tax (VAT), complain of having to unfairly compete with unregistered firms that charge less for their products. Several garment producers complained of having to compete with inexpensive Chinese made garments that enter the country without paying customs duties. One garment manufacturer serving the domestic market estimated his business could realize an additional 8% in annual revenue if he did not charge VAT (and thereby higher prices). In the livestock sector, traders continue to feel the negative impacts of informal cross-border trade, and unrealized sales. Oilseed and pulses exporters point out that despite overwhelming demand in world markets, local supply is at times constrained by the volume of Ethiopian products smuggled across the borders into neighboring countries.
Enterprise Sophistication In order for enterprise development efforts to be considered successful, the degree of enterprise sophistication must be enhanced. As described by Michael Porter, “the productivity of companies depends on the sophistication with which companies compete.”6 Increased sophistication is revealed by the forward-looking choices that enterprises make and the extent to which enterprises are investing in becoming more productive: training the workforce, adopting new technology, obtaining production certifications and investing in research and development. Sophistication is also evident in the degree to which enterprises proactively develop networks and pursue strategies to serve current markets in new ways and penetrate higher value markets. These characteristics are compared using the following indicators:
Production certifications,
Proactive Strategy7, and
Extent of value-add activities (value chain breadth). In Ethiopia, the level of enterprise sophistication varies by sector, but is generally low. In addition to indicators pointing to low levels of sophistication among Ethiopian enterprises, MEASURE‟s enterprise survey results lead to similar conclusions. Eighty-one percent of respondents described their production process as labor intensive, reliant upon low-skilled or unskilled manual labor. While the quantity and quality of input suppliers was deemed „good‟ by 38.9% and 44.4% of respondents respectively, many respondents (66.7%) rely heavily on imported technology for production, admitting these inputs were critical to production. Firm-level decision-making is done predominantly by the enterprise owners. Most firms (68.5%) admit that decisions are made in top management with little input from lower
6Porter, Michael, with C. Ketels and M. Delgado. 2007. “The Microeconomic Foundations of Prosperity:
Findings from the Business Competitiveness Index.” The Global Competitiveness Report 2007-2008. London: Palgrave Macmillan. 51-81. 7MEASURE attributes the following Global Competitiveness Report indicators as contributors to proactive
strategy: a) control of distribution, b) production process sophistication, c) extent of marketing and d) degree of customer orientation.
12
management, leaving little opportunity for secession planning, career development, or even alternative operation-level perspectives on strategic objectives. Moreover, most firms (64.8%) respond that they outsource less than 1 percent of the value of total production output. 5.6% say that they outsource 6-10% of their production. Production Certification: Ethiopia has very few firms with internationally recognized certifications. In fact, the first firm to receive International Organization of Standardization (ISO) certification did so in 2005, (and BGI was informed anecdotally, this was at a cost 3 times annual revenue). However, as more firms seek to compete internationally, export globally, or aspire for business process improvements, the demand for internationally recognized certifications is rising. Ethiopia recently equipped its Ethiopian Quality Standards Authority to certify Ethiopian firms. The government of Ethiopia also plans to certify all state-run enterprises. In the agribusiness sector, coffee exporters, and firms in floriculture and apiculture are seeking Fair Trade, Organic and Global-Gap certifications to improve their prospects for export. Proactive Strategy: MEASURE uses the following Global Competitiveness Report indicators as contributors to proactive strategy: the control of distribution, production process sophistication, extent of marketing and the degree of customer orientation. Control of Distribution: According to enterprise responses, 37% describe their industries as being entirely owned and operated by domestic companies, and 18.5% believe that their industries are mostly owned and managed by domestic companies. These responses are congruent with MEASURE indicators, which show that Ethiopia‟s control of distribution ranking is 4.2. This indicator is in line with its comparison countries (South Africa leading with a score of 4.5 and Kenya on par with Ethiopia, also with a score of 4.2)
Production Process Sophistication: As indicated above, a majority of firms characterize their production process as labor intensive. MEASURE‟s indicator assessing the same corroborates enterprise responses. Ethiopia scores 2.3 with 7 being the highest (best) score and 1 being the lowest. Compounding this low indicator ranking is the low score in labor productivity. Ethiopia suffers both from low productivity per employee and a higher than desired reliance on manual labor. This negatively impacts their global competitiveness, and ability to add value. Many firms (over 44%) believed that their production process was about the same as nearest domestic competitors, while fewer than 26% believed their production technology was more advanced than domestic competitors. These percentages changed dramatically when compared to international competitors. 42.6% believed their technology was less advanced than their closest international competitor, admitting that their own principle competitive advantage was a unique natural resource, and not value added production. To improve labor productivity some firms have sought to change their compensation structure, seeking to reward performance. However, most of these firms have only
A leather goods
manufacturer, when asked
to identify its most valuable
asset, responded without
hesitation, “Oh that‟s easy,
our design molds come
from Italy.”
13
discussed such plans and not implemented them. 44.4% of respondents pay employees based on annual salaries with no bonus structure for performance or overachievement. The only sector that seems to have a higher penetration of performance-based compensation is in the leather goods sector. This is largely due to their reliance on piece-rate production; employees paid per piece of hand-stitched leather goods.
Extent of Marketing and Degree of Customer Orientation: Businesses‟ extent of marketing and the degree of customer orientation is another category with below average performance, but, if targeted, could positively impact enterprise sophistication. In numerous interviews, firms offered that they „did not have a problem‟ linking to markets. But when pressed to articulate their understanding of that market, and delineate their percentage of market penetration, whether domestic or international, most did not know. Additionally, few exporters were successful without international donor support in market linkage and trade activities. Despite firms self-assessing their marketing strategies as „good‟ (48.1%), they were unable to effectively describe their strategy. The survey team believes this disparity in perception is largely due to a lack of understanding of marketing and customer orientation concepts. Several firms stated that they do not know what their customers want in terms of product designs, product mix, or quality requirements. Nor do they know how to assess market demand, changes in consumer behavior, or how to respond with products if such behavior is observed. To cope, firms produce what already exists in the market, with little product innovation. High incidence of poor customer orientation can be found in Ethiopia‟s domestic textiles industry. Most domestic textile producers are supply driven operations, selling their goods in the Merkato (informal market) instead of to the many apparel manufacturers seeking domestic inputs. Quality levels are below standard, which forces apparel manufacturers to import up to 100% of the textiles required for their export-oriented production. Value Chain Breadth: Value chain breadth is the degree to which a country‟s exporting companies are primarily involved in resource extraction or production rather than performing higher level functions such as product design, marketing, sales, logistics, and after-sale services. Ethiopian enterprise ranks low compared to the comparison countries. All of the comparison countries rank below the median ranking of 3.6, with Ethiopia scoring 2.8. However, with government support, and well-placed incentives, this indicator could also improve. To combat the export of unprocessed lower-value goods, the government imposed a 150% duty on unfinished hides and skins. Positive results have been improved access to finished leather for Ethiopia‟s leather goods market, higher output produced and lower production costs. Alternatively, some unfinished hides and skins exporters unable to invest in upgrading have gone out of business.
14
Access to
Finance
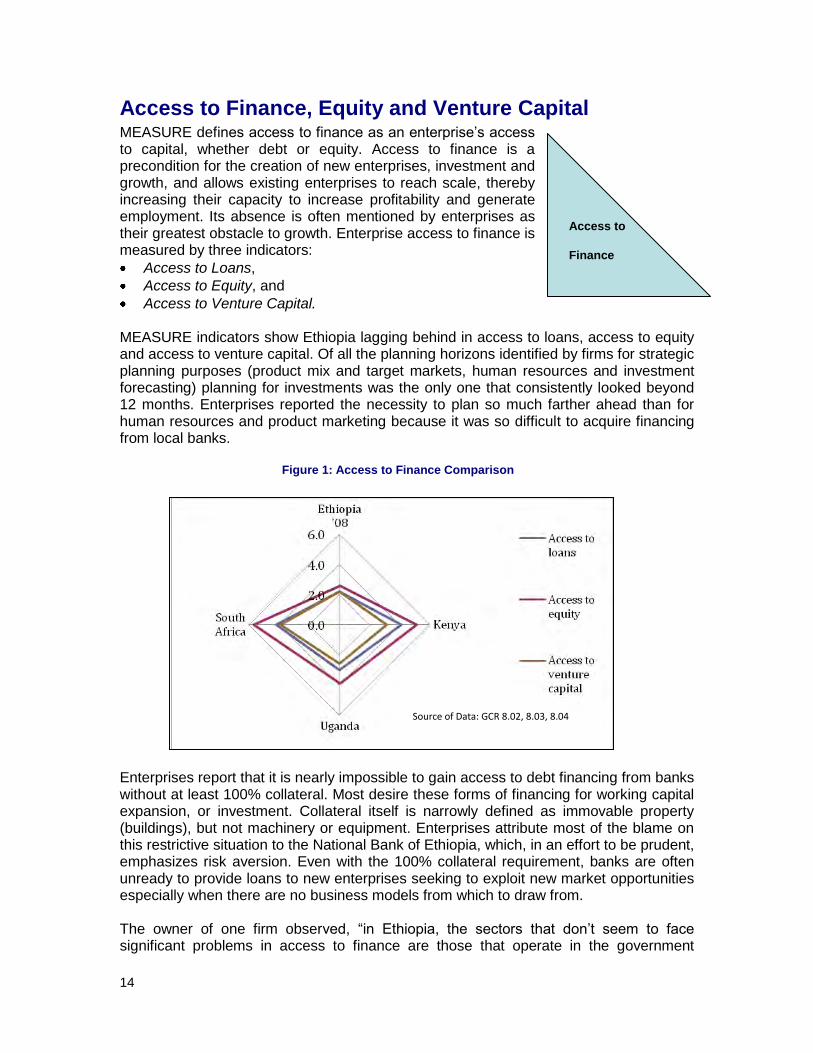
Access to Finance, Equity and Venture Capital MEASURE defines access to finance as an enterprise‟s access to capital, whether debt or equity. Access to finance is a precondition for the creation of new enterprises, investment and growth, and allows existing enterprises to reach scale, thereby increasing their capacity to increase profitability and generate employment. Its absence is often mentioned by enterprises as their greatest obstacle to growth. Enterprise access to finance is measured by three indicators:
Access to Loans,
Access to Equity, and
Access to Venture Capital. MEASURE indicators show Ethiopia lagging behind in access to loans, access to equity and access to venture capital. Of all the planning horizons identified by firms for strategic planning purposes (product mix and target markets, human resources and investment forecasting) planning for investments was the only one that consistently looked beyond 12 months. Enterprises reported the necessity to plan so much farther ahead than for human resources and product marketing because it was so difficult to acquire financing from local banks.
Enterprises report that it is nearly impossible to gain access to debt financing from banks without at least 100% collateral. Most desire these forms of financing for working capital expansion, or investment. Collateral itself is narrowly defined as immovable property (buildings), but not machinery or equipment. Enterprises attribute most of the blame on this restrictive situation to the National Bank of Ethiopia, which, in an effort to be prudent, emphasizes risk aversion. Even with the 100% collateral requirement, banks are often unready to provide loans to new enterprises seeking to exploit new market opportunities especially when there are no business models from which to draw from. The owner of one firm observed, “in Ethiopia, the sectors that don‟t seem to face significant problems in access to finance are those that operate in the government
Figure 1: Access to Finance Comparison
Source of Data: GCR 8.02, 8.03, 8.04
15
promoted sectors”. One can observe how this sentiment takes root. In these sectors, policy lending through the Development Bank of Ethiopia ensures 70% financing for promising proposals with the project itself accounting for collateral. However, even under these circumstances, there appears to be a serious shortage of working capital needed to sustain or expand those enterprises.
As indicated, Ethiopia‟s access to equity and venture capital are as restrictive to enterprises as access to loans. There is no stock market in Ethiopia, and because of the recent downturn in global finance, there is also a contracting private equity market. Until very recently, business equity was raised solely through informal friendship and family networks. In recent years, several banks have been established via public share offers. More recently, over the past 2-3 years, several firms in non-bank sectors, such as real estate, food, and cement have held public offerings. However, since the regulatory environment for
raising equity does not exist in Ethiopia, there is a potential risk for default. During the same time period, a small number of venture capital firms have opened seeking to fund compelling business models, but at this writing, few have made investments over $1m, and some, no funding at all.
Workforce and Skills Development A skilled workforce has become an increasingly critical element for competitive enterprises. The rapid spread of globalization demands that enterprises produce increasingly sophisticated products, which in turn demands an increasingly specialized workforce. Developing such a workforce requires basic workforce skills. These skills are determined by the quality educational system that produces people with the basic training and numeracy skills, and serves as a foundation upon which other skill sets can be built. Some important elements in a strong workforce initiative include providing relevant technical and
management skills (a workforce that offers relevant skills that respond to the demands of the market), retaining talent (keeping those who have acquired the requisite skills), and working in an environment that possesses labor market flexibility (maximizing a company‟s access to a productive labor pool to respond to a dynamic market). Ethiopia‟s state of workforce development is measured through the following MEASURE indicators:
Training of workforce,
Local Availability of Research and Training Services, and
Brain Drain.
Enterprise Impact:
As a result of the inability to access
finance for working capital, many
Ethiopian firms are forced to „sit out‟
when market opportunities become
apparent. They lack alternatives to
funding expansion or investment
projects and thus must wait until they
have the resources on hand. Others
hold off on expansion or new product
development plans until financing is
secure.
Workforce &
Skills
Development
16
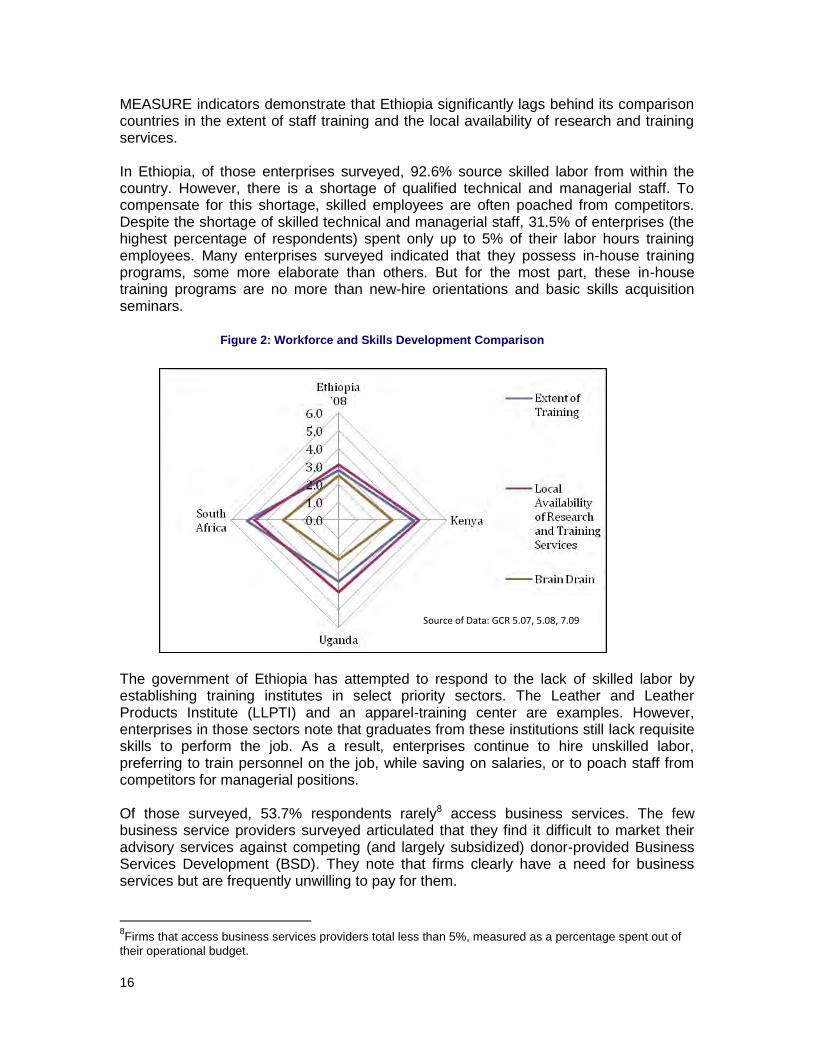
MEASURE indicators demonstrate that Ethiopia significantly lags behind its comparison countries in the extent of staff training and the local availability of research and training services. In Ethiopia, of those enterprises surveyed, 92.6% source skilled labor from within the country. However, there is a shortage of qualified technical and managerial staff. To compensate for this shortage, skilled employees are often poached from competitors. Despite the shortage of skilled technical and managerial staff, 31.5% of enterprises (the highest percentage of respondents) spent only up to 5% of their labor hours training employees. Many enterprises surveyed indicated that they possess in-house training programs, some more elaborate than others. But for the most part, these in-house training programs are no more than new-hire orientations and basic skills acquisition seminars.
The government of Ethiopia has attempted to respond to the lack of skilled labor by establishing training institutes in select priority sectors. The Leather and Leather Products Institute (LLPTI) and an apparel-training center are examples. However, enterprises in those sectors note that graduates from these institutions still lack requisite skills to perform the job. As a result, enterprises continue to hire unskilled labor, preferring to train personnel on the job, while saving on salaries, or to poach staff from competitors for managerial positions. Of those surveyed, 53.7% respondents rarely8 access business services. The few business service providers surveyed articulated that they find it difficult to market their advisory services against competing (and largely subsidized) donor-provided Business Services Development (BSD). They note that firms clearly have a need for business services but are frequently unwilling to pay for them.
8Firms that access business services providers total less than 5%, measured as a percentage spent out of
their operational budget.
Figure 2: Workforce and Skills Development Comparison
Source of Data: GCR 5.07, 5.08, 7.09
17
Legal,
Regulatory
&
Competitive
Brain drain is another indicator assessed by the MEASURE diagnostic. In Ethiopia, this indicator is on par with comparison countries. While there is evidence of skilled labor departing, especially to the Middle East and U.S., there is also recent evidence of a „brain-gain‟ with Diaspora from the U.S. returning to Ethiopia to establish enterprises. Diaspora returnees have managed to invest significant amounts into their own enterprises over the past decade, bringing with them managerial skills gained overseas.
Legal, Regulatory and Competitive Environment Through MEASURE, the business legal, regulatory, and competitive environment directly defines the immediate context in which a country‟s enterprises operate. The legal and regulatory environment strongly influences the ease and cost with which business can be done. MEASURE assesses the burden of regulation on enterprises, both in start-up and in daily operations, and searches for the absence of obstacles to enterprise development. The competitive environment looks more closely at the presence of factors that can contribute to an enterprise‟s success. Demanding customers, intense competition, and the presence of related
firms that can provide quality inputs are key ingredients to an enterprise‟s ability to upgrade.
Legal and Regulatory Environment The Legal and Regulatory Environment is examined through the following indicator:
Regulatory Quality. Ethiopia‟s Regulatory Quality score (Table 6) is reflected as a percentile. It is significantly lower than the scores of the comparison countries or the overall median score of 51. Table 6: Regulatory Quality Score
Legal & regulatory environment Ethiopia Kenya Uganda
South Africa Median
Regulatory Quality (percentile) 18.9 47.1 48.5 65.5 51.0
Source: World Bank
Despite Ethiopia‟s low regulatory quality scores, most respondents did not identify policy and regulatory issues as their top business concerns. Ethiopia applied to accede to the WTO in 2003, and is slowly making progress towards accession. Some Ethiopian enterprises see the benefit of accession and hope to invest and upgrade their businesses in hopes of benefiting from new market access. However, protectionist attitudes are shared by businesses in certain sectors. For instance, most respondents in the manufacturing sector anecdotally shared that they do not wish to join the WTO fearing a cannibalization of their industry by Asian firms. Similarly, those in the banking sector believe it is to Ethiopia‟s benefit that their industry is heavily regulated and protected from foreign entry. In the survey, the only constraint that was noticeably attributed to Ethiopia‟s legal and regulatory environment is the aforementioned unavailability of foreign currency.
18
Competitive Environment MEASURE assesses the Competitive Environment using proxies for the four points of
the Porter Diamond, a widely recognized tool for measuring competitiveness:
The Nature of Competitive Advantage,
Buyer Sophistication,
Cluster Development, and
Intensity of local competition.
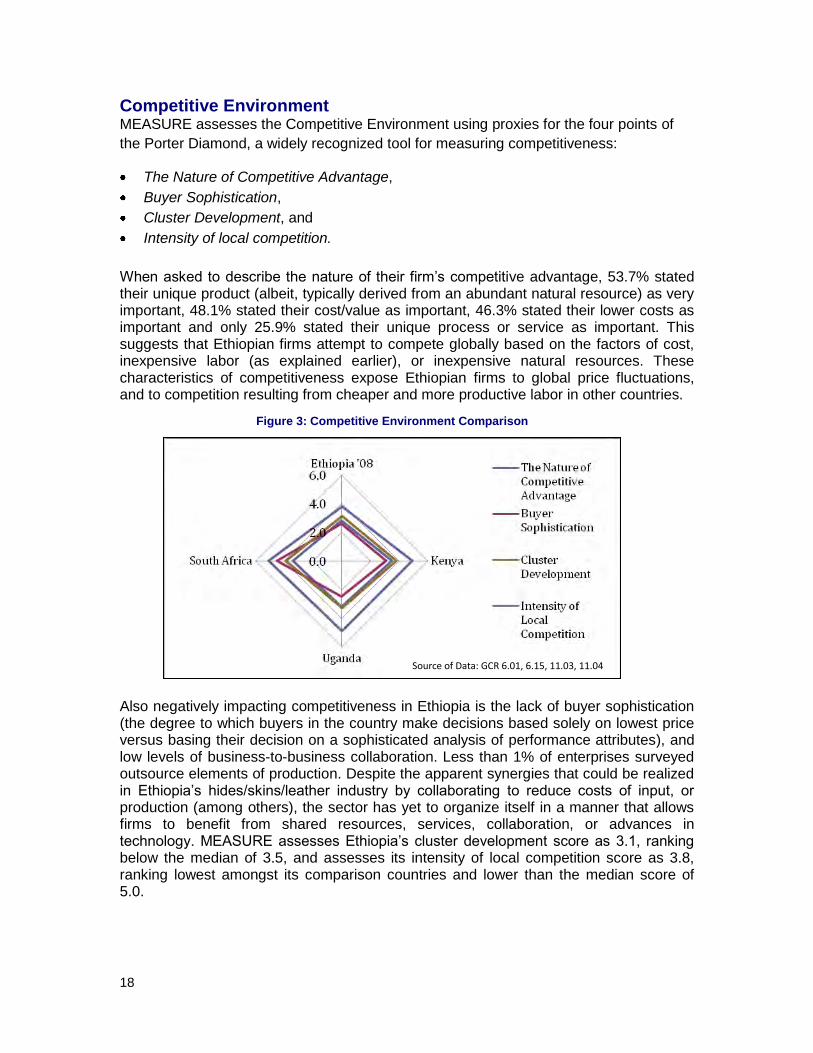
When asked to describe the nature of their firm‟s competitive advantage, 53.7% stated their unique product (albeit, typically derived from an abundant natural resource) as very important, 48.1% stated their cost/value as important, 46.3% stated their lower costs as important and only 25.9% stated their unique process or service as important. This suggests that Ethiopian firms attempt to compete globally based on the factors of cost, inexpensive labor (as explained earlier), or inexpensive natural resources. These characteristics of competitiveness expose Ethiopian firms to global price fluctuations, and to competition resulting from cheaper and more productive labor in other countries.
Also negatively impacting competitiveness in Ethiopia is the lack of buyer sophistication (the degree to which buyers in the country make decisions based solely on lowest price versus basing their decision on a sophisticated analysis of performance attributes), and low levels of business-to-business collaboration. Less than 1% of enterprises surveyed outsource elements of production. Despite the apparent synergies that could be realized in Ethiopia‟s hides/skins/leather industry by collaborating to reduce costs of input, or production (among others), the sector has yet to organize itself in a manner that allows firms to benefit from shared resources, services, collaboration, or advances in technology. MEASURE assesses Ethiopia‟s cluster development score as 3.1, ranking below the median of 3.5, and assesses its intensity of local competition score as 3.8, ranking lowest amongst its comparison countries and lower than the median score of 5.0.
Figure 3: Competitive Environment Comparison
Source of Data: GCR 6.01, 6.15, 11.03, 11.04
19
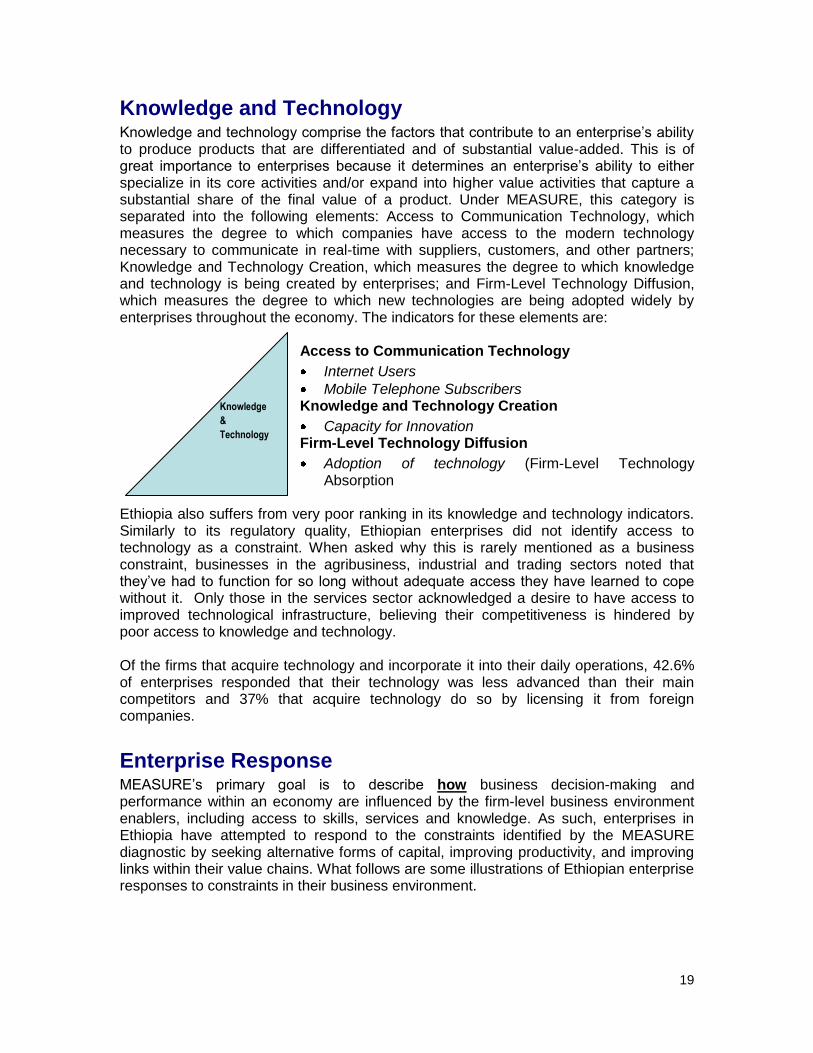
Knowledge and Technology Knowledge and technology comprise the factors that contribute to an enterprise‟s ability to produce products that are differentiated and of substantial value-added. This is of great importance to enterprises because it determines an enterprise‟s ability to either specialize in its core activities and/or expand into higher value activities that capture a substantial share of the final value of a product. Under MEASURE, this category is separated into the following elements: Access to Communication Technology, which measures the degree to which companies have access to the modern technology necessary to communicate in real-time with suppliers, customers, and other partners; Knowledge and Technology Creation, which measures the degree to which knowledge and technology is being created by enterprises; and Firm-Level Technology Diffusion, which measures the degree to which new technologies are being adopted widely by enterprises throughout the economy. The indicators for these elements are:
Access to Communication Technology
Internet Users
Mobile Telephone Subscribers Knowledge and Technology Creation
Capacity for Innovation Firm-Level Technology Diffusion
Adoption of technology (Firm-Level Technology Absorption
Ethiopia also suffers from very poor ranking in its knowledge and technology indicators. Similarly to its regulatory quality, Ethiopian enterprises did not identify access to technology as a constraint. When asked why this is rarely mentioned as a business constraint, businesses in the agribusiness, industrial and trading sectors noted that they‟ve had to function for so long without adequate access they have learned to cope without it. Only those in the services sector acknowledged a desire to have access to improved technological infrastructure, believing their competitiveness is hindered by poor access to knowledge and technology. Of the firms that acquire technology and incorporate it into their daily operations, 42.6% of enterprises responded that their technology was less advanced than their main competitors and 37% that acquire technology do so by licensing it from foreign companies.
Enterprise Response MEASURE‟s primary goal is to describe how business decision-making and performance within an economy are influenced by the firm-level business environment enablers, including access to skills, services and knowledge. As such, enterprises in Ethiopia have attempted to respond to the constraints identified by the MEASURE diagnostic by seeking alternative forms of capital, improving productivity, and improving links within their value chains. What follows are some illustrations of Ethiopian enterprise responses to constraints in their business environment.
Knowledge
&
Technology
20
Poor access to working capital Enterprises seeking capital for expansion, new product development or to take advantage of market opportunities are constrained by Ethiopia‟s poor access to working capital. To compensate, firms have relied on traditional methods (family networks), or not taken advantage of the opportunity. Some firms are seeking new ways to raise capital. These firms have expressed an interest in seeking joint ventures, considering public offerings and seeking access to credit guarantees.
Seeking Joint Ventures: Despite the prevalence of firms owned and operated by local entrepreneurs, 13.7% of firms surveyed are developing strategies to establish joint ventures with foreign investors. The principal reason for seeking these ventures is the desire to improve access to working or expansion capital.
Considering Public Offerings: Though not a direct response to a question in the enterprise survey, (and thus not quantified) some firms shared that they were not interested in divesting ownership to international interests. Instead, they are exploring public offerings seeking to sell shares in their company to Ethiopian partners.
Seeking Access to Credit Guarantees: USAID has widely publicized its Development Credit Authority (DCA) guarantees in Ethiopia. These vehicles have been oversubscribed – demand exceeds supply – and firms are very interested to see them expanded. For those that were quick to respond, they are currently in the application process, hoping to tap into these guarantees to expand their operations.
Low productivity per employee and Poor Access to Business Services Ethiopian firms, seeking to maintain cost competitiveness, have sought to improve employee productivity by adjusting compensation/incentive plans, increasing training, and seeking international experience to improve performance.
Adjusting compensation/incentive plans: To improve productivity and offer incentives for performance, especially in sectors where increased output per employee drives down operating costs, Ethiopian firms are introducing more innovative and motivating compensation plans.
Increasing Training and incorporating cross-functional training: Also in recognition of a need to increase productivity per employee, a few manufacturing firms reported investing a higher percentage of operational budgets to employee development and training. As a means to improve employee retention, cross-functional training is offered to tenured employees. These firms have yet to realize their return on investment from these cross-functional training exercises, but are hopeful that employees will not leave despite the investment made by the firm.
Hiring Consultants on a Contract Basis: Some firms have recognized that the skilled labor they require to improve operational performance does not always exist within Ethiopia. Nor do they feel that they have access to adequate business services within Ethiopia to assist them with overcoming
21
their operational challenges. To compensate, firms are hiring foreign consultants on a contract basis. Amongst the firms surveyed, firms in the leather sector are hiring from Italy; for the apparel sector, from India, Mauritania or China; and from select horticulture and floriculture sectors, from Kenya. Ethiopian firms expect to improve operational efficiency, increase production capacity, and increase production per employee.
Poorly coordinated value chains Several firms in Ethiopia‟s growth sectors have sought to overcome operational inefficiencies, high costs of inputs, and/or inconsistent supply by seeking to collaborate with other firms.
Increasing Business-to-Business Collaboration: Building horizontal linkages and outsourcing non-critical aspects of production was only observed in the most mature and sophisticated Ethiopian enterprises. Despite its infrequency, there is evidence to suggest that more businesses are seeking business-to-business linkages to meet international demand or to adopt new technologies.
Others have sought co-branding opportunities, seeking to exploit Ethiopia‟s international reputation in certain commodities (such as coffee, oilseeds or leather goods). These strategies, while prevalent in the coffee sector, are just beginning to take root in others.
Seeking opportunities to vertically integrate: Controlling or improving access to inputs is considered a critical factor for reducing transaction costs for many businesses. Agribusiness firms are vertically integrating their value chains by investing in commercial farms, or offering out grower contract schemes to smallholders with hopes of improving quantities and quality of their inputs.
Garment manufacturers have sought to vertically integrate by investing in textile dyeing businesses. Unfortunately, many of these endeavors have not endured because the garment manufacturers soon learned that the quality of the cotton grown and spun in the Ethiopia does not meet international standards. Several garment manufacturers are planning long term strategies to invest all the way up-stream to commercial farming of cotton in five-plus years. Unsurprisingly, their principal constraint is insufficient access to financing.
Conclusions As economies become more mature and firms become more competitive, one should expect to observe signs pointing to improvements in enterprise responses to constraints. Business decision-making, improved performance and increased sophistication are all natural outcomes. Ethiopia, while constrained with restrictive government policies that inhibit foreign investment, poor access to finance for working and investment capital, inefficient value chains, and poor access to fee-for-service, business services still shows signs of
22
promise. Enterprises are adapting to these constraints, some successfully, and changing the way they operate. Improved government policies have sparked growth in targeted industries, and firms have responded with increased investment and job creation.
Measuring enterprise response over time MEASURE identified several positive developments while conducting the diagnostic:
Priority sectors, with the support of government and donors are growing;
Enterprises focusing on domestic markets are as sophisticated as export-oriented firms;
Enterprises are willing to invest in long term opportunities and pursue more sophisticated strategies, especially when finance is available; and
Enterprises are beginning to understand the benefits derived from business to business linkages when pursuing market opportunities.
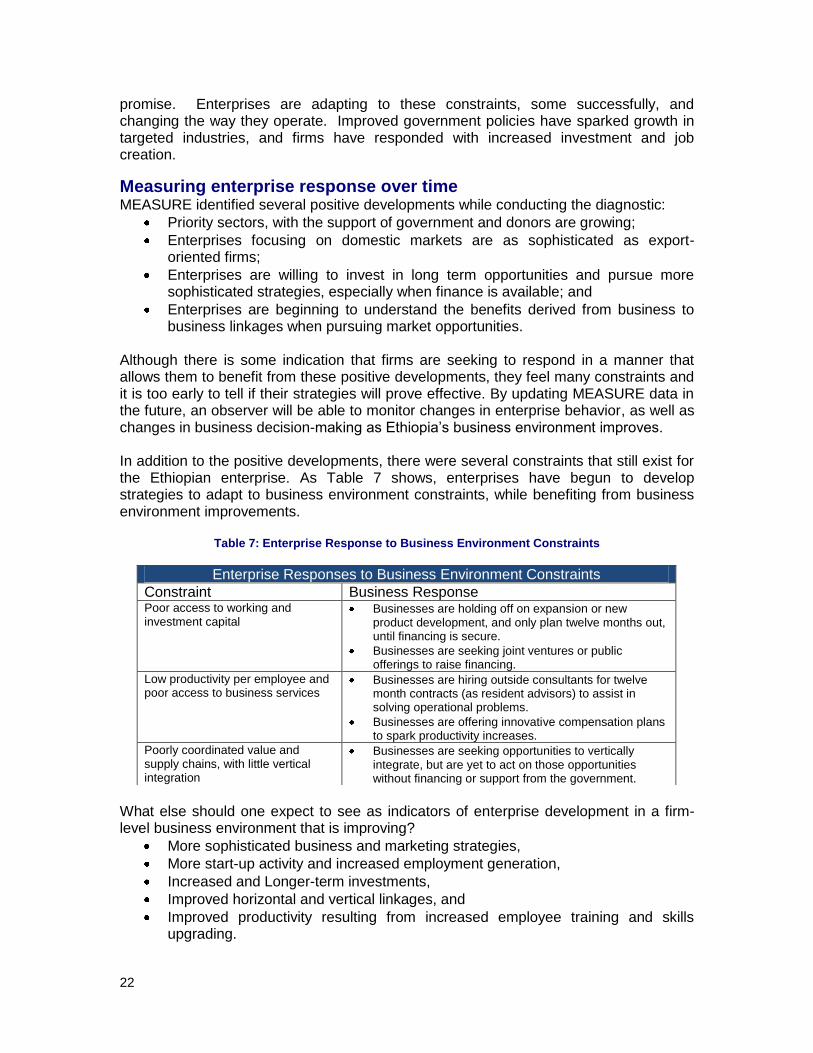
Although there is some indication that firms are seeking to respond in a manner that allows them to benefit from these positive developments, they feel many constraints and it is too early to tell if their strategies will prove effective. By updating MEASURE data in the future, an observer will be able to monitor changes in enterprise behavior, as well as changes in business decision-making as Ethiopia‟s business environment improves. In addition to the positive developments, there were several constraints that still exist for the Ethiopian enterprise. As Table 7 shows, enterprises have begun to develop strategies to adapt to business environment constraints, while benefiting from business environment improvements.
Table 7: Enterprise Response to Business Environment Constraints
What else should one expect to see as indicators of enterprise development in a firm-level business environment that is improving?
More sophisticated business and marketing strategies,
More start-up activity and increased employment generation,
Increased and Longer-term investments,
Improved horizontal and vertical linkages, and
Improved productivity resulting from increased employee training and skills upgrading.
Enterprise Responses to Business Environment Constraints
Constraint Business Response Poor access to working and investment capital
Businesses are holding off on expansion or new product development, and only plan twelve months out, until financing is secure.
Businesses are seeking joint ventures or public offerings to raise financing.
Low productivity per employee and poor access to business services
Businesses are hiring outside consultants for twelve month contracts (as resident advisors) to assist in solving operational problems.
Businesses are offering innovative compensation plans to spark productivity increases.
Poorly coordinated value and supply chains, with little vertical integration
Businesses are seeking opportunities to vertically integrate, but are yet to act on those opportunities without financing or support from the government.
23
The issues that inhibit enterprises from positively responding to progress observed in the business environment provide indications of actions that can be taken to promote enterprise development. To promote that development, donors, practitioners, the Government of Ethiopia, and enterprises themselves all play important roles. Using the MEASURE Framework as a guide, and comparing the results from this diagnostic against existing programs and desired outcomes, logical entry-points will and can be identified. As these entry-points develop into ongoing strategies and program designs, enterprise development and economic growth should be achieved.
24
Appendix
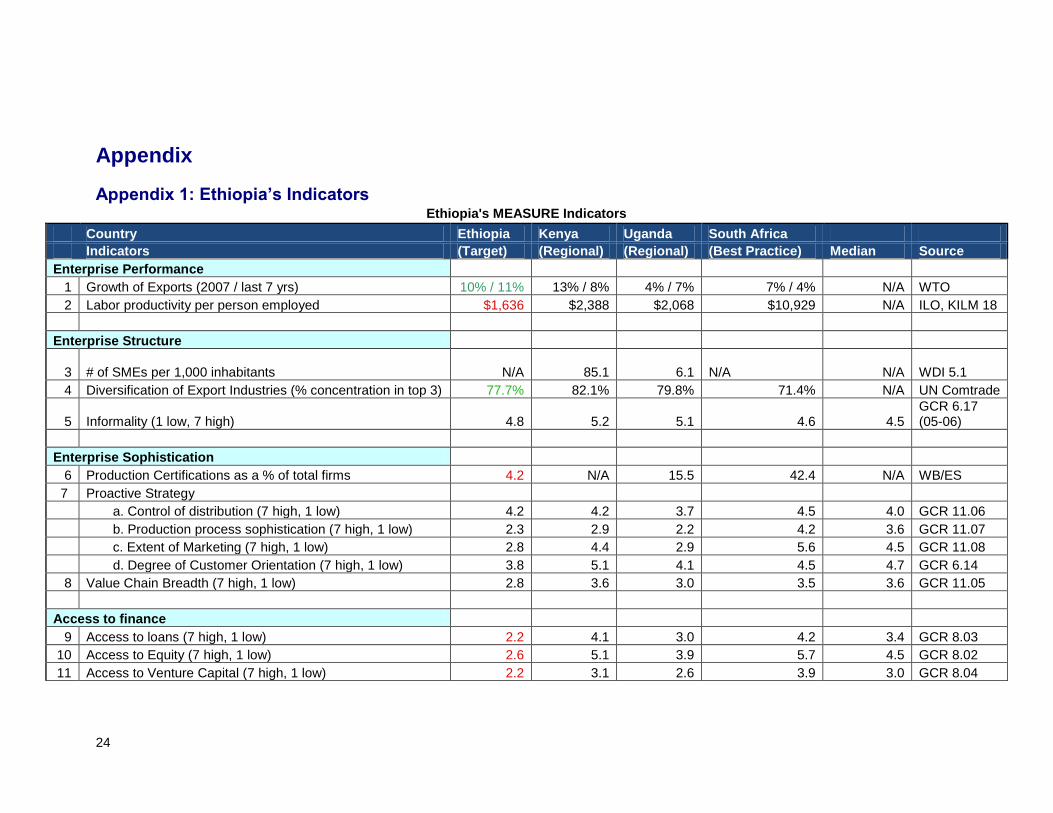
Appendix 1: Ethiopia’s Indicators Ethiopia's MEASURE Indicators
Country Ethiopia Kenya Uganda South Africa
Indicators (Target) (Regional) (Regional) (Best Practice) Median Source
Enterprise Performance
1 Growth of Exports (2007 / last 7 yrs) 10% / 11% 13% / 8% 4% / 7% 7% / 4% N/A WTO
2 Labor productivity per person employed $1,636 $2,388 $2,068 $10,929 N/A ILO, KILM 18
Enterprise Structure
3 # of SMEs per 1,000 inhabitants N/A 85.1 6.1 N/A N/A WDI 5.1
4 Diversification of Export Industries (% concentration in top 3) 77.7% 82.1% 79.8% 71.4% N/A UN Comtrade
5 Informality (1 low, 7 high) 4.8 5.2 5.1 4.6 4.5 GCR 6.17 (05-06)
Enterprise Sophistication
6 Production Certifications as a % of total firms 4.2 N/A 15.5 42.4 N/A WB/ES
7 Proactive Strategy
a. Control of distribution (7 high, 1 low) 4.2 4.2 3.7 4.5 4.0 GCR 11.06
b. Production process sophistication (7 high, 1 low) 2.3 2.9 2.2 4.2 3.6 GCR 11.07
c. Extent of Marketing (7 high, 1 low) 2.8 4.4 2.9 5.6 4.5 GCR 11.08
d. Degree of Customer Orientation (7 high, 1 low) 3.8 5.1 4.1 4.5 4.7 GCR 6.14
8 Value Chain Breadth (7 high, 1 low) 2.8 3.6 3.0 3.5 3.6 GCR 11.05
Access to finance
9 Access to loans (7 high, 1 low) 2.2 4.1 3.0 4.2 3.4 GCR 8.03
10 Access to Equity (7 high, 1 low) 2.6 5.1 3.9 5.7 4.5 GCR 8.02
11 Access to Venture Capital (7 high, 1 low) 2.2 3.1 2.6 3.9 3.0 GCR 8.04
25
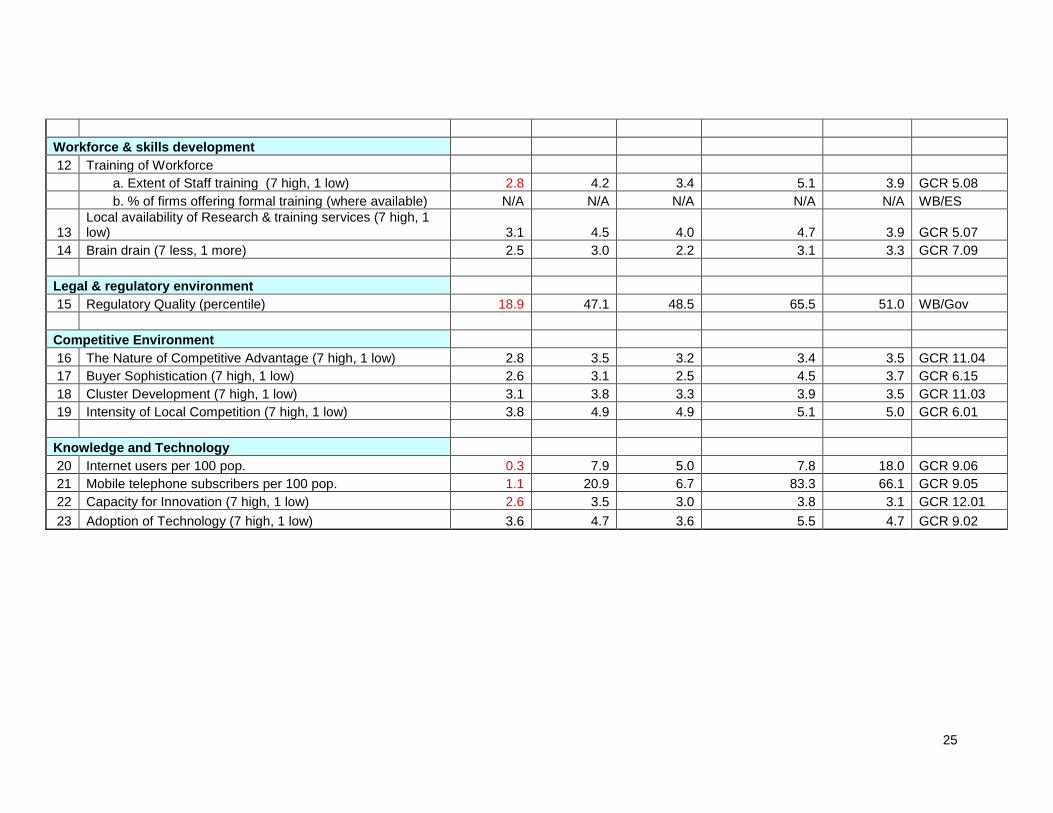
Workforce & skills development
12 Training of Workforce
a. Extent of Staff training (7 high, 1 low) 2.8 4.2 3.4 5.1 3.9 GCR 5.08
b. % of firms offering formal training (where available) N/A N/A N/A N/A N/A WB/ES
13 Local availability of Research & training services (7 high, 1 low) 3.1 4.5 4.0 4.7 3.9 GCR 5.07
14 Brain drain (7 less, 1 more) 2.5 3.0 2.2 3.1 3.3 GCR 7.09
Legal & regulatory environment
15 Regulatory Quality (percentile) 18.9 47.1 48.5 65.5 51.0 WB/Gov
Competitive Environment
16 The Nature of Competitive Advantage (7 high, 1 low) 2.8 3.5 3.2 3.4 3.5 GCR 11.04
17 Buyer Sophistication (7 high, 1 low) 2.6 3.1 2.5 4.5 3.7 GCR 6.15
18 Cluster Development (7 high, 1 low) 3.1 3.8 3.3 3.9 3.5 GCR 11.03
19 Intensity of Local Competition (7 high, 1 low) 3.8 4.9 4.9 5.1 5.0 GCR 6.01
Knowledge and Technology
20 Internet users per 100 pop. 0.3 7.9 5.0 7.8 18.0 GCR 9.06
21 Mobile telephone subscribers per 100 pop. 1.1 20.9 6.7 83.3 66.1 GCR 9.05
22 Capacity for Innovation (7 high, 1 low) 2.6 3.5 3.0 3.8 3.1 GCR 12.01
23 Adoption of Technology (7 high, 1 low) 3.6 4.7 3.6 5.5 4.7 GCR 9.02
26
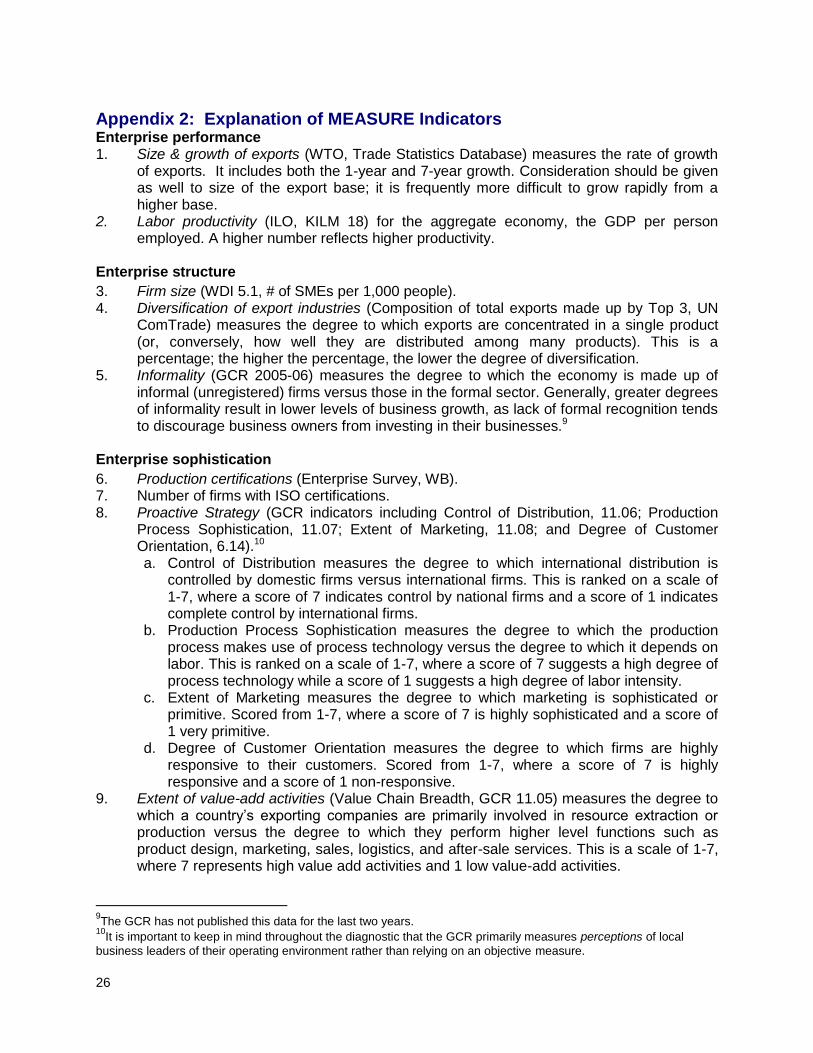
Appendix 2: Explanation of MEASURE Indicators Enterprise performance 1. Size & growth of exports (WTO, Trade Statistics Database) measures the rate of growth
of exports. It includes both the 1-year and 7-year growth. Consideration should be given as well to size of the export base; it is frequently more difficult to grow rapidly from a higher base.
2. Labor productivity (ILO, KILM 18) for the aggregate economy, the GDP per person employed. A higher number reflects higher productivity.
Enterprise structure
3. Firm size (WDI 5.1, # of SMEs per 1,000 people). 4. Diversification of export industries (Composition of total exports made up by Top 3, UN
ComTrade) measures the degree to which exports are concentrated in a single product (or, conversely, how well they are distributed among many products). This is a percentage; the higher the percentage, the lower the degree of diversification.
5. Informality (GCR 2005-06) measures the degree to which the economy is made up of informal (unregistered) firms versus those in the formal sector. Generally, greater degrees of informality result in lower levels of business growth, as lack of formal recognition tends to discourage business owners from investing in their businesses.9
Enterprise sophistication
6. Production certifications (Enterprise Survey, WB). 7. Number of firms with ISO certifications. 8. Proactive Strategy (GCR indicators including Control of Distribution, 11.06; Production
Process Sophistication, 11.07; Extent of Marketing, 11.08; and Degree of Customer Orientation, 6.14).10 a. Control of Distribution measures the degree to which international distribution is
controlled by domestic firms versus international firms. This is ranked on a scale of 1-7, where a score of 7 indicates control by national firms and a score of 1 indicates complete control by international firms.
b. Production Process Sophistication measures the degree to which the production process makes use of process technology versus the degree to which it depends on labor. This is ranked on a scale of 1-7, where a score of 7 suggests a high degree of process technology while a score of 1 suggests a high degree of labor intensity.
c. Extent of Marketing measures the degree to which marketing is sophisticated or primitive. Scored from 1-7, where a score of 7 is highly sophisticated and a score of 1 very primitive.
d. Degree of Customer Orientation measures the degree to which firms are highly responsive to their customers. Scored from 1-7, where a score of 7 is highly responsive and a score of 1 non-responsive.
9. Extent of value-add activities (Value Chain Breadth, GCR 11.05) measures the degree to which a country‟s exporting companies are primarily involved in resource extraction or production versus the degree to which they perform higher level functions such as product design, marketing, sales, logistics, and after-sale services. This is a scale of 1-7, where 7 represents high value add activities and 1 low value-add activities.
9The GCR has not published this data for the last two years.
10It is important to keep in mind throughout the diagnostic that the GCR primarily measures perceptions of local
business leaders of their operating environment rather than relying on an objective measure.
27
Access to Finance
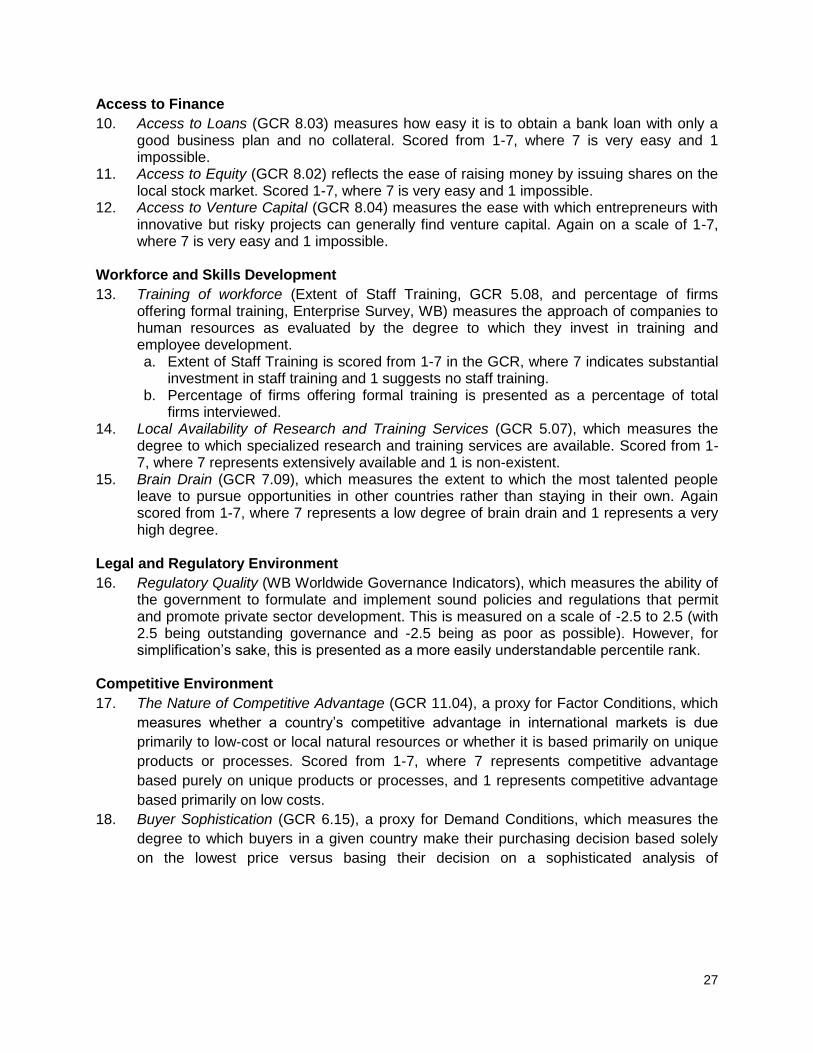
10. Access to Loans (GCR 8.03) measures how easy it is to obtain a bank loan with only a good business plan and no collateral. Scored from 1-7, where 7 is very easy and 1 impossible.
11. Access to Equity (GCR 8.02) reflects the ease of raising money by issuing shares on the local stock market. Scored 1-7, where 7 is very easy and 1 impossible.
12. Access to Venture Capital (GCR 8.04) measures the ease with which entrepreneurs with innovative but risky projects can generally find venture capital. Again on a scale of 1-7, where 7 is very easy and 1 impossible.
Workforce and Skills Development
13. Training of workforce (Extent of Staff Training, GCR 5.08, and percentage of firms offering formal training, Enterprise Survey, WB) measures the approach of companies to human resources as evaluated by the degree to which they invest in training and employee development. a. Extent of Staff Training is scored from 1-7 in the GCR, where 7 indicates substantial
investment in staff training and 1 suggests no staff training. b. Percentage of firms offering formal training is presented as a percentage of total
firms interviewed. 14. Local Availability of Research and Training Services (GCR 5.07), which measures the
degree to which specialized research and training services are available. Scored from 1-7, where 7 represents extensively available and 1 is non-existent.
15. Brain Drain (GCR 7.09), which measures the extent to which the most talented people leave to pursue opportunities in other countries rather than staying in their own. Again scored from 1-7, where 7 represents a low degree of brain drain and 1 represents a very high degree.
Legal and Regulatory Environment
16. Regulatory Quality (WB Worldwide Governance Indicators), which measures the ability of the government to formulate and implement sound policies and regulations that permit and promote private sector development. This is measured on a scale of -2.5 to 2.5 (with 2.5 being outstanding governance and -2.5 being as poor as possible). However, for simplification‟s sake, this is presented as a more easily understandable percentile rank.
Competitive Environment
17. The Nature of Competitive Advantage (GCR 11.04), a proxy for Factor Conditions, which
measures whether a country‟s competitive advantage in international markets is due
primarily to low-cost or local natural resources or whether it is based primarily on unique
products or processes. Scored from 1-7, where 7 represents competitive advantage
based purely on unique products or processes, and 1 represents competitive advantage
based primarily on low costs.
18. Buyer Sophistication (GCR 6.15), a proxy for Demand Conditions, which measures the
degree to which buyers in a given country make their purchasing decision based solely
on the lowest price versus basing their decision on a sophisticated analysis of
28
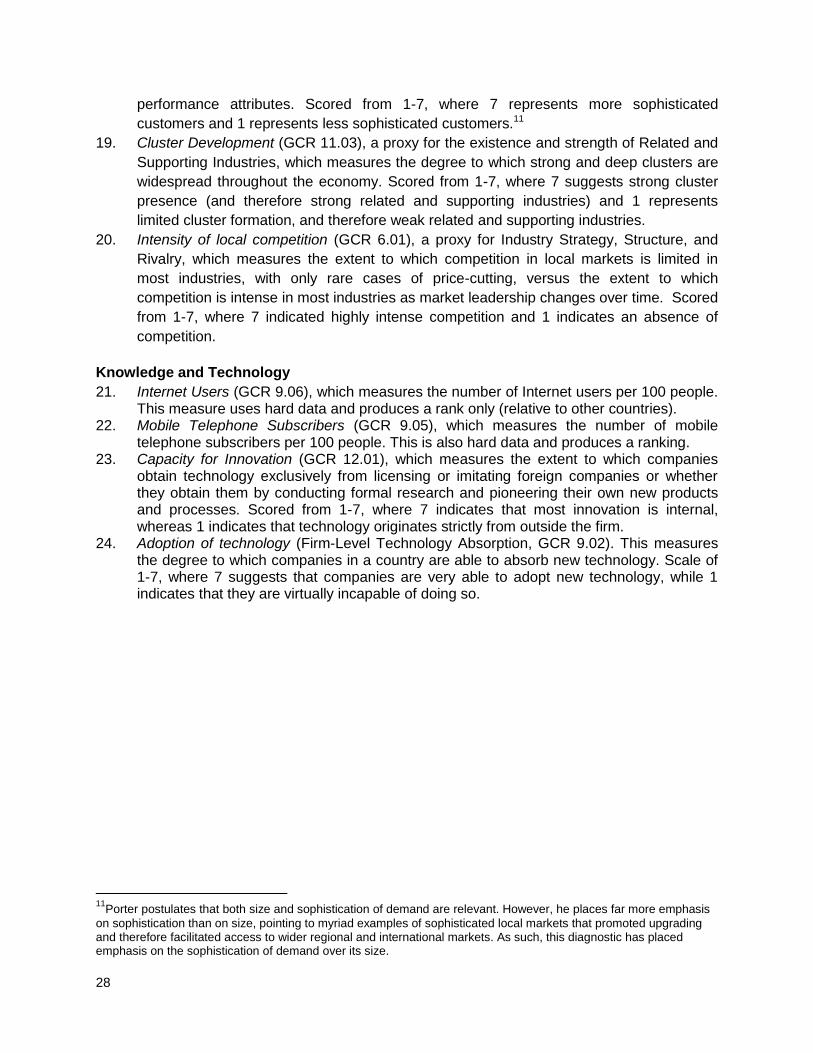
performance attributes. Scored from 1-7, where 7 represents more sophisticated
customers and 1 represents less sophisticated customers.11
19. Cluster Development (GCR 11.03), a proxy for the existence and strength of Related and
Supporting Industries, which measures the degree to which strong and deep clusters are
widespread throughout the economy. Scored from 1-7, where 7 suggests strong cluster
presence (and therefore strong related and supporting industries) and 1 represents
limited cluster formation, and therefore weak related and supporting industries.
20. Intensity of local competition (GCR 6.01), a proxy for Industry Strategy, Structure, and
Rivalry, which measures the extent to which competition in local markets is limited in
most industries, with only rare cases of price-cutting, versus the extent to which
competition is intense in most industries as market leadership changes over time. Scored
from 1-7, where 7 indicated highly intense competition and 1 indicates an absence of
competition.
Knowledge and Technology
21. Internet Users (GCR 9.06), which measures the number of Internet users per 100 people. This measure uses hard data and produces a rank only (relative to other countries).
22. Mobile Telephone Subscribers (GCR 9.05), which measures the number of mobile telephone subscribers per 100 people. This is also hard data and produces a ranking.
23. Capacity for Innovation (GCR 12.01), which measures the extent to which companies obtain technology exclusively from licensing or imitating foreign companies or whether they obtain them by conducting formal research and pioneering their own new products and processes. Scored from 1-7, where 7 indicates that most innovation is internal, whereas 1 indicates that technology originates strictly from outside the firm.
24. Adoption of technology (Firm-Level Technology Absorption, GCR 9.02). This measures the degree to which companies in a country are able to absorb new technology. Scale of 1-7, where 7 suggests that companies are very able to adopt new technology, while 1 indicates that they are virtually incapable of doing so.
11
Porter postulates that both size and sophistication of demand are relevant. However, he places far more emphasis
on sophistication than on size, pointing to myriad examples of sophisticated local markets that promoted upgrading and therefore facilitated access to wider regional and international markets. As such, this diagnostic has placed emphasis on the sophistication of demand over its size.
29
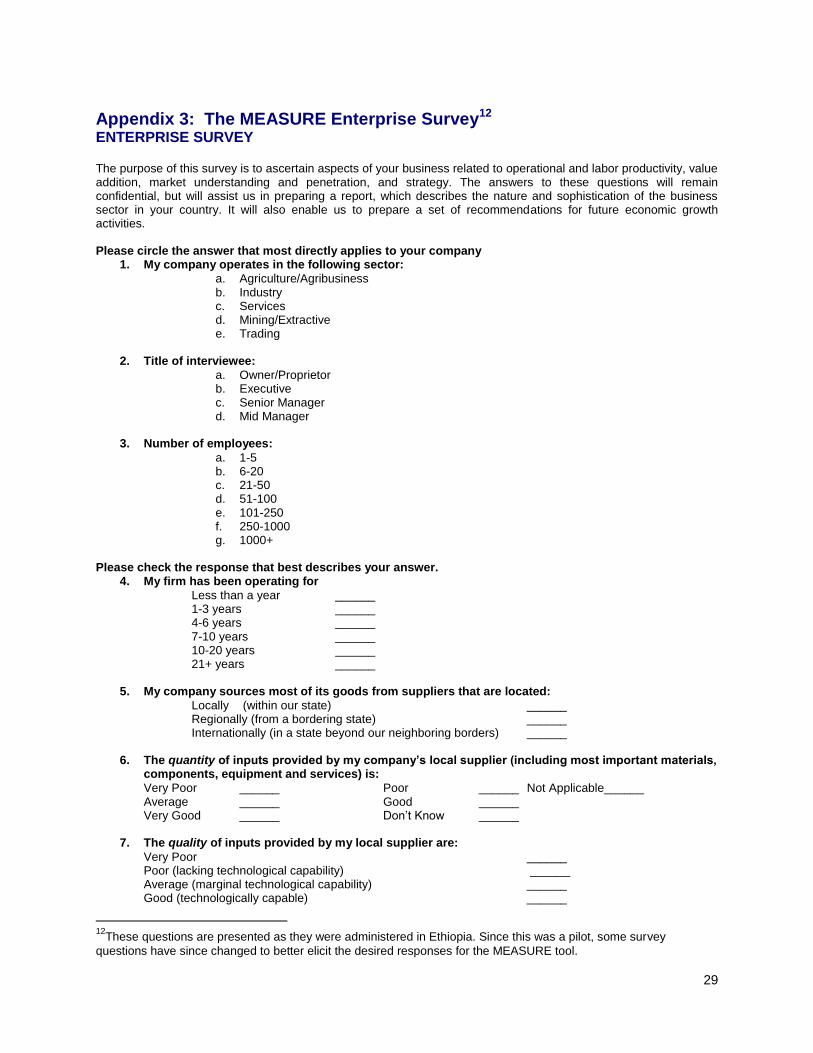
Appendix 3: The MEASURE Enterprise Survey12 ENTERPRISE SURVEY
The purpose of this survey is to ascertain aspects of your business related to operational and labor productivity, value addition, market understanding and penetration, and strategy. The answers to these questions will remain confidential, but will assist us in preparing a report, which describes the nature and sophistication of the business sector in your country. It will also enable us to prepare a set of recommendations for future economic growth activities. Please circle the answer that most directly applies to your company
1. My company operates in the following sector:
a. Agriculture/Agribusiness b. Industry c. Services d. Mining/Extractive e. Trading
2. Title of interviewee:
a. Owner/Proprietor b. Executive c. Senior Manager d. Mid Manager
3. Number of employees:
a. 1-5 b. 6-20 c. 21-50 d. 51-100 e. 101-250 f. 250-1000 g. 1000+
Please check the response that best describes your answer.
4. My firm has been operating for
Less than a year ______ 1-3 years ______ 4-6 years ______ 7-10 years ______ 10-20 years ______ 21+ years ______
5. My company sources most of its goods from suppliers that are located:
Locally (within our state) ______ Regionally (from a bordering state) ______ Internationally (in a state beyond our neighboring borders) ______
6. The quantity of inputs provided by my company’s local supplier (including most important materials, components, equipment and services) is:
Very Poor ______ Poor ______ Not Applicable______ Average ______ Good ______ Very Good ______ Don‟t Know ______
7. The quality of inputs provided by my local supplier are:
Very Poor ______ Poor (lacking technological capability) ______ Average (marginal technological capability) ______ Good (technologically capable) ______
12
These questions are presented as they were administered in Ethiopia. Since this was a pilot, some survey
questions have since changed to better elicit the desired responses for the MEASURE tool.
30
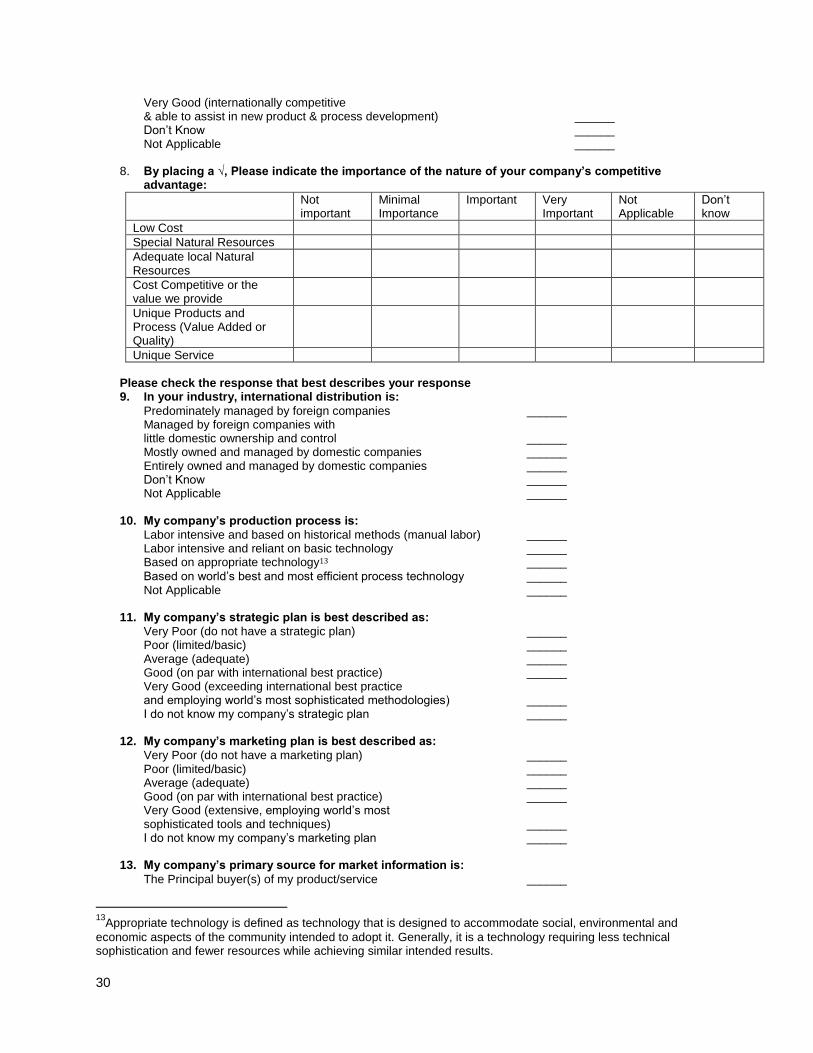
Very Good (internationally competitive & able to assist in new product & process development) ______ Don‟t Know ______ Not Applicable ______
8. By placing a √, Please indicate the importance of the nature of your company’s competitive advantage:
Not important
Minimal Importance
Important Very Important
Not Applicable
Don‟t know
Low Cost
Special Natural Resources
Adequate local Natural Resources
Cost Competitive or the value we provide
Unique Products and Process (Value Added or Quality)
Unique Service
Please check the response that best describes your response 9. In your industry, international distribution is:
Predominately managed by foreign companies ______ Managed by foreign companies with little domestic ownership and control ______ Mostly owned and managed by domestic companies ______ Entirely owned and managed by domestic companies ______ Don‟t Know ______ Not Applicable ______
10. My company’s production process is:
Labor intensive and based on historical methods (manual labor) ______ Labor intensive and reliant on basic technology ______ Based on appropriate technology13 ______
Based on world‟s best and most efficient process technology ______ Not Applicable ______
11. My company’s strategic plan is best described as:
Very Poor (do not have a strategic plan) ______ Poor (limited/basic) ______ Average (adequate) ______ Good (on par with international best practice) ______ Very Good (exceeding international best practice and employing world‟s most sophisticated methodologies) ______ I do not know my company‟s strategic plan ______
12. My company’s marketing plan is best described as:
Very Poor (do not have a marketing plan) ______ Poor (limited/basic) ______ Average (adequate) ______ Good (on par with international best practice) ______ Very Good (extensive, employing world‟s most sophisticated tools and techniques) ______ I do not know my company‟s marketing plan ______
13. My company’s primary source for market information is:
The Principal buyer(s) of my product/service ______
13
Appropriate technology is defined as technology that is designed to accommodate social, environmental and
economic aspects of the community intended to adopt it. Generally, it is a technology requiring less technical sophistication and fewer resources while achieving similar intended results.
31
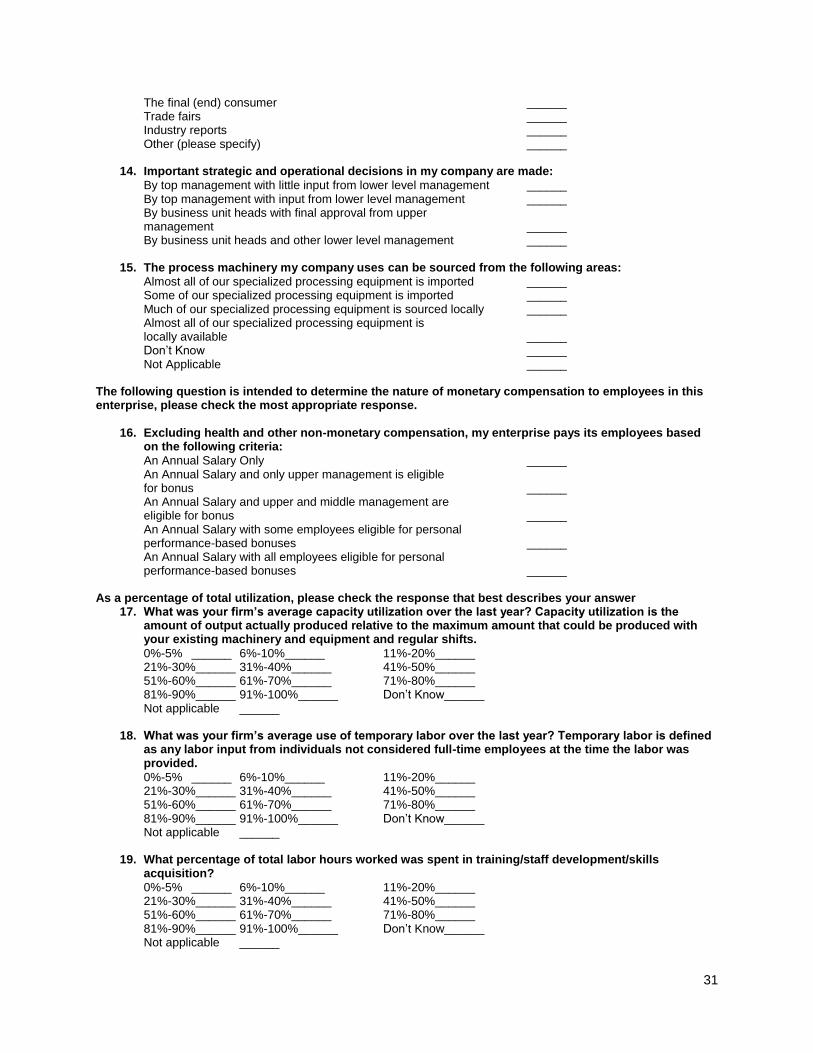
The final (end) consumer ______ Trade fairs ______ Industry reports ______ Other (please specify) ______
14. Important strategic and operational decisions in my company are made:
By top management with little input from lower level management ______ By top management with input from lower level management ______ By business unit heads with final approval from upper management ______ By business unit heads and other lower level management ______
15. The process machinery my company uses can be sourced from the following areas:
Almost all of our specialized processing equipment is imported ______ Some of our specialized processing equipment is imported ______ Much of our specialized processing equipment is sourced locally ______ Almost all of our specialized processing equipment is locally available ______ Don‟t Know ______ Not Applicable ______ The following question is intended to determine the nature of monetary compensation to employees in this enterprise, please check the most appropriate response.
16. Excluding health and other non-monetary compensation, my enterprise pays its employees based on the following criteria:
An Annual Salary Only ______ An Annual Salary and only upper management is eligible for bonus ______ An Annual Salary and upper and middle management are eligible for bonus ______ An Annual Salary with some employees eligible for personal performance-based bonuses ______ An Annual Salary with all employees eligible for personal performance-based bonuses ______ As a percentage of total utilization, please check the response that best describes your answer
17. What was your firm’s average capacity utilization over the last year? Capacity utilization is the amount of output actually produced relative to the maximum amount that could be produced with your existing machinery and equipment and regular shifts.
0%-5% ______ 6%-10%______ 11%-20%______ 21%-30%______ 31%-40%______ 41%-50%______ 51%-60%______ 61%-70%______ 71%-80%______ 81%-90%______ 91%-100%______ Don‟t Know______ Not applicable ______
18. What was your firm’s average use of temporary labor over the last year? Temporary labor is defined as any labor input from individuals not considered full-time employees at the time the labor was provided.
0%-5% ______ 6%-10%______ 11%-20%______ 21%-30%______ 31%-40%______ 41%-50%______ 51%-60%______ 61%-70%______ 71%-80%______ 81%-90%______ 91%-100%______ Don‟t Know______ Not applicable ______
19. What percentage of total labor hours worked was spent in training/staff development/skills acquisition?
0%-5% ______ 6%-10%______ 11%-20%______ 21%-30%______ 31%-40%______ 41%-50%______ 51%-60%______ 61%-70%______ 71%-80%______ 81%-90%______ 91%-100%______ Don‟t Know______ Not applicable ______
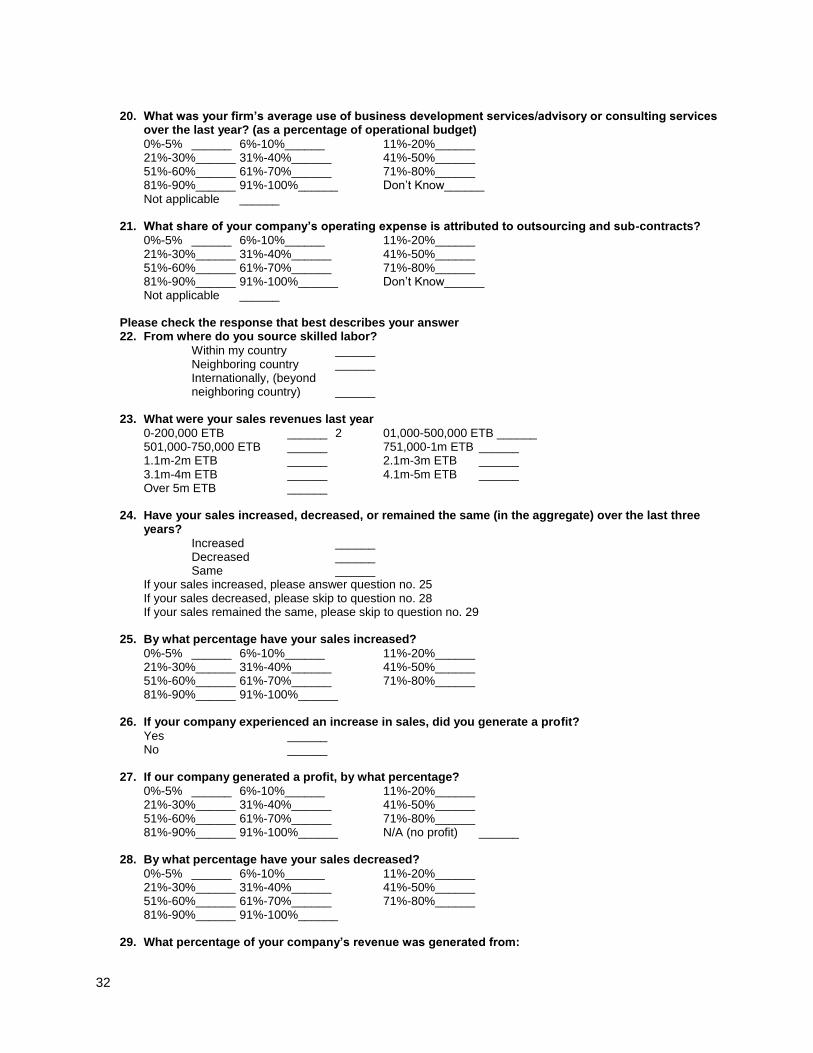
32
20. What was your firm’s average use of business development services/advisory or consulting services
over the last year? (as a percentage of operational budget)
0%-5% ______ 6%-10%______ 11%-20%______ 21%-30%______ 31%-40%______ 41%-50%______ 51%-60%______ 61%-70%______ 71%-80%______ 81%-90%______ 91%-100%______ Don‟t Know______ Not applicable ______
21. What share of your company’s operating expense is attributed to outsourcing and sub-contracts?
0%-5% ______ 6%-10%______ 11%-20%______ 21%-30%______ 31%-40%______ 41%-50%______ 51%-60%______ 61%-70%______ 71%-80%______ 81%-90%______ 91%-100%______ Don‟t Know______ Not applicable ______
Please check the response that best describes your answer 22. From where do you source skilled labor?
Within my country ______ Neighboring country ______ Internationally, (beyond neighboring country) ______
23. What were your sales revenues last year
0-200,000 ETB ______ 2 01,000-500,000 ETB ______ 501,000-750,000 ETB ______ 751,000-1m ETB ______ 1.1m-2m ETB ______ 2.1m-3m ETB ______ 3.1m-4m ETB ______ 4.1m-5m ETB ______ Over 5m ETB ______
24. Have your sales increased, decreased, or remained the same (in the aggregate) over the last three years?
Increased ______ Decreased ______ Same ______ If your sales increased, please answer question no. 25 If your sales decreased, please skip to question no. 28 If your sales remained the same, please skip to question no. 29
25. By what percentage have your sales increased?
0%-5% ______ 6%-10%______ 11%-20%______ 21%-30%______ 31%-40%______ 41%-50%______ 51%-60%______ 61%-70%______ 71%-80%______ 81%-90%______ 91%-100%______
26. If your company experienced an increase in sales, did you generate a profit?
Yes ______ No ______
27. If our company generated a profit, by what percentage?
0%-5% ______ 6%-10%______ 11%-20%______ 21%-30%______ 31%-40%______ 41%-50%______ 51%-60%______ 61%-70%______ 71%-80%______ 81%-90%______ 91%-100%______ N/A (no profit) ______
28. By what percentage have your sales decreased?
0%-5% ______ 6%-10%______ 11%-20%______ 21%-30%______ 31%-40%______ 41%-50%______ 51%-60%______ 61%-70%______ 71%-80%______ 81%-90%______ 91%-100%______
29. What percentage of your company’s revenue was generated from:
33
a. Sales within the country?
0%-5% ______ 6%-10%______ 11%-20%______ 21%-30%______ 31%-40%______ 41%-50%______ 51%-60%______ 61%-70%______ 71%-80%______ 81%-90%______ 91%-100%______ Don‟t Know______ Not applicable ______
b. Sales exported directly?
0%-5% ______ 6%-10%______ 11%-20%______ 21%-30%______ 31%-40%______ 41%-50%______ 51%-60%______ 61%-70%______ 71%-80%______ 81%-90%______ 91%-100%______ Don‟t Know______ Not applicable ______
c. Sales exported indirectly through a distributor or middleman?
0%-5% ______ 6%-10%______ 11%-20%______ 21%-30%______ 31%-40%______ 41%-50%______ 51%-60%______ 61%-70%______ 71%-80%______ 81%-90%______ 91%-100%______ Don‟t Know______ Not applicable ______
30. What percentage of the overall market does your company represent? a. In the national market?
0%-5% ______ 6%-10%______ 11%-20%______ 21%-30%______ 31%-40%______ 41%-50%______ 51%-60%______ 61%-70%______ 71%-80%______ 81%-90%______ 91%-100%______ Don‟t Know______ Not applicable ______
b. In the international market?
Less than 1% ______ 1%-3% ______ 3%-5% ______ 6%-10% _ _____ 11%-20%______ 21%-30%______ 31%-40% ______ 41%-50%_____ 51%-60%______ 61%-70% ______ 71%-80%______ 81%-90%______ 91%-100% ______ Don‟t Know______ Not applicable______
31. Approximately what percentage of your total production was outsourced, or sub-contracted to another organization last year?
Less than 1% ______ 1%-3% ______ 3%-5% ______ 6%-10% _ _____ 11%-20%______ 21%-30%______ 31%-40% ______ 41%-50%_____ 51%-60%______ 61%-70% ______ 71%-80%______ 81%-90%______ 91%-100% ______ Don‟t Know______ Not applicable ______
32. Approximately what share of net profits or operating budget was re-invested back into your company last year (not distributed to shareholders or owners)?
Less than 5% ______ 5%-10% ______ 11%-25% ______ Over 25% ______
33. If you re-invested into your company, in what investments were they in? (Check all that apply)
Equipment______ Advertising and promotion______ Training______ Purchase of Services ______ Market information______ Certification ______ R & D ______ New Facilities ______ Other, (Specify) _____________________________________________________
34. If your company sells to the international market, to which markets does it sell to? (Check all that apply)
Asia Far East ______ Central Asia ______
34
Middle East ______ Western Europe ______ Eastern Europe ______ North Africa ______ Sub-Saharan Africa ______ South America ______ North America (US, Canada, Mexico)______ South P acific ______ Not Applicable_____
Please check the response that best describes your answer 35. Right now, how many months ahead has the management of your enterprise planned its activities
regarding:
a. Product mix and target markets, 0-3 months ______ 4-6 months ______ 7-12 months ______ Over 12 months ______
b. Human resources (employment and training) 0-3 months ______ 4-6 months ______ 7-12 months ______ Over 12 months ______
c. Investments 0-3 months ______ 4-6 months ______ 7-12 months ______ Over 12 months ______
36. Thinking of your main product line or main line of services, and comparing your production process with that of your closest local competitor, which of the following best summarizes your position:
a. My company‟s technology is LESS ADVANCED than that of my main competitor, ______ b. My company‟s technology is ABOUT THE SAME as that of my main competitor, ______ c. My company‟s technology is MORE ADVANCED than that of my main competitor ______ d. No competitor/ not applicable ______ e. Don‟t know ______
37. Thinking of your main product line or main line of services, and comparing your production process
with that of your closest international competitor, which of the following best summarizes your position:
a. My company‟s technology is LESS ADVANCED than that of my main competitor, ______ b. My company‟s technology is ABOUT THE SAME as that of my main competitor, ______ c. My company‟s technology is MORE ADVANCED than that of my main competitor ______ d. No competitor/ not applicable ______ e. Don‟t know ______
38. Has your company received any regional or international certifications and if so what was it? (for instance ISO 9000, 9001, 14000, GlobalGap, Fair Trade, or other)
Yes ______ If yes, please list________________________________________ No ______
Please check the response that best describes your answer 39. Over the last three years, what was the leading way in which your company acquired technological
innovations?
a. Produced it ourselves ______ b. Produced by the government ______ c. Licensed from foreign companies ______ d. We have not acquired technological innovations ______
40. Has your company undertaken in the last 3 years, or plan to undertake within the next 12 months
any of the following initiatives? (Check only those that apply)
Past Future
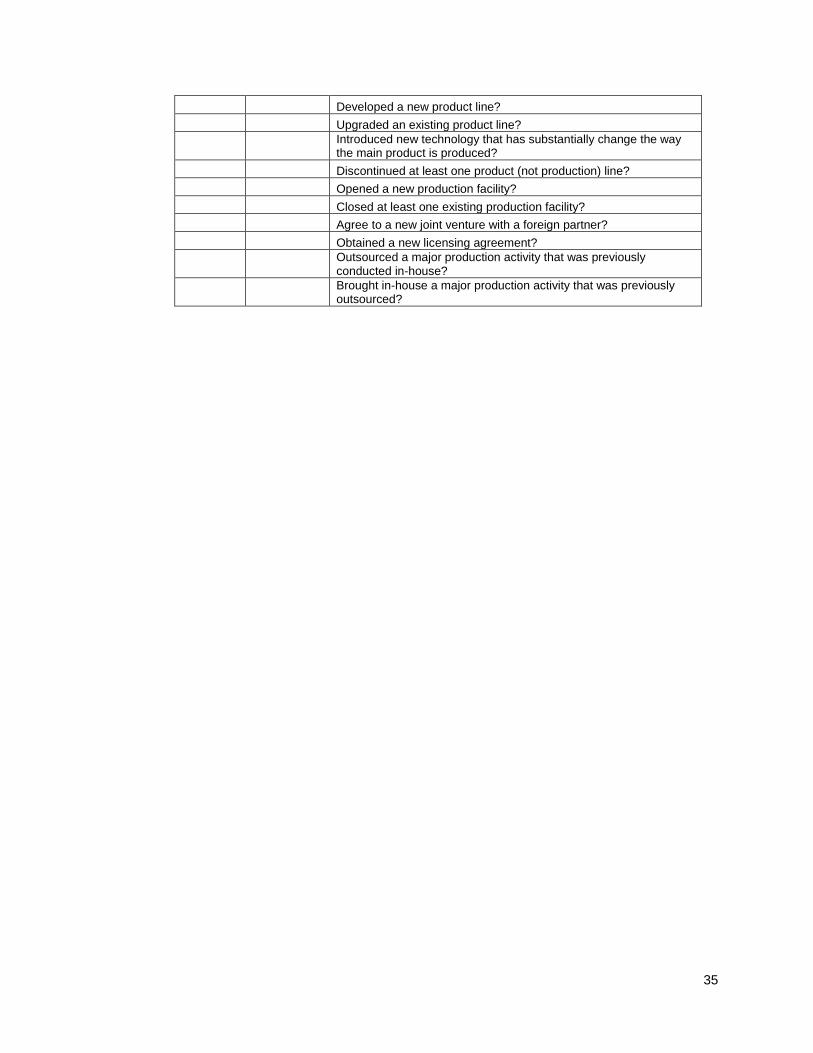
35
Developed a new product line?
Upgraded an existing product line?
Introduced new technology that has substantially change the way the main product is produced?
Discontinued at least one product (not production) line?
Opened a new production facility?
Closed at least one existing production facility?
Agree to a new joint venture with a foreign partner?
Obtained a new licensing agreement?
Outsourced a major production activity that was previously conducted in-house?
Brought in-house a major production activity that was previously outsourced?
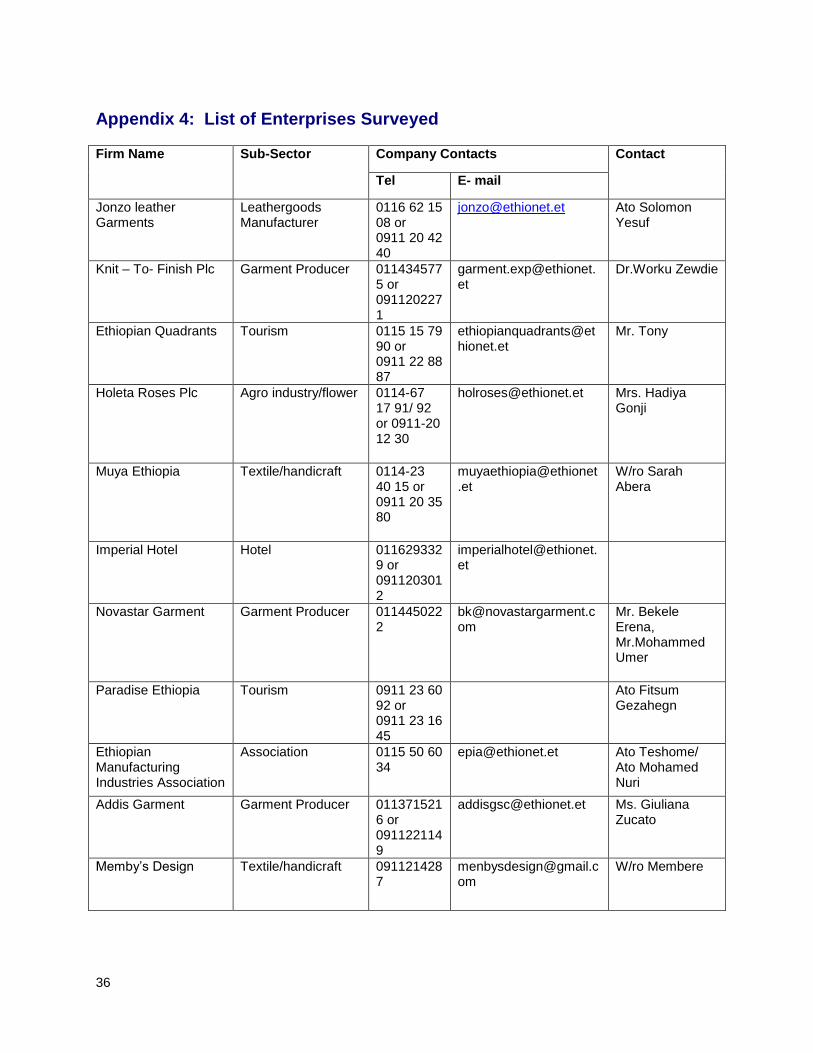
36
Appendix 4: List of Enterprises Surveyed Firm Name Sub-Sector Company Contacts Contact
Tel E- mail
Jonzo leather Garments
Leathergoods Manufacturer
0116 62 15 08 or 0911 20 42 40
[email protected] Ato Solomon Yesuf
Knit – To- Finish Plc Garment Producer 0114345775 or 0911202271
Dr.Worku Zewdie
Ethiopian Quadrants Tourism 0115 15 79 90 or 0911 22 88 87
Mr. Tony
Holeta Roses Plc Agro industry/flower 0114-67 17 91/ 92 or 0911-20 12 30
[email protected] Mrs. Hadiya Gonji
Muya Ethiopia Textile/handicraft 0114-23 40 15 or 0911 20 35 80
W/ro Sarah Abera
Imperial Hotel Hotel 0116293329 or 0911203012
Novastar Garment Garment Producer 0114450222
Mr. Bekele Erena, Mr.Mohammed Umer
Paradise Ethiopia Tourism 0911 23 60 92 or 0911 23 16 45
Ato Fitsum Gezahegn
Ethiopian Manufacturing Industries Association
Association 0115 50 60 34
[email protected] Ato Teshome/ Ato Mohamed Nuri
Addis Garment Garment Producer 0113715216 or 0911221149
[email protected] Ms. Giuliana Zucato
Memby‟s Design Textile/handicraft 0911214287
W/ro Membere
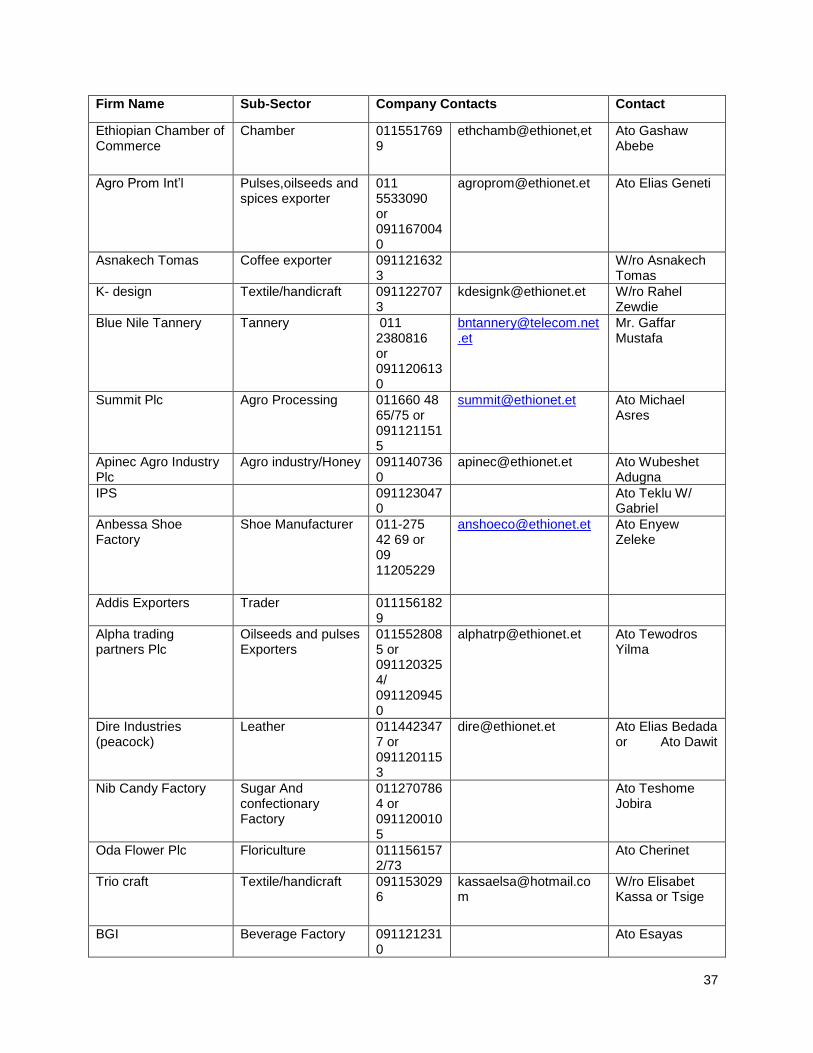
37
Firm Name Sub-Sector Company Contacts Contact
Ethiopian Chamber of Commerce
Chamber 0115517699
ethchamb@ethionet,et Ato Gashaw Abebe
Agro Prom Int‟l Pulses,oilseeds and spices exporter
011 5533090 or 0911670040
[email protected] Ato Elias Geneti
Asnakech Tomas Coffee exporter 0911216323
W/ro Asnakech Tomas
K- design Textile/handicraft 0911227073
[email protected] W/ro Rahel Zewdie
Blue Nile Tannery Tannery 011 2380816 or 0911206130
Mr. Gaffar Mustafa
Summit Plc Agro Processing 011660 48 65/75 or 0911211515
[email protected] Ato Michael Asres
Apinec Agro Industry Plc
Agro industry/Honey 0911407360
[email protected] Ato Wubeshet Adugna
IPS 0911230470
Ato Teklu W/ Gabriel
Anbessa Shoe Factory
Shoe Manufacturer 011-275 42 69 or 09 11205229
[email protected] Ato Enyew Zeleke
Addis Exporters Trader 0111561829
Alpha trading partners Plc
Oilseeds and pulses Exporters
0115528085 or 0911203254/ 0911209450
[email protected] Ato Tewodros Yilma
Dire Industries (peacock)
Leather 0114423477 or 0911201153
[email protected] Ato Elias Bedada or Ato Dawit
Nib Candy Factory Sugar And confectionary Factory
0112707864 or 0911200105
Ato Teshome Jobira
Oda Flower Plc Floriculture 0111561572/73
Ato Cherinet
Trio craft Textile/handicraft 0911530296
W/ro Elisabet Kassa or Tsige
BGI Beverage Factory 0911212310
Ato Esayas
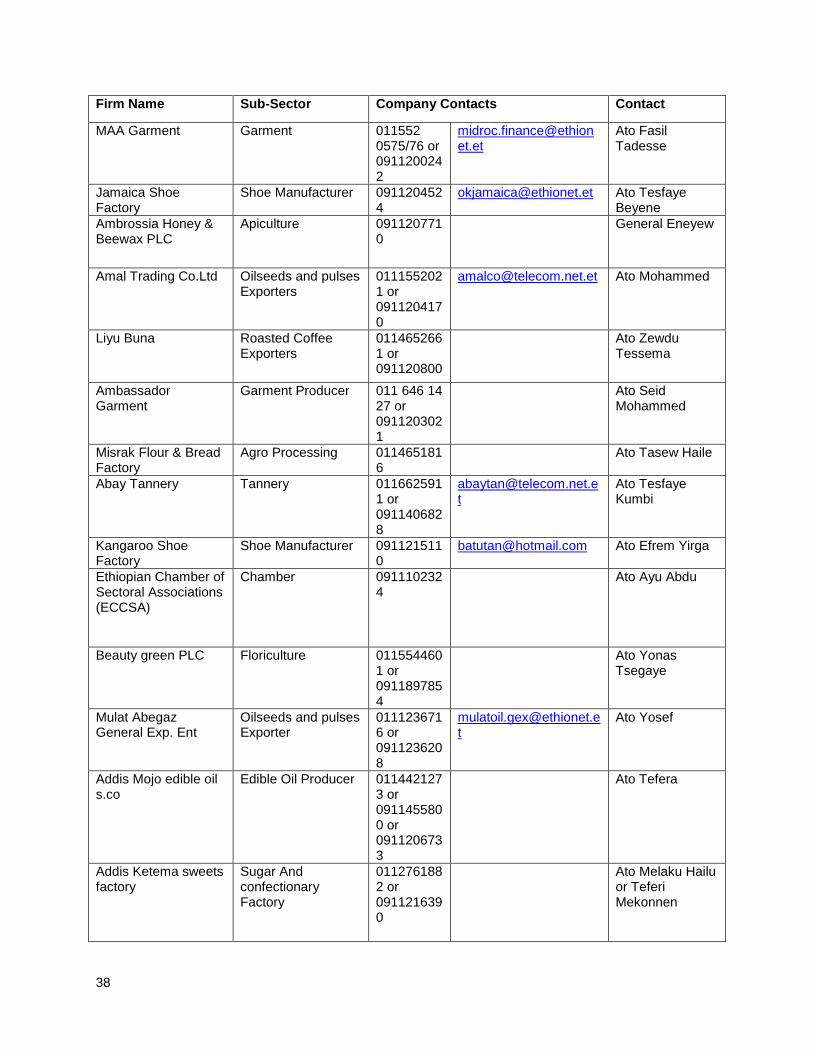
38
Firm Name Sub-Sector Company Contacts Contact
MAA Garment Garment 011552 0575/76 or 0911200242
Ato Fasil Tadesse
Jamaica Shoe Factory
Shoe Manufacturer 0911204524
[email protected] Ato Tesfaye Beyene
Ambrossia Honey & Beewax PLC
Apiculture 0911207710
General Eneyew
Amal Trading Co.Ltd Oilseeds and pulses Exporters
0111552021 or 0911204170
[email protected] Ato Mohammed
Liyu Buna Roasted Coffee Exporters
0114652661 or 091120800
Ato Zewdu Tessema
Ambassador Garment
Garment Producer 011 646 14 27 or 0911203021
Ato Seid Mohammed
Misrak Flour & Bread Factory
Agro Processing 0114651816
Ato Tasew Haile
Abay Tannery Tannery 0116625911 or 0911406828
Ato Tesfaye Kumbi
Kangaroo Shoe Factory
Shoe Manufacturer 0911215110
[email protected] Ato Efrem Yirga
Ethiopian Chamber of Sectoral Associations (ECCSA)
Chamber 0911102324
Ato Ayu Abdu
Beauty green PLC Floriculture 0115544601 or 0911897854
Ato Yonas Tsegaye
Mulat Abegaz General Exp. Ent
Oilseeds and pulses Exporter
0111236716 or 0911236208
Ato Yosef
Addis Mojo edible oil s.co
Edible Oil Producer 0114421273 or 0911455800 or 0911206733
Ato Tefera
Addis Ketema sweets factory
Sugar And confectionary Factory
0112761882 or 0911216390
Ato Melaku Hailu or Teferi Mekonnen
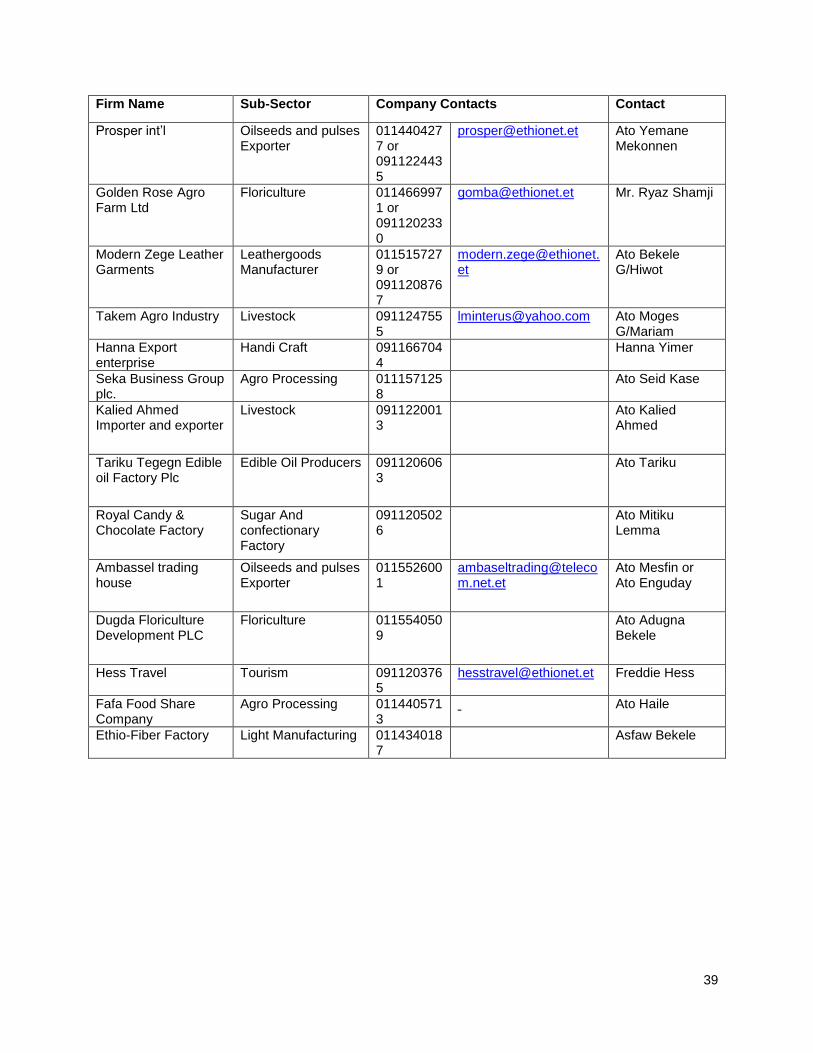
39
Firm Name Sub-Sector Company Contacts Contact
Prosper int‟l Oilseeds and pulses Exporter
0114404277 or 0911224435
[email protected] Ato Yemane Mekonnen
Golden Rose Agro Farm Ltd
Floriculture 0114669971 or 0911202330
[email protected] Mr. Ryaz Shamji
Modern Zege Leather Garments
Leathergoods Manufacturer
0115157279 or 0911208767
Ato Bekele G/Hiwot
Takem Agro Industry Livestock 0911247555
[email protected] Ato Moges G/Mariam
Hanna Export enterprise
Handi Craft 0911667044
Hanna Yimer
Seka Business Group plc.
Agro Processing 0111571258
Ato Seid Kase
Kalied Ahmed Importer and exporter
Livestock 0911220013
Ato Kalied Ahmed
Tariku Tegegn Edible oil Factory Plc
Edible Oil Producers 0911206063
Ato Tariku
Royal Candy & Chocolate Factory
Sugar And confectionary Factory
0911205026
Ato Mitiku Lemma
Ambassel trading house
Oilseeds and pulses Exporter
0115526001
Ato Mesfin or Ato Enguday
Dugda Floriculture Development PLC
Floriculture 0115540509
Ato Adugna Bekele
Hess Travel Tourism 0911203765
[email protected] Freddie Hess
Fafa Food Share Company
Agro Processing 0114405713
Ato Haile
Ethio-Fiber Factory Light Manufacturing 0114340187
Asfaw Bekele
U.S. Agency for International Development
1300 Pennsylvania Avenue, NW
Washington, DC 20523
Tel: (202) 712-0000
Fax: (202) 216-3524
www.usaid.gov