Embed Size (px)
Citation preview
1
Mean Markets or Kind Commerce?
Martin Dufwenberg†,‡, Olof Johansson-Stenman‡, Michael Kirchler*,
Florian Lindner± and Rene Schwaiger*
January 7, 2022
†Department of Economics, University of Arizona, Tucson, AZ 85721-0108, USA
‡Department of Economics, School of Business, Economics and Law, University of Gothenburg, P.O. Box 640, SE 405
30 Gothenburg, Sweden
*Department of Banking and Finance, University of Innsbruck, Universitätsstraße 15, 6020 Innsbruck, Austria ±Max Planck Institute for Research on Collective Goods, Kurt-Schumacher-Str. 10, 53113 Bonn, Germany
Abstract: Does market interaction influence morality? We study a particular angle of this classic
question theoretically and experimentally. The novelty of our approach is to posit that people are
motivated by reciprocity; an urge many argued affects humans. While many have suggested that
market interactions make people more selfish, our reciprocity-based theory allows that market
interaction on the contrary induces more prosociality. Our experiment admits a tests of the empirical
relevance of such an effect, in some highly stylized settings. The results are broadly (but not
completely) supportive. They may shed light on the development of morality and prosocial behavior
over time, in particular with respect to episodes in history where the nature of commerce was
transformed.
JEL codes: C92, D02, D91
Keywords: Markets, morality, prosociality, reciprocity, kindness, autarky, barter, money
Our project was pre-registered (and the data and replication materials are provided) on the Open Science
Framework (OSF) [https://osf.io/r3me8/]. The study was ethically approved by the IRB at the University of
Innsbruck. Financial support from the Austrian Science Fund FWF (START-grant Y617-G11 and SFB F63), the
Austrian National Bank (grant 17788), and Marianne and Marcus Wallenberg Foundation (MMW 2015.0037) is
gratefully acknowledged. We thank the Editor Ricardo Perez-Truglia, three anonymous reviewers, Andreas Blume,
Bart Wilson, and participants at the Experimental Finance Conference 2021 in Innsbruck for tremendously helpful
advice and valuable comments. Declarations of interest: none.
2
1. Introduction
Economists typically expect people’s market behavior to be guided largely by self-interest. As
famously expressed by Adam Smith in The Wealth of Nations (1776):
It is not from the benevolence of the butcher, the brewer, or the baker that we expect our dinner,
but from their regard to their own interest. We address ourselves not to their humanity but to
their self-love, and never talk to them of our own necessities, but of their advantages.
Since that time, there is no doubt that markets have been instrumental in contributing spectacular
improvements in material living conditions. Yet, our well-being does not only depend on market
outcomes; factors like equality of opportunities, trust in institutions, and the level of crime play an
important role as well. For example, most of us prefer to live in a society where people are kind to
each other, and where they are hence neither violent nor trying to take advantage of others. Indeed,
Smith himself, not the least in his Theory of Moral Sentiments (1759), emphasized the importance of
morality and social norms for understanding behavior and well-being.1 A natural question is whether
markets and trade make us more or less selfish, and more or less prosocial, toward those we traded
with and others.
The answer is not obvious. While, as noted in the next section, many have argued that market
interaction makes people more selfish and/or more immoral, there are also arguments that markets
induce more prosocial behavior. We add to this discussion by theoretically articulating, and
experimentally exploring, a novel perspective: We consider the implications of people being
motivated by reciprocity, i.e., they desire to be kind to those they deem kind and unkind to those they
deem unkind. Building on the reciprocity model developed by Dufwenberg & Kirchsteiger (2004)
(D&K), we present a theory, which generates the following optimistic prediction: People who
successfully trade will be kind towards one another, and consequently they will treat each other well
outside the trading institution. Several related predictions are then tested in the lab.
Before we describe details, we note a significant caveat to be developed further below: While
some trading experiences may make agents view others as unkind, we do not explore the theoretical
or empirical relevance of such possibilities. Rather, we focus solely on the kindness induced by gains
1 Adam Smith had more generally a broad perspective on human behavior and motivations and discussed most
psychological, and some sociological, mechanisms that are now analyzed within behavioral economics – see e.g.,
Ashraf et al. (2005) and Smith & Wilson (2019) – which is in sharp contrast to the narrow-minded and purely selfish
homo economicus caricature that is at times attributed to him.
3
from trade and explore what happens subsequently outside the trading institution. Our theory
describes four players who interact across two stages. They first engage in one of three trading
institutions, labeled AUTARKY, BARTER, and MARKET. They are then, unexpectedly, invited to play a
four-player dictator game, representing interaction outside the trading institution. We calculate
players’ first-stage kindnesses, when they trade as much as possible, and then derive follow-up
predictions for the second stage dictator-games. Here are more details:
AUTARKY involves four players who do not influence each other’s payoffs via trade.
BARTER is a four-player simultaneous-move game in which two pairs of players are formed and
each player chooses whether to agree to engage in bilateral trade within the pair.
MARKET is a four-player simultaneous-move games in which each player chooses whether to agree
to a trading cycle among all the players.
While, admittedly, these three games are highly stylized, we think of them as wind-tunnels for more
complex settings: AUTARKY is a hunter-gatherer society where everyone is economically independent.
BARTER is a society where pairs of individuals meet and engage in bilateral exchange. MARKET is a
monetary economy, where elaborate trading cycles occur. We design payoffs such that MARKET and
BARTER, unlike AUTARKY, allow for gains from trade in the sense that each player is actively
responsible for an increase in earnings of his or her trading partner(s). If as much trade as possible
occurs, in MARKET each player has three trading partners while in BARTER each player has a single
trading partner. In AUTARKY, there is no trade, and no player has a trading partner. Applying D&K’s
model, if as much trade as possible occurs, each player will view all co-players as kind in MARKET,
one co-player as kind in BARTER, and no co-player as kind in AUTARKY. We propose that these
perceived kindnesses spill over to the second stage and predict that dictators motivated by reciprocity
target their generosity in accordance with the perceived kindnesses of the preceding stage.2 This
implies that: Dictators will give less post-AUTARKY than post-BARTER. Dictators will give less post-
BARTER than post-MARKET. Post-BARTER, dictators will give more to their one trading partner than to
their other two co-players from the preceding stage.
2 The approach harmonizes well with Adam Smith’s perspective, op. cit. One may argue that most butchers, brewers
and bakers we interact with actually tend to be rather friendly, and that they provide good meat, beer, and bread that
improve our quality of life. This, in turn, may imply that people, spontaneously, want to reciprocate and be kind
back also outside the market.
4
In what sense would support for these predictions provide evidence that markets make people
prosocial? From a model-theoretic point of view, the answer is not that people would get a new more
prosocial utility function, since we assume fixed preferences (viz., reciprocity). Instead, we test a
potential mechanism by which markets may influence prosociality, namely that the tendency to be
kind to the kind is triggered by market interactions. In doing so, we do not test the tendency to be
unkind to the unkind, which may also be a potential mechanism by which market integration is
associated with prosociality.
To test our theory, we conducted a carefully controlled experiment with 524 student
participants from various fields of study at the University of Innsbruck. We introduced three
treatments, intended to capture the essence of the three societies/games described in our theory. Our
design allowed us to hold payoffs (or income) fixed between different treatments, and thus disregard
any income effect that might be associated with the efficiency-enhancing effects of markets. The
experiment had two stages. In the first stage (Stage 1), the participants were randomly allocated to
three treatments, reflecting economic transactions in AUTARKY, BARTER, and MARKET, respectively.
In the second stage (Stage 2), which was identical across treatments, each subject could distribute
money between themselves and others in two versions of a dictator game, d-game-1 and d-game-2:
In d-game-1, one of the four individuals in each group was selected to be the Dictator and was asked
to divide a fixed amount of money between him- or herself and the other group members, where the
Dictator had to give the same amount to each of the others; the amount given to others was doubled
by the experimenter. d-game-2 worked like d-game-1, except that the dictators could here give
varying amounts to the other group members.
Regarding external validity, we acknowledge that our Stage 1 trading games are highly
stylized and that there are many other experimental studies that use richer trading institutions, e.g.,
“double auctions.” The main reason for our modelling choice is that we want to achieve as much
trade as possible, as well as to ensure minimal variations in pay across participants, to provide clean
tests on how individuals distribute money to the other participants in the dictator games based on the
trading institution ceteris paribus. This would be difficult to obtain based on, e.g., a double auction
design. Exploring designs using more complicated institutions would still be interesting, but we leave
it for future research.
The experimental results are broadly (but not completely) consistent with the theoretical
predictions. As predicted, we find statistically significantly higher average contributions in treatment

5
MARKET than in treatments AUTARKY and BARTER in d-game-1 and d-game-2. However, contrary to
our predictions, we find no differences between treatments AUTARKY and BARTER in either version of
the dictator game. Finally, as predicted, we find statistically significantly higher contributions in
treatment BARTER to former trading partners in Stage 1 than to non-trading partners in d-game 2.
In our theory as well as our experiment, we obviously provide a rather optimistic picture of
the market, where one’s market interactions induce positive implications for oneself as well as others,
in terms of gains from trade. As we indicated above, the real-world market is of course more complex
and for example also includes situations where agents fail to reach an agreement, engage in cheating,
sell lemons, and where the outcomes become highly unequitable. We choose not to focus on such
negative effects for two reasons: First, without ignoring such effects, there is hardly any doubt that
market interactions in terms of gains from trade have overall contributed, and continue to contribute,
to material well-being for most people. Second, attempting to experimentally disentangle different
mechanisms from market interactions simultaneously would make it difficult to identify any of them.
We view these challenges as potentially interesting avenues for further research, and we will return
to this topic in the concluding section.
Overall, while several papers analyzed effects of market interactions on prosociality – see the
next section – our contribution appears to be the first one to, theoretically as well as experimentally,
analyze direct spillover effects of positive reciprocity induced by market interaction. As such, it does
certainly not aim to provide a complete picture of markets and market interaction on prosocial
behavior, but to suggest and test a potentially important mechanism. This mechanism, in turn, seems
largely to have been overlooked in the more recent literature, even though positive indirect effects of
market interactions were discussed already by, e.g., Adam Smith, Montesquieu, and David Hume.
The remainder of the paper is organized as follows: Section 2 briefly reviews related literature
and Section 3 presents the game forms we use to represent our three stylized societies, where D&K's
theory is then applied to generate testable predictions. Section 4 outlines the experimental design,
while Section 5 presents the results and Section 6 provides some concluding remarks.
6
2. Related Literature
Over the centuries, many – including philosophers, politicians, and religious authorities – have argued
that market interaction tends to make people more selfish and/or more immoral, and that this will
have spillover effects outside of markets. For example, St. Augustine considered lust for money and
possessions to be one out of three deadly sins (see Deane, 1963, pp. 44-56), whereas Karl Marx (e.g.,
Marx 1844) explicitly or implicitly claimed that capitalism and markets cause many ills, such as
dishonesty.3 Others on the contrary argued that markets enhance morality and induce prosocial
behavior. For example, Albert Hirschman (1977), in his The Passions and the Interests, Political
Arguments for Capitalism before Its Triumph, shows that many thinkers contemporary with Adam
Smith, such as Montesquieu, Hume, Turgot and Condorcet, largely argued in favor of market
capitalism because of its supposed civilizing effects; effects that would reduce conflict and violence
when passions were largely replaced by the interests.4
Consistent with this, Steven Pinker (2011) has, in a much discussed and partly controversial
contribution, argued that the amount of human violence has in most periods of humanity decreased
over time. He explains how this decrease has been particularly dramatic during certain time periods,
notably during the transmission from hunter-gatherer to the agricultural society roughly 10,000 years
ago, and during the transition from an agricultural to an industrial society; in Europe, this second
transition took place around the time when Adam Smith wrote The Wealth of Nations. In terms of
trade, the first transition largely also implied a transition from an AUTARKY to a BARTER society,
whereas the latter implied a further transition to a MARKET society. There is also cross-culture
experimental evidence indicating that market interaction tends to make people more prosocial; see in
particular Henrich et al. (2001, 2004, 2005), who compared 15 small-scale societies with quite
different institutions, as well as the follow-up studies by Henrich et al. (2006, 2010) and Ensminger
& Henrich (2014). Moreover, McCloskey recently put forward related arguments largely through
3 For example, he writes: “Every product is a bait with which to seduce away the other’s very being, his money;
every real and possible need is a weakness which will lead the fly to the glue-pot […] every need is an opportunity
to approach one’s neighbor under the guise of the utmost amiability and to say to him: Dear friend, I give you what
you need, but […] in providing for your pleasure, I fleece you.” (Marx 1844)
4 For more on related ideas, see Rothschild (2002), whose main focus is on Smith and Condorcet, Choi & Starr
(2021) whose third section (“Markets and the development of social relationships”) cites much other relevant work,
and Dewatripont & Tirole (2022) for more related discussion and a modelling effort.

7
cultural development associated with the industrial revolution and the birth of the modern market
economy in her trilogy Bourgeois Virtues, Bourgeois Dignity, and Bourgeois Equality (McCloskey
2006, 2010, 2016).
We suggest that the human tendency to reciprocate, i.e., the desire to be kind to those deemed
kind and unkind toward those deemed unkind, can organize this data. This should be compelling
insofar that scientists from many fields, as well as many other authors, forcefully argued that
reciprocity constitutes a basic form of human motivation; see Mauss (1954), Goranson & Berkowitz
(1966), Trivers (1971), and Akerlof (1982) for early influential work in, respectively, anthropology,
social psychology, biology, and economics, and Fehr & Gächter (2000) and Sobel (2005) for some
critical surveys by economists.5 Modern theory on reciprocity – including Rabin (1993), D&K, and
Falk & Fischbacher (2006) – uses tools of so-called psychological game theory (see Geanakoplos,
Pearce & Stacchetti 1989 for a pioneering contribution and Battigalli & Dufwenberg 2020 for an
overview).
Yet, even if we accept the description of the historical episodes, and the comparison of
different societies, causation via varying levels of market integration and incentives to reciprocate
does not follow from correlation. There are many potential mechanisms behind the historical patterns.
For example, one could argue that increased prosociality, and decreased violence over time, are
largely resulting from income effects. Falk & Szech (2013) pioneered the use of lab experiments for
shedding light on the market-and-morals debate. They show that a smaller share of participants is
willing to forsake money for preventing the death of a mouse when they are bargaining over the life
of the mouse in double auction markets than when they are deciding individually. Their interpretation
is that the market interactions undermine moral values. However, follow up studies have called the
robustness, and even the interpretation, of their finding into question, and also provided alternative
designs; see e.g. Bartling et al. (2015, 2020) and Kirchler et al. (2016). For example, Kirchler et al.
(2016), show that immoral behavior in the setting of Falk & Szech (2013) is robust to various nudges,
but can be reduced with monetary punishment, whereas Bartling et al. (2020) replicate the main
5 As regards older history, morality based on the idea of reciprocal justice, e.g., an eye for an eye, is very old as
reflected, for instance, in the Hebrew Bible and the Quran. Fehr & Gächter (p. 159) quote from The Edda from the
13th century that “A man ought to be a friend to his friend and repay gift with gift. People should meet smiles with
smiles and lies with treachery.” For more modern examples (though with an emphasis on negative reciprocity) from
literature, film, business, as well as lab experiments, see Dufwenberg, Smith & Van Essen (2013, Section III).
8
treatment effect of Falk & Szech and included additional treatments, leading them to conclude that
repeated play rather than market interaction seems to cause the erosion of moral values.
Choi & Storr (2021) have experimentally investigated whether there is an influence of market
interactions on prosociality outside the market. The authors set up experimental goods markets in the
first stage and trust games in the second stage of their experiment. They find that positive relationships
based on previous market interactions, which are personal rather than impersonal in nature, lead to
more trust (higher first-mover transfers in the trust game) and trigger trustworthiness (higher second-
mover transfers in the trust game) compared to negative relationships based on previous market
interactions. Although trust and reciprocity are undoubtedly related, we apply dictator games to
determine whether markets trigger reciprocity directly and thus independently of trust.
As far as we know, our study is novel in theoretically exploring implications of reciprocity on
prosocial behavior in different trading regimes, based on modern theory on reciprocity, as well as in
providing corresponding direct experimental tests.
3. Theory
We envisage three different societies (treatments) that reflect different degrees of commercial
activity:
AUTARKY: a hunter-gatherer society where everyone is economically independent.
BARTER: a society where pairs of individuals meet and engage in bilateral exchange.
MARKET: a monetary economy, where elaborate trading cycles occur.
To arrive at simple special cases of these societies that are amenable to experimental testing, we
assume hereafter that each of the three forms of society corresponds to a game form with four
interacting players. They are labeled A, B, C, and D. Within each society, the framing of the game
involves locks and keys, presented as potential carriers of value. Each participant is endowed with
two unique keys (K) and two unique locks (L). The players (or participants) in all societies are
informed that locks have values only when they are paired with the corresponding key, and vice versa,
which follows intuition. In AUTARKY, we mimic a society without any trade or exchange possibilities;

9
in BARTER, bilateral exchange agreements are expected; and in MARKET each player is assumed to sell
and buy keys in the induced market-like setting. When all decisions are made, the expectation is that
each player will have the same endowment within as well as between societies. The details of the
setup are as follows:
Game forms:
AUTARKY: Each player is endowed with two numbered “locks” and two numbered “keys.” Let L1,
L2, … be “lock #1,” “lock #2,” etc, with K1, K2, … defined analogously. A is given L1, L3, K1, K3;
B is given L2, L4, K2, K4; C is given L5, L7, K5, K7; and D is given L6, L8, K6, K8. The players
are told that each matching pair – (Ln, Kn’) such that n = n' – is worth 50 tokens and that unmatched
locks or keys are worth nothing. Players make no choices and, thus, there are no trade or exchange
possibilities. Since each of them already holds two matching pairs, each receives 100 tokens.
BARTER: Each player is endowed with two locks and two keys. A is given L1, L3, K1, K4; B is given
L2, L4, K2, K3; C is given L5, L8, K5, K7; D is given L6, L7, K6, K8. The players are told that each
matching pair is worth 55 tokens and that unmatched locks or keys are worth nothing. The players
are also told that to get a second matching pair (they already have one each) they may say Yes-or-No
to a bilateral trade agreement with the player holding the key with the number that matches their own
unmatched lock. In exchange for that key, they would give to that player the key with the number
that matches that player’s unmatched lock. Saying Yes costs a player 10 tokens, regardless of what
the other players do. The real-world analogy might be a time or transportation cost for bringing goods
or services to a market. A trade occurs if and only if both players involved in a trade say Yes. If all
players say Yes, so that A trades with B and C trades with D, then each player will in total obtain 100
(= 55+55-10) tokens.
MARKET: Each player is given two locks and two keys, as follows: One is given L1, L5, K2, K3,
another L2, L6, K4, K7, a third L3, L7, K1, K8, and the fourth L4, L8, K5, K6. Each player knows
about the four key-lock packages and his or her own locks and keys, but not the distribution for the
other players.6 Players are told that each matching pair is worth 55 tokens and that unmatched locks
6 For example, if player B has L2, L6, K4, K7 he/she knows that, but he/she does not know whether player C has
L1, L5, K2, K3 or L3, L7, K1, K8 or L4, L8, K5, K6.
10
or keys are worth nothing. Players are told that there is an opportunity to sell their keys and to buy
keys that match their locks. Each such transaction would involve a price of 15 tokens, paid from
buyer to seller. However, the number of transaction that will occur is decided as follows: Each player
must make a single Yes-or-No choice regarding whether he/she is willing to sell (all of) the keys
he/she is endowed with as well as to buy (all of) the keys that would match the locks he/she holds.
Choosing Yes in this fashion costs 10 tokens (interpreted as in BARTER) regardless of what other
players do. If a player says Yes, the numbers of sales and purchases he/she subsequently will be
involved in depends on what the other players choose. If all players say Yes, so that all feasible trades
occur, then each player will in total obtain 100 (=55+55-15-15+15+15-10) tokens. Note that with this
outcome, participants trade in a cycle mimicking the nature of a market economy. If it is not the case
that all players say Yes, then some of their payoffs will be lower, with details depending on just who
chooses No (some calculations are presented below).
Reciprocity, maximal trade, and players’ kindnesses:
Suppose the players are motivated by reciprocity; they desire to be kind to those deemed to be kind
and unkind toward those deemed to be unkind, specifically, as in D&K’s theory. We focus our
analysis on the kindness of players in what we shall call a “maximal-trade outcome”, meaning the
strategy profile where all players choose Yes in BARTER and MARKET, and the automatically generated
outcome (without trade!) in AUTARKY. Using D&K’s theory, the maximal-trade outcome is an
equilibrium in any of the three game forms described in this section.7
In D&K’s (as in Rabin’s) theory, kindnesses can range from negative to positive, and while
the former case breeds hostility the latter breeds generosity. It turns out that in our game forms, and
in a maximal-trade outcome, negative reciprocity is never an issue. Therefore, all our analysis to
follow will concern how positive (or at least non-negative) kindness breeds generosity.
We have parameterized our game forms such that each player’s material payoff will be 100
in a maximal-trade outcome. However, a player’s “kindness” to others, a notion which is central in
reciprocity theory, differs between the game forms. We will not describe all the details about D&K’s
theory here, but merely explain how to calculate players’ kindnesses in our games. Namely, i’s
7 This is trivially true in AUTARKY where the players make no active choices. In BARTER and MARKET there are
additional (but Pareto dominated) equilibria without trade that we do not focus on.

11
kindness to j in a maximal-trade outcome – labeled ij – equals half of the difference between what j
gets with maximal-trade (=100) and what j would get if i did whatever is feasible to block trade. We
calculate the kindness ij for each of our three game forms:
AUTARKY: ij = 0 for all i,j= A,B,C,D (i ≠ j)
Explanation: In AUTARKY, maximal-trade involves no trade. There is nothing to block. Trivially,
since i has no choice, there is no difference between what j gets with maximal-trade (=100) and what
j would get if i did whatever is feasible to block trade (=100). We get ij = ½×(100-100) = 0.
BARTER: BA = AB = DC = CD = 27.5; ij = 0 for all other cases (i ≠ j)
Explanation: Note that A&B (and C&D) influence each other’s payoff as if A (or C) chose a row
while B (or D) chose a column in the following game form:
Table 1: Material payoffs to A and B (or C & B) in BARTER, as a function of their choices.
Yes No
Yes 100, 100 45, 55
No 55, 45 55, 55
The maximal-trade outcome corresponds to the strategy profile (Yes, Yes); B gets 100 when A chooses
Yes, and would otherwise have gotten 45 tokens, etc. We get AB = BA= CD = DC = ½ × (100-45) =
27.5.8 The cases where ij = 0 reflect situations where the players cannot influence the payoff of a
non-trading partner, and the calculations resemble the AUTARKY case.
MARKET: ij = 18.33 for all i,j= A,B,C,D (i ≠ j)
8 Readers familiar with D&K’s paper may take note that the strategies Yes and No are “efficient” in the sense of
D&K (see their pp. 275-6), which is critical for rendering the choice Yes kind. The feature that guarantees this
property is the trading cost (10 tokens) incorporated in the game form.

12
Explanation: The ij’s depend on the endowments. For example, suppose they are as follows:
A: {L1, L5, K2, K3} B: {L2, L6, K4, K7}
C: {L3, L7, K1, K8} D: {L4, L8, K5, K6}
It is helpful to draw a flow-chart of trades using arrows in the all-choose-Yes equilibrium. Then note
that if each player knew each trading partner’s ID we would get:
AB = DA = BC = CD = 20
AD = BA = CB = DC = 7.5
AC = CA = BD = DB = 27.5
To verify the calculations, consider first AB. That number reflects how A could have unilaterally
changed B’s payoff from 100 tokens (corresponding to B’s material payoff when all-choose-Yes) to
that resulting when A unilaterally deviates to choose No. Choice No would deny B access to K2,
hence reduce B’s revenue by 55-15 = 40 tokens (B fails to make a pair worth 55 tokens but does not
have to pay 15 tokens for K2). Hence B’s total material payoff would equal 100-40=60 tokens.
Accordingly, in the all-choose-Yes equilibrium, we get AB = ½×(100-60) = 20. DA, BC, and CD are
calculated analogously. The next four kindnesses (AD = BA = CB = DC = 7.5) concern a player who
can deny another player a sale including a payment of 15; hence reduce that player’s income to 100-
15 = 85 tokens. Kindness in these cases equals ½×(100-85) = 7.5 tokens. The final four kindnesses
(AC = CA = BD = DB = 27.5) concern players interacting via both a sale and a purchase; we get to
“sum up” the two calculations just described: kindness equals 20+7.5 = 27.5 tokens.
However, in MARKET, the players are not given information about co-players’ identity, i.e.,
their ID (A,B,C,D) hence cannot perform the just stated calculations and associate them with
particular others. The reasonable way to calculate the kindness with respect to any other player, in an
all-choose-Yes equilibrium, is to take expected values. Hence, perceived kindness is in equilibrium
equal to the average kindness, so we get ij = (20+7.5+27.5)/3 = 18.33.

13
Predictions for Stage 2:
Imagine that individuals in AUTARKY, BARTER, or MARKET unexpectedly run into someone toward
whom, at some cost, they can be generous in Stage 2 of the experiment. Will they give anything, and
how much? We propose that the kindness generated in the preceding societal activity in various
magnitudes, which only depended on the treatment allocation, may now, so-to-say, “spill over.”
Namely, in the spirit of kindness-based reciprocity, if i runs into j, then the higher were ji in the
preceding societal activity, the more i will give to j.
Specifically, envisage that the unexpected opportunity to be generous appears as a version of
the dictator game. For testing purposes, we shall consider two varieties:
d-game-1: One individual – A, B, C, or D – per group is selected to be the dictator. This person
receives 90 tokens and is asked to divide this amount between him- or herself and the other
group members. The Dictator must give the same amount to each of the others. Finally,
whatever is given to another will be doubled (by the experimenter).9
d-game-2: Works like d-game-1, except that the dictators can give individual amounts to the
other group members.10
Next, refer to Table 2 which summarizes the players’ kindnesses, in each society, with maximal trade:
9 For example, if C gives 17 tokens to each of the others, then A, B, and D gets 34 while C keeps 39 (= 90-3×17).
10 For example, if C is the dictator and gives 17, 20, and 0 tokens to, respectively of A, B, and D then the outcome
will be that A gets 34, B gets 40, D gets 0, and C keeps 53 (= 90-17-20).

14
Table 2: Players’ kindnesses in each society with maximal trade.
AUTARKY BARTER MARKET
ABA 0 27.5 18.33
ACA 0 0 18.33
ADA 0 0 18.33
BAB 0 27.5 18.33
BCB 0 0 18.33
BDB 0 0 18.33
CAC 0 0 18.33
CBC 0 0 18.33
CDC 0 27.5 18.33
DAD 0 0 18.33
DBD 0 0 18.33
DCD 0 27.5 18.33
For d-game-1 it matters how kind i’s co-players are to i on average. The answer is obvious for
AUTARKY and MARKET. Noting that (0+0+27.5)/3 = 9.166 in BARTER, we arrive at Table 3:
Table 3: Players’ average kindnesses, in each society, with maximal trade.
AUTARKY BARTER MARKET
Players’
average
kindness
0 9.166 18.33
To generate predictions, for i = A, B, C, or D, let xi(s) be i’s choice in d-game-1 in society s, where
s = 1 for AUTARKY, s = 2 for BARTER, or s = 3 for MARKET. Similarly, for i,j = A, B, C, or D, with
i ≠ j, let yij(s) be i’s choice in d-game-2 in society s. Hence
xi(s)[0,30]
yij(s)[0,90] and j≠i yij(s) ≤ 90
15
D&K’s original theory gives prediction for game forms where all players are aware of all features.
This is different from our setting where no players, at the time that they interact in an initial society
(i.e., AUTARKY, BARTER, or MARKET), are aware of the dictator game to come. Nevertheless, we
generate predictions based on the spirit of players reciprocating kindness by appeal to the intuitive
principle that the kinder j has been to i the more inclined i will subsequently be to give to j. More
precisely, and with reference to Tables 2 and 3, we hypothesize as follows.
H1.1: xi(1) < xi(2) for i = A, B, C, D
H1.2: xi(1) < xi(3) for i = A, B, C, D
H1.3: xi(2) < xi(3) for i = A, B, C, D
In words, average contributions in MARKET will be higher than average contributions in BARTER,
which will be higher than average contributions in AUTARKY. The prediction is based on inequalities
0 < 9.166 < 18.33 in Table 3. Thus, the key reason for the different theoretical predictions for MARKET,
BARTER and AUTARKY in Stage 2 arises from the higher average perceived kindness in equilibrium in
MARKET compared to BARTER and AUTARKY. From an intuitive perspective, higher average perceived
kindness would generally be an expected feature of market economies compared to an exchange
economy or an autarky society. The reason for this is that markets simply provide more opportunities
to be kind to each other through shared gains from trade, and many more people relate to each other
in the process. Thus, if people were motivated by reciprocity, we would expect - ceteris paribus - a
higher average level of prosocial behavior in market economies.11
Let %[xi(t) > 0] be the percentage of strictly positive xi(t) choices. We will also test:
H2.1: %[xi(1) > 0] < %[xi(2) > 0] for i = A, B, C, D
H2.2: %[xi(1) > 0] < %[xi(3) > 0] for i = A, B, C, D
H2.3: %[xi(2) > 0] < %[xi(3) > 0] for i = A, B, C, D
11 Of course, we would expect the same result in a non-market interaction if this non-market interaction produced
the same level of perceived kindness compared to a market interaction.

16
The motivation is in part analogous to that for H1.1-3. However, we now focus on the frequency with
which participants give positive amounts rather than on how much they give. The justification relates
to the intuitive idea that participants may be heterogeneous as regards whether and how much
reciprocity matters to them. This may lead to a difference between the effect of reciprocity on how
many participants give at all compared to the effect of reciprocity on the magnitude of contributions
conditional on individuals’ willingness to give a positive amount.
H1.1-3 and H2.1-3 concern d-game-1. We can generate analogous hypotheses for d-game-2,
by focusing on the average individual amount given to the other group members in that game. Let
zi(t) = (j≠i yij(t))/3 for t=1,2,3.
We get:
H3.1: zi(1) < zi(2) for i = A, B, C, D
H3.2: zi(1) < zi(3) for i = A, B, C, D
H3.3: zi(2) < zi(3) for i = A, B, C, D
H4.1: %[zi(1) > 0] < %[zi(2) > 0] for i = A, B, C, D
H4.2: %[zi(1) > 0] < %[zi(3) > 0] for i = A, B, C, D
H4.3: %[zi(2) > 0] < %[zi(3) > 0] for i = A, B, C, D
Furthermore, in BARTER, since 0 < 27.5 in the BARTER column of Table 2, analogous reasoning
motivates the following hypotheses concerning how participants will discriminate between their
trading partner12 and the others. Again, we distinguish between the amount participants give (H5) and
the frequency with which participants give positive amounts (H6):
H5: yij(2) > yik(2) for i,j,k = A,B,C,D (i ≠ j ≠ k) if j is i’s trading partner while k is not.
H6: %[yij(2) > 0] > %[yik(2) > 0] for i,j,k = A,B,C,D (i≠j≠k) if j is i’s trading partner while k is not.
12 i and j are trading partners if ij = AB-or-BA-or-CD-or-DC and not trading partners if ik = AC-or-BC-or-CA-or-
DA.

17
4. The Experiment
The 19 experimental sessions (including a pre-test) were run in the EconLab at the University of
Innsbruck, during the summer and autumn of 2019. We recruited 524 student participants across all
faculties. We randomly and anonymously allocated participants to groups of four – i.e., each
individual was assigned an ID-letter: A, B, C or D and no further information about the other
participants was given. The experiment proceeded with two stages. In Stage 1 of our experiment, we
introduced the three between-subject treatments (AUTARKY, BARTER, and MARKET), where each group
of four was randomly allocated to one of these treatments. The framing of the treatments and the
possible actions to be taken were described in Section 3. Thus, each player in each treatment,
reflecting the different societies, was told about the locks and keys as carriers of value and that locks
have values only when they are paired with the corresponding key, and vice versa. The experiment
was designed such that the expectation was that each player would have the same payoff within as
well as between treatments after Stage 1 to rule out possible income effects in the upcoming dictator
game.
The second stage involved the two dictator games (d-game-1 and d-game-2) within each
treatment and group, corresponding to the ones described in Section 3. We used a variation of the
strategy method such that we elicited all participants’ behavior should they become the dictator in
both versions of the dictator game. Participants were informed about the nature of each of the two
dictator games, and how the total amount of 90 tokens could be distributed among the group members
based on the decision taken in one of the games. At first, participants were neither told which of the
two games would be played nor who would be selected to be the dictator. The decisionmakers
indicated their choices for each of the cases. Then, we told the decisionmakers which version of the
dictator game was the relevant one, which participant had been randomly selected as the dictator, and
what decision was finally implemented; at the end, payments were made accordingly. No information
was given about other participants’ decisions, in either of the two versions.
The benefit of this design was that we generated 2×4 = 8 times as many observations as we
would have obtained if we selected one version and one designated dictator per society a priori. The
reason why we implemented only the decision of one individual in each group and why we had no
revelation of non-randomly selected individuals’ decisions, was to maintain the spirit, as far as
possible, of a dictator game, where the co-players (receivers) of the dictator are inactive. The reason

18
why we allocated 90 tokens (rather than, for instance, 100 tokens) is that 90 is divisible by 3, so it is
easy to give it all away in equal amounts while sticking to integers. Recall also that the amounts given
by the dictator were doubled and that the dictator kept the remainder of what he did not send to the
other group members.
In each session, all three treatments were run simultaneously. We programmed the experiment
using z-Tree [3.6.7]. Moreover, we implemented a show-up fee of 4 Euro, protecting participants
from making negative payoffs overall, regardless of their choices. We set the exchange rate of tokens
to Euro at 15:1. The average duration of the experiment was 10.53 minutes (SD 1.47 minutes) and
the average payout (including show-up fee) was 12.89 Euro (SD 1.84 Euro).
5. Results
5.1 Stage 1 and Descriptive Overview of Results in Stage 2
A prerequisite for the experimental examination of the predictions (based on reciprocity theory
established in Section 3) is a design in Stage 1 of the experiment that ensures that almost all groups
in BARTER and MARKET arrive at the Pareto optimal “all-choose-Yes” equilibrium. This means that
the groups are comprised exclusively of participants who have agreed to exchange/trade. Therefore,
before we present the treatment results, we check whether the design applied in Stage 1 of the
experiment meets this requirement.
Of the 348 participants in the BARTER and MARKET treatments, only eight participants (1.72%)
held fewer than two matching key-lock pairs at the end of Stage 1. Most participants thus agreed with
the trade agreements, which means that the design worked as intended. Consequently, for BARTER
and MARKET we only include the groups that have arrived at the "all-choose-Yes" equilibrium to test
the predictions developed in Section 3. In doing so we also ensure that there are no differences in
participants’ income prior to Stage 2, which rules out confounding income effects in the dictator
game. Therefore, we arrive at a total of 516 participants (distributed as 176, 168, and 172 participants
between the AUTARKY, BARTER, and MARKET treatments, respectively) for the econometric tests of

19
the hypotheses.13 We follow Benjamin et al. (2018) and apply a 5%- and a 0.5%-significance level in
all statistical tests in the paper.
First, we present Table 4, which shows descriptive statistics on contributions for all three
treatments. Recall that in d-game-1 [d-game-2] the contributions to others are [not] forced to be equal;
Table 1 reports data concerning the contributions to each of the other three group members. Note that
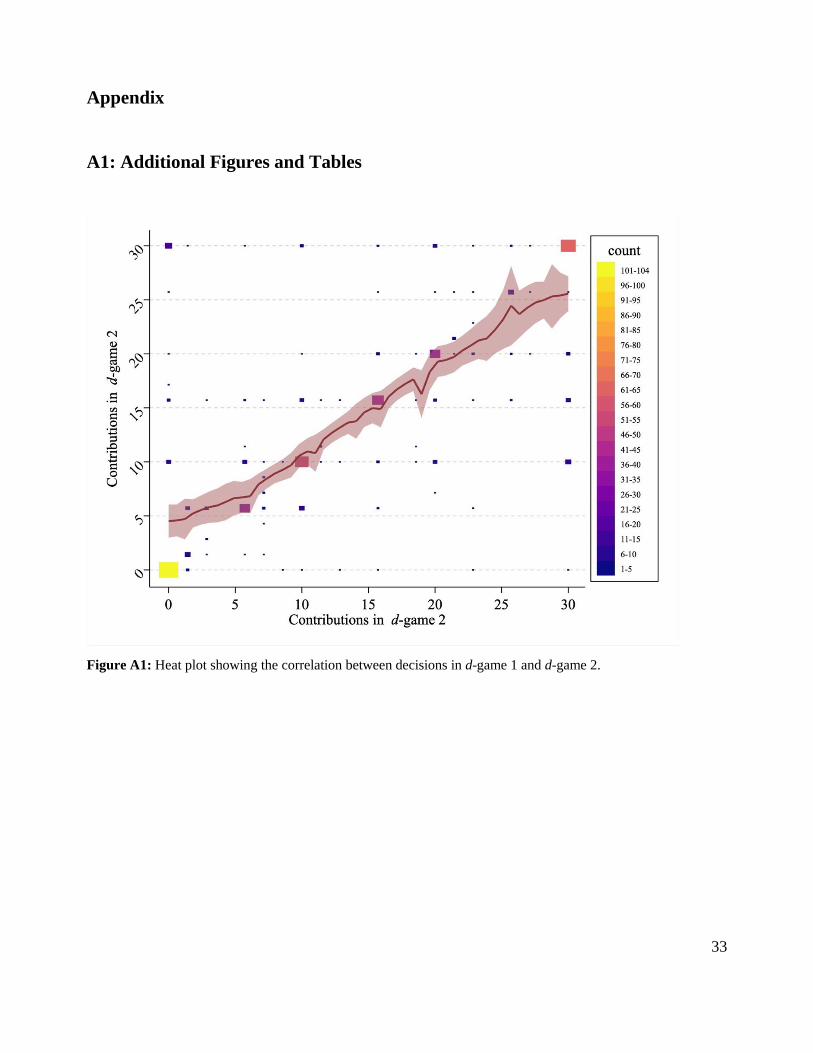
Figure A1 in Section A1 in the Appendix shows a heatmap of contributions in d-game 1 and d-game
2 (Spearman’s rho = 0.76, p < 0.005, N = 516). We find that behavior is consistent across the two
versions of the dictator game.
Table 4: Descriptive statistics for all three treatments regarding contributions to individual other group members.
In Treatment AUTARKY, no interaction between agents takes place. In Treatment BARTER, agents face a bilateral
exchange setting and in Treatment MARKET, agents face a multilateral market setting. d-game-1 represents the
average equal contribution to each of the other three group members in the dictator game. d-game-2 represents the
average individual contributions to each of the other three group members in the dictator game. “%>0” indicates
the percentage of positive contributions.
Treatment d-game Mean Median Sd. Min Max N %>0
AUTARKY 1 12.18 10 10.13 0 30 176 77.27
AUTARKY 2 11.41 10 10.39 0 30 176 74.43
BARTER 1 12.15 10 10.41 0 30 168 78,57
BARTER 2 11.47 10 10.48 0 30 168 75.60
MARKET 1 14.78 15 11.25 0 30 172 80.23
MARKET 2 14.24 15 11.71 0 30 172 74.42
13 As a robustness check, we performed the main analyses of Tables 5 to 7 with the full sample, without excluding
the 8 participants with fewer than two matched key-lock pairs. The main results remain robust even with the full
sample, and the details of these robustness checks are reported in Tables A8 to A10 in Section A1 in the Appendix.

20
5.2 Hypotheses Tests – The Dictator Games
Result 1: Average contributions by dictators in the MARKET treatment are significantly higher
than average contributions by dictators in AUTARKY and BARTER in d-game-1 and d-game-2.
Nevertheless, we find no difference between contributions in dictator decisions in AUTARKY and
BARTER under both versions of the dictator game.
Support: We test the hypotheses derived from reciprocity theory in Section 3 and start with
hypotheses H1 to H4. In Section 3, we established the predictions that the average contributions in d-
game-1 and the aggregated average contributions in d-game-2 will be highest in the dictator game in
Treatment MARKET, followed by Treatment BARTER, and finally Treatment AUTARKY (H1 and H3).14
Figure 1 visually compares the average contributions under both versions of the dictator game
between the three treatments. The visual impression suggests that there is no difference between the
average contributions in AUTARKY and BARTER, but that average contributions in Treatment MARKET
appear to be higher than in both other treatments.
14 As our hypotheses and applied tests are one-sided, non-significant effects should correctly be interpreted in one
direction only as the null hypotheses are imprecise. This means that we cannot rule out a statistically significant
effect in the direction opposite to our one-sided hypotheses based on the one-sided test statistics alone. Therefore,
for each test, we also considered the two-sided test statistics that yield consistent results. Thus, we fail to reject the
precise null hypotheses either. Furthermore, for our non-significant one-tailed hypotheses (and for the two-tailed
robustness checks), we additionally explicitly tested for equivalence with the null. This is important because failure
to reject the null hypothesis is insufficient evidence for a true null effect. For this purpose, we used the Stata package
“tostt” (Dinno, 2017). We followed the approach by Juzek & Kizach (2019) to obtain more objective values for the
parameter delta (δ). Following this approach, we could support the null for all our non-significant hypotheses (H1.1,
H2.1, H2.2, H2.3, H3.1, H4.1, H4.2, and H4.3).
21
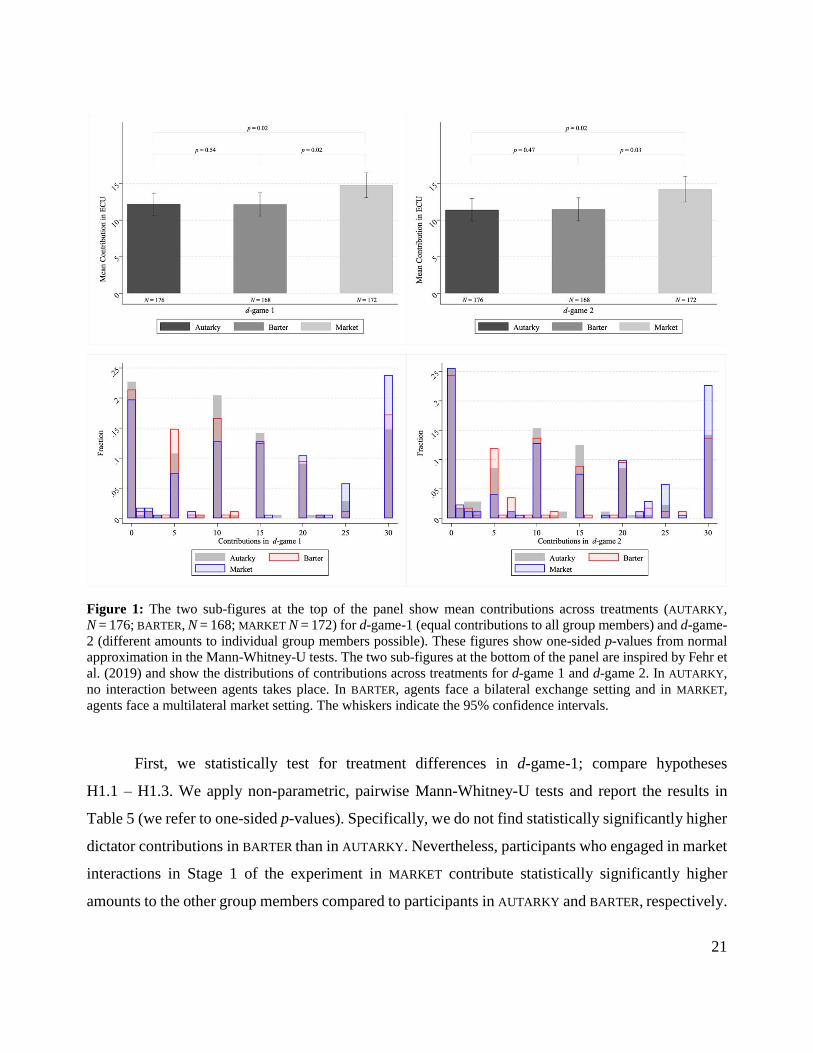
Figure 1: The two sub-figures at the top of the panel show mean contributions across treatments (AUTARKY,
N = 176; BARTER, N = 168; MARKET N = 172) for d-game-1 (equal contributions to all group members) and d-game-
2 (different amounts to individual group members possible). These figures show one-sided p-values from normal
approximation in the Mann-Whitney-U tests. The two sub-figures at the bottom of the panel are inspired by Fehr et
al. (2019) and show the distributions of contributions across treatments for d-game 1 and d-game 2. In AUTARKY,
no interaction between agents takes place. In BARTER, agents face a bilateral exchange setting and in MARKET,
agents face a multilateral market setting. The whiskers indicate the 95% confidence intervals.
First, we statistically test for treatment differences in d-game-1; compare hypotheses
H1.1 – H1.3. We apply non-parametric, pairwise Mann-Whitney-U tests and report the results in
Table 5 (we refer to one-sided p-values). Specifically, we do not find statistically significantly higher
dictator contributions in BARTER than in AUTARKY. Nevertheless, participants who engaged in market
interactions in Stage 1 of the experiment in MARKET contribute statistically significantly higher
amounts to the other group members compared to participants in AUTARKY and BARTER, respectively.

22
Considering the magnitude of these effects, we find that they are not only statistically but also
economically significant. Table 4 shows that participants in Treatment MARKET and d-game-1
contribute on average 2.60 (2.63) more tokens to the other group members than participants in
Treatment AUTARKY (BARTER). This corresponds to 21.35% (21.64%) higher contributions in
Treatment MARKET than in Treatment AUTARKY (BARTER) and is therefore sizeable. Furthermore, as
a robustness check, we re-test H1 by applying OLS-regressions. The results, which are reported in
Table A1 in Section A1 in the Appendix, remain qualitatively robust. We also apply a multivariate
model controlling for gender and political preferences.15 We find that participants who self-report to
be more right-wing contribute lower amounts in the dictator game. Additionally, we find that female
participants are more likely to make positive contributions compared to male participants. If we
compare the magnitudes of the statistically significant effects on contributions in the dictator game
between the variable representing political attitudes (-1.258) and, for example, the treatment dummy
MARKET in Table A1, we find that the treatment effect is about 82% larger in absolute terms than the
effect of political attitudes.
Based on these results, we can only support parts of hypothesis H1. In contrast to the
predictions, compared to AUTARKY, we only find higher contributions in MARKET, but not in BARTER.
Furthermore, to examine H2, we test for pairwise differences regarding the share of positive
contributions between treatments in d-game-1; compare hypotheses H2.1 – H2.3 in Table 5.
15 We checked randomization to ensure that the randomization procedure worked and that there are no differences
in the distribution of the personal characteristics we collected (gender and political preferences). The results are
presented in Table A7 in Section A1 of the Appendix. We observe that the distributions of the variables are not
always statistically indistinguishable between treatments. Therefore, we proceed cautiously and, as a robustness
check, retest all hypotheses in the paper using multivariate regression analyses.
23
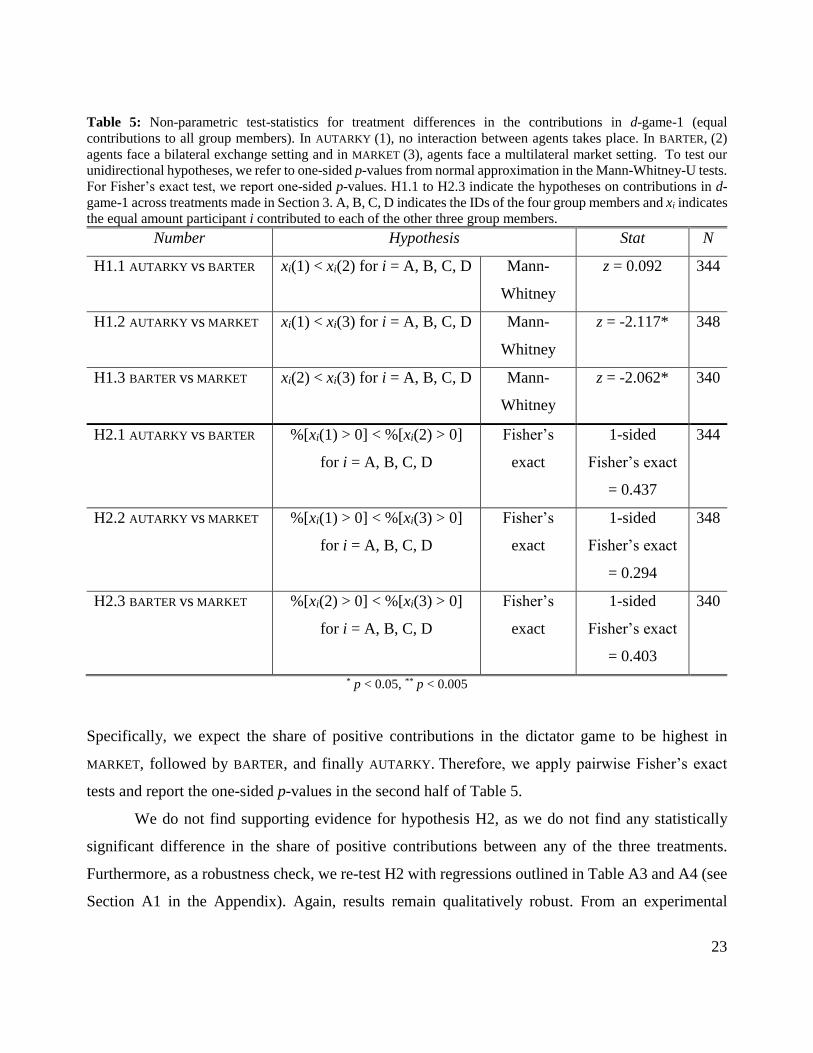
Table 5: Non-parametric test-statistics for treatment differences in the contributions in d-game-1 (equal
contributions to all group members). In AUTARKY (1), no interaction between agents takes place. In BARTER, (2)
agents face a bilateral exchange setting and in MARKET (3), agents face a multilateral market setting. To test our
unidirectional hypotheses, we refer to one-sided p-values from normal approximation in the Mann-Whitney-U tests.
For Fisher’s exact test, we report one-sided p-values. H1.1 to H2.3 indicate the hypotheses on contributions in d-
game-1 across treatments made in Section 3. A, B, C, D indicates the IDs of the four group members and xi indicates
the equal amount participant i contributed to each of the other three group members.
Number Hypothesis Stat N
H1.1 AUTARKY vs BARTER xi(1) < xi(2) for i = A, B, C, D Mann-
Whitney
z = 0.092 344
H1.2 AUTARKY vs MARKET xi(1) < xi(3) for i = A, B, C, D Mann-
Whitney
z = -2.117* 348
H1.3 BARTER vs MARKET xi(2) < xi(3) for i = A, B, C, D Mann-
Whitney
z = -2.062* 340
H2.1 AUTARKY vs BARTER %[xi(1) > 0] < %[xi(2) > 0]
for i = A, B, C, D
Fisher’s
exact
1-sided
Fisher’s exact
= 0.437
344
H2.2 AUTARKY vs MARKET %[xi(1) > 0] < %[xi(3) > 0]
for i = A, B, C, D
Fisher’s
exact
1-sided
Fisher’s exact
= 0.294
348
H2.3 BARTER vs MARKET %[xi(2) > 0] < %[xi(3) > 0]
for i = A, B, C, D
Fisher’s
exact
1-sided
Fisher’s exact
= 0.403
340
* p < 0.05, ** p < 0.005
Specifically, we expect the share of positive contributions in the dictator game to be highest in
MARKET, followed by BARTER, and finally AUTARKY. Therefore, we apply pairwise Fisher’s exact
tests and report the one-sided p-values in the second half of Table 5.
We do not find supporting evidence for hypothesis H2, as we do not find any statistically
significant difference in the share of positive contributions between any of the three treatments.
Furthermore, as a robustness check, we re-test H2 with regressions outlined in Table A3 and A4 (see
Section A1 in the Appendix). Again, results remain qualitatively robust. From an experimental
24
perspective, however, these treatment comparisons must be interpreted cautiously and exploratory,
as treatments differ in more than one aspect, making causal inference difficult. However, we consider
the analyses informative as they represent a direct test on the theoretical predictions.
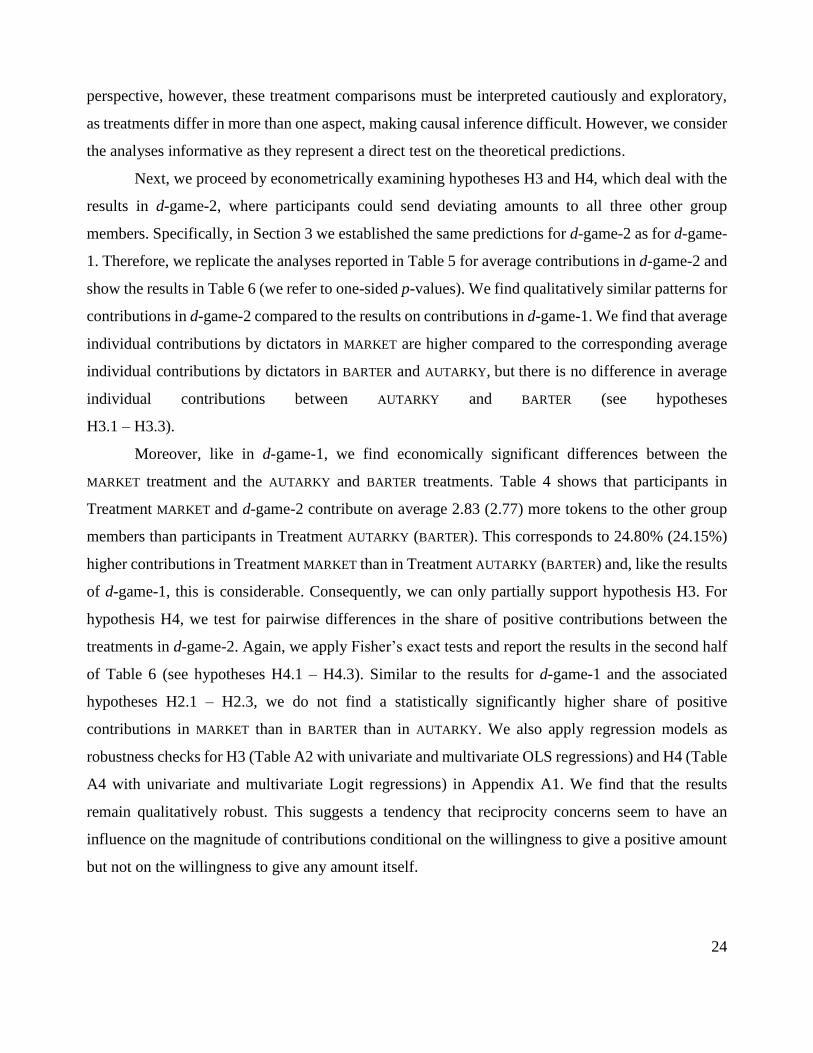
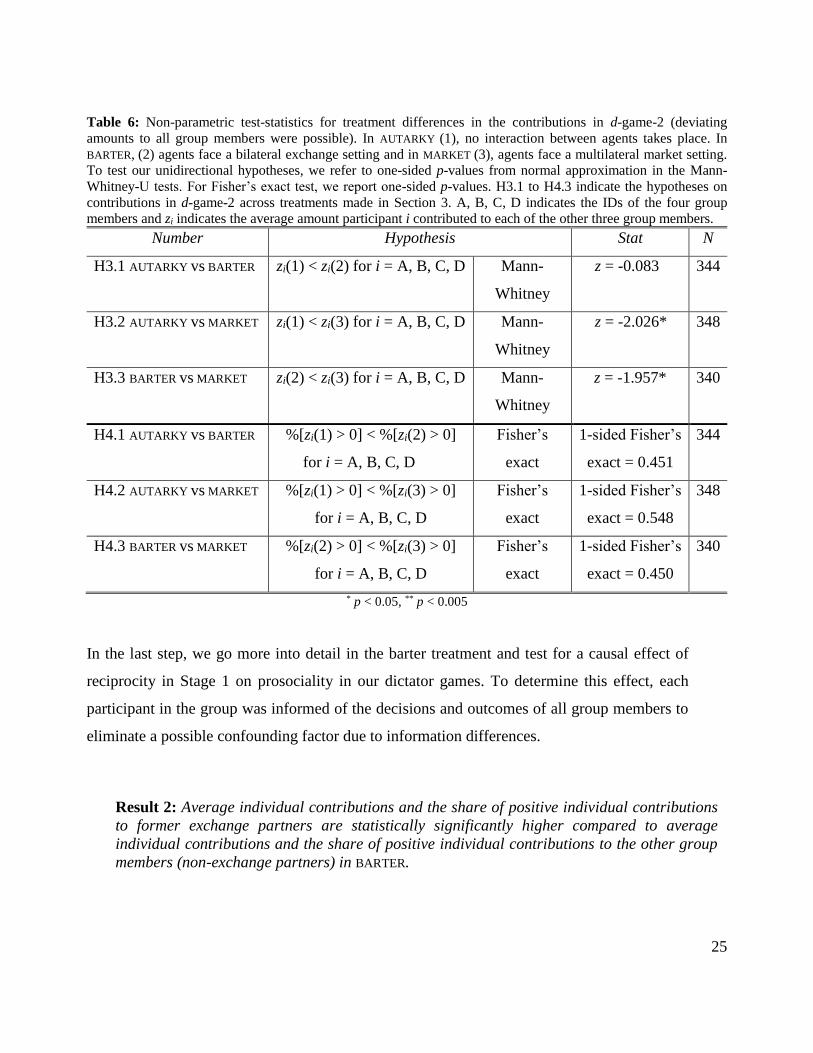
Next, we proceed by econometrically examining hypotheses H3 and H4, which deal with the
results in d-game-2, where participants could send deviating amounts to all three other group
members. Specifically, in Section 3 we established the same predictions for d-game-2 as for d-game-
1. Therefore, we replicate the analyses reported in Table 5 for average contributions in d-game-2 and
show the results in Table 6 (we refer to one-sided p-values). We find qualitatively similar patterns for
contributions in d-game-2 compared to the results on contributions in d-game-1. We find that average
individual contributions by dictators in MARKET are higher compared to the corresponding average
individual contributions by dictators in BARTER and AUTARKY, but there is no difference in average
individual contributions between AUTARKY and BARTER (see hypotheses
H3.1 – H3.3).
Moreover, like in d-game-1, we find economically significant differences between the
MARKET treatment and the AUTARKY and BARTER treatments. Table 4 shows that participants in
Treatment MARKET and d-game-2 contribute on average 2.83 (2.77) more tokens to the other group
members than participants in Treatment AUTARKY (BARTER). This corresponds to 24.80% (24.15%)
higher contributions in Treatment MARKET than in Treatment AUTARKY (BARTER) and, like the results
of d-game-1, this is considerable. Consequently, we can only partially support hypothesis H3. For
hypothesis H4, we test for pairwise differences in the share of positive contributions between the
treatments in d-game-2. Again, we apply Fisher’s exact tests and report the results in the second half
of Table 6 (see hypotheses H4.1 – H4.3). Similar to the results for d-game-1 and the associated
hypotheses H2.1 – H2.3, we do not find a statistically significantly higher share of positive
contributions in MARKET than in BARTER than in AUTARKY. We also apply regression models as
robustness checks for H3 (Table A2 with univariate and multivariate OLS regressions) and H4 (Table
A4 with univariate and multivariate Logit regressions) in Appendix A1. We find that the results
remain qualitatively robust. This suggests a tendency that reciprocity concerns seem to have an
influence on the magnitude of contributions conditional on the willingness to give a positive amount
but not on the willingness to give any amount itself.
25
Table 6: Non-parametric test-statistics for treatment differences in the contributions in d-game-2 (deviating
amounts to all group members were possible). In AUTARKY (1), no interaction between agents takes place. In
BARTER, (2) agents face a bilateral exchange setting and in MARKET (3), agents face a multilateral market setting.
To test our unidirectional hypotheses, we refer to one-sided p-values from normal approximation in the Mann-
Whitney-U tests. For Fisher’s exact test, we report one-sided p-values. H3.1 to H4.3 indicate the hypotheses on
contributions in d-game-2 across treatments made in Section 3. A, B, C, D indicates the IDs of the four group
members and zi indicates the average amount participant i contributed to each of the other three group members.
Number Hypothesis Stat N
H3.1 AUTARKY vs BARTER zi(1) < zi(2) for i = A, B, C, D Mann-
Whitney
z = -0.083 344
H3.2 AUTARKY vs MARKET zi(1) < zi(3) for i = A, B, C, D Mann-
Whitney
z = -2.026* 348
H3.3 BARTER vs MARKET zi(2) < zi(3) for i = A, B, C, D Mann-
Whitney
z = -1.957* 340
H4.1 AUTARKY vs BARTER %[zi(1) > 0] < %[zi(2) > 0]
for i = A, B, C, D
Fisher’s
exact
1-sided Fisher’s
exact = 0.451
344
H4.2 AUTARKY vs MARKET %[zi(1) > 0] < %[zi(3) > 0]
for i = A, B, C, D
Fisher’s
exact
1-sided Fisher’s
exact = 0.548
348
H4.3 BARTER vs MARKET %[zi(2) > 0] < %[zi(3) > 0]
for i = A, B, C, D
Fisher’s
exact
1-sided Fisher’s
exact = 0.450
340
* p < 0.05, ** p < 0.005
In the last step, we go more into detail in the barter treatment and test for a causal effect of
reciprocity in Stage 1 on prosociality in our dictator games. To determine this effect, each
participant in the group was informed of the decisions and outcomes of all group members to
eliminate a possible confounding factor due to information differences.
Result 2: Average individual contributions and the share of positive individual contributions
to former exchange partners are statistically significantly higher compared to average
individual contributions and the share of positive individual contributions to the other group
members (non-exchange partners) in BARTER.

26
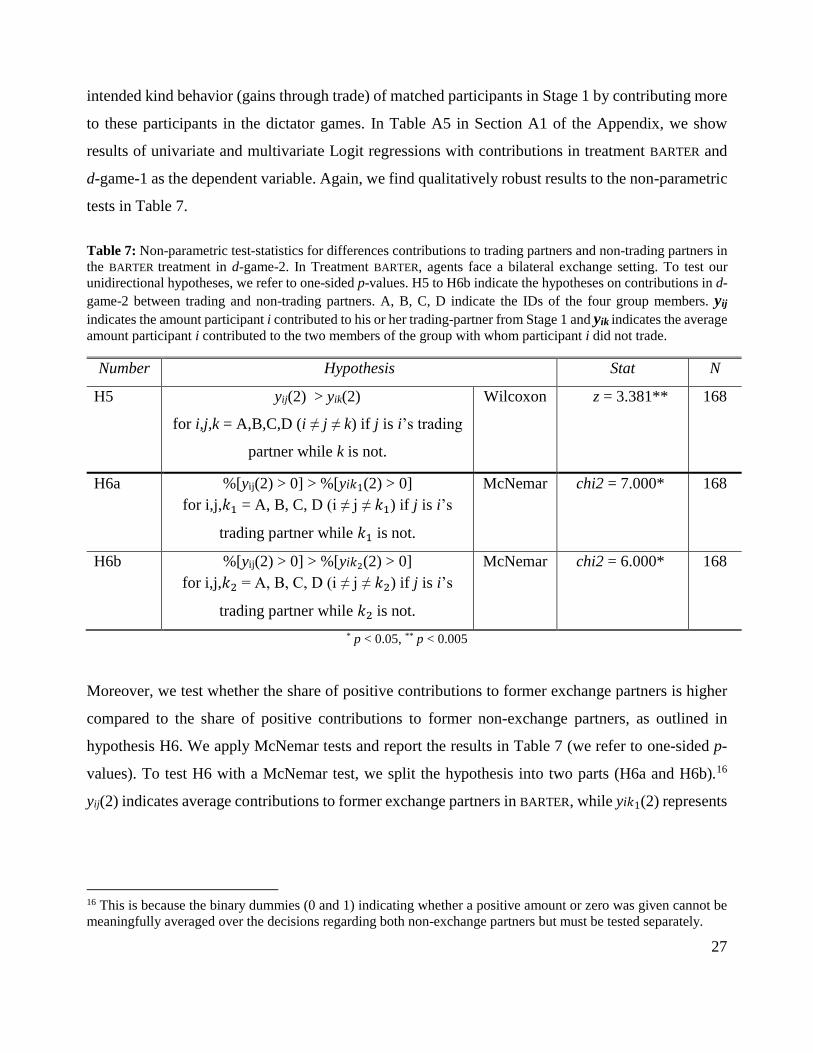
Support: To address hypotheses H5 and H6, we test whether contributions and the share of positive
contributions to former exchange partners are higher than contributions and the share of positive
contributions to non-exchange partners in BARTER. Here, we exclusively focus on contributions in d-
game-2, where individual contributions to each group member were possible. Figure 2 depicts
average contributions to group members who were exchange partners in Stage 1 of the experiment
and those who were not. The visual impression suggests that participants are more generous toward
former trading partners than to other participants in their group.
Figure 2: Mean contributions to trading partners and non-trading partners in the BARTER treatment (N = 168) and
d-game 2, where deviating amounts to all group members are possible. The whiskers denote the 95% confidence
intervals. In Treatment BARTER, agents face a bilateral exchange setting.
We apply Wilcoxon signed-rank tests to statistically test for differences and show the results in Table
7 (we refer to one-sided p values). We infer those contributions to former exchange partners are
statistically significantly higher than contributions to former non-exchange partners (see hypothesis
H5 in Table 7). This means that participants share more with group members with whom they engaged
in a barter in Stage 1 of the experiment than with group members with whom they did not. This result
supports hypothesis H5 and suggests that participants in our experiment gain utility by reciprocating
27
intended kind behavior (gains through trade) of matched participants in Stage 1 by contributing more
to these participants in the dictator games. In Table A5 in Section A1 of the Appendix, we show
results of univariate and multivariate Logit regressions with contributions in treatment BARTER and
d-game-1 as the dependent variable. Again, we find qualitatively robust results to the non-parametric
tests in Table 7.
Table 7: Non-parametric test-statistics for differences contributions to trading partners and non-trading partners in
the BARTER treatment in d-game-2. In Treatment BARTER, agents face a bilateral exchange setting. To test our
unidirectional hypotheses, we refer to one-sided p-values. H5 to H6b indicate the hypotheses on contributions in d-
game-2 between trading and non-trading partners. A, B, C, D indicate the IDs of the four group members. yij
indicates the amount participant i contributed to his or her trading-partner from Stage 1 and yik indicates the average
amount participant i contributed to the two members of the group with whom participant i did not trade.
Number Hypothesis Stat N
H5 yij(2) > yik(2)
for i,j,k = A,B,C,D (i ≠ j ≠ k) if j is i’s trading
partner while k is not.
Wilcoxon z = 3.381** 168
H6a %[yij(2) > 0] > %[yi𝑘1(2) > 0]
for i,j,𝑘1 = A, B, C, D (i ≠ j ≠ 𝑘1) if j is i’s
trading partner while 𝑘1 is not.
McNemar chi2 = 7.000* 168
H6b %[yij(2) > 0] > %[yi𝑘2(2) > 0]
for i,j,𝑘2 = A, B, C, D (i ≠ j ≠ 𝑘2) if j is i’s
trading partner while 𝑘2 is not.
McNemar chi2 = 6.000* 168
* p < 0.05, ** p < 0.005
Moreover, we test whether the share of positive contributions to former exchange partners is higher
compared to the share of positive contributions to former non-exchange partners, as outlined in
hypothesis H6. We apply McNemar tests and report the results in Table 7 (we refer to one-sided p-
values). To test H6 with a McNemar test, we split the hypothesis into two parts (H6a and H6b).16
yij(2) indicates average contributions to former exchange partners in BARTER, while yi𝑘1(2) represents
16 This is because the binary dummies (0 and 1) indicating whether a positive amount or zero was given cannot be
meaningfully averaged over the decisions regarding both non-exchange partners but must be tested separately.
28
average transfers to the first non-exchange partner and yi𝑘2(2) to the second non-exchange partner in
BARTER.17
Overall, we find that positive contributions by dictators are statistically significantly more
frequent in dictator decisions, where participants were matched with group members who were
exchange partners in Stage 1 than in transfer decisions where they were matched with group members
who were not. This is in line with hypothesis H5 and further supports the notion that reciprocity
concerns do matter for participants. It further suggests that reciprocity not only affects the magnitude
of giving but also the willingness to give any positive amount. In Table A6 in Section A1 of the
Appendix, we show results of univariate and multivariate OLS regressions with a dummy variable
that equals 1 for positive and 0 for non-positive contributions in treatment BARTER and d-game-2 as
the dependent variable. We find qualitatively similar results to the non-parametric tests in Table 7,
but the effects remain borderline insignificant.
6. Conclusion
In this paper, we contributed to the old question whether and how market interactions influence moral
behavior. We approached this issue both theoretically and experimentally. We introduced three
market institutions: AUTARKY, where no interaction between participants took place; BARTER, where
participants faced a bilateral exchange setting; and MARKET, where decisionmakers faced a
multilateral market setting. In our theoretical contributions, we built on the D&K reciprocity theory
to obtain theoretical predictions of market interaction on subsequent prosociality.
We first showed theoretically that if people are motivated by reciprocity, then whether people
are prosocial depends on the structure of preceding trade and on whether we consider a trading partner
or someone else. Under AUTARKY, people will not be inclined to be kind to others. In MARKET,
reflecting a modern economy where all individuals trade with each other (via chains of exchange
mediated by monetary payments), people will generally tend to be kind to others. In the intermediate
case, BARTER, where there is 1-on-1 exchange between some individuals but not others, people will
17 Consequently, i and j are trading partners if ij = AB-or-BA-or-CD-or-DC, i and 𝑘1 are no exchange partners if
i𝑘1 = AC-or-BC-or-CA-or-DA (defined as first non-exchange partner) and i and 𝑘2 are non-exchange partners if
i𝑘2 = AD-or-BD-or-CB or-DB (defined as second non-exchange partner).
29
be inclined to be kind to their trading partners but not to others. Our theoretical insights harmonize
well with some prominent thoughts about key transitions that occurred through economic history
mentioned earlier, such as those provided by Pinker (2011) and McCloskey (2006, 2010, 2016), and
they are also consistent with cross-cultural experimental findings of Henrich et al. (2001, 2004, 2005).
Yet, none of these studies could of course identify causal links and there are several potential
mechanisms behind the observed patterns, e.g., related to the rapid income increase resulting from
the development of market economies.
Therefore, we have also conducted a lab experiment where the income is held fixed to provide
simple tests of the derived theoretical hypotheses. We found, in line with the theoretical predictions,
higher prosociality following market interactions compared to the barter interactions and the autarky
setting. We showed that dictator contributions in the market setting (MARKET) were significantly
higher compared to contributions by dictators in AUTARKY and BARTER in d-game-1 (where
contributions had to be the same to each other player) and by dictators in AUTARKY in d-game-2
(where varying contributions were possible). In contrast to our predictions, we did not find any
differences in prosocial behavior between participants in AUTARKY and BARTER. However, we
nevertheless found that people give significantly more to exchange partners than to non-exchange
partners in BARTER, also in line with the theoretical predictions.
All in all, our theory seems to stand up pretty well to our experimental tests. These support some but
not others of the positions adopted by the philosophers and other thinkers we cited in
Section 2. Our experimental results also harmonize with those of Choi & Storr (2021), but in our case
independently of trust. As discussed in the introduction, we do not claim that our theory and
experiment reflect all relevant aspects on how market interactions affect individual prosociality. Our
paper merely offers a complementary and novel way to think about those positions and patterns,
where market interaction may make people more prosocially because of their inclination to
reciprocate. Correspondingly, historical episodes that involve the use of markets may then promote
prosocial choice outside those markets. We encourage future theoretical as well as experimental
research on how different mechanisms of market interaction directly affect prosociality, including
instances when trade may make people view each other as unkind (e.g., in situations where fraud or
embezzlement occurs), thereby increasing external validity. Another extension would concern cases
where the market interaction is based on agents with large differences in initial endowments, and
where the gains from trade are highly unequitable. We plan to return to these issues in future research.
30
References
Akerlof, G. 1982. Labour Contracts as a Partial Gift Exchange. Quarterly Journal of Economics 97:
543-569.
Ashraf, N., Camerer, C. F., Loewenstein, G. 2005. Adam Smith, Behavioral Economist. Journal of
Economic Perspectives 19: 131-145.
Bartling, B., Weber, R.A., Yao, L. 2015. Do Markets Erode Social Responsibility? Quarterly Journal
of Economics 130: 219-266.
Bartling, B., Fehr, E., Ozdemir, Y. 2020. Does Market Interaction Erode Moral Values? Working
paper, University of Zurich.
Battigalli, P., Dufwenberg, M. 2020. Belief-Dependent Motivations and Psychological Game Theory.
Journal of Economic Literature, forthcoming.
Benjamin, D.J., Berger, J.O., Johannesson, M., Nosek, B.A., Wagenmakers, E.-J. et al. 2018.
Redefine Statistical Significance. Nature Human Behaviour 2: 6–10.
Choi, G.S., Storr, V.H. 2020. Market Interactions, Trust and Reciprocity. PLoS One 15(5):
e0232704.
Deane, H.A. 1963. The Political and Social Ideas of St. Augustine. N.Y.: Columbia University Press.
Dewatripont, M. & Tirole, J. 2022. The Morality of Markets, mimeo.
Dinno, A. 2017. Tostregress: Linear regression tests for equivalence. Stata software package.
Available online at: https://www.alexisdinno.com/stata/tost.html
Dufwenberg, M., Kirchsteiger, G. 2004. A Theory of Sequential Reciprocity. Games and Economic
Behavior 47(2): 268–298.
Ensminger, J., Henrich, J. (Eds.). 2014. Experimenting with Social Norms: Fairness and Punishment
in Cross Cultural Perspective. New York: Russell Sage Press.
Falk, A., Fischbacher, U. 2006. A Theory of Reciprocity. Games and Economic Behavior 54: 293-
315.
Falk, A., Szech, N. 2013. Morals and Markets. Science 340(6133): 707-711.
Fehr, D., Mollerstrom, J., Perez-Truglia, R. 2019. Your Place in the World: Relative Income and
Global Inequality. GMU Working Paper in Economics No. 20-04.
Fehr, E., Gächter, S. 2000. Fairness and Retaliation: The Economics of Reciprocity. Journal of
Economic Perspectives 14: 159-181.
Geanakoplos, J., Pearce, D. Stacchetti, E. 1989. Psychological Games and Sequential Rationality.
Games and Economic Behavior 1: 60-80.
Goranson, R., Berkowitz, L. 1966. Reciprocity and Responsibility Reactions to Prior Help, Journal
of Personality and Social Psychology 3: 227-232.

31
Henrich, J., Boyd, R., Bowles, S., Camerer, C., Fehr, E., Gintis, H. 2004. Foundations of Human
Sociality: Economic Experiments and Ethnographic Evidence from Fifteen Small-Scale Societies.
Oxford: Oxford University Press.
Henrich, J., Boyd, R., Bowles, S., Camerer, C., Fehr, E., Gintis, H., McElreath, R. 2001. In Search of
Homo Economicus: Behavioral Experiments in 15 Small-Scale Societies. American Economic
Review 91(2):73-78.
Henrich, J., Boyd, R., Bowles, S., Camerer, C., Fehr, E., Gintis, H., McElreath, R., Alvard, M., Barr,
A., Ensminger, J., Smith Henrich, N., Hill, K., Gil-White, F., Gurven, M., Marlowe, F.W., Patton,
J.Q., Tracer, D. 2005. Economic Man. Cross-Cultural Perspective: Behavioral Experiments in 15
Small Scale Societies. Behavioral and Brain Sciences 28: 795-855.
Henrich, J., McElreath, R., Barr, A., Ensminger, J., Barrett, C., et al. 2006. Costly Punishment Across
Human Societies. Science 312(5781): 1767-1770.
Henrich, J., Ensminger, J., McElreath, R., Barr, A., Barrett, C., et al. 2010. Markets, Religion,
Community Size, and the Evolution of Fairness and Punishment. Science 327(5972): 1480-1484.
Henrich, J., Boyd, R., McElreath, R., Gurven, M., Richerson, P.J., et al. 2012. Culture Does Account
for Variation in Game Behavior. Proceedings of the National Academy of Sciences 109(2): E32–E33.
Hirschman, A.O. 1977. The Passion and the Interest: Political Arguments for Capitalism Before Its
Triumph. Princeton University Press, Princeton.
Juzek, T. S., Kizach, J. 2019. How to Set Delta in the two-one-sided T-tests procedure (TOST).
Journal of Research Design and Statistics in Linguistics and Communication Science 5 (1–2): 153-
169.
Kirchler, M., Huber, J., Stefan, M. Sutter, M. 2016. Market Design and Moral Behavior. Management
Science 62(9): 2615-2625.
Marx, Karl 1844. Economic and Philosophic Manuscripts of 1844. First published in 1932 and in
1959 in English, by Progress Publishers, Moscow. Available online at:
https://wikirouge.net/texts/en/Economic_%26_Philosophic_Manuscripts_of_1844.
Mauss, M. 1954. The Gift: Forms and Functions of Exchange in Archaic Societies. Glencoe, Illinois:
The Free Press.
McCloskey, D.N. 2006. The Bourgeois Virtues: Ethics for an Age of Commerce. Chicago: University
of Chicago Press.
McCloskey, D.N. 2010. Bourgeois Dignity: Why Economics Can’t Explain the Modern World.
Chicago: University of Chicago Press.
McCloskey, D.N. 2016. Bourgeois Equality: How Ideas, Not Capital or Institutions, Enriched the
World. Chicago: University of Chicago Press.
Pinker, S. 2011. The Better Angels of our Nature: Why Violence has Declined. New York: Viking.
Rabin, M. 1993. Incorporating Fairness into Game Theory and Economics. American Economic
Review 83: 1281-1302.

32
Rothschild, E. 2002. Economic Sentiments: Adam Smith, Condorcet and the Enlightenment.
Harvard: Harvard University Press.
Smith, A. 1759/1982. The Theory of Moral Sentiments. Indianapolis: Liberty Classics.
Smith, A. 1776/1981. An Enquiry into the Nature and Causes of the Wealth of Nations. Indianapolis:
Liberty Fund.
Smith, V. & B. Wilson (2019), Humanomics: Moral Sentiments and the Wealth of Nations for the
Twenty-First Century, Cambridge University Press.
Sobel, J. 2005. Interdependent Preferences and Reciprocity. Journal of Economic Literature 43: 396-
440.
Trivers, R. 1971. The Evolution of Reciprocal Altruism. Quarterly Review of Biology 46: 35-57.
33
Appendix
A1: Additional Figures and Tables
Figure A1: Heat plot showing the correlation between decisions in d-game 1 and d-game 2.

34
Table A1: The table shows the results of univariate and multivariate OLS regressions with contributions in d-game-
1 as the dependent variable. BARTER and MARKET represent dummy variables indicating treatment assignment
(reference category: AUTARKY). FEMALE and OTHER represent dummy variables regarding gender, with the former
representing female participants and the latter representing participants who do not identify as male or female
(reference category: MALE). The variable POLITICAL represents a 7-point Likert scale from left to right.
(1) (2)
Model 1 Model 2
BARTER -0.021
(1.112)
-0.046
(1.112)
MARKET 2.603*
(1.152)
2.292*
(1.152)
FEMALE
-0.093
(0.955)
OTHER
-2.677
(10.534)
POLITICAL
-1.258*
(0.449)
Constant 12.176**
(0.766)
16.313**
(1.759)
Observations 516 516
Prob > F 0.039 0.012
R2 0.013 0.032
Wald-Test (p):
BARTER - MARKET
0.026 0.046
Robust standard errors in parentheses (hc3)
* p < 0.05, ** p < 0.005

35
Table A2: The table shows the results of univariate and multivariate OLS regressions with contributions in d-game-
2 as the dependent variable. BARTER and MARKET represent dummy variables indicating treatment assignment
(reference category: AUTARKY). FEMALE and OTHER represent dummy variables regarding gender, with the former
representing female participants and the latter representing participants who do not identify as male or female
(reference category: MALE). The variable POLITICAL represents a 7-point Likert scale from left to right.
(1) (2)
Model 1 Model 2
BARTER 0.065
(1.123)
-0.021
(1.128)
MARKET 2.835*
(1.191)
2.597*
(1.189)
FEMALE
1.367
(0.981)
OTHER
1.307
(9.779)
POLITICAL
-1.250*
(0.447)
Constant 11.409**
(0.786)
14.731**
(1.792)
Observations 516 516
Prob > F 0.030 0.002
R2 0.015 0.039
Wald-Test (p):
BARTER - MARKET
0.022 0.029
Robust standard errors in parentheses (hc3)
* p < 0.05, ** p < 0.005
36
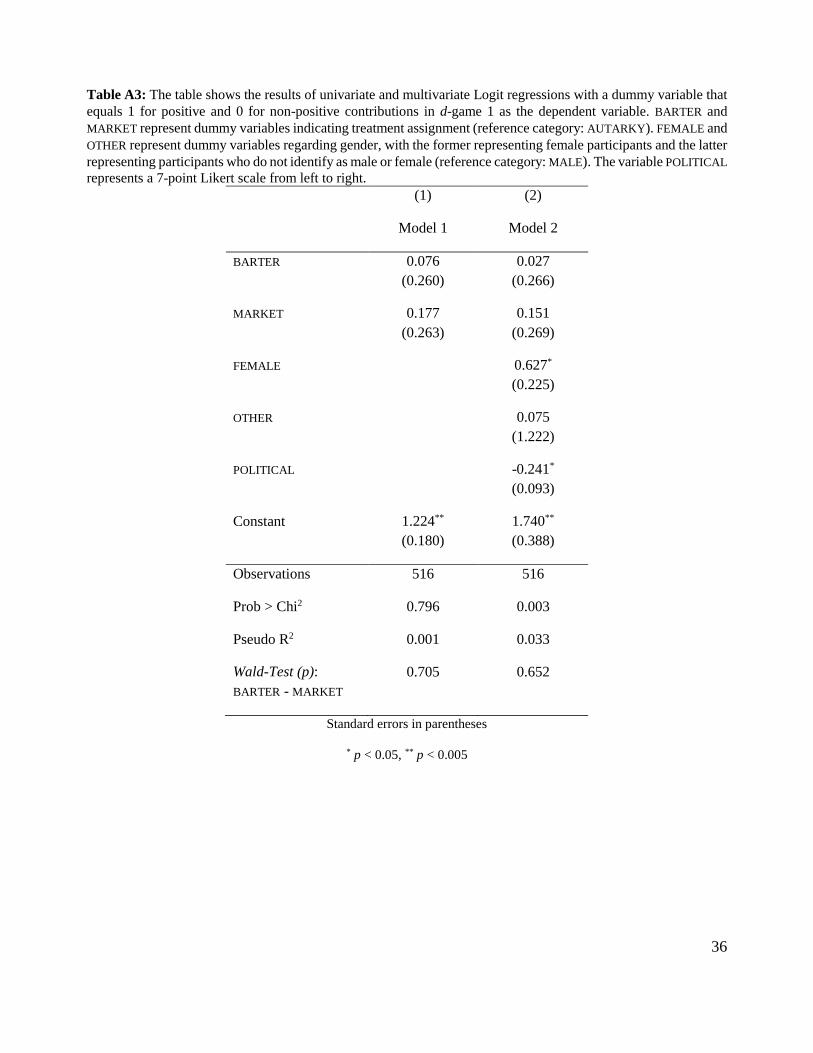
Table A3: The table shows the results of univariate and multivariate Logit regressions with a dummy variable that
equals 1 for positive and 0 for non-positive contributions in d-game 1 as the dependent variable. BARTER and
MARKET represent dummy variables indicating treatment assignment (reference category: AUTARKY). FEMALE and
OTHER represent dummy variables regarding gender, with the former representing female participants and the latter
representing participants who do not identify as male or female (reference category: MALE). The variable POLITICAL
represents a 7-point Likert scale from left to right.
(1) (2)
Model 1 Model 2
BARTER 0.076
(0.260)
0.027
(0.266)
MARKET 0.177
(0.263)
0.151
(0.269)
FEMALE
0.627*
(0.225)
OTHER
0.075
(1.222)
POLITICAL
-0.241*
(0.093)
Constant 1.224**
(0.180)
1.740**
(0.388)
Observations 516 516
Prob > Chi2 0.796 0.003
Pseudo R2 0.001 0.033
Wald-Test (p):
BARTER - MARKET
0.705 0.652
Standard errors in parentheses
* p < 0.05, ** p < 0.005

37
Table A4: The table shows the results of univariate and multivariate Logit regressions with a dummy variable that
equals 1 for positive and 0 for non-positive contributions in d-game 2 as the dependent variable. BARTER and
MARKET represent dummy variables indicating treatment assignment (reference category: AUTARKY). FEMALE
represents a dummy variable representing female participants (reference category: MALE). The four observations in
the OTHER category are discarded by Stata and thus omitted from the output because this category represents a
perfect predictor in d-game 2. The variable POLITICAL represents a 7-point Likert scale from left to right.
(1) (2)
Model 1 Model 2
BARTER 0.062
(0.249)
0.036
(0.255)
MARKET -0.001
(0.246)
-0.007
(0.252)
FEMALE
0.709**
(0.212)
POLITICAL
-0.224*
(0.090)
Constant 1.069**
(0.173)
1.459**
(0.372)
Observations 516 512
Prob > Chi2 0.960 0.000
Pseudo R2 0.000 0.036
Wald-Test (p):
BARTER - MARKET
0.802 0.870
Standard errors in parentheses
* p < 0.05, ** p < 0.005

38
Table A5: The table shows the results of univariate and multivariate OLS regressions with contributions in
treatment BARTER and d-game 2 as the dependent variable. PARTNER is a dummy variable indicating contribution
decisions concerning former trading partners from Stage 1 (reference category: NON-PARTNER). FEMALE and
OTHER represent dummy variables regarding gender, with the former representing female participants and the latter
representing participants who do not identify as male or female (reference category: MALE). The variable POLITICAL
represents a 7-point Likert scale from left to right.
(1) (2)
Model 1 Model 2
PARTNER 0.899*
(0.326)
0.899*
(0.326)
FEMALE
1.199
(0.992)
OTHER
0.830
(6.936)
POLITICAL
-1.319**
(0.421)
Constant 12.076**
(0.482)
15.599**
(1.626)
Observations 1032 1032
Prob > F 0.006 0.000
R2 0.001 0.024
Clustered standard errors on the participant level in parentheses
* p < 0.05, ** p < 0.005

39
Table A6: The table shows the results of univariate and multivariate Logit regressions with a dummy variable that
equals 1 for positive and 0 for non-positive contributions in treatment BARTER and d-game 2 as the dependent
variable. PARTNER is a dummy variable indicating contribution decisions concerning former trading partners from
Stage 1 (reference category: NON-PARTNER). FEMALE represents a dummy variable representing female
participants (reference category: MALE). The eight observations by the four participants in the OTHER category are
discarded by Stata and thus omitted from the output because this category represents a perfect predictor in d-game
2. The variable POLITICAL represents a 7-point Likert scale from left to right.
(1) (2)
Model 1 Model 2
PARTNER 0.040
(0.028)
0.042
(0.030)
FEMALE
0.719**
(0.207)
POLITICAL
-0.233*
(0.087)
Constant 1.028**
(0.100)
1.429**
(0.326)
Observations 1032 1024
Prob > Chi2 0.157 0.000
Pseudo R2 0.000 0.038
Clustered standard errors on the participant level in parentheses
* p < 0.05, ** p < 0.005
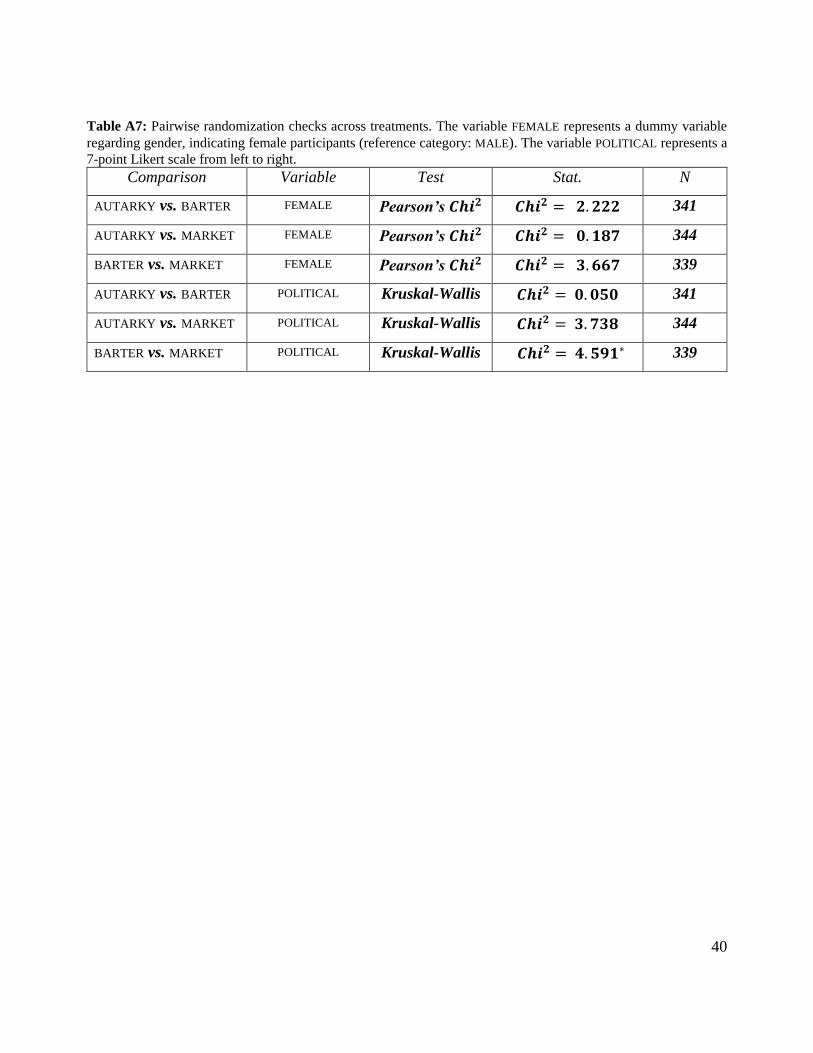
40
Table A7: Pairwise randomization checks across treatments. The variable FEMALE represents a dummy variable
regarding gender, indicating female participants (reference category: MALE). The variable POLITICAL represents a
7-point Likert scale from left to right.
Comparison Variable Test Stat. N
AUTARKY vs. BARTER FEMALE Pearson’s 𝑪𝒉𝒊𝟐 𝑪𝒉𝒊𝟐 = 𝟐. 𝟐𝟐𝟐 341
AUTARKY vs. MARKET FEMALE Pearson’s 𝑪𝒉𝒊𝟐 𝑪𝒉𝒊𝟐 = 𝟎. 𝟏𝟖𝟕 344
BARTER vs. MARKET FEMALE Pearson’s 𝑪𝒉𝒊𝟐 𝑪𝒉𝒊𝟐 = 𝟑. 𝟔𝟔𝟕 339
AUTARKY vs. BARTER POLITICAL Kruskal-Wallis 𝑪𝒉𝒊𝟐 = 𝟎. 𝟎𝟓𝟎 341
AUTARKY vs. MARKET POLITICAL Kruskal-Wallis 𝑪𝒉𝒊𝟐 = 𝟑. 𝟕𝟑𝟖 344
BARTER vs. MARKET POLITICAL Kruskal-Wallis 𝑪𝒉𝒊𝟐 = 𝟒. 𝟓𝟗𝟏∗ 339

41
Table A8: Non-parametric test-statistics for treatment differences in the contributions in d-game-1 (equal
contributions to all group members) with the full sample. In AUTARKY (1), no interaction between agents takes
place. In BARTER, (2) agents face a bilateral exchange setting and in MARKET (3), agents face a multilateral market
setting. To test our unidirectional hypotheses, we refer to one-sided p-values from normal approximation in the
Mann-Whitney-U tests. For Fisher’s exact test, we report one-sided p-values. H1.1 to H2.3 indicate the hypotheses
on contributions in d-game-1 across treatments made in Section 3. A, B, C, D indicates the IDs of the four group
members and xi indicates the equal amount participant i contributed to each of the other three group members.
Number Hypothesis Stat N
H1.1 AUTARKY vs BARTER xi(1) < xi(2) for i = A, B, C, D Mann-
Whitney
z = 0.304 352
H1.2 AUTARKY vs MARKET xi(1) < xi(3) for i = A, B, C, D Mann-
Whitney
z = -2.117* 348
H1.3 BARTER vs MARKET xi(2) < xi(3) for i = A, B, C, D Mann-
Whitney
z = -2.294* 348
H2.1 AUTARKY vs BARTER %[xi(1) > 0] < %[xi(2) > 0]
for i = A, B, C, D
Fisher’s
exact
1-sided
Fisher’s exact
= 0.500
352
H2.2 AUTARKY vs MARKET %[xi(1) > 0] < %[xi(3) > 0]
for i = A, B, C, D
Fisher’s
exact
1-sided
Fisher’s exact
= 0.294
348
H2.3 BARTER vs MARKET %[xi(2) > 0] < %[xi(3) > 0]
for i = A, B, C, D
Fisher’s
exact
1-sided
Fisher’s exact
= 0.339
348
* p < 0.05, ** p < 0.005
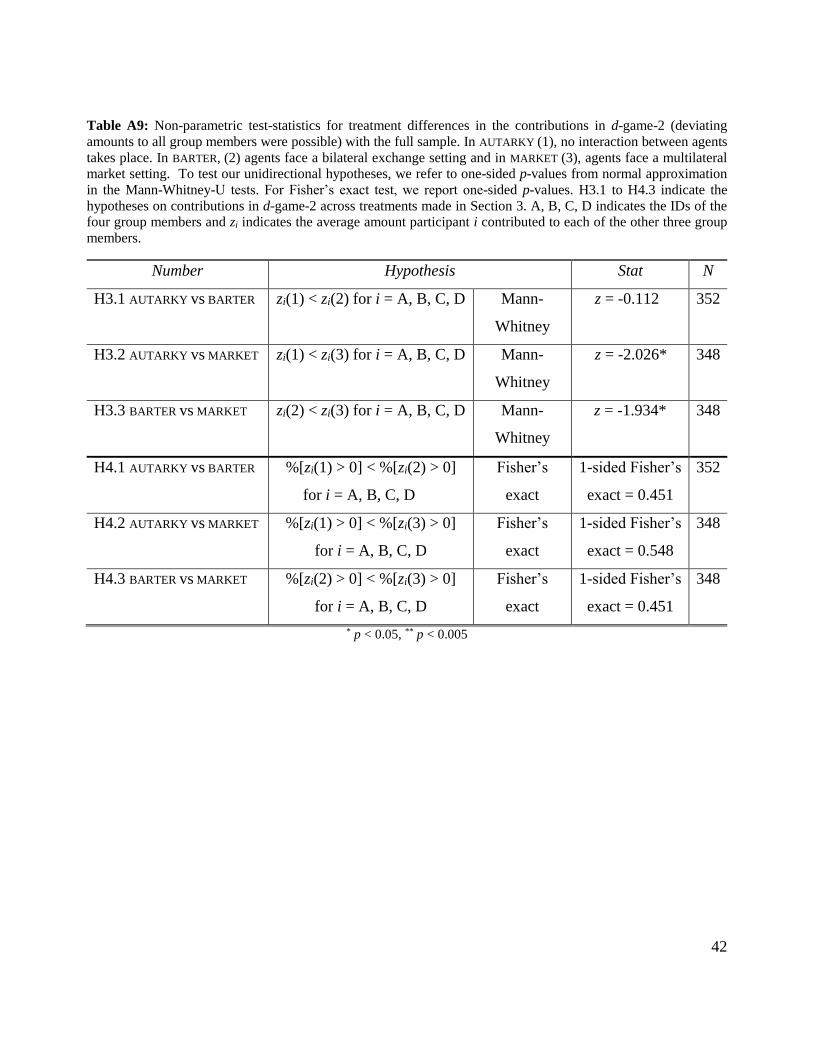
42
Table A9: Non-parametric test-statistics for treatment differences in the contributions in d-game-2 (deviating
amounts to all group members were possible) with the full sample. In AUTARKY (1), no interaction between agents
takes place. In BARTER, (2) agents face a bilateral exchange setting and in MARKET (3), agents face a multilateral
market setting. To test our unidirectional hypotheses, we refer to one-sided p-values from normal approximation
in the Mann-Whitney-U tests. For Fisher’s exact test, we report one-sided p-values. H3.1 to H4.3 indicate the
hypotheses on contributions in d-game-2 across treatments made in Section 3. A, B, C, D indicates the IDs of the
four group members and zi indicates the average amount participant i contributed to each of the other three group
members.
Number Hypothesis Stat N
H3.1 AUTARKY vs BARTER zi(1) < zi(2) for i = A, B, C, D Mann-
Whitney
z = -0.112 352
H3.2 AUTARKY vs MARKET zi(1) < zi(3) for i = A, B, C, D Mann-
Whitney
z = -2.026* 348
H3.3 BARTER vs MARKET zi(2) < zi(3) for i = A, B, C, D Mann-
Whitney
z = -1.934* 348
H4.1 AUTARKY vs BARTER %[zi(1) > 0] < %[zi(2) > 0]
for i = A, B, C, D
Fisher’s
exact
1-sided Fisher’s
exact = 0.451
352
H4.2 AUTARKY vs MARKET %[zi(1) > 0] < %[zi(3) > 0]
for i = A, B, C, D
Fisher’s
exact
1-sided Fisher’s
exact = 0.548
348
H4.3 BARTER vs MARKET %[zi(2) > 0] < %[zi(3) > 0]
for i = A, B, C, D
Fisher’s
exact
1-sided Fisher’s
exact = 0.451
348
* p < 0.05, ** p < 0.005
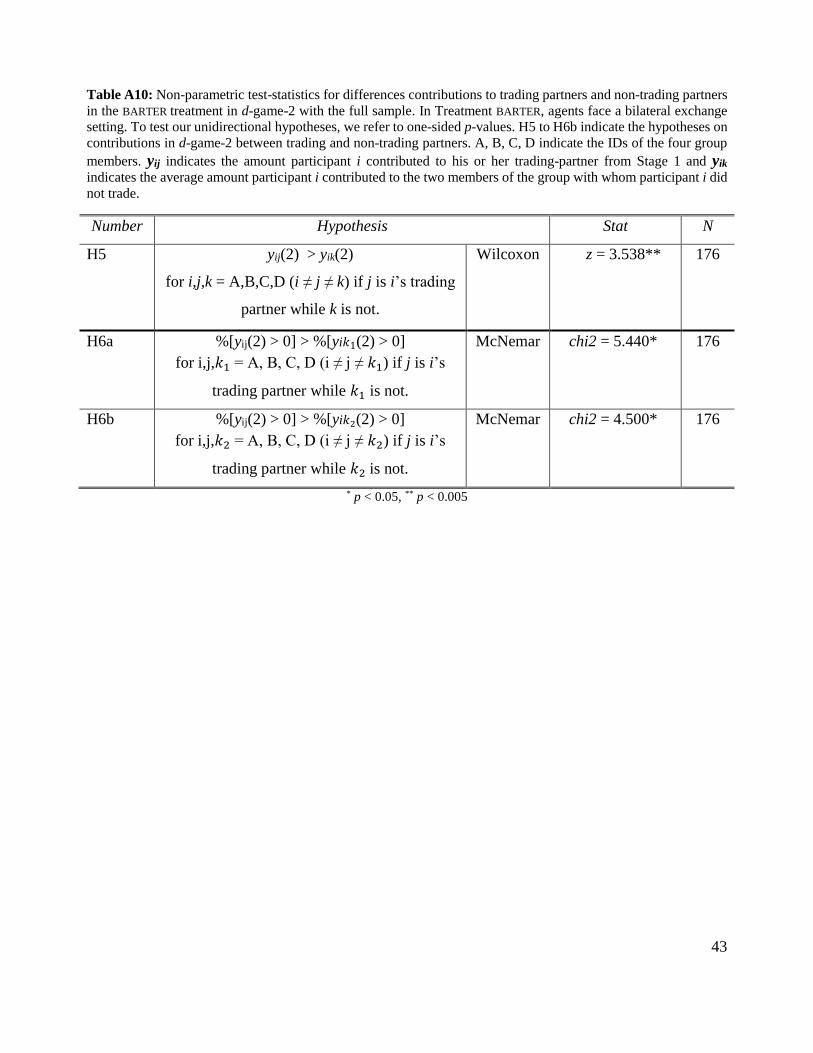
43
Table A10: Non-parametric test-statistics for differences contributions to trading partners and non-trading partners
in the BARTER treatment in d-game-2 with the full sample. In Treatment BARTER, agents face a bilateral exchange
setting. To test our unidirectional hypotheses, we refer to one-sided p-values. H5 to H6b indicate the hypotheses on
contributions in d-game-2 between trading and non-trading partners. A, B, C, D indicate the IDs of the four group
members. yij indicates the amount participant i contributed to his or her trading-partner from Stage 1 and yik
indicates the average amount participant i contributed to the two members of the group with whom participant i did
not trade.
Number Hypothesis Stat N
H5 yij(2) > yik(2)
for i,j,k = A,B,C,D (i ≠ j ≠ k) if j is i’s trading
partner while k is not.
Wilcoxon z = 3.538** 176
H6a %[yij(2) > 0] > %[yi𝑘1(2) > 0]
for i,j,𝑘1 = A, B, C, D (i ≠ j ≠ 𝑘1) if j is i’s
trading partner while 𝑘1 is not.
McNemar chi2 = 5.440* 176
H6b %[yij(2) > 0] > %[yi𝑘2(2) > 0]
for i,j,𝑘2 = A, B, C, D (i ≠ j ≠ 𝑘2) if j is i’s
trading partner while 𝑘2 is not.
McNemar chi2 = 4.500* 176
* p < 0.05, ** p < 0.005

44
A2: Experimental Instructions
1. General Instructions

45
2. Stage 1: Treatment AUTARKY

46
3. Stage 1: Treatment BARTER
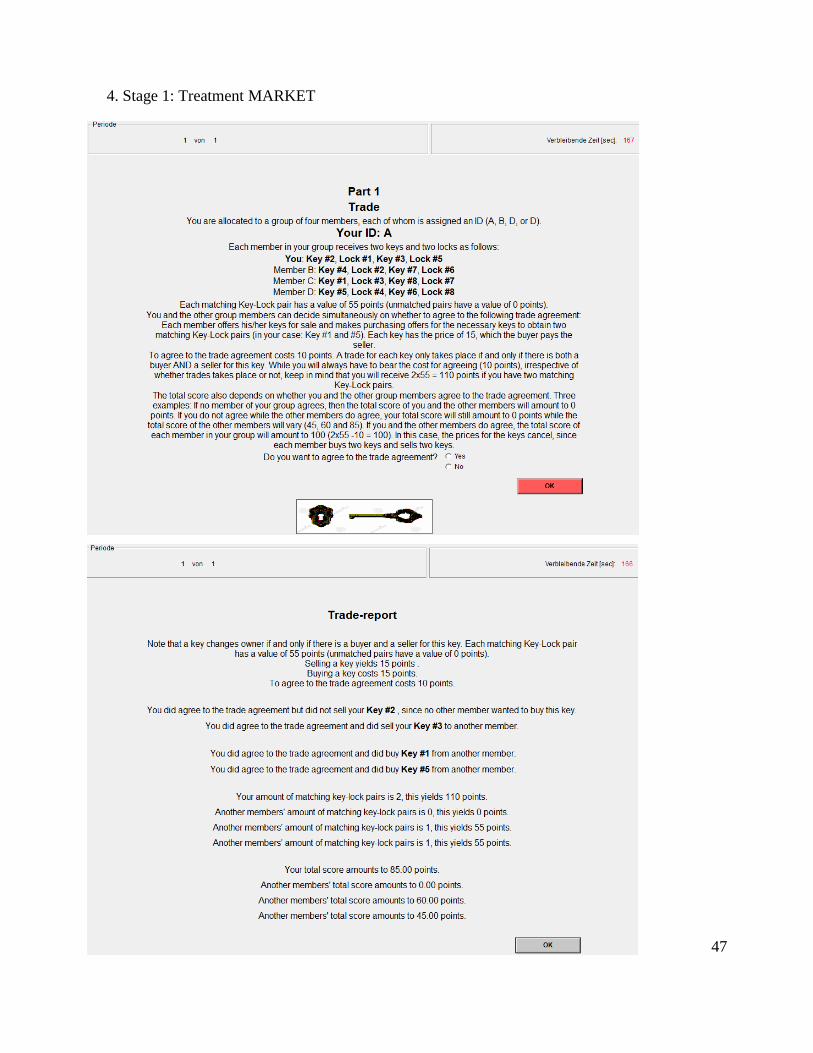
47
4. Stage 1: Treatment MARKET

48
5. Stage 2: Dictator Decision

49