Embed Size (px)
Citation preview

Mean Diurnal Patterns for Select Stations in the TOGA COARE Region
Julie Caron, Shawn Smith, David Legler
Center for Ocean-Atmospheric Prediction Studies Surface Meteorology Data Processing Center
COARE Report 96-2 August, 1996
Acknowledgements: Discussions with individuals in the Center for Ocean-Atmospheric Prediction Studies (COAPS) improved the scope and content of this atlas. A special thank you to Mark Verschell and James Stricherz for sharing their computing expertise.
We acknowledge support from NOAA/UCAR through the TOGA COARE International Project Office (Contract S94-39979).

1. Introduction
The main objective of the atlas is to provide insight into the mean diurnal patterns of surface meteorology variables during the Tropical Ocean Global Atmosphere Coupled Ocean Atmosphere Response Experiment (TOGA COARE). The geographical region considered for this atlas is bounded by 30S to 30N and 180E to 90E (see Fig. 1). The mean diurnal patterns for 37 land stations in this region are presented. They were calculated based on data available every three hours (where possible), during the Intensive Observing Period (IOP): 00UTC on November 1, 1992 to 23UTC on February 28, 1993.
Early atlases of the TOGA COARE region provide (monthly and 20 year) climatological isoline and streamline analyses of kinematic and thermodynamic meteorological parameters. For example, they provide monthly and 15 year climatological analyses of in-situ wind data over the Indian Ocean (Ref2); similarly for the Tropical Pacific (Ref3). Moreover, model analyses of surface meteorological parameters and their anomalies provide a climatology of the TOGA COARE Region (1985-1990)(Ref4). Specific attention is given to the IOP (4 month) climatology throughout.
The advantage of diurnal diagrams is that they efficiently highlight sea and land breeze patterns, surface pressure tidal signatures, and other localized patterns. In the tropics we expect that the dynamics will be dominated by meso-scale events, and thus will occur on shorter time scales than in the middle latitudes (Ref1). This atlas provides mean diurnal diagrams of wind speed and direction, air temperature, atmospheric pressure, specific humidity, and normalized specific humidity. The normalized specific humidity is a ratio of the specific humidity to the saturation specific humidity, reported in units of percent.
Fig.1: Land stations selected for this atlas.
2. Data
The data for these analyses were obtained from the Data Services Section of the National Center for Atmospheric Research (NCAR), and consist of data transmitted via the Global Telecommunications System (GTS) and the Integrated Sounding Systems (ISS) during the TOGA COARE IOP. All land station data were quality controlled by the Surface Meteorology Data Processing Center at the Florida State University, (hereafter referred to as COAREMET). The COAREMET quality control process contained two steps. Initially, an automated low-level scan determined coding errors, spurious spikes, instrument drift or failure, and unrealistic data. These data were then inspected visually, and an appropriate pass or fail flag was assigned. Second, comparisons between the data across platforms and instruments, were made and any discrepancies noted.
After quality control, the stations chosen for this analysis were based on two criteria. The first requires that the data record for the station have a minimum of 480 of the possible 960 three-hourly records. The value of 960 represents the count of three hourly data taken daily during the entire IOP. Further, the first criterion was applied to only those data which are considered good via FSU DPC quality-control. Only three of the sixteen possible quality-control flags are considered acceptable. Observations flagged as correct, containing an interesting feature, and/or those data that originally had unknown units, but which have since been determined by FSU DPC are all accepted for analysis.
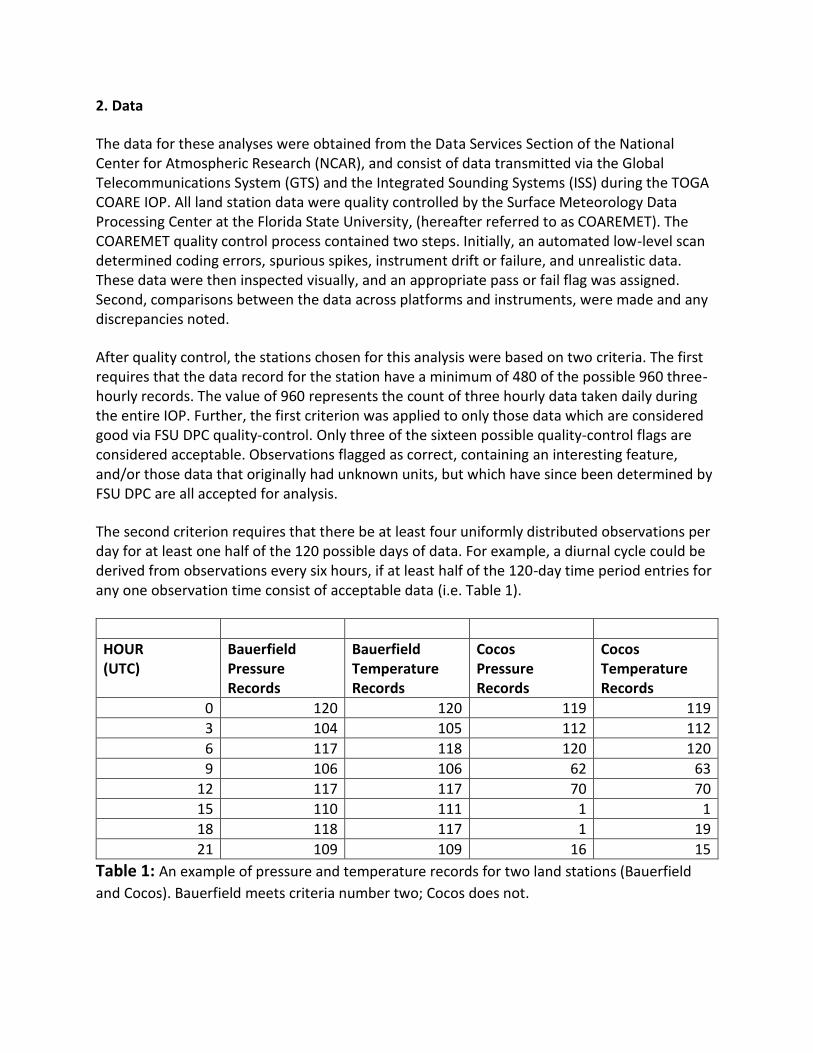
The second criterion requires that there be at least four uniformly distributed observations per day for at least one half of the 120 possible days of data. For example, a diurnal cycle could be derived from observations every six hours, if at least half of the 120-day time period entries for any one observation time consist of acceptable data (i.e. Table 1).
HOUR (UTC)
Bauerfield Pressure Records
Bauerfield Temperature Records
Cocos Pressure Records
Cocos Temperature Records
0 120 120 119 119
3 104 105 112 112
6 117 118 120 120
9 106 106 62 63
12 117 117 70 70
15 110 111 1 1
18 118 117 1 19
21 109 109 16 15
Table 1: An example of pressure and temperature records for two land stations (Bauerfield
and Cocos). Bauerfield meets criteria number two; Cocos does not.

The first criterion eliminated 39 (51%) of the original 79 land stations for which we had GTS or
ISS data. The second criterion eliminated three more stations, leaving 37 stations for the
analysis (Fig. 1).
Some stations were included that had special stipulations regarding the temperature, pressure,
specific humidity, and normalized specific humidity data. Misima, Soekarno-Hatta, and Taro
were analyzed at six hour intervals, beginning with 00UTC, since those were the only times
which met all the criteria. Funafuti, Momote, and Broome will be evaluated every three hours
except 15UTC (due to insufficient data at that observation time). Auki and Honiara will be
evaluated every six hours, except the 21UTC observation will be used in lieu of the less plentiful
18UTC observation. For both Oroluk and Mili, only the temperature and pressure diurnal cycles
will be analyzed, as not enough data remained for the other parameters.
The above criteria also applied to the wind data. As a result, Funafuti, Momote, and Misima
have insufficient wind observations at 15UTC, and thus are evaluated for the remaining three
hourly observation times only. Moreover, winds were not analyzed for Padang, Mili, Menado,
Madang, Taro, Auki, and Honiara due to a lack of wind data. Winds were not analyzed for
Munda, because these data did not meet criterion two.
For stations that reported calm winds, the wind direction was ignored, since a wind direction in
that case would have no meaning. Moreover, in the cases where no wind direction data
existed, the wind speeds were also ignored.
3. About The Atlas
Part I:
This atlas contains temperature, pressure, specific humidity, and normalized specific humidity
diurnal plots for those land stations which met all the required criteria. In each figure, the
diurnal cycles are displayed with solid lines and the dashed lines represent the standard error.
The diurnal cycles were produced by calculating averages of the data at each observation time
over the entire 120 days. Further, the standard error for each parameter was given by
se = s/ N (1)
where s is the standard deviation and N represents the number of observations at each
observation time. These were plotted as a range about the observed mean diurnal cycle, for the
temperature, pressure, specific humidity, and normalized specific humidity.
Part II:
This atlas also contains wind roses computed at each selected observation time hours (where
possible) which categorize each land station's wind direction and magnitude on a sixteen point
compass (Table 2). Following the meteorological convention, the compass orientation

represents the direction from which the wind is coming. A direction ratio was computed every
three hours. It is defined as the number of times the wind direction falls in a particular direction
range to the number of good observations for that observation time. The axes of the wind rose
represent these direction ratios in units of percent. The winds speeds are divided into nine
categories (Table 3). Each wind speed category corresponds to a different line thickness on the
wind rose.
CATEGORY RANGE(degrees) DIRECTION
1 348 to 12 N
2 12 to 33 NNE
3 33 to 56 NE
4 56 to 78 ENE
5 78 to 101 E
6 101 to 123 ESE
7 123 to 146 SE
8 146 to 168 SSE
9 168 to 191 S
10 191 ro 213 SSW
11 213 to 236 SW
12 236 to 258 WSW
13 258 to 281 W
14 281 to 303 WNW
15 303 to 326 NW
16 326 to 348 NNW
Table 2: Listed here are the sixteen wind direction categories, their corresponding ranges and
directions.
CATEGORY SPEED
1 1-2 knots
2 2-3 knots
3 3-4 knots
4 4-5 knots
5 5-6 knots
6 6-7 knots
7 7-10 knots
8 10-15knots
9 15+ knots
Table 3: Nine wind speed categories which correspond to wind rose magnitudes.
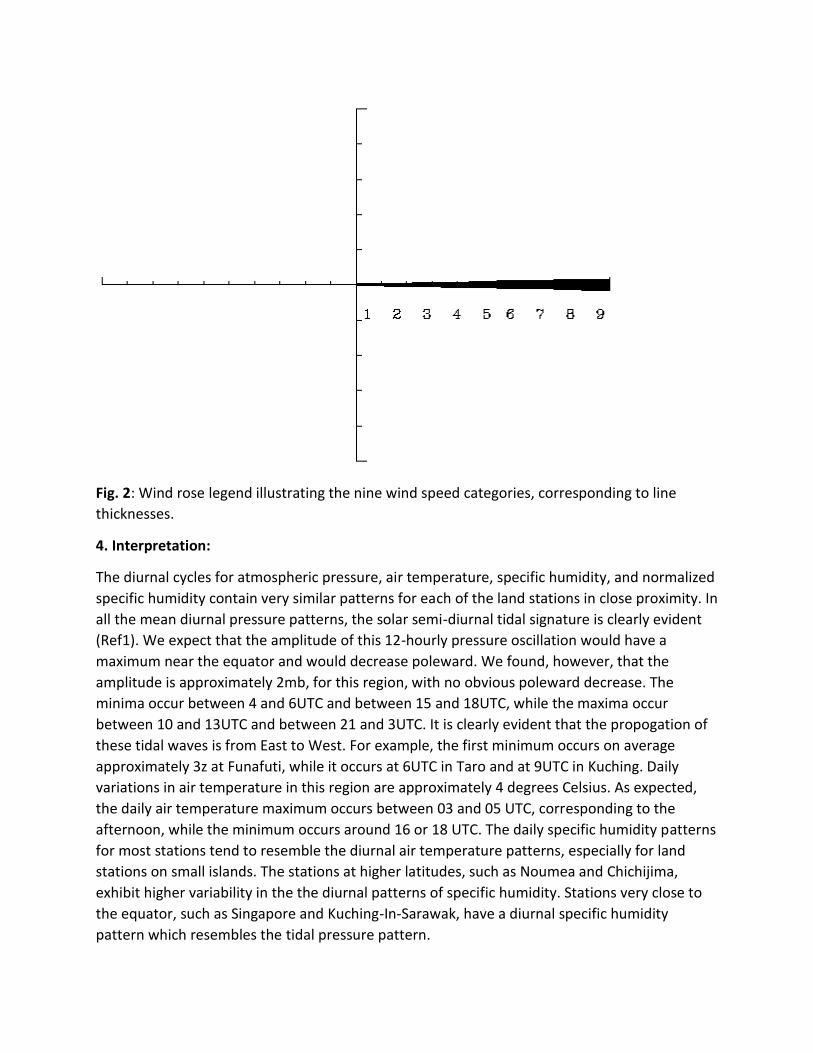
Fig. 2: Wind rose legend illustrating the nine wind speed categories, corresponding to line
thicknesses.
4. Interpretation:
The diurnal cycles for atmospheric pressure, air temperature, specific humidity, and normalized
specific humidity contain very similar patterns for each of the land stations in close proximity. In
all the mean diurnal pressure patterns, the solar semi-diurnal tidal signature is clearly evident
(Ref1). We expect that the amplitude of this 12-hourly pressure oscillation would have a
maximum near the equator and would decrease poleward. We found, however, that the
amplitude is approximately 2mb, for this region, with no obvious poleward decrease. The
minima occur between 4 and 6UTC and between 15 and 18UTC, while the maxima occur
between 10 and 13UTC and between 21 and 3UTC. It is clearly evident that the propogation of
these tidal waves is from East to West. For example, the first minimum occurs on average
approximately 3z at Funafuti, while it occurs at 6UTC in Taro and at 9UTC in Kuching. Daily
variations in air temperature in this region are approximately 4 degrees Celsius. As expected,
the daily air temperature maximum occurs between 03 and 05 UTC, corresponding to the
afternoon, while the minimum occurs around 16 or 18 UTC. The daily specific humidity patterns
for most stations tend to resemble the diurnal air temperature patterns, especially for land
stations on small islands. The stations at higher latitudes, such as Noumea and Chichijima,
exhibit higher variability in the the diurnal patterns of specific humidity. Stations very close to
the equator, such as Singapore and Kuching-In-Sarawak, have a diurnal specific humidity
pattern which resembles the tidal pressure pattern.

Upon comparison of the wind roses, the resulting mean winds appear to follow the long-term
climatological patterns, as illustrated in Stricherz, et. al. (Refncs 2,3). The land stations, such as
Oroluk and Legazpi which are located near ten degrees north of the equator, have prevailing NE
and E wind directions, which reflect the seasonal change in wind direction during the northern
hemisphere winter, associated with the southward migration of the ITCZ. In most cases, the
seasonal climatological signal tends to dominate the wind patterns leaving the occurrences of
diurnal wind variations indiscernible. This signal is characterized by light and variable winds
between 10N and 10S during November. Near 10N, there is a strengthening Northerly/
Northeasterly component through December, January, and February. This Northerly
component tends to dominate from the equator to 10N.
For some portions of the region surrounding TOGA COARE LSA latitudes higher than 10
degrees), the climatological winds are not as pronounced in magnitude and thus it is possible
that the flow regimes for these stations are dominated by localized topographic effects. Darwin
for example, has strong westerly onshore flow while any easterly flow is blocked, because it is
located on the windward side of the hilly Arnhem Land in Northern Australia. Gove; however, is
located further east than Darwin, and has more variable wind directions due to the effect of the
nearby hills and valleys.
5. Conclusion:
Analysis of climatological patterns that occur on time scales of a day can aid in our
understanding of the surface meteorology of the TOGA COARE region. This region exhibits a
tidal signature in the mean semi-diurnal atmospheric pressure pattern at most stations.
Further, the stations located on small islands show clear correlation with seasonal
climatological wind directions over the Pacific and Indian Oceans; however, they do not seem
to yield clear insight into strong diurnal wind variations such as sea and land breezes. The
diurnal specific humidity patterns were found to be affected by the pressure tidal pattern near
the equator and by the temperature pattern at higher latitudes.
6. REFERENCES
1.Climate Dynamics of the Tropics, Stefan Hastenrath, Kluwer Academic Publishers,1991.
2.Atlas of Florida State University Indian Ocean Winds for TOGA 1970-1985, James N.
Stricherz, David M. Legler, and James J. O'Brien, Florida State University, Mesoscale Air-Sea
Interaction Group Technical Report, Aug. 1993.
Atlas of Florida State University Tropical Pacific Winds for TOGA 1966- 1985, James N.
Stricherz, James J. O'Brien, and David M. Legler, Florida State University, Mesoscale Air-Sea
Interaction Group Technical Report, Aug., 1992.
4.Climatology of the TOGA - COARE and Adjacent Regions (1985-1990), Dayton G. Vincent and
Jon M. Schrage, Purdue University, Department of Earth and Atmospheric Sciences, Dec., 1995.

Station Auki (91507) diurnal changes
Station Bangkok (48455) 0,3,6,9 UTC Wind Roses

Station Bangkok (48455) 12,15,18,21 UTC Wind Roses
Station Bangkok (48455) diurnal changes

Station Bauerfield (91557) 0,3,6,9 UTC Wind Roses
Station Bauerfield (91557) 12,15,18,21 UTC Wind Roses
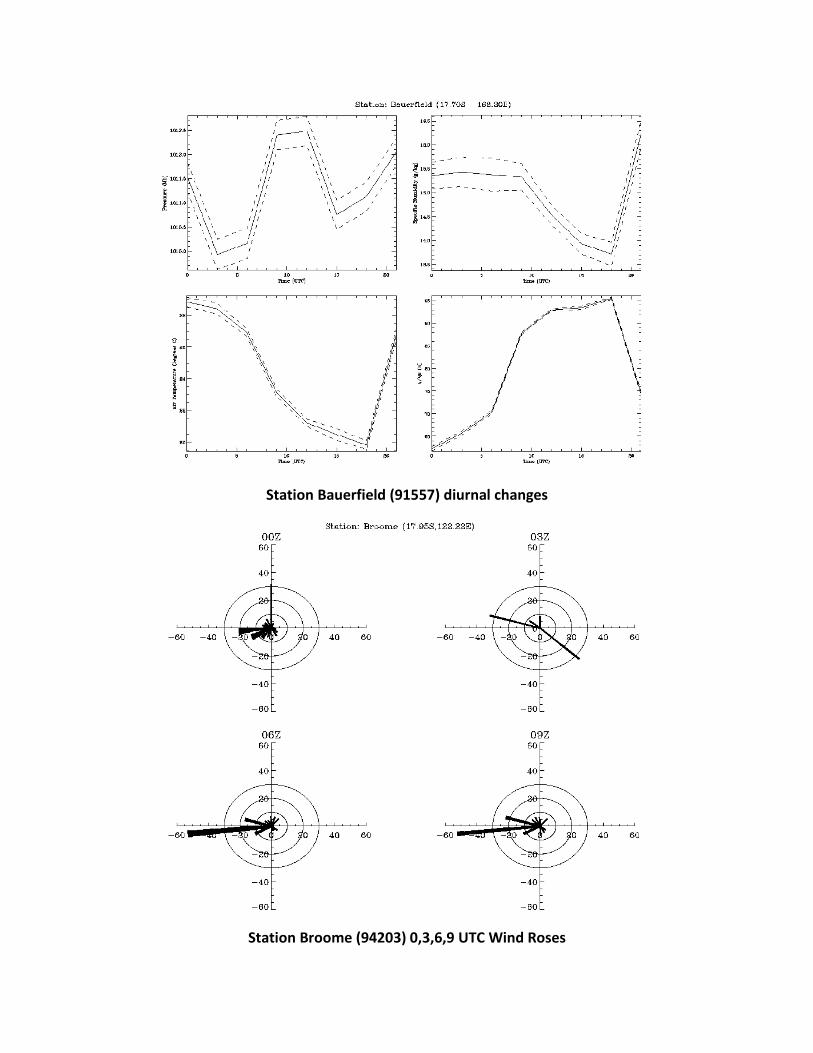
Station Bauerfield (91557) diurnal changes
Station Broome (94203) 0,3,6,9 UTC Wind Roses
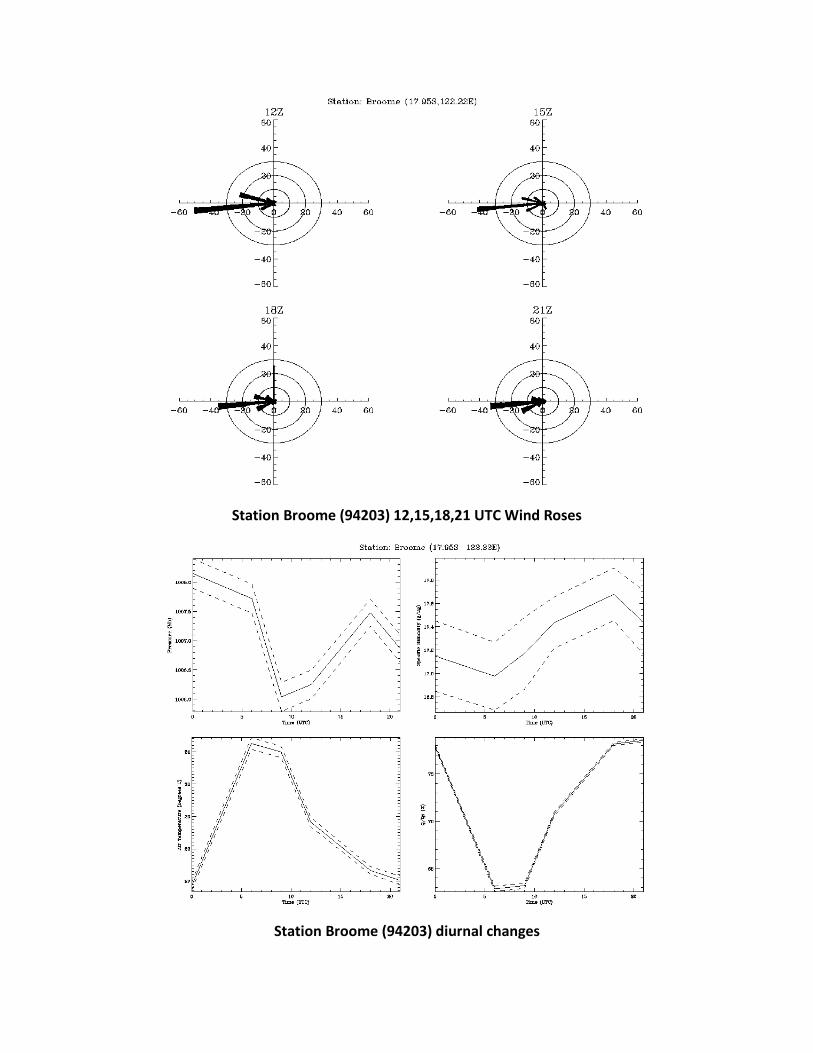
Station Broome (94203) 12,15,18,21 UTC Wind Roses
Station Broome (94203) diurnal changes

Station Chichijima (47971) 0,3,6,9 UTC Wind Roses
Station Chichijima (47971) 12,15,18,21 UTC Wind Roses

Station Chichijima (47971) diurnal changes
Station Darwin (94120) 0,3,6,9 UTC Wind Roses
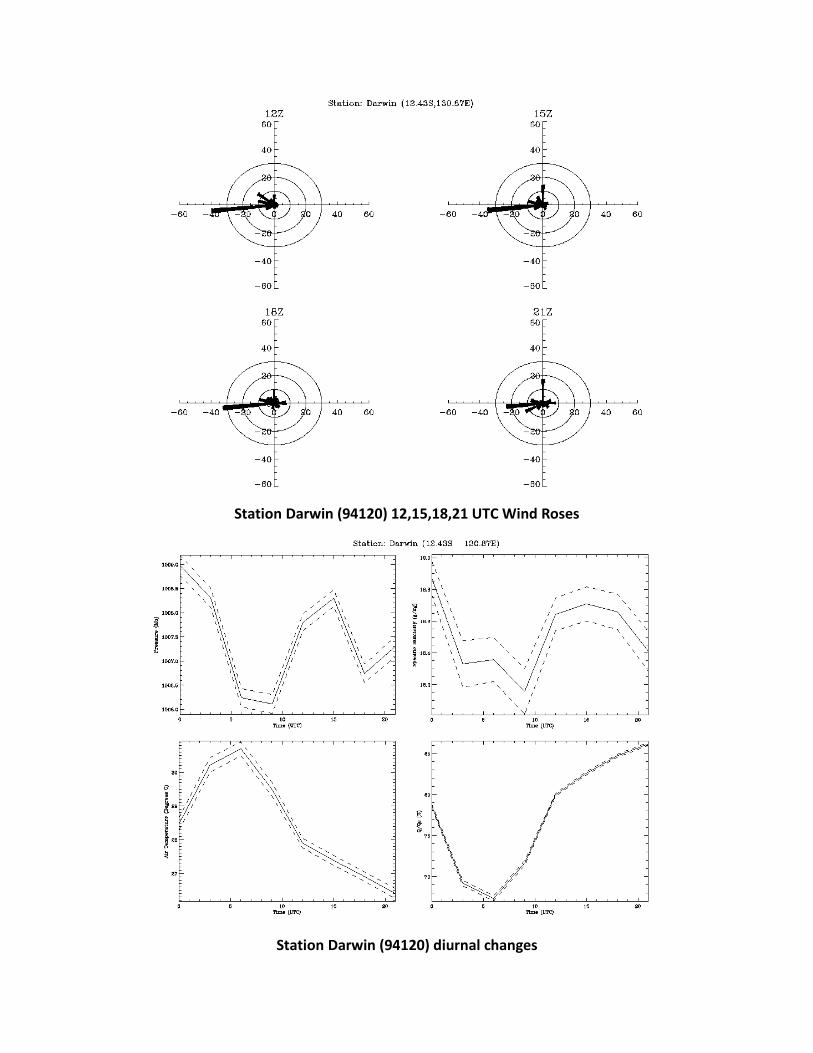
Station Darwin (94120) 12,15,18,21 UTC Wind Roses
Station Darwin (94120) diurnal changes

Station Davao (98753) 0,3,6,9 UTC Wind Roses
Station Davao (98753) 12,15,18,21 UTC Wind Roses

Station Davao (98753) diurnal changes

Station Funafuti (91643) 0,3,6,9 UTC Wind Roses
Station Funafuti (91643) 12,15,18,21 UTC Wind Roses

Station Funafuti (91643) diurnal changes

Station Gove (94150) 0,3,6,9 UTC Wind Roses
Station Gove (94150) 12,15,18,21 UTC Wind Roses

Station Gove (94150) diurnal changes

Station Henderson (91520) 0,3,6,9 UTC Wind Roses
Station Henderson (91520) 12,15,18,21 UTC Wind Roses
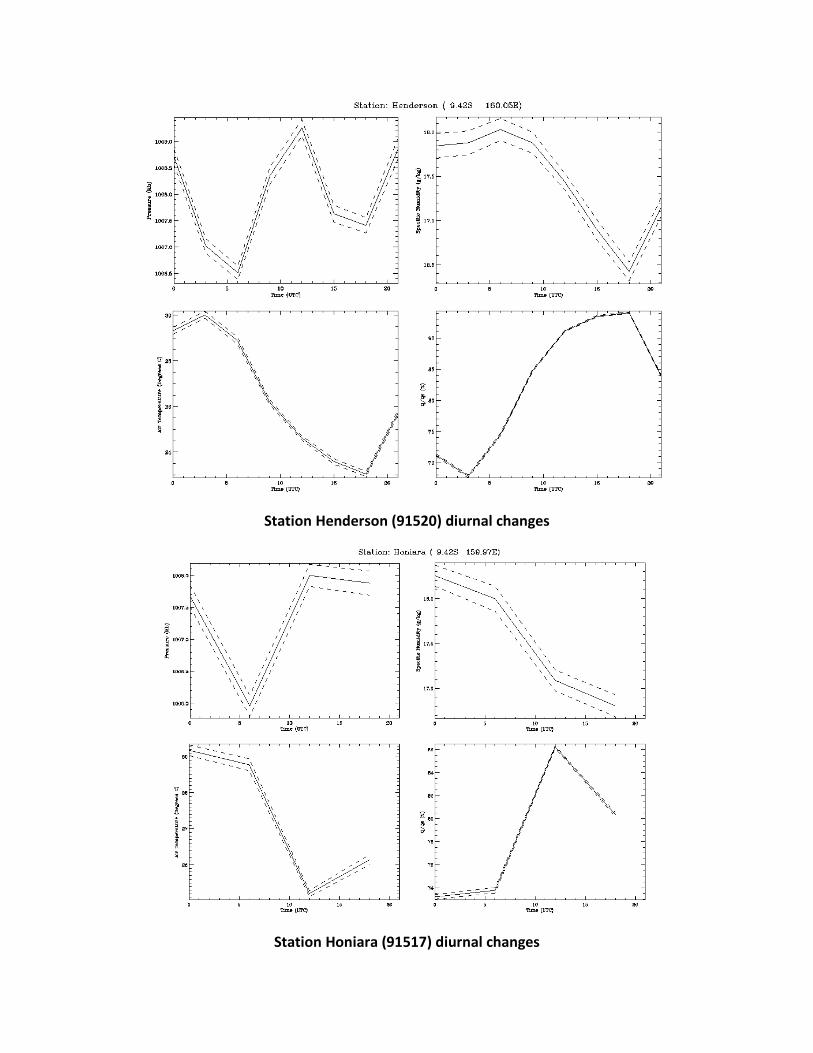
Station Henderson (91520) diurnal changes
Station Honiara (91517) diurnal changes

Station King’s Park (45004) 0,3,6,9 UTC Wind Roses
Station King’s Park (45004) 12,15,18,21 UTC Wind Roses

Station King’s Park (45004) diurnal changes
Station Kota Kinabalu (96471) 0,3,6,9 UTC Wind Roses

Station Kota Kinabalu (96471) 12,15,18,21 UTC Wind Roses
Station Kota Kinabalu (96471) diurnal changes

Station Kuching (96413) 0,3,6,9 UTC Wind Roses
Station Kuching (96413) 12,15,18,21 UTC Wind Roses

Station Kuching (96413) diurnal changes
Station Laoag (98223) 0,3,6,9 UTC Wind Roses

Station Laoag (98223) 12,15,18,21 UTC Wind Roses
Station Laoag (98223) diurnal changes

Station Legazpi (93444) 0,3,6,9 UTC Wind Roses
Station Legazpi (93444) 12,15,18,21 UTC Wind Roses

Station Legazpi (93444) diurnal changes
Station Mactan (98646) 0,3,6,9 UTC Wind Roses
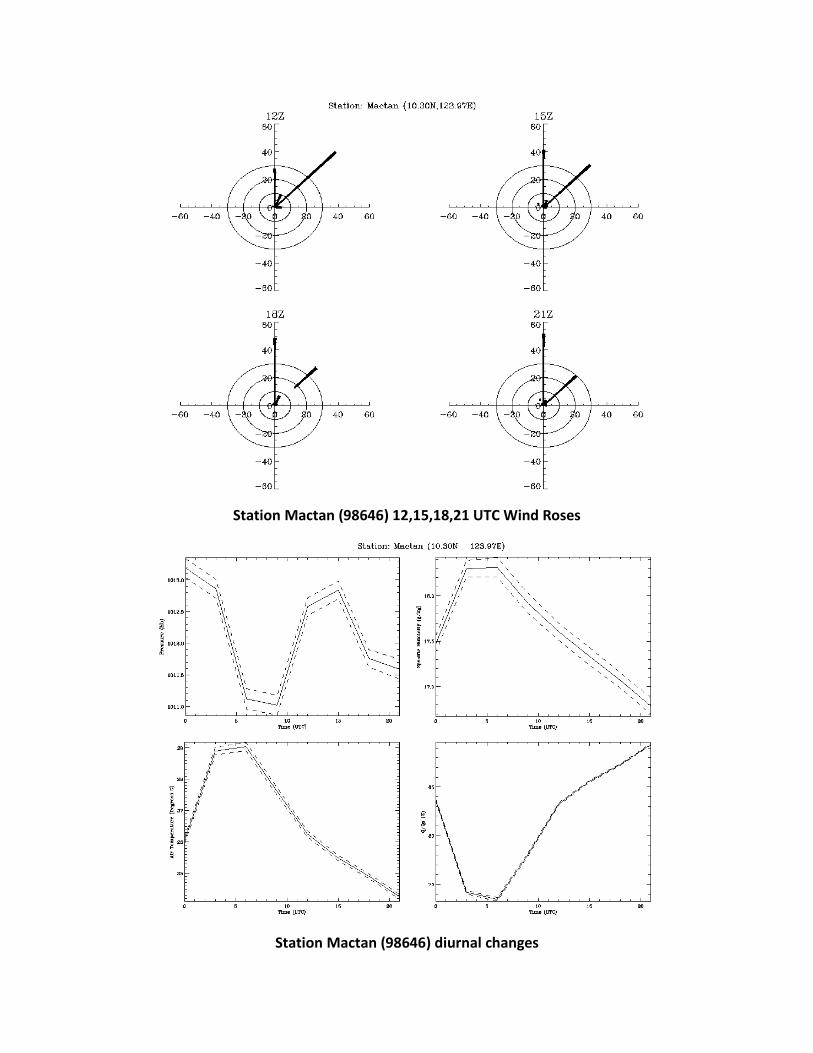
Station Mactan (98646) 12,15,18,21 UTC Wind Roses
Station Mactan (98646) diurnal changes

Station Madang (94014) diurnal changes
Station Madang (97014) 0,3,6,9 UTC Wind Roses

Station Madang (97014) 12,15,18,21 UTC Wind Roses
Station Menado (97014) diurnal changes

Station Mili (91377) diurnal changes
Station Misima (94087) 0,3,6,9 UTC Wind Roses

Station Misima (94087) 12,15,18,21 UTC Wind Roses
Station Misima (94087) diurnal changes

Station Momote (94044) 0,3,6,9 UTC Wind Roses
Station Momote (94044) 12,15,18,21 UTC Wind Roses

Station Momote (94044) diurnal changes
Station Munda (91503) diurnal changes

Station Naha (47936) 0,3,6,9 UTC Wind Roses
Station Naha (47936) 12,15,18,21 UTC Wind Roses
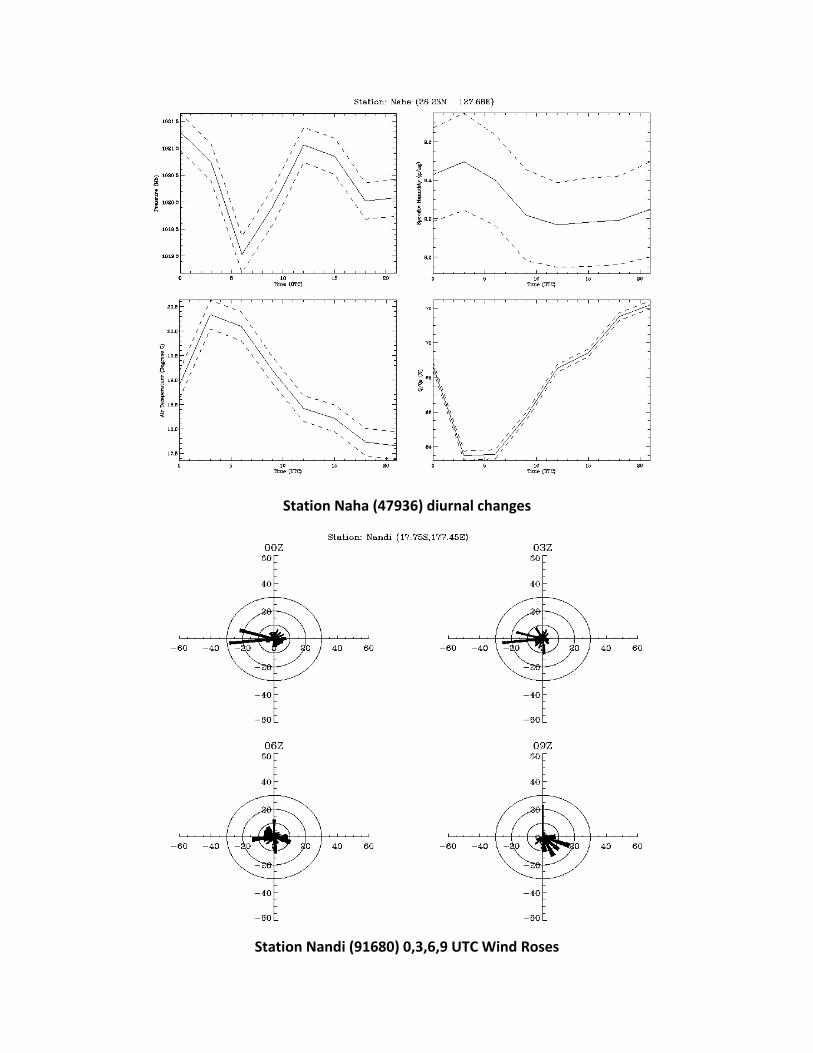
Station Naha (47936) diurnal changes
Station Nandi (91680) 0,3,6,9 UTC Wind Roses

Station Nandi (91680) 12,15,18,21 UTC Wind Roses
Station Nandi (91680) diurnal changes

Station Noumea (91592) 0,3,6,9 UTC Wind Roses
Station Noumea (91592) 12,15,18,21 UTC Wind Roses

Station Noumea (91592) diurnal changes
Station Oroluk (91343) 0,3,6,9 UTC Wind Roses

Station Oroluk (91343) 12,15,18,21 UTC Wind Roses
Station Oroluk (91343) diurnal changes

Station Padang diurnal changes
Station Singapore (48698) 0,3,6,9 UTC Wind Roses

Station Singapore (48698) 12,15,18,21 UTC Wind Roses
Station Singapore (48698) diurnal changes

Station Soekarno-Hatta (96749) 0,3,6,9 UTC Wind Roses
Station Soekarno-Hatta (96749) 12,15,18,21 UTC Wind Roses

Station Soekarno-Hatta (96749) diurnal changes
Station Tarawa (91610) 0,3,6,9 UTC Wind Roses

Station Tarawa (91610) 12,15,18,21 UTC Wind Roses
Station Tarawa (91610) diurnal changes

Station Taro (91502) 0,3,6,9 UTC Wind Roses
Station Taro (91502) 12,15,18,21 UTC Wind Roses

Station Taro (91502) diurnal changes
Station Townsville (94294) 0,3,6,9 UTC Wind Roses
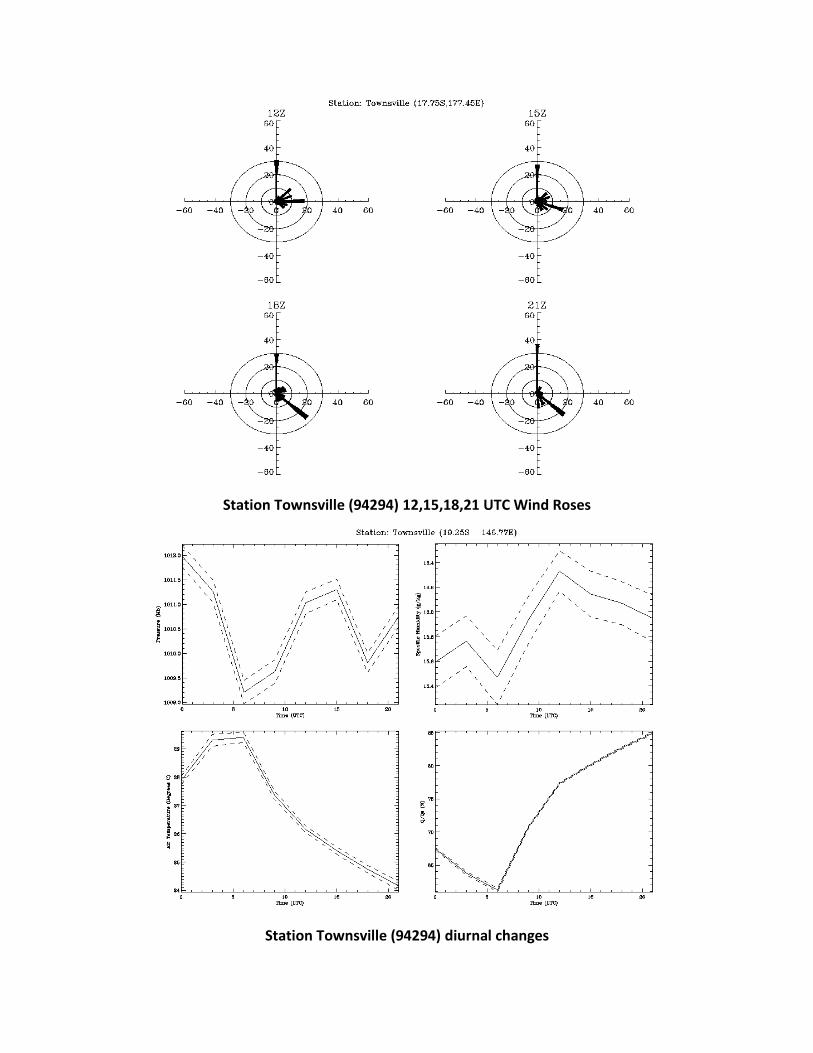
Station Townsville (94294) 12,15,18,21 UTC Wind Roses
Station Townsville (94294) diurnal changes

Station Willis (94299) 0,3,6,9 UTC Wind Roses
Station Willis (94299) 12,15,18,21 UTC Wind Roses

Station Willis (94299) diurnal changes
Station Xisha (59981) 0,3,6,9 UTC Wind Roses

Station Xisha (59981) 12,15,18,21 UTC Wind Roses
Station Xisha (59981) diurnal changes


![Diurnal and Nocturnal Animals. Diurnal Animals Diurnal is a tricky word! Let’s all say that word together. Diurnal [dahy-ur-nl] A diurnal animal is an](https://img.pdfslide.us/doc/110x75/56649dda5503460f94ad083f/diurnal-and-nocturnal-animals-diurnal-animals-diurnal-is-a-tricky-word-lets.jpg)


![TOGA - ftp.dot.state.tx.usftp.dot.state.tx.us/pub/txdot-info/brg/0212_webinar/retterer.pdf · Untitled - [Toga Plugin] Help Input Girder View KSI Analysis Span Length (CL Beatings)](https://img.pdfslide.us/doc/110x75/5f02443b7e708231d40368bc/toga-ftpdotstatetxusftpdotstatetxuspubtxdot-infobrg0212webinar-.jpg)