Embed Size (px)
DESCRIPTION
ME2151
Citation preview
2-1
C H A P T E R 2
M E C H A N I C A L P R O P E R T I E S
2.1 MECHANICAL PROPERTIES 2.1.1 Stress and Stra in
2.2 THE TENSILE TEST 2.2.1 E last ic Deformat ion 2.2.2 P last ic Deformat ion 2.2.3 Y ie ld Strength 2.2.4 Ul t imate Tens i le St rength 2.2.5 True Stress -True Stra in Curve 2.2.6 Duct i l i ty 2.2.7 (Tens i le) Toughness
2.3 HARDNESS AND HARDNESS TESTS
2-2
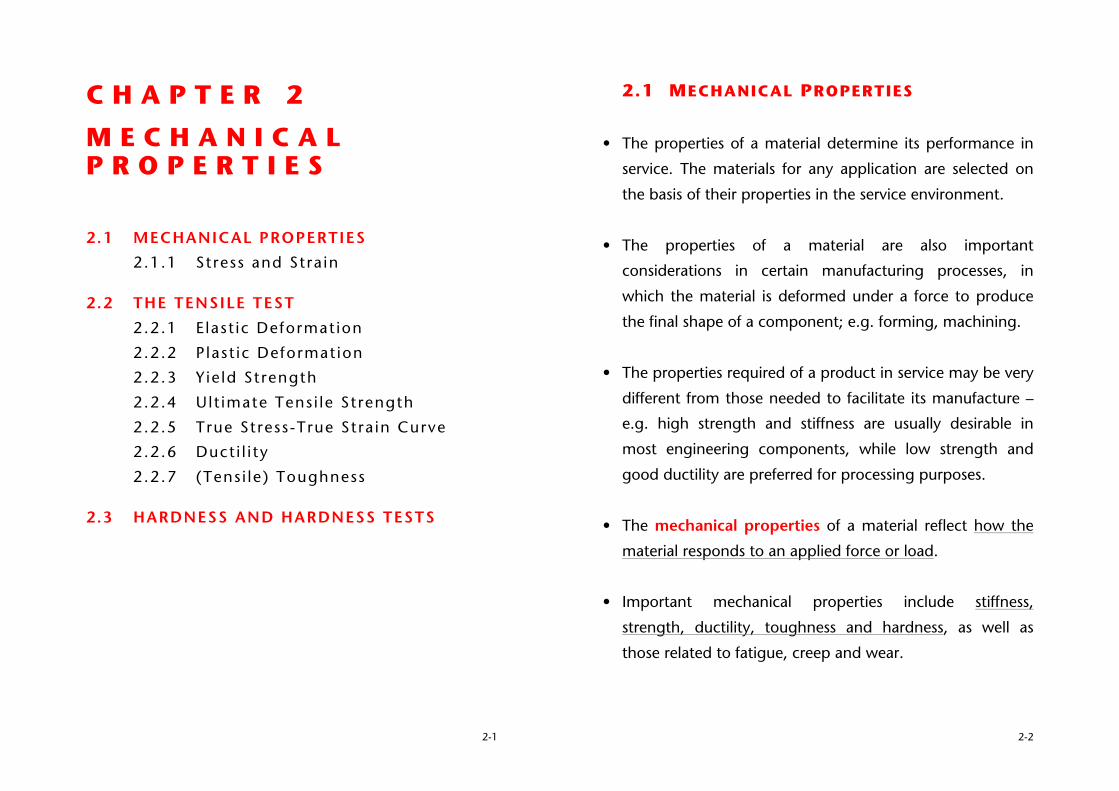
2.1 MECHANICAL PROPERTIES
• The properties of a material determine its performance in
service. The materials for any application are selected on
the basis of their properties in the service environment.
• The properties of a material are also important
considerations in certain manufacturing processes, in
which the material is deformed under a force to produce
the final shape of a component; e.g. forming, machining.
• The properties required of a product in service may be very
different from those needed to facilitate its manufacture –
e.g. high strength and stiffness are usually desirable in
most engineering components, while low strength and
good ductility are preferred for processing purposes.
• The mechanical properties of a material reflect how the
material responds to an applied force or load.
• Important mechanical properties include stiffness,
strength, ductility, toughness and hardness, as well as
those related to fatigue, creep and wear.
2-3
• Mechanical properties are dependent on the ambient
temperature and the rate at which the force is applied.
• The mechanical properties of materials are determined
through laboratory tests using standardized testing
techniques.
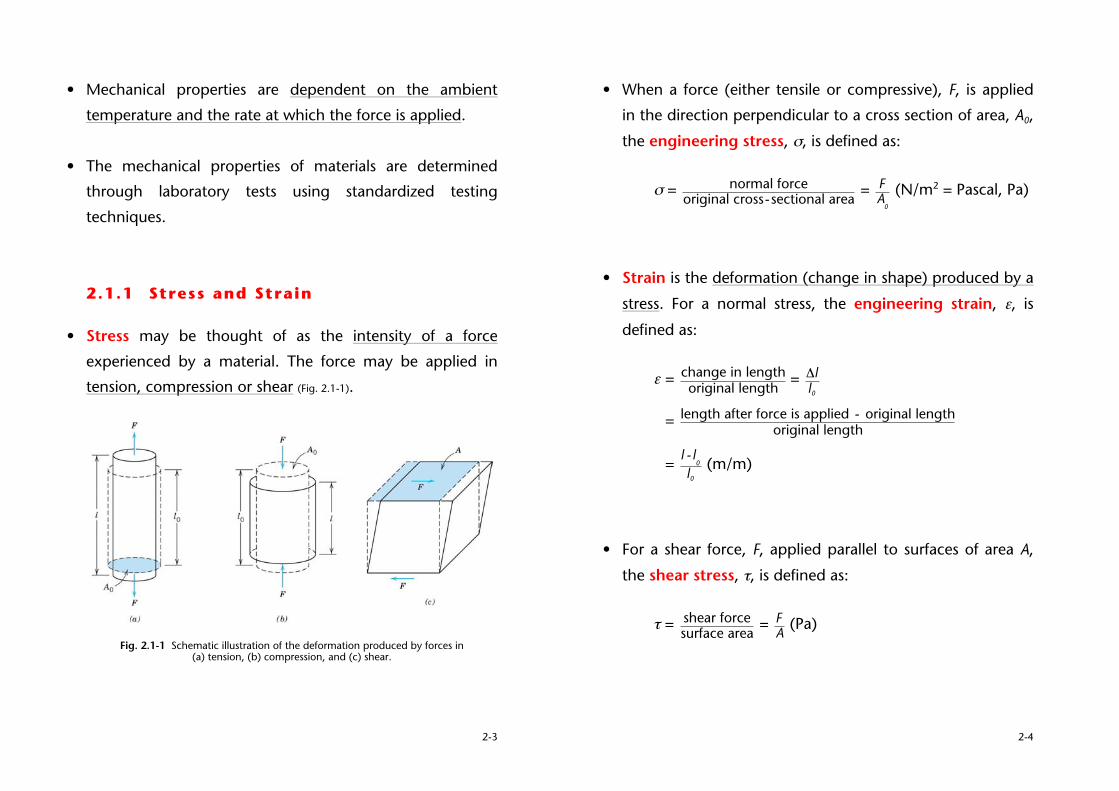
2.1.1 Stress and Strain
• Stress may be thought of as the intensity of a force
experienced by a material. The force may be applied in
tension, compression or shear (Fig. 2.1-1).
Fig. 2.1-1 Schematic illustration of the deformation produced by forces in (a) tension, (b) compression, and (c) shear.
2-4
• When a force (either tensile or compressive), F, is applied
in the direction perpendicular to a cross section of area, A0,
the engineering stress, !, is defined as:
! =
!
normal forceoriginal cross-sectional area
=
!
FA
0
(N/m2 = Pascal, Pa)
• Strain is the deformation (change in shape) produced by a
stress. For a normal stress, the engineering strain, ", is
defined as:
" =
!
change in lengthoriginal length
=
!
"ll0
=
!
length after force is applied - original lengthoriginal length
=
!
l - l0
l0 (m/m)
• For a shear force, F, applied parallel to surfaces of area A,
the shear stress, #, is defined as:
# =
!
shear forcesurface area =
!
FA (Pa)
2-5
2.2 THE TENSILE TEST
• The tensile test is commonly used to determine several
important mechanical properties of metals and polymers.
[Note: different tests are used for ceramics.] It measures how a material
responds to a static or slowly applied force.
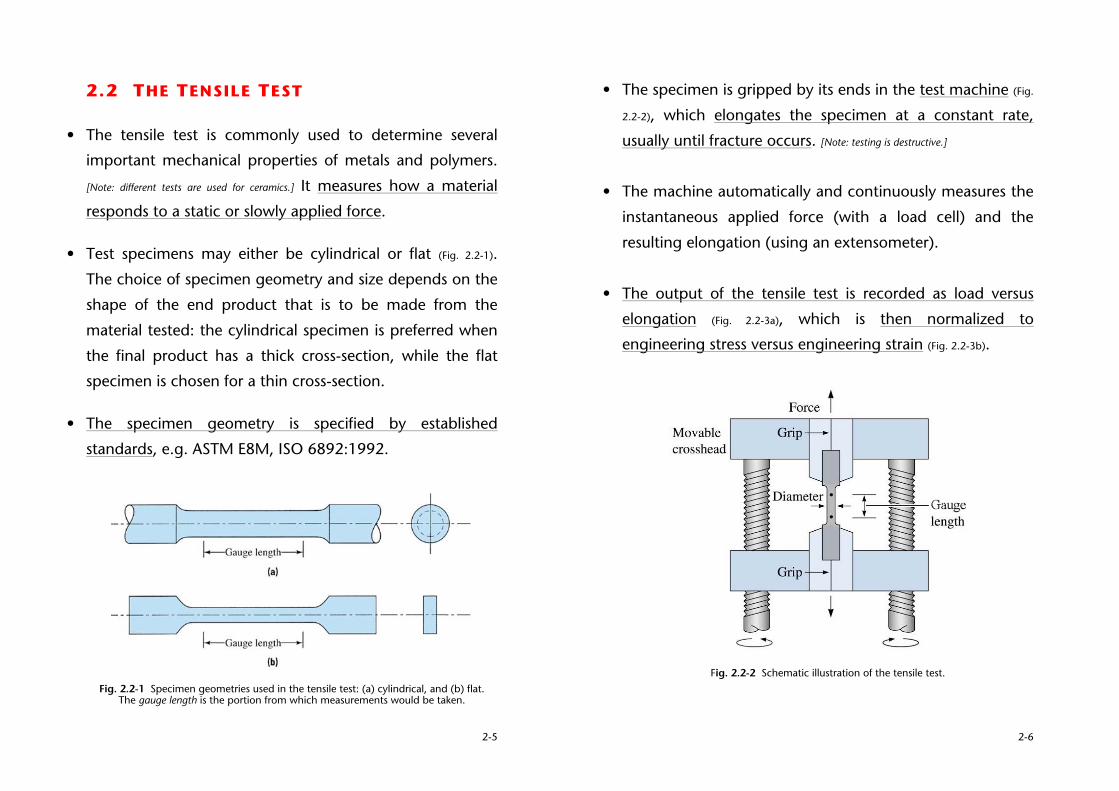
• Test specimens may either be cylindrical or flat (Fig. 2.2-1).
The choice of specimen geometry and size depends on the
shape of the end product that is to be made from the
material tested: the cylindrical specimen is preferred when
the final product has a thick cross-section, while the flat
specimen is chosen for a thin cross-section.
• The specimen geometry is specified by established
standards, e.g. ASTM E8M, ISO 6892:1992.
Fig. 2.2-1 Specimen geometries used in the tensile test: (a) cylindrical, and (b) flat. The gauge length is the portion from which measurements would be taken.
2-6
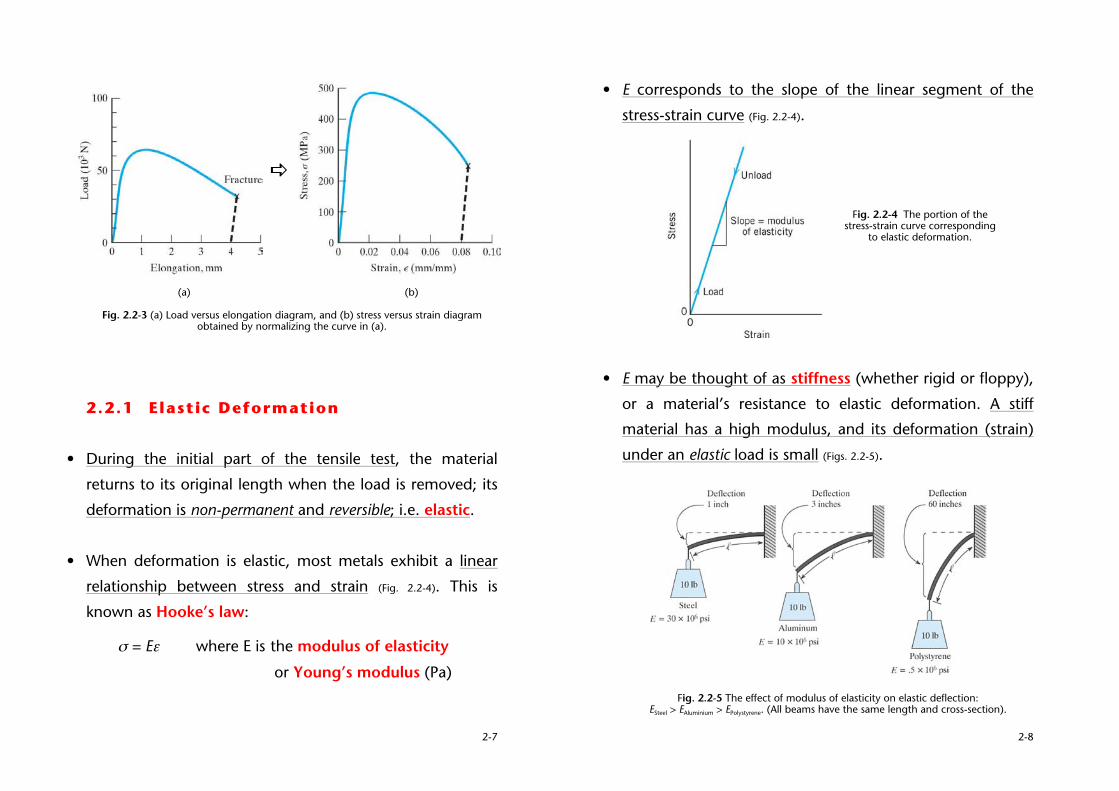
• The specimen is gripped by its ends in the test machine (Fig.
2.2-2), which elongates the specimen at a constant rate,
usually until fracture occurs. [Note: testing is destructive.]
• The machine automatically and continuously measures the
instantaneous applied force (with a load cell) and the
resulting elongation (using an extensometer).
• The output of the tensile test is recorded as load versus
elongation (Fig. 2.2-3a), which is then normalized to
engineering stress versus engineering strain (Fig. 2.2-3b).
Fig. 2.2-2 Schematic illustration of the tensile test.
2-7
!
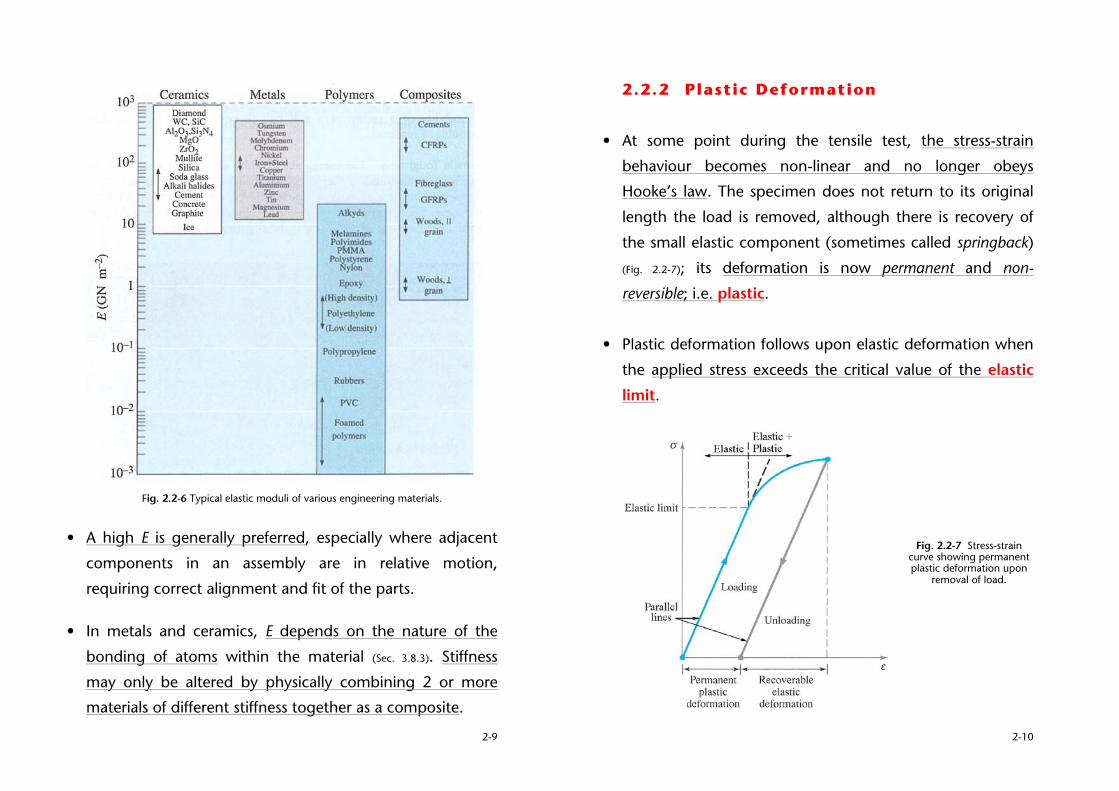
(a) (b)
Fig. 2.2-3 (a) Load versus elongation diagram, and (b) stress versus strain diagram obtained by normalizing the curve in (a).
2.2.1 Elastic Deformation
• During the initial part of the tensile test, the material
returns to its original length when the load is removed; its
deformation is non-permanent and reversible; i.e. elastic.
• When deformation is elastic, most metals exhibit a linear
relationship between stress and strain (Fig. 2.2-4). This is
known as Hooke’s law:
! = E" where E is the modulus of elasticity
or Young’s modulus (Pa)
2-8
• E corresponds to the slope of the linear segment of the
stress-strain curve (Fig. 2.2-4).
Fig. 2.2-4 The portion of the
stress-strain curve corresponding to elastic deformation.
• E may be thought of as stiffness (whether rigid or floppy),
or a material’s resistance to elastic deformation. A stiff
material has a high modulus, and its deformation (strain)
under an elastic load is small (Figs. 2.2-5).
Fig. 2.2-5 The effect of modulus of elasticity on elastic deflection: ESteel > EAluminium > EPolystyrene. (All beams have the same length and cross-section).
2-9
Fig. 2.2-6 Typical elastic moduli of various engineering materials.
• A high E is generally preferred, especially where adjacent
components in an assembly are in relative motion,
requiring correct alignment and fit of the parts.
• In metals and ceramics, E depends on the nature of the
bonding of atoms within the material (Sec. 3.8.3). Stiffness
may only be altered by physically combining 2 or more
materials of different stiffness together as a composite.
2-10
2.2.2 Plastic Deformation
• At some point during the tensile test, the stress-strain
behaviour becomes non-linear and no longer obeys
Hooke’s law. The specimen does not return to its original
length the load is removed, although there is recovery of
the small elastic component (sometimes called springback)
(Fig. 2.2-7); its deformation is now permanent and non-
reversible; i.e. plastic.
• Plastic deformation follows upon elastic deformation when
the applied stress exceeds the critical value of the elastic
limit.
Fig. 2.2-7 Stress-strain curve showing permanent plastic deformation upon
removal of load.
2-11
2.2.3 Yield Strength
• The point at which plastic deformation begins is known as
yielding, which is close to the initial departure of the
stress-strain curve from linearity.
• In most materials, the transition from elastic to plastic
deformation is gradual, making it difficult to determine the
yield point precisely.
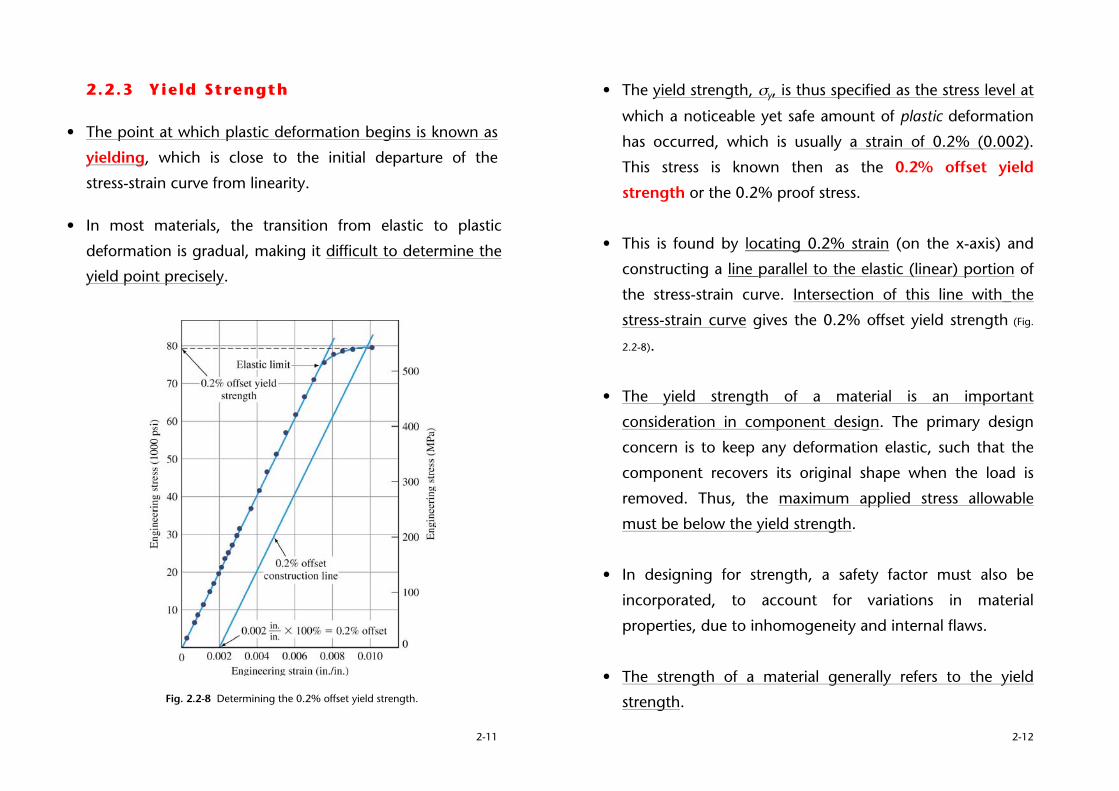
Fig. 2.2-8 Determining the 0.2% offset yield strength.
2-12
• The yield strength, !y, is thus specified as the stress level at
which a noticeable yet safe amount of plastic deformation
has occurred, which is usually a strain of 0.2% (0.002).
This stress is known then as the 0.2% offset yield
strength or the 0.2% proof stress.
• This is found by locating 0.2% strain (on the x-axis) and
constructing a line parallel to the elastic (linear) portion of
the stress-strain curve. Intersection of this line with the
stress-strain curve gives the 0.2% offset yield strength (Fig.
2.2-8).
• The yield strength of a material is an important
consideration in component design. The primary design
concern is to keep any deformation elastic, such that the
component recovers its original shape when the load is
removed. Thus, the maximum applied stress allowable
must be below the yield strength.
• In designing for strength, a safety factor must also be
incorporated, to account for variations in material
properties, due to inhomogeneity and internal flaws.
• The strength of a material generally refers to the yield
strength.
2-13
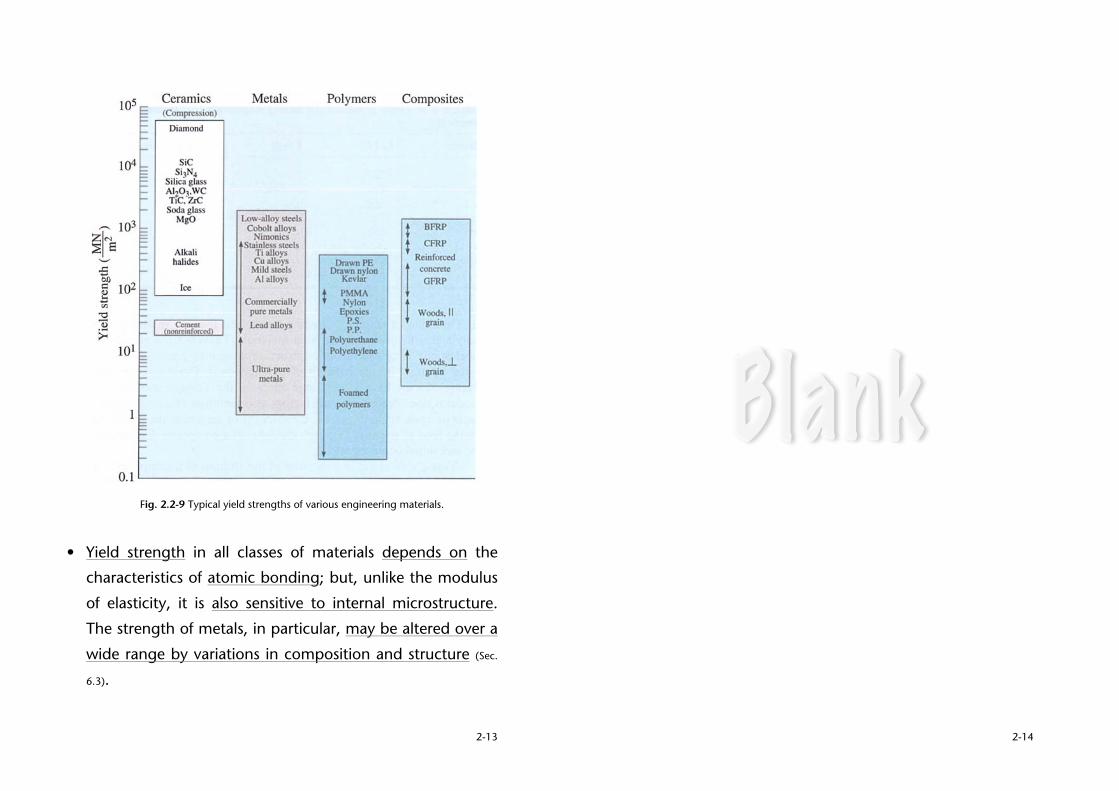
Fig. 2.2-9 Typical yield strengths of various engineering materials.
• Yield strength in all classes of materials depends on the
characteristics of atomic bonding; but, unlike the modulus
of elasticity, it is also sensitive to internal microstructure.
The strength of metals, in particular, may be altered over a
wide range by variations in composition and structure (Sec.
6.3).
2-14
2-15
2.2.4 Ultimate Tensile Strength
• The ultimate tensile strength (UTS), or simply, tensile
strength (TS), is the maximum stress on the stress-strain
curve (Fig. 2.2-10); it represents the highest stress a material is
able to withstand before necking.
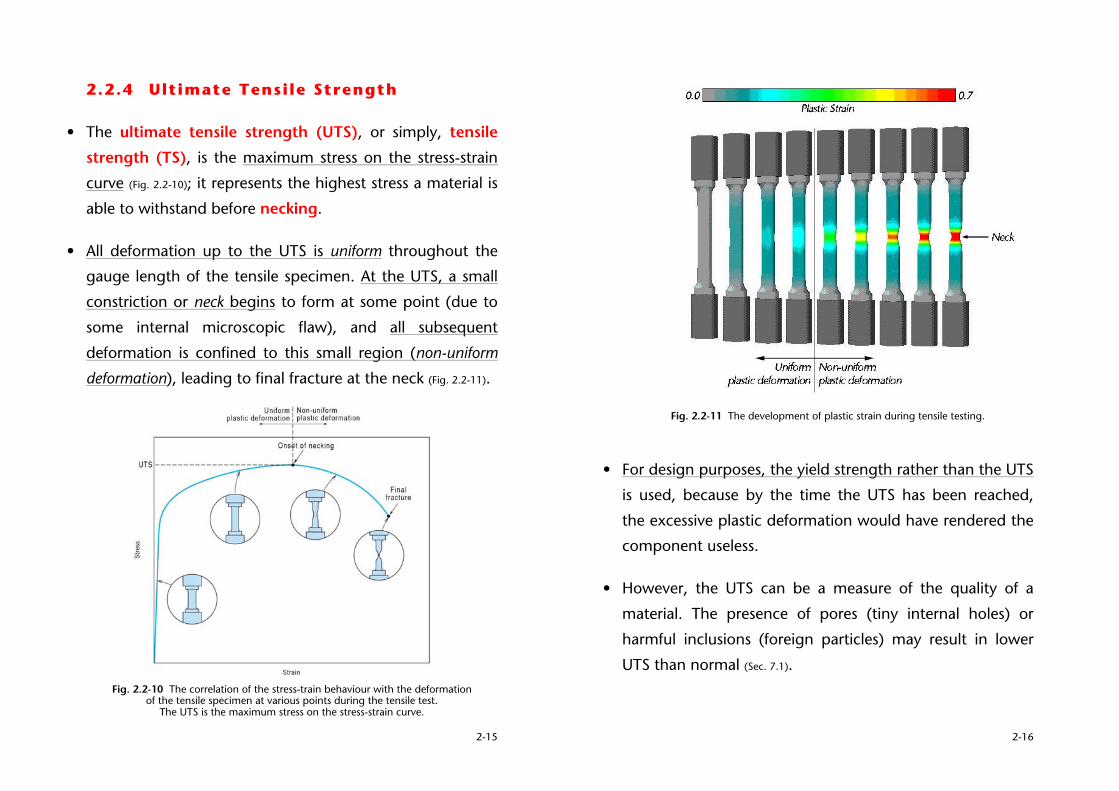
• All deformation up to the UTS is uniform throughout the
gauge length of the tensile specimen. At the UTS, a small
constriction or neck begins to form at some point (due to
some internal microscopic flaw), and all subsequent
deformation is confined to this small region (non-uniform
deformation), leading to final fracture at the neck (Fig. 2.2-11).
Fig. 2.2-10 The correlation of the stress-train behaviour with the deformation
of the tensile specimen at various points during the tensile test. The UTS is the maximum stress on the stress-strain curve.
2-16
Fig. 2.2-11 The development of plastic strain during tensile testing.
• For design purposes, the yield strength rather than the UTS
is used, because by the time the UTS has been reached,
the excessive plastic deformation would have rendered the
component useless.
• However, the UTS can be a measure of the quality of a
material. The presence of pores (tiny internal holes) or
harmful inclusions (foreign particles) may result in lower
UTS than normal (Sec. 7.1).
2-17
2.2.5 True Stress-True Strain Curve
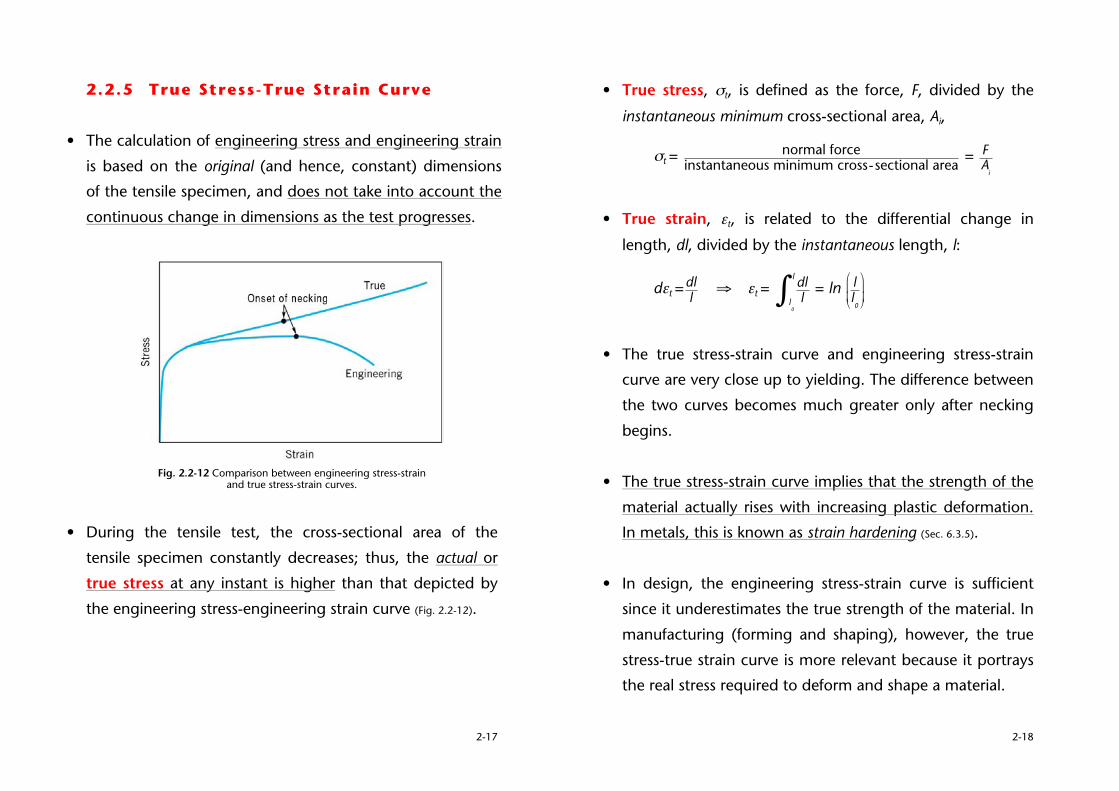
• The calculation of engineering stress and engineering strain
is based on the original (and hence, constant) dimensions
of the tensile specimen, and does not take into account the
continuous change in dimensions as the test progresses.
Fig. 2.2-12 Comparison between engineering stress-strain
and true stress-strain curves.
• During the tensile test, the cross-sectional area of the
tensile specimen constantly decreases; thus, the actual or
true stress at any instant is higher than that depicted by
the engineering stress-engineering strain curve (Fig. 2.2-12).
2-18
• True stress, !t, is defined as the force, F, divided by the
instantaneous minimum cross-sectional area, Ai,
!t =
!
normal forceinstantaneous minimum cross-sectional area =
!
FA
i
• True strain, "t, is related to the differential change in
length, dl, divided by the instantaneous length, l:
d"t =
!
dll ! "t =
!
dlll
0
l
" = ln
!
ll0
"
#
$ $
%
&
' '
• The true stress-strain curve and engineering stress-strain
curve are very close up to yielding. The difference between
the two curves becomes much greater only after necking
begins.
• The true stress-strain curve implies that the strength of the
material actually rises with increasing plastic deformation.
In metals, this is known as strain hardening (Sec. 6.3.5).
• In design, the engineering stress-strain curve is sufficient
since it underestimates the true strength of the material. In
manufacturing (forming and shaping), however, the true
stress-true strain curve is more relevant because it portrays
the real stress required to deform and shape a material.
2-19
2.2.6 Ducti l ity
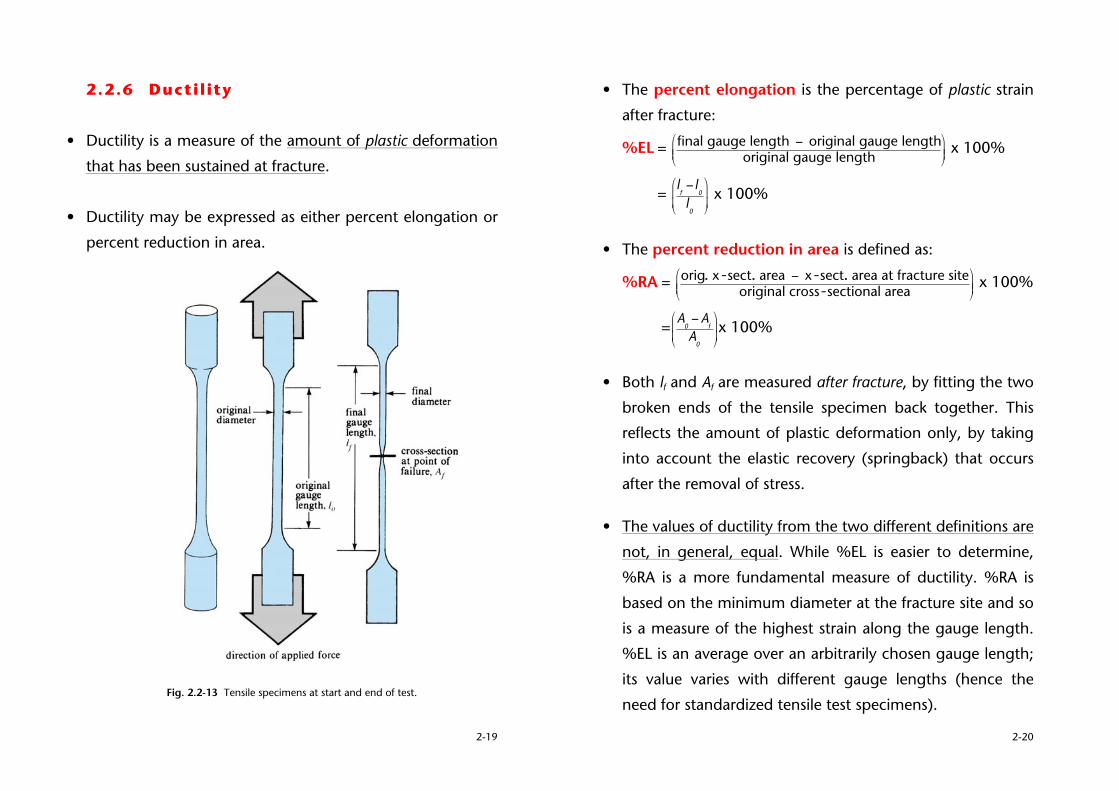
• Ductility is a measure of the amount of plastic deformation
that has been sustained at fracture.
• Ductility may be expressed as either percent elongation or
percent reduction in area.
Fig. 2.2-13 Tensile specimens at start and end of test.
2-20
• The percent elongation is the percentage of plastic strain
after fracture:
%EL =
!
final gauge length " original gauge lengthoriginal gauge length
#
$ % %
&
' ( ( x 100%
=
!
lf" l
0
l0
#
$
% %
&
'
( ( x 100%
• The percent reduction in area is defined as:
%RA =
!
orig. x -sect. area " x -sect. area at fracture siteoriginal cross-sectional area
#
$ % %
&
' ( ( x 100%
=
!
A0"A
f
A0
#
$
% %
&
'
( ( x 100%
• Both lf and Af are measured after fracture, by fitting the two
broken ends of the tensile specimen back together. This
reflects the amount of plastic deformation only, by taking
into account the elastic recovery (springback) that occurs
after the removal of stress.
• The values of ductility from the two different definitions are
not, in general, equal. While %EL is easier to determine,
%RA is a more fundamental measure of ductility. %RA is
based on the minimum diameter at the fracture site and so
is a measure of the highest strain along the gauge length.
%EL is an average over an arbitrarily chosen gauge length;
its value varies with different gauge lengths (hence the
need for standardized tensile test specimens).
2-21
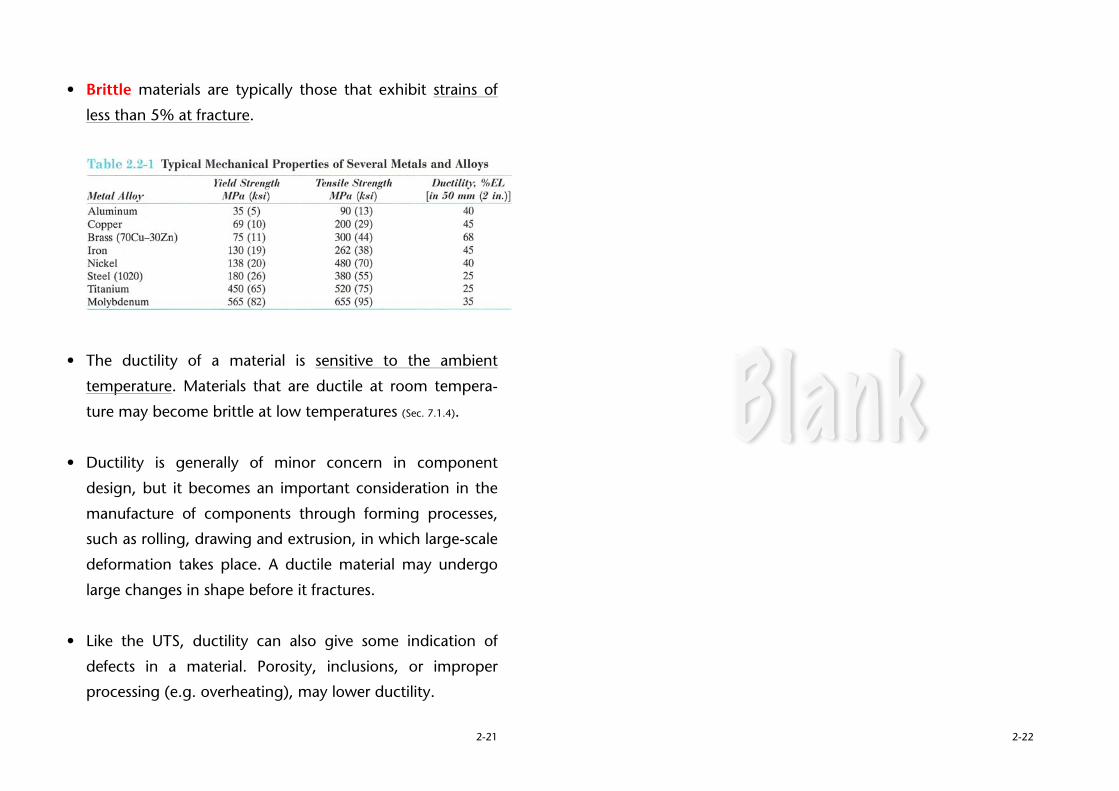
• Brittle materials are typically those that exhibit strains of
less than 5% at fracture.
• The ductility of a material is sensitive to the ambient
temperature. Materials that are ductile at room tempera-
ture may become brittle at low temperatures (Sec. 7.1.4).
• Ductility is generally of minor concern in component
design, but it becomes an important consideration in the
manufacture of components through forming processes,
such as rolling, drawing and extrusion, in which large-scale
deformation takes place. A ductile material may undergo
large changes in shape before it fractures.
• Like the UTS, ductility can also give some indication of
defects in a material. Porosity, inclusions, or improper
processing (e.g. overheating), may lower ductility.
2-22
2-23
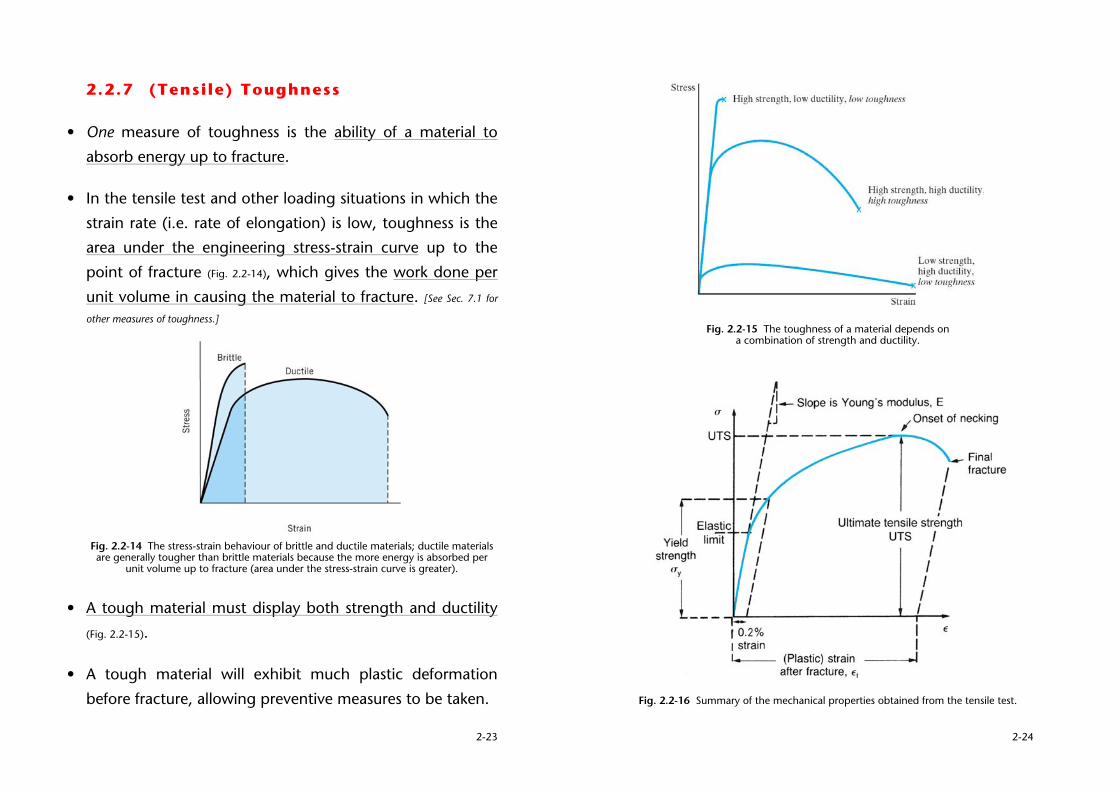
2.2.7 (Tensile) Toughness
• One measure of toughness is the ability of a material to
absorb energy up to fracture.
• In the tensile test and other loading situations in which the strain rate (i.e. rate of elongation) is low, toughness is the area under the engineering stress-strain curve up to the point of fracture (Fig. 2.2-14), which gives the work done per unit volume in causing the material to fracture. [See Sec. 7.1 for
other measures of toughness.]
Fig. 2.2-14 The stress-strain behaviour of brittle and ductile materials; ductile materials are generally tougher than brittle materials because the more energy is absorbed per
unit volume up to fracture (area under the stress-strain curve is greater).
• A tough material must display both strength and ductility (Fig. 2.2-15).
• A tough material will exhibit much plastic deformation before fracture, allowing preventive measures to be taken.
2-24
Fig. 2.2-15 The toughness of a material depends on a combination of strength and ductility.
Fig. 2.2-16 Summary of the mechanical properties obtained from the tensile test.
2-25
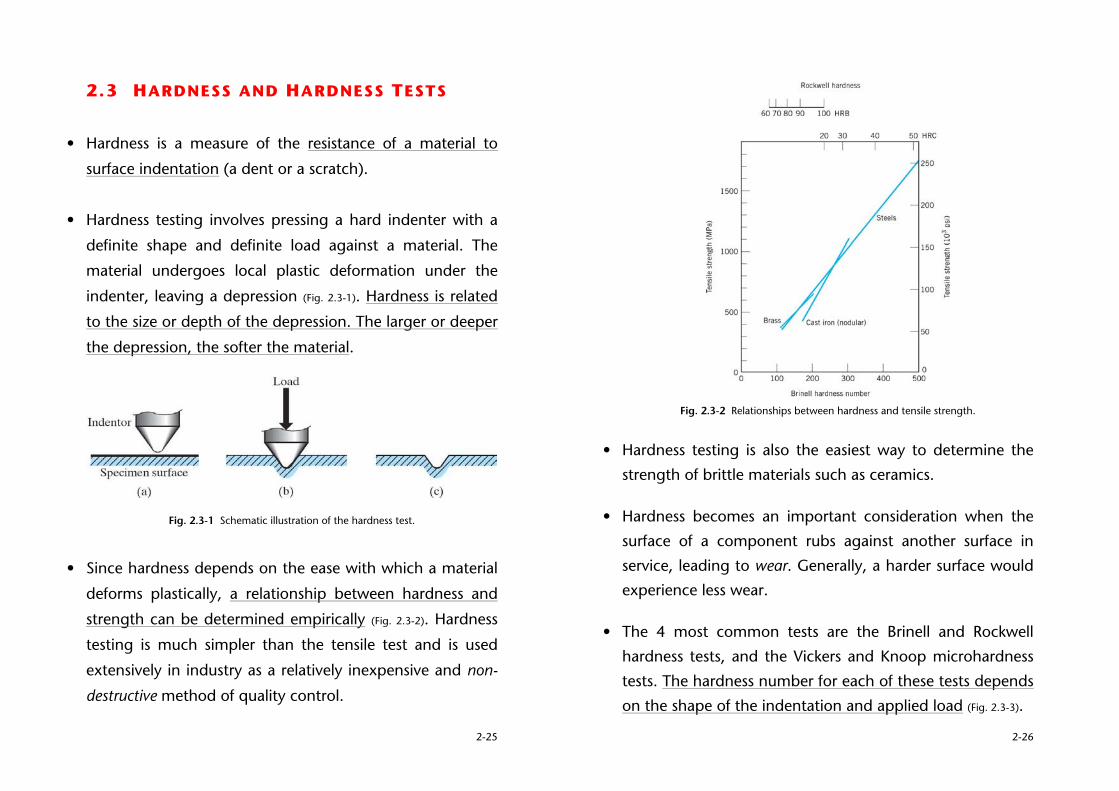
2.3 HARDNESS AND HARDNESS TESTS
• Hardness is a measure of the resistance of a material to
surface indentation (a dent or a scratch).
• Hardness testing involves pressing a hard indenter with a
definite shape and definite load against a material. The
material undergoes local plastic deformation under the
indenter, leaving a depression (Fig. 2.3-1). Hardness is related
to the size or depth of the depression. The larger or deeper
the depression, the softer the material.
Fig. 2.3-1 Schematic illustration of the hardness test.
• Since hardness depends on the ease with which a material
deforms plastically, a relationship between hardness and
strength can be determined empirically (Fig. 2.3-2). Hardness
testing is much simpler than the tensile test and is used
extensively in industry as a relatively inexpensive and non-
destructive method of quality control.
2-26
Fig. 2.3-2 Relationships between hardness and tensile strength.
• Hardness testing is also the easiest way to determine the strength of brittle materials such as ceramics.
• Hardness becomes an important consideration when the surface of a component rubs against another surface in service, leading to wear. Generally, a harder surface would experience less wear.
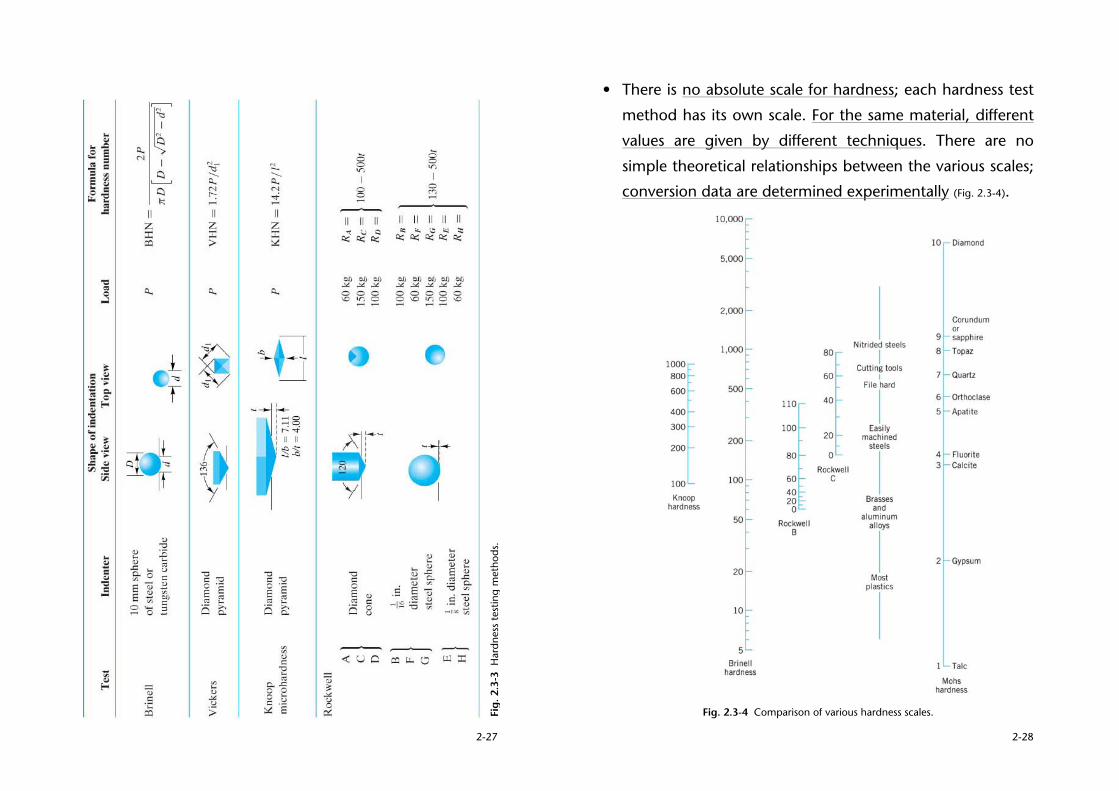
• The 4 most common tests are the Brinell and Rockwell hardness tests, and the Vickers and Knoop microhardness tests. The hardness number for each of these tests depends on the shape of the indentation and applied load (Fig. 2.3-3).
2-27
Fig.
2.3
-3 H
ardn
ess
test
ing
met
hods
.
2-28
• There is no absolute scale for hardness; each hardness test
method has its own scale. For the same material, different
values are given by different techniques. There are no
simple theoretical relationships between the various scales;
conversion data are determined experimentally (Fig. 2.3-4).
Fig. 2.3-4 Comparison of various hardness scales.


![Cn Chp2 [Compatibility Mode]](https://img.pdfslide.us/doc/110x75/577d37761a28ab3a6b95c17c/cn-chp2-compatibility-mode.jpg)