Embed Size (px)
Citation preview
ME101/L – Introduction to Mechanical Engineering
Department of Mechanical Engineering
California State University, Northridge
Project Packet
Prepared by
Dr. Nhut Ho & ME101 Lab Mentors
1
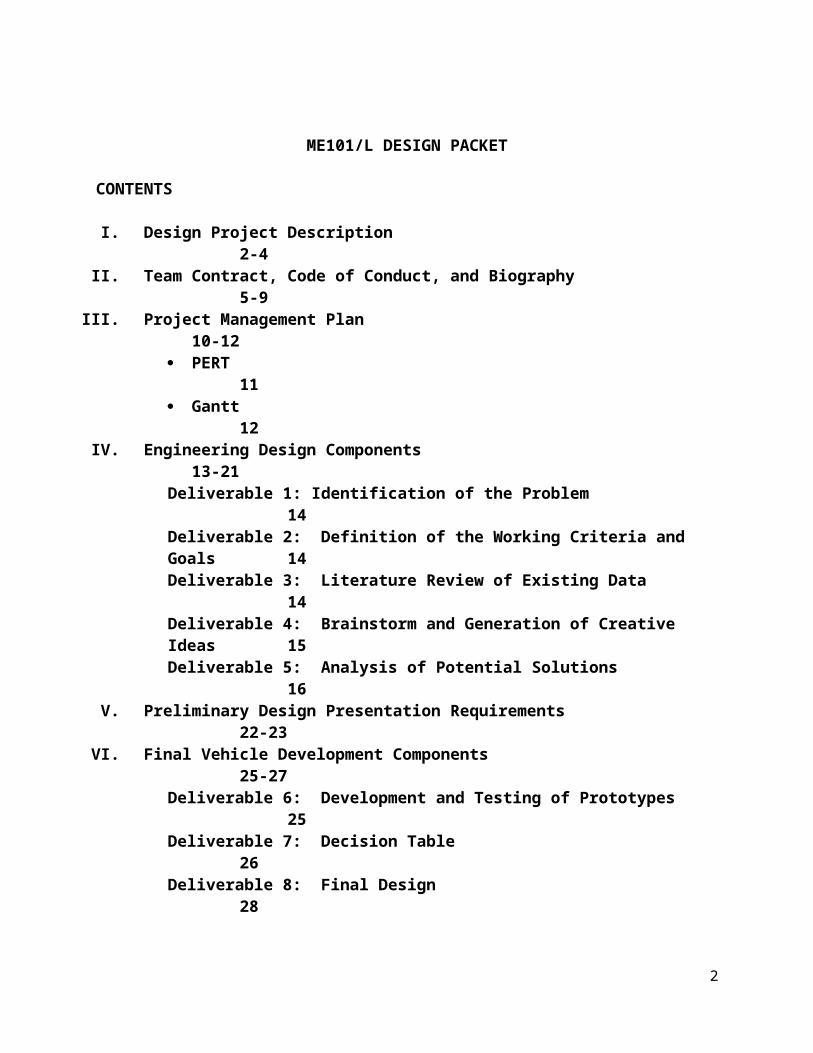
ME101/L DESIGN PACKET
CONTENTS
I. Design Project Description 2-4II. Team Contract, Code of Conduct, and Biography 5-9
III. Project Management Plan 10-12 PERT 11 Gantt 12
IV. Engineering Design Components 13-21Deliverable 1: Identification of the Problem 14Deliverable 2: Definition of the Working Criteria and Goals 14Deliverable 3: Literature Review of Existing Data 14Deliverable 4: Brainstorm and Generation of Creative Ideas 15Deliverable 5: Analysis of Potential Solutions 16
V. Preliminary Design Presentation Requirements 22-23VI. Final Vehicle Development Components 25-27
Deliverable 6: Development and Testing of Prototypes 25Deliverable 7: Decision Table 26Deliverable 8: Final Design 28Deliverable 9: Final Test Data 28Deliverable 10: Post Implementation and Review Assessment 29
VII. Competition 29VIII. Final Presentation Requirements 30
*Deadlines for deliverables will be highlighted in yellow at the top of each page.
2
I. Design Project DescriptionME101Dr. Nhut Tan Ho
OBJECTIVES:
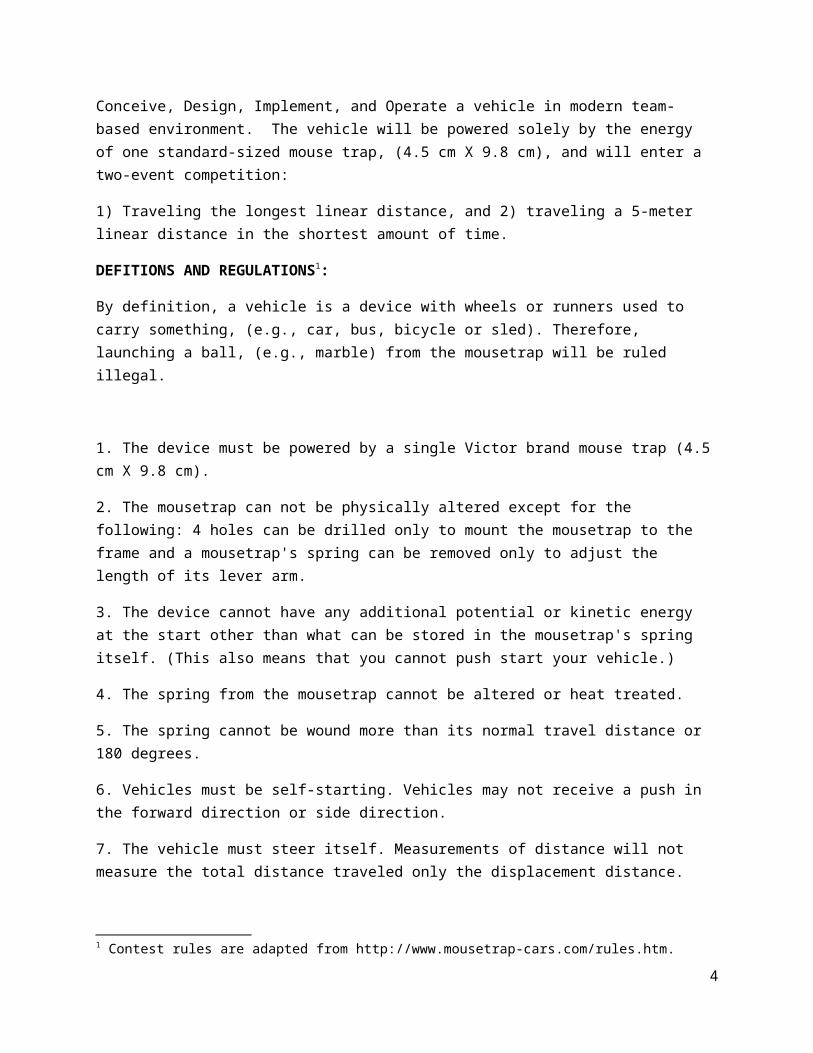
Conceive, Design, Implement, and Operate a vehicle in modern team-based environment. The vehicle will be powered solely by the energy of one standard-sized mouse trap, (4.5 cm X 9.8 cm), and will enter a two-event competition:
1) Traveling the longest linear distance, and 2) traveling a 5-meter linear distance in the shortest amount of time.
DEFITIONS AND REGULATIONS1:
By definition, a vehicle is a device with wheels or runners used to carry something, (e.g., car, bus, bicycle or sled). Therefore, launching a ball, (e.g., marble) from the mousetrap will be ruled illegal.
1. The device must be powered by a single Victor brand mouse trap (4.5 cm X 9.8 cm).
2. The mousetrap can not be physically altered except for the following: 4 holes can be drilled only to mount the mousetrap to the frame and a mousetrap's spring can be removed only to adjust the length of its lever arm.
3. The device cannot have any additional potential or kinetic energy at the start other than what can be stored in the mousetrap's spring itself. (This also means that you cannot push start your vehicle.)
4. The spring from the mousetrap cannot be altered or heat treated.
5. The spring cannot be wound more than its normal travel distance or 180 degrees.
6. Vehicles must be self-starting. Vehicles may not receive a push in the forward direction or side direction.
7. The vehicle must steer itself. Measurements of distance will not measure the total distance traveled only the displacement distance.
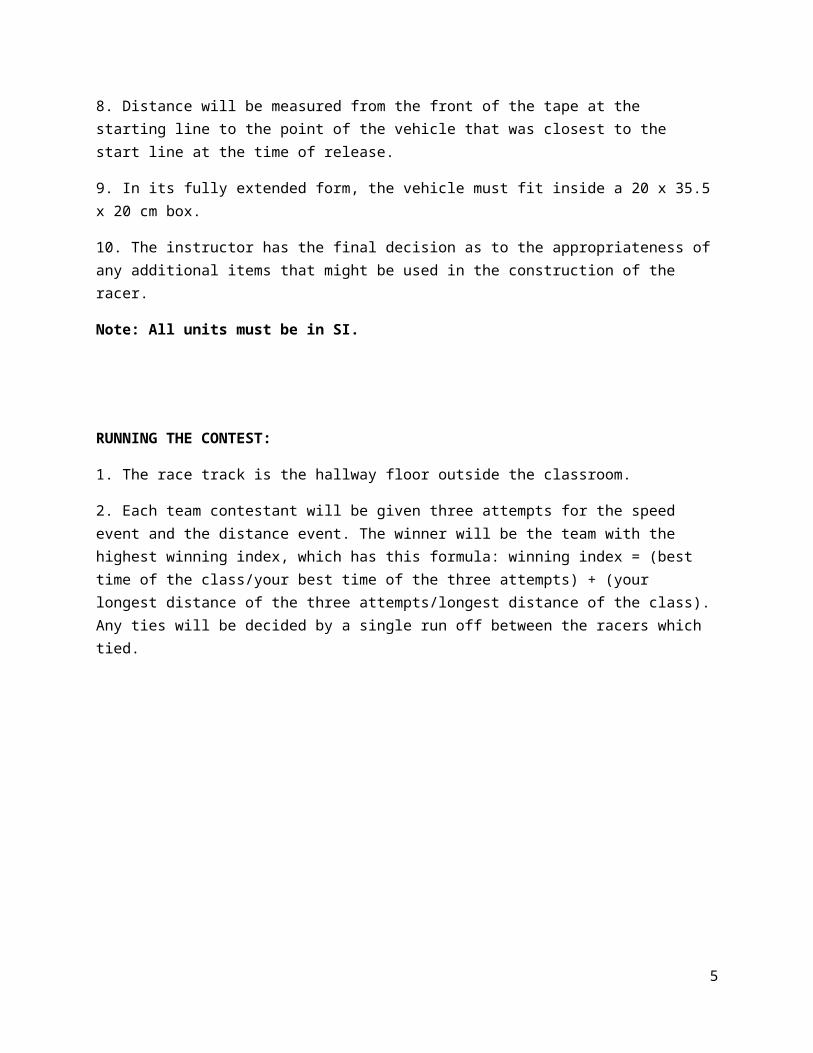
8. Distance will be measured from the front of the tape at the starting line to the point of the vehicle that was closest to the start line at the time of release.
9. In its fully extended form, the vehicle must fit inside a 20 x 35.5 x 20 cm box.
1 Contest rules are adapted from http://www.mousetrap-cars.com/rules.htm.
3
10. The instructor has the final decision as to the appropriateness of any additional items that might be used in the construction of the racer.
Note: All units must be in SI.
RUNNING THE CONTEST:
1. The race track is the hallway floor outside the classroom.
2. Each team contestant will be given three attempts for the speed event and the distance event. The winner will be the team with the highest winning index, which has this formula: winning index = (best time of the class/your best time of the three attempts) + (your longest distance of the three attempts/longest distance of the class). Any ties will be decided by a single run off between the racers which tied.
4
5

II. Team Contract, Code of Conduct, and BiographyDue: See Syllabus
Team Contract, Code of Conduct, and “How To Win Friends And Influence Other People”
Your assignment as a team is to develop
1. A team logo2. A plan and at least two games to implement Dale Carnegie’s “how to win friends and influence
other people” principles3. A team contract that specifies overall team purpose and the responsibilities of each of the team
members.4. A code of conduct outlining norms or ground rules that your team members will follow.5. A group biography
Team Logo
As a group, create a team logo which will be put at the top of each team report that your team turns in during the semester. It should be about 5x5 centimeters and include your team name. You may use any program to make the logo (word, paint, photoshop, etc…)
Implementing Dale Carnegie’s “How to Win Friends and Influence People” Principles
As part of your team contract, formulate a plan to
1. Develop a deep, driving desire to master the principles of human relations.2. Apply these principles at every opportunity. 3. Check each week on the progress you are making. Ask yourself what mistakes you have
made, what improvement, what lessons you have learned for the future.4. As a group, keep notes as part of the project documentation, showing how and when you and
your teammates have applied these principles, and present this documentation as part of the final design presentation.
In your plan, make sure to include games or activities that embody Carnegie’s principles in lively and interactive ways. For example, make a game out of your learning by instituting deterrents for your group members (e.g., they have to run a certain number of laps, they have to buy coffee for the TAs, they have to wear a certain ‘shame’ hat, etc…) every time they are caught violating one of these principles.
Team Contract
The purpose of the team contract is to develop a statement of the team's purpose and the duties/roles of each team member including how leadership functions will be carried out. You should carefully describe what is expected from each member of the team. Sample questions:
6
1. What is our team's purpose or mission?
2. What are duties/role of each team member? What is expected of each team member?
3. How will the team handle the leadership/facilitation/management activities?
You are to write a team contract for your team. Every member of the team must agree to the terms and sign the contract. The contract must be no longer than one page and must be typed and SIGNED!!!.
Code of Conduct
Outcome: Code of conduct stating norms or rules for team to follow. (This will include both task-oriented and people related ground rules.)
Evidence: At least a 2-page document summarizing ground rules/norms/strategies and the evidence you would see, hear, or feel to know if the ground rule was being followed? (Document must be typed.)
Procedure:
1. Brainstorm a list of norms or ground rules that will affect how your team will operate. Make sure that some of these norms are related to task work and some are related to group dynamics (people) work.
2. For each norm, identify what behavior you would see, hear, or feel if this norm were accepted by the team (evidence?). Develop some hypothetical situations to see how it would work, and what evidence you would need to have to know if the norm is or isn't being followed.
3. Check for consensus on the content and wording of your code of conduct. Can every team member agree to attempt to honor it as it stands?
4. Have each member sign the code of conduct. Make copies for each team member and me.
Issues to consider putting in your code:
What do "on time" and "attendance" mean?
How will decisions be made?
How will conflict be handled?
What behaviors should be encouraged? Avoided?
7
What happens when the ground rules are broken? How will you handle exceptions?
What recourse will you take when a team member does not perform agreed to responsibilities? What happens when one of the team members lets the others down?
How will specific roles (activities, tasks) be assigned for team projects?
How will team members give each other feedback on their performance?
How will your team avoid these Ten Errors Behind Most Communication Breakdowns/Problems:
1. Having no clear goal.
2. Not establishing rapport.
3. Staying in the negative.
4. Assuming others think as you think or know what you think.
5. Paying attention to yourself when you need to notice the other person.
6. Mistaking interpretations for facts.
7. Hallucinating (filling in the blanks from your own experience).
8. Not verifying information.
9. Leading too soon.
10. Resisting resistance.
8
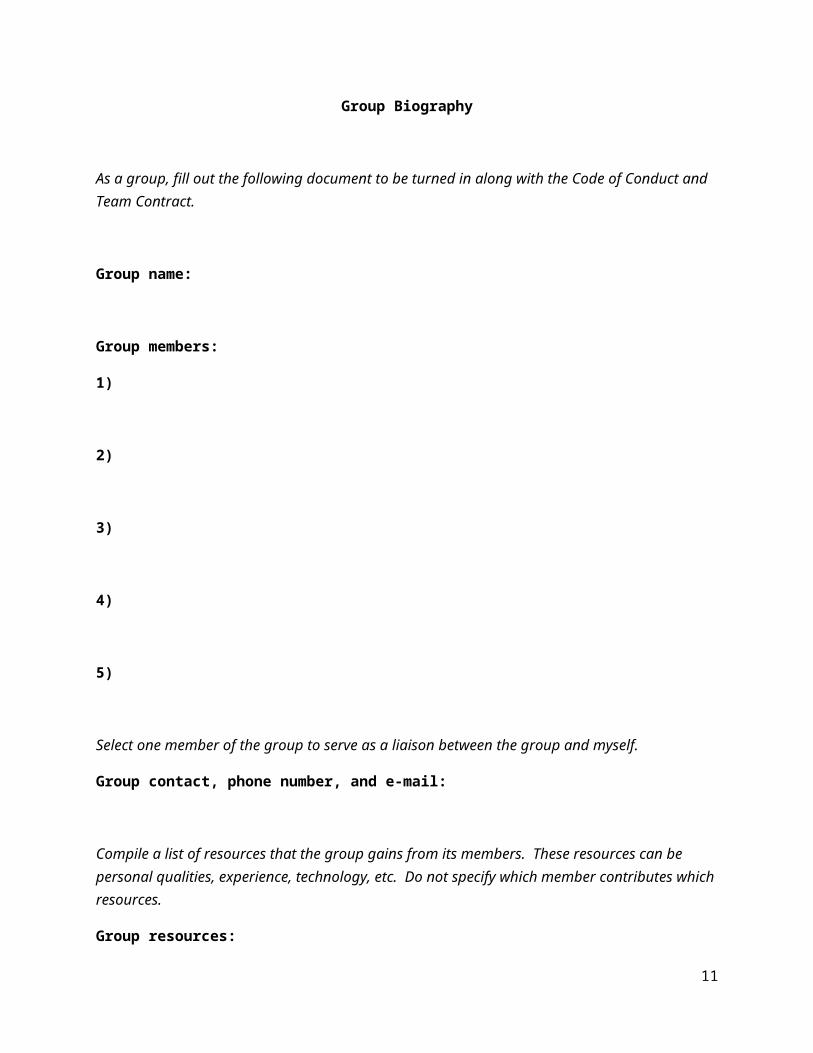
Group Biography
As a group, fill out the following document to be turned in along with the Code of Conduct and Team Contract.
Group name:
Group members:
1)
2)
3)
4)
5)
Select one member of the group to serve as a liaison between the group and myself.
Group contact, phone number, and e-mail:
Compile a list of resources that the group gains from its members. These resources can be personal qualities, experience, technology, etc. Do not specify which member contributes which resources.
Group resources:
9
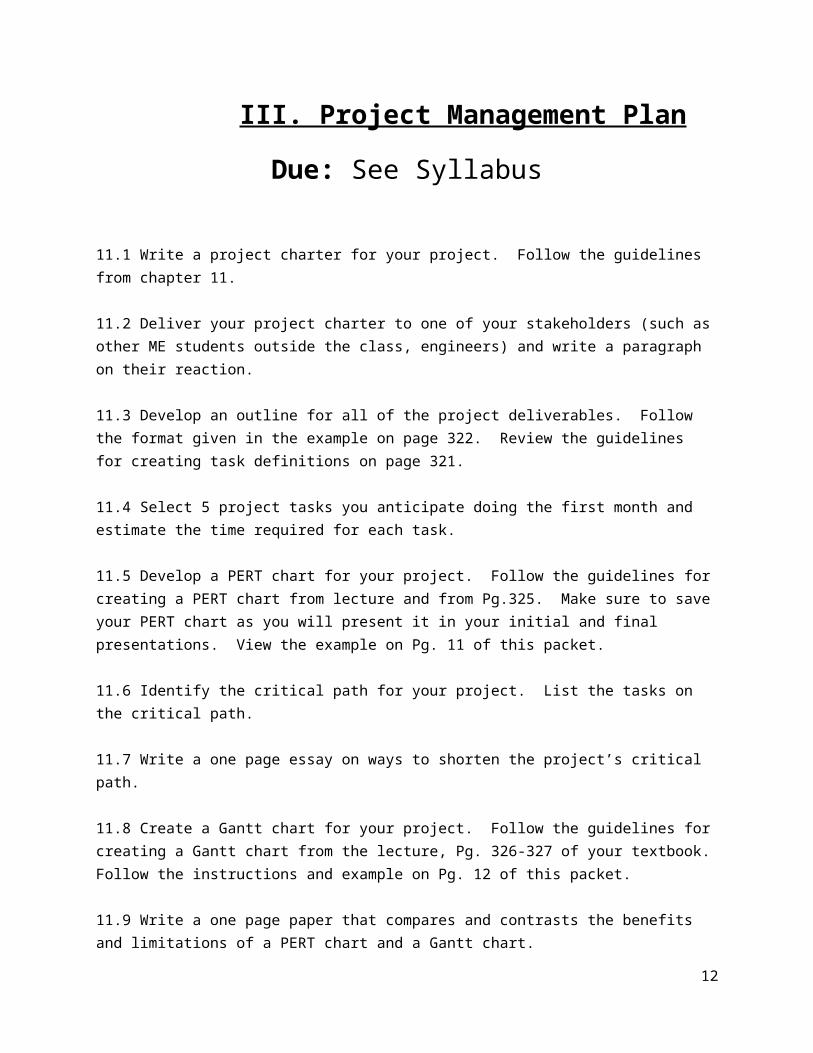
III. Project Management Plan
Due: See Syllabus
11.1 Write a project charter for your project. Follow the guidelines from chapter 11.
11.2 Deliver your project charter to one of your stakeholders (such as other ME students outside the class, engineers) and write a paragraph on their reaction.
11.3 Develop an outline for all of the project deliverables. Follow the format given in the example on page 322. Review the guidelines for creating task definitions on page 321.
11.4 Select 5 project tasks you anticipate doing the first month and estimate the time required for each task.
11.5 Develop a PERT chart for your project. Follow the guidelines for creating a PERT chart from lecture and from Pg.325. Make sure to save your PERT chart as you will present it in your initial and final presentations. View the example on Pg. 11 of this packet.
11.6 Identify the critical path for your project. List the tasks on the critical path.
11.7 Write a one page essay on ways to shorten the project’s critical path.
11.8 Create a Gantt chart for your project. Follow the guidelines for creating a Gantt chart from the lecture, Pg. 326-327 of your textbook. Follow the instructions and example on Pg. 12 of this packet.
11.9 Write a one page paper that compares and contrasts the benefits and limitations of a PERT chart and a Gantt chart.
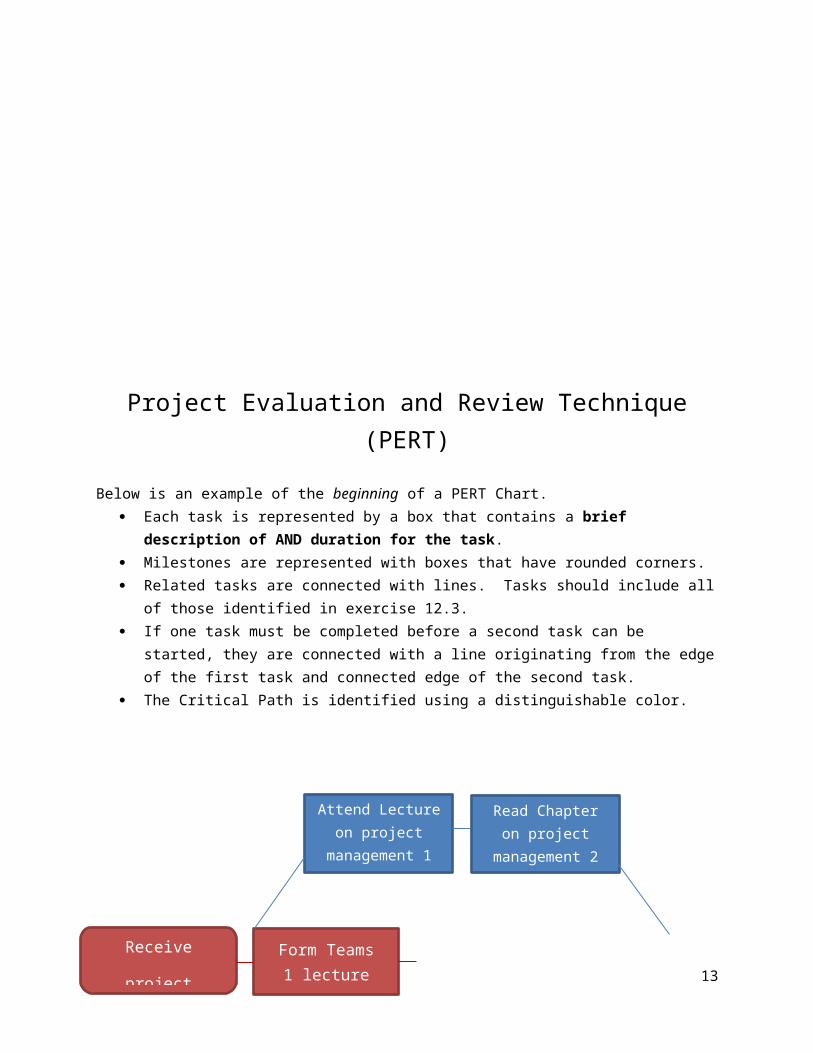
Project Evaluation and Review Technique (PERT)10
Below is an example of the beginning of a PERT Chart. Each task is represented by a box that contains a brief description of AND duration for the
task. Milestones are represented with boxes that have rounded corners. Related tasks are connected with lines. Tasks should include all of those identified in exercise
12.3. If one task must be completed before a second task can be started, they are connected with a line
originating from the edge of the first task and connected edge of the second task. The Critical Path is identified using a distinguishable color.
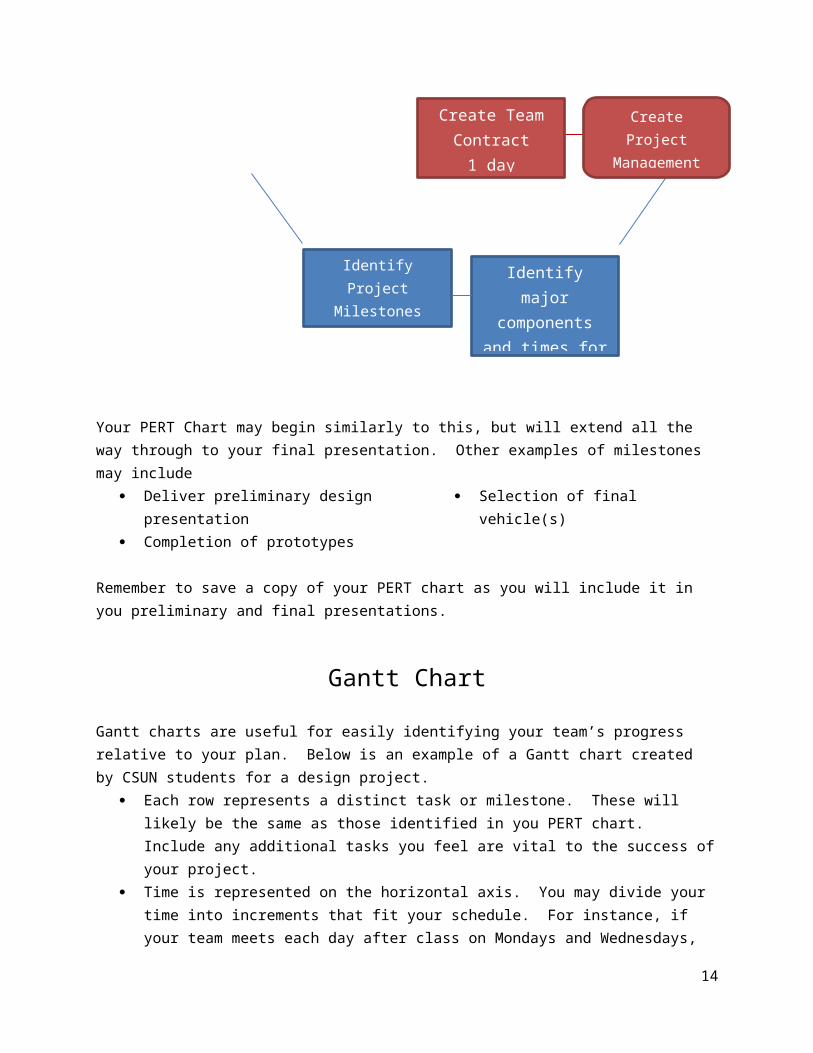
Your PERT Chart may begin similarly to this, but will extend all the way through to your final presentation. Other examples of milestones may include
Deliver preliminary design presentation Completion of prototypes
Selection of final vehicle(s)
Remember to save a copy of your PERT chart as you will include it in you preliminary and final presentations.
Gantt Chart
11
Receive project description
Attend Lecture on project management
1 lecture
Identify Project Milestones 1
day
Form Teams 1 lecture
Identify major components and
times for each task 1 day
Create Team Contract 1
day
Read Chapter on project management
2 hours
Create Project Management Plan 2
days
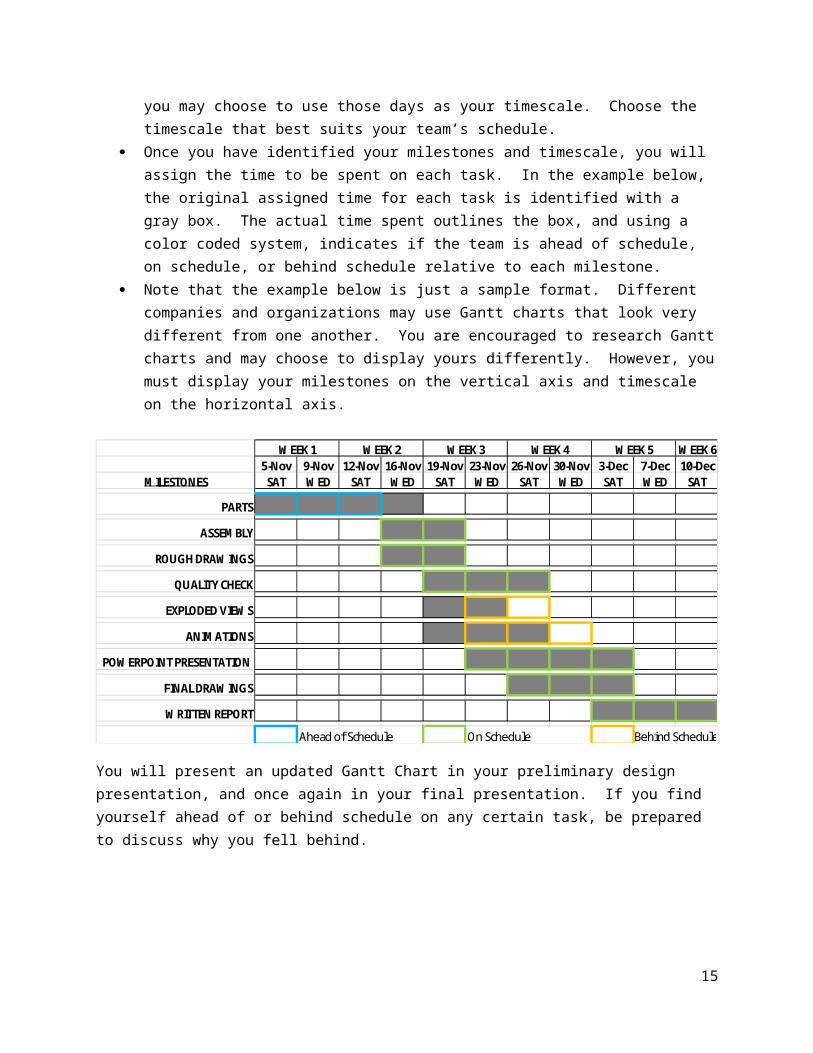
Gantt charts are useful for easily identifying your team’s progress relative to your plan. Below is an example of a Gantt chart created by CSUN students for a design project.
Each row represents a distinct task or milestone. These will likely be the same as those identified in you PERT chart. Include any additional tasks you feel are vital to the success of your project.
Time is represented on the horizontal axis. You may divide your time into increments that fit your schedule. For instance, if your team meets each day after class on Mondays and Wednesdays, you may choose to use those days as your timescale. Choose the timescale that best suits your team’s schedule.
Once you have identified your milestones and timescale, you will assign the time to be spent on each task. In the example below, the original assigned time for each task is identified with a gray box. The actual time spent outlines the box, and using a color coded system, indicates if the team is ahead of schedule, on schedule, or behind schedule relative to each milestone.
Note that the example below is just a sample format. Different companies and organizations may use Gantt charts that look very different from one another. You are encouraged to research Gantt charts and may choose to display yours differently. However, you must display your milestones on the vertical axis and timescale on the horizontal axis.
WEEK 65-Nov 9-Nov 12-Nov 16-Nov 19-Nov 23-Nov 26-Nov 30-Nov 3-Dec 7-Dec 10-Dec
MILESTONES SAT WED SAT WED SAT WED SAT WED SAT WED SAT
PARTS
ASSEMBLY
ROUGH DRAWINGS
QUALITY CHECK
EXPLODED VIEWS
ANIMATIONS
POWERPOINT PRESENTATION
FINAL DRAWINGS
WRITTEN REPORT
WEEK 2WEEK 1
Ahead of Schedule On Schedule Behind Schedule
WEEK 5WEEK 4WEEK 3
You will present an updated Gantt Chart in your preliminary design presentation, and once again in your final presentation. If you find yourself ahead of or behind schedule on any certain task, be prepared to discuss why you fell behind.
12
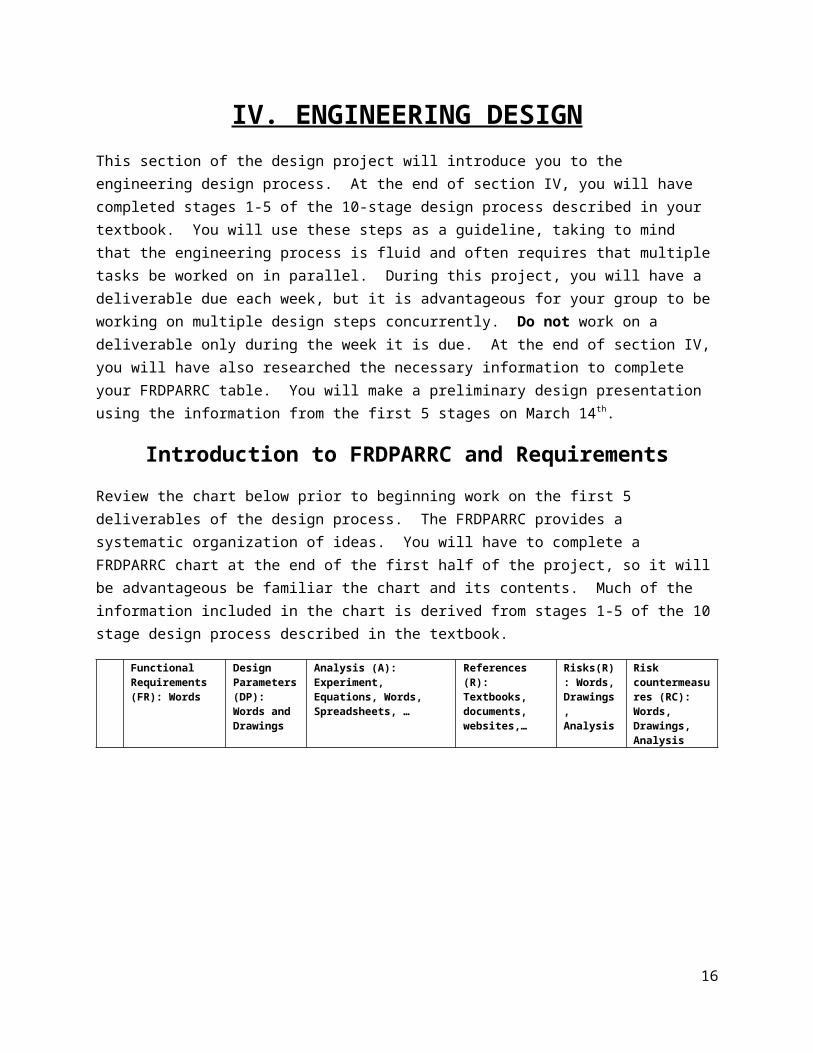
IV. ENGINEERING DESIGNThis section of the design project will introduce you to the engineering design process. At the end of section IV, you will have completed stages 1-5 of the 10-stage design process described in your textbook. You will use these steps as a guideline, taking to mind that the engineering process is fluid and often requires that multiple tasks be worked on in parallel. During this project, you will have a deliverable due each week, but it is advantageous for your group to be working on multiple design steps concurrently. Do not work on a deliverable only during the week it is due. At the end of section IV, you will have also researched the necessary information to complete your FRDPARRC table. You will make a preliminary design presentation using the information from the first 5 stages on March 14th.
Introduction to FRDPARRC and Requirements
Review the chart below prior to beginning work on the first 5 deliverables of the design process. The FRDPARRC provides a systematic organization of ideas. You will have to complete a FRDPARRC chart at the end of the first half of the project, so it will be advantageous be familiar the chart and its contents. Much of the information included in the chart is derived from stages 1-5 of the 10 stage design process described in the textbook.
Functional Requirements (FR): Words
Design Parameters (DP): Words and Drawings
Analysis (A): Experiment, Equations, Words, Spreadsheets, …
References (R): Textbooks, documents, websites,…
Risks(R): Words, Drawings, Analysis
Risk countermeasures (RC): Words, Drawings, Analysis
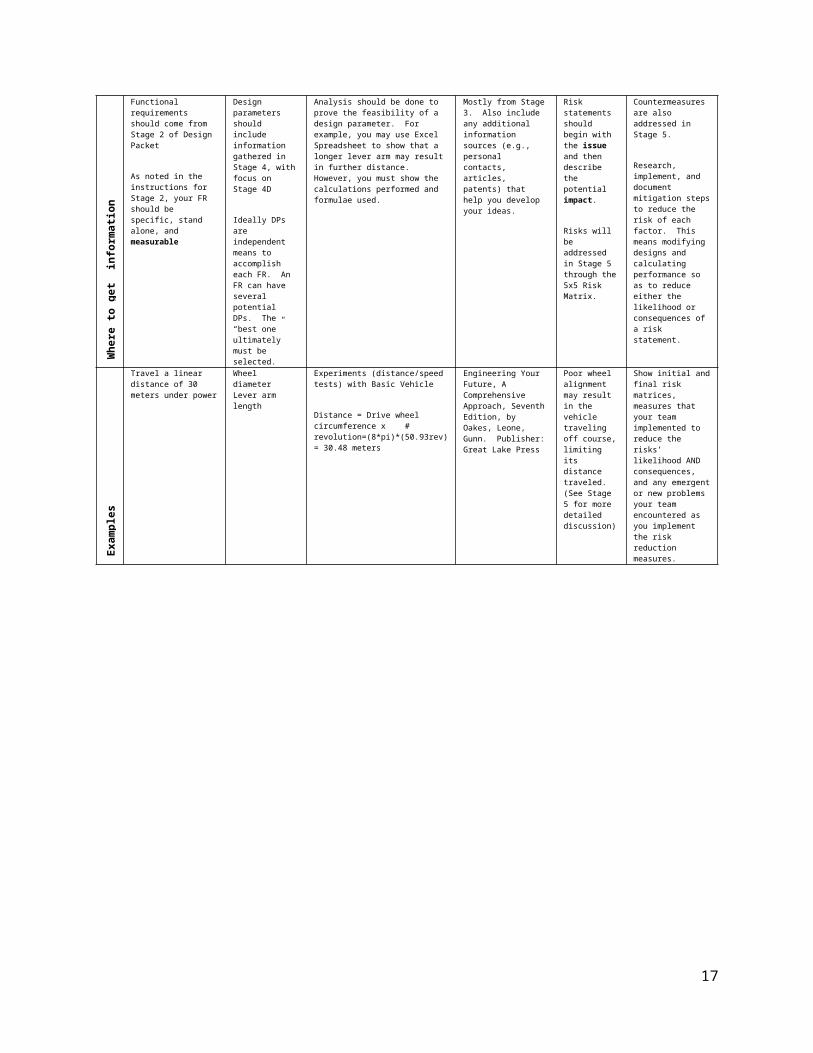
Whe
re to
get
inf
orm
atio
n
Functional requirements should come from Stage 2 of Design Packet
As noted in the instructions for Stage 2, your FR should be specific, stand alone, and measurable
Design parameters should include information gathered in Stage 4, with focus on Stage 4D
Ideally DPs are independent means to accomplish each FR. An FR can have several potential DPs. The “best one” ultimately must be selected.
Analysis should be done to prove the feasibility of a design parameter. For example, you may use Excel Spreadsheet to show that a longer lever arm may result in further distance. However, you must show the calculations performed and formulae used.
Mostly from Stage 3. Also include any additional information sources (e.g., personal contacts, articles, patents) that help you develop your ideas.
Risk statements should begin with the issue and then describe the potential impact.
Risks will be addressed in Stage 5 through the 5x5 Risk Matrix.
Countermeasures are also addressed in Stage 5.
Research, implement, and document mitigation steps to reduce the risk of each factor. This means modifying designs and calculating performance so as to reduce either the likelihood or consequences of a risk statement.
Exa
mpl
es
Travel a linear distance of 30 meters under power
Wheel diameterLever arm length
Experiments (distance/speed tests) with Basic Vehicle
Distance = Drive wheel circumference x # revolution=(8*pi)*(50.93rev)= 30.48 meters
Engineering Your Future, A Comprehensive Approach, Seventh Edition, by Oakes, Leone, Gunn. Publisher: Great Lake Press
Poor wheel alignment may result in the vehicle traveling off course, limiting its distance traveled. (See Stage 5 for more detailed discussion)
Show initial and final risk matrices, measures that your team implemented to reduce the risks’ likelihood AND consequences, and any emergent or new problems your team encountered as you implement the risk reduction measures.
13
Introduction to Deliverables
Your team will turn in a report, or deliverable, for each task you work on during the course of the project. The reports must be typed, double-spaced with one-inch margins and 12-point font. Additionally, include each team member’s name and your team logo on the first page. You can submit the assignment any time before the due date to the ME101 Box in the Mechanical Engineering office (JD 4513) during business hours (8AM-4PM).
Deliverables 1, 2, and 3 Due: See Syllabus
Deliverables 1-3 will help your team identify the problem, set quantifiable goals, and research possible solutions to your problem. Your team will submit one report containing all required information for the following 3 deliverables.
DELIVERABLE 1: Identification of the Problem (Pg. 339)
Review the requirements of your project as outlined in the project description, and establish a preliminary, formal statement of the problem.
DELIVERABLE 2: Definition of the Working Criteria and Goals (Pg. 340)
A. What specific goals does your team wish to achieve?
Establish a set of specific goals your team wishes to achieve for each vehicle. These goals will be specific to your team and should be quantifiable. A good example might be “Our car will travel 20 meters under power.” A poor example might be, “Our car will go fast”, which would be unclear. Also, avoid combining goals, such as “Go far and straight”. Other good examples might include
Vehicle will self-start Vehicle will travel no more than 1 meter off course in any direction
B. After you have set your goals, discuss specifically how your team set each goal.
DELIVERABLE 3: Literature Review of Existing Data (Pg. 341)
Here you will research what solutions to your problems already exist, and whether you can improve upon any of these solutions. You should come up with 3 documented
14
solutions to each problem. For each solution you outline, provide 1 way to improve upon the solution.
For example, your mouse trap car book offers a simple design to build a functioning mousetrap car. This would be one documented solution to the problem, “Build a working mousetrap car.” You could then discuss how you might improve upon the simple solution from the book by using bearings instead of bushings, etc.
15
Deliverable 4: Brainstorm and Generation of Creative IdeasDue: See Syllabus
Each team will submit one report that will include each of the following components.
A. Identify Design Parameters: Write down as many controllable factors as you can think of that affect the performance of your vehicle. For example, width of drive wheels, length of lever arm, weight, gear ratio.
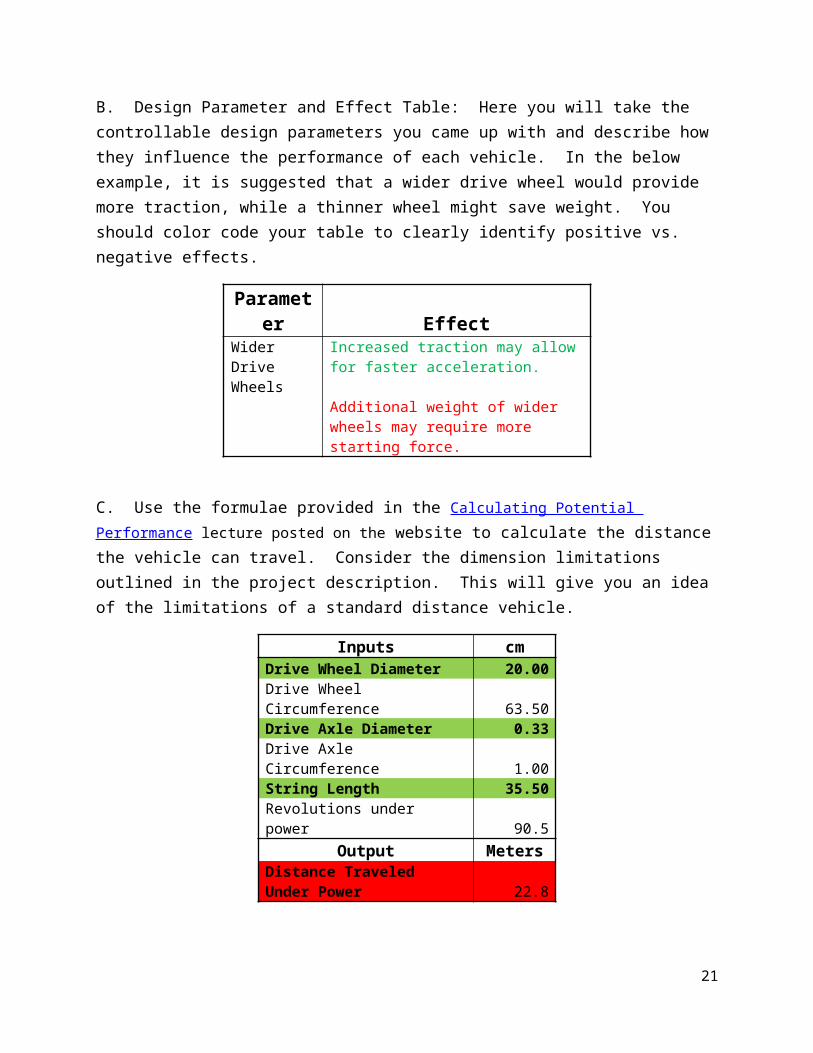
B. Design Parameter and Effect Table: Here you will take the controllable design parameters you came up with and describe how they influence the performance of each vehicle. In the below example, it is suggested that a wider drive wheel would provide more traction, while a thinner wheel might save weight. You should color code your table to clearly identify positive vs. negative effects.
Parameter Effect
Wider Drive Wheels
Increased traction may allow for faster acceleration.
Additional weight of wider wheels may require more starting force.
C. Use the formulae provided in the Calculating Potential Performance lecture posted on the website to calculate the distance the vehicle can travel. Consider the dimension limitations outlined in the project description. This will give you an idea of the limitations of a standard distance vehicle.
Inputs cmDrive Wheel Diameter 20.00Drive Wheel Circumference 63.50Drive Axle Diameter 0.33Drive Axle Circumference 1.00String Length 35.50Revolutions under power 90.5
Output MetersDistance Traveled Under Power 22.8
16
D. Generate a list of creative ideas to increase the potential distance from your calculated results above. These should be created as a means to accomplish the functional requirements set in Deliverable 2A.
E. Preliminary sketches of proposed designs: Sketch your preliminary design concepts. There is no limit to the number of sketches. Computer aided designs, hand sketches, and photographs are all acceptable. Your sketches should take into consideration the goals you are trying to achieve and the restrictions outlined in the project description. Be prepared to explain your concepts and the purpose of individual components. You should save a copy of all sketches to present as part of your preliminary presentation.
17
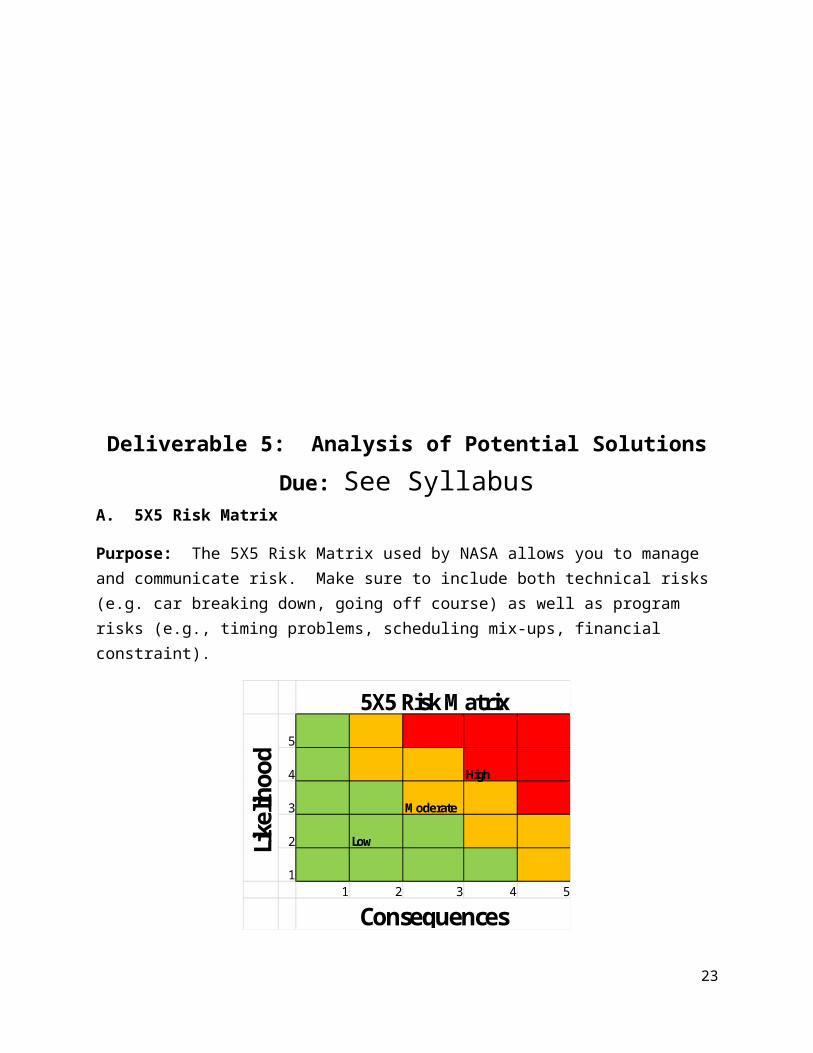
Deliverable 5: Analysis of Potential SolutionsDue: See Syllabus
A. 5X5 Risk Matrix
Purpose: The 5X5 Risk Matrix used by NASA allows you to manage and communicate risk. Make sure to include both technical risks (e.g. car breaking down, going off course) as well as program risks (e.g., timing problems, scheduling mix-ups, financial constraint).
5
4 High
3 Moderate
2 Low
11 2 3 4 5
L
ikel
ihoo
d
Consequences
5X5 Risk Matrix
Your team will
1. Write risk (technical and program) statements with regard to each your distance and speed vehicles. Risk statements describe potential issues with the current design. Risk statements should begin with the issue and then describe the potential impact.
a. Example: Poor wheel alignment may result in the vehicle traveling off course, limiting its distance traveled.
b. Example: Given that the friction force between the drive wheels and the ground is unknown, there is a risk that the car will spin its wheels and not accelerate to achieve the speed/distance goals.
c. Example: Our team’s inability to find a common meeting time results in poor work coordination, causing us to submit unorganized reports and miss deadlines.
2. Locate each risk statement on the 5X5 risk matrix by considering a. The likelihood of the undesirable event occurring and b. The severity of the consequences should the undesirable event occur.
18
Assign a numerical risk value by multiplying the likelihood and consequence values, and label it either high, moderate, or low risk. Explain the reasoning behind the location of each risk factor on the matrix.
3. The initial 5X5 matrix serves as a starting point for your risk mitigation. You should save the 5X5 matrix at this stage. Risk statements will help to fill in the risk portion of the FRDPARRC.
4. Research, implement, and document mitigation steps to reduce the risk of each factor. This means modifying designs and calculating performance so as to reduce either the likelihood or consequences of a risk statement.
5. Discuss how the implemented mitigation steps affected each risk statement.
Once mitigation steps have been designed, implemented, and tested, you will need to continuously revise the matrix and explain how you were able to reduce each risk factor. Factors that were previously in the red may be may migrate to yellow or green at later stages.
5X5 Risk Matrix Example
Let’s do a brief example using the risk of poor wheel alignment resulting in the vehicle traveling off course, in turn limiting its final distance.
Step 1: Due to poor wheel alignment, our vehicle may travel off course into a wall and its potential distance substantially decreased.
Step 2: First, determine the likelihood of the event occurring (the higher the number, the more likely it is to occur). This number will vary depending on your team’s design. Let’s assume the initial design lacks adjustable steering. We would consider then, the likelihood of the vehicle traveling off course will be more than moderately likely. However, there is the possibility that the vehicle is built well enough to travel true to course without having to make any adjustments. Our team, therefore, assigns a likelihood of 4 that the vehicle will travel off course.
Next, our team needs to assign a value to the consequences should the undesired event (traveling off course) occur. Our team decides that even with poor alignment, our vehicle will at least travel some distance (it will not fail to leave the starting line). So, we decide our consequences should not exceed 4 since 5 would imply a complete failure of the vehicle. However, poor alignment could drastically limit the distance our vehicle travels. So, it should not be placed any less than 3. Because distance is the primary goal of our vehicle, we decide that the consequences are greater than a 3, but no greater than 4, leaving us with 4 for our consequences rating. (It is important to note that the numerical ratings are subjective and only semi-quantifiable, so two matrices addressing the same risk statements may assign different values depending on the team making the matrix.)
19
Now we can indicate, that with a likelihood of 4, and a consequence rating of 4, that our initial design faces a high risk of traveling off course.
Step 3: At this stage, our team saves our 5X5 matrix for reference. Once we put into place mitigation steps, we can compare our initial risk matrix with our risk matrix after mitigation steps have been implemented.
Step 4: We want to take mitigation steps to decrease the risk of each risk factor.
Our team decides that we could take a number of steps to decrease the likelihood of our vehicle traveling off course. We decide that our vehicle will have adjustable steering. This way if we find our initial alignment is off, we can make small adjustments to improve the path of the vehicle. Additionally, we decide to attach both wheels to a single rotating axle, rather than attach each wheel to an independent bearing. This will ensure that each wheel rotates with the same resistance and speed. We conduct 100 test runs and plot the results to show the effects of the mitigation steps.
We also find a way to reduce our consequences. We decide that by adding bumpers to the sides of the vehicle, our vehicle will be able to bounce off the wall should it come into contact with it, rather than just stopping.
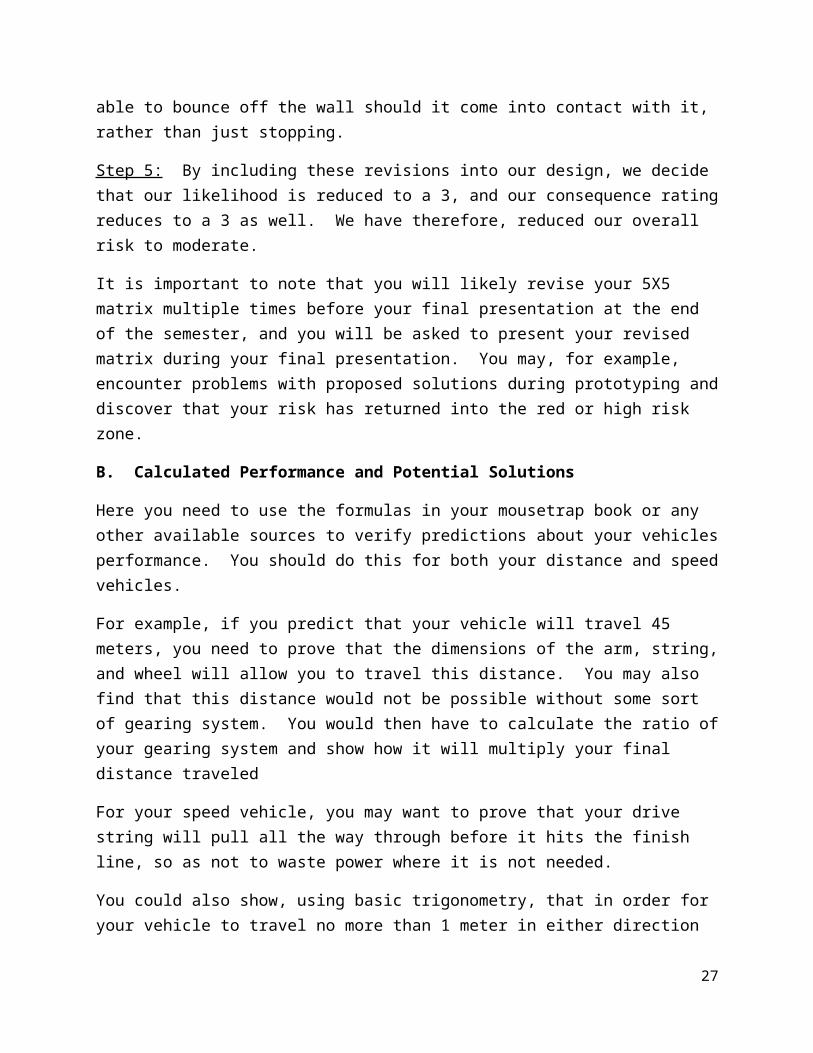
Step 5: By including these revisions into our design, we decide that our likelihood is reduced to a 3, and our consequence rating reduces to a 3 as well. We have therefore, reduced our overall risk to moderate.
It is important to note that you will likely revise your 5X5 matrix multiple times before your final presentation at the end of the semester, and you will be asked to present your revised matrix during your final presentation. You may, for example, encounter problems with proposed solutions during prototyping and discover that your risk has returned into the red or high risk zone.
B. Calculated Performance and Potential Solutions
Here you need to use the formulas in your mousetrap book or any other available sources to verify predictions about your vehicles performance. You should do this for both your distance and speed vehicles.
For example, if you predict that your vehicle will travel 45 meters, you need to prove that the dimensions of the arm, string, and wheel will allow you to travel this distance. You may also find that this distance would not be possible without some sort of gearing system. You would then have to calculate the ratio of your gearing system and show how it will multiply your final distance traveled
20
For your speed vehicle, you may want to prove that your drive string will pull all the way through before it hits the finish line, so as not to waste power where it is not needed.
You could also show, using basic trigonometry, that in order for your vehicle to travel no more than 1 meter in either direction over your predicted distance, that your steering alignment has a margin of error of x degrees.
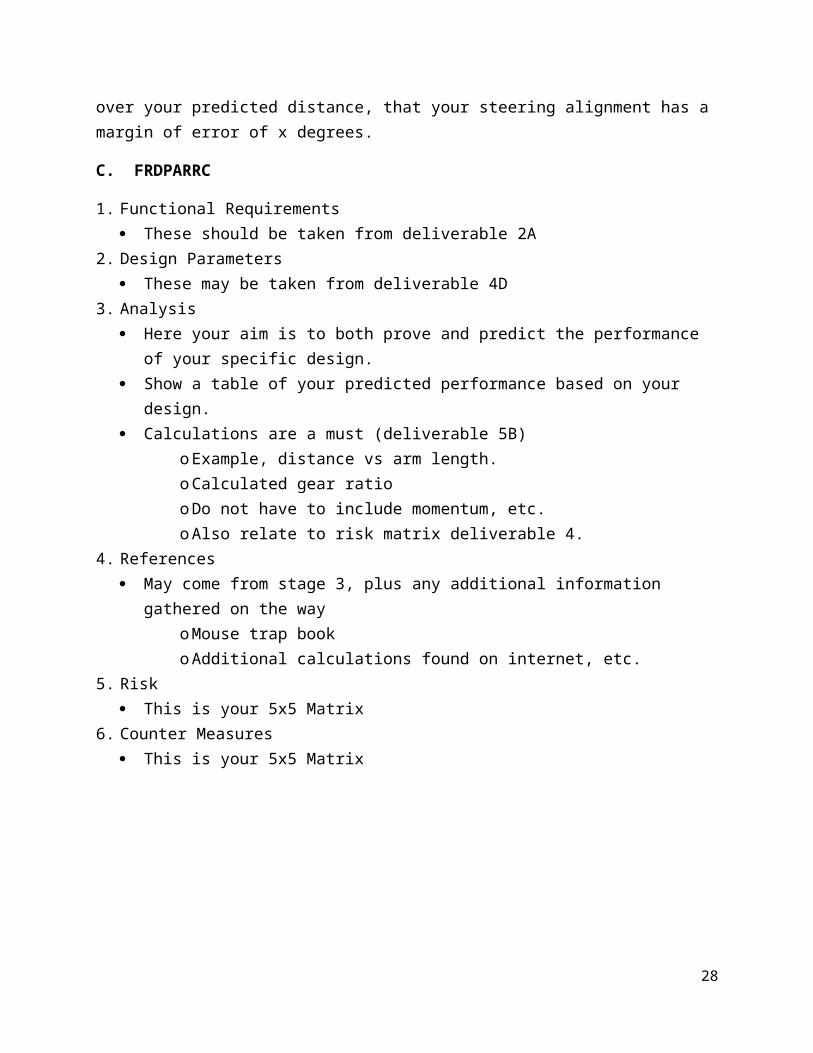
C. FRDPARRC
1. Functional Requirements These should be taken from deliverable 2A
2. Design Parameters These may be taken from deliverable 4D
3. Analysis Here your aim is to both prove and predict the performance of your specific design. Show a table of your predicted performance based on your design. Calculations are a must (deliverable 5B)
oExample, distance vs arm length.oCalculated gear ratiooDo not have to include momentum, etc.oAlso relate to risk matrix deliverable 4.
4. References May come from stage 3, plus any additional information gathered on the way
oMouse trap bookoAdditional calculations found on internet, etc.
5. Risk This is your 5x5 Matrix
6. Counter Measures This is your 5x5 Matrix
21
V. Preliminary Design PresentationDue: See Syllabus
*Read and follow the guidelines in the lecture Oral Communication Skills
The following is an outline of the basic requirements for your Preliminary Design Presentation. Your presentation must include all of these elements, but the order and organization is up to your group. Make sure that the information is presented in a logical way and tells the ‘story’ of your group’s progress. Also make sure that;
All of your slides contain iterative information. (E.g. multiple designs of each prototype, gannt chart changes throughout the semester, changes to group dynamics or roles, etc…)
Vehicle test data is shown visually though a combination of pictures and video and engineering plots (with proper labeling of x and y axes and their units).
Make sure to label every figure and indicate the context of each slides (e.g. if you have a slide of prototypes, be sure to indicate whether they are distance or speed.)
Preliminary Presentation Requirements
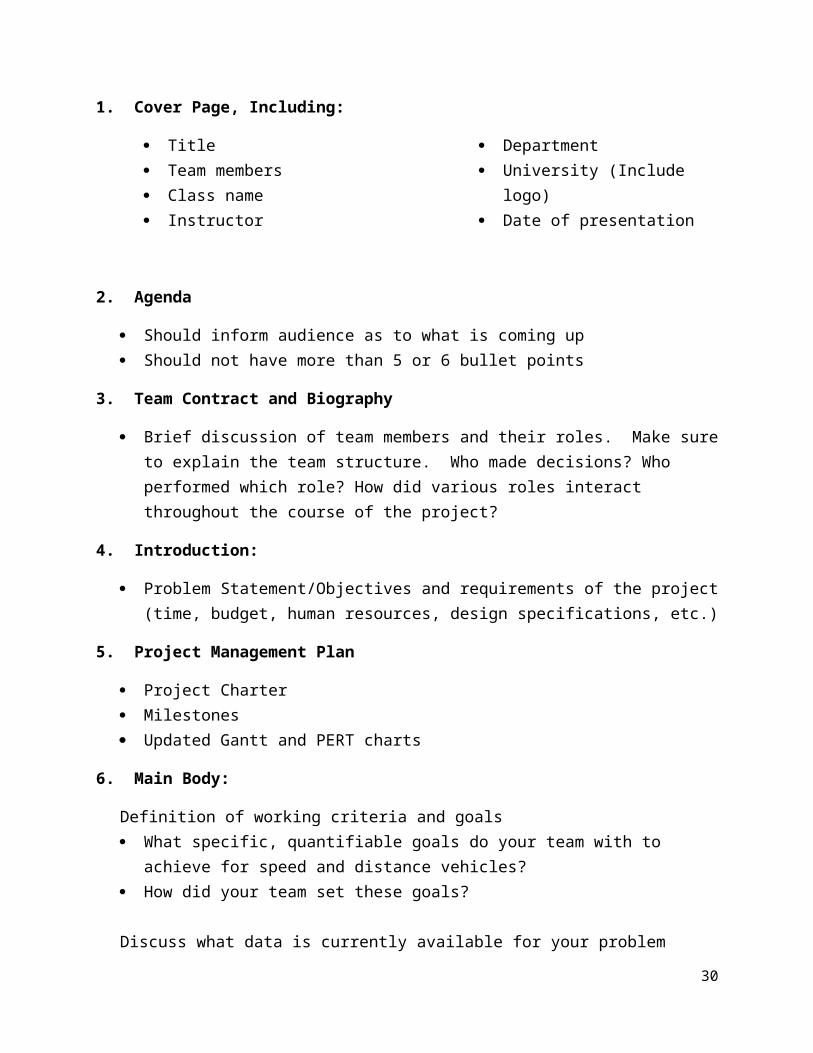
1. Cover Page, Including:
Title Team members Class name Instructor
Department University (Include logo) Date of presentation
2. Agenda
Should inform audience as to what is coming up Should not have more than 5 or 6 bullet points
3. Team Contract and Biography
Brief discussion of team members and their roles. Make sure to explain the team structure. Who made decisions? Who performed which role? How did various roles interact throughout the course of the project?
22
4. Introduction:
Problem Statement/Objectives and requirements of the project (time, budget, human resources, design specifications, etc.)
5. Project Management Plan
Project Charter Milestones Updated Gantt and PERT charts
6. Main Body:
Definition of working criteria and goals What specific, quantifiable goals do your team with to achieve for speed and distance
vehicles? How did your team set these goals?
Discuss what data is currently available for your problem
Brainstorm and generate creative ideas Identify controllable variables Basic variable and effect table Calculated performance of basic vehicles Discuss the initial ideas for improving performance of basic vehicles Sketches, computer aided drawings, and/or pictures
Analyze Potential Solutions Updated 5X5 Risk Matrix Predicted performance and solutions and test results FRDPARRC Table
7. Conclusion8. References
Include properly cited references. Regardless of which format you use, make sure to be consistent across all citations.
9. Acknowledgements Include a slide thanking those who helped you throughout the semester (e.g., Personnel in
the Machine Shop, TAs, Industry Contacts).
Page and Presentation Time Limits 15 minutes for presentation, followed by a 5-minute Q&A
23
Approximately 1-2 slides per minute
Peer Review
You are required to assign a score for each of your teammates using the following peer review.
http://www.csun.edu/~me101/Peer%20Review%20Ratings%20in%20Categories %20filled%20out.htm
The first group of ratings provides feedback on areas of strength and weaknesses that your team mates can work on to improve team functioning and cohesion. The second group of ratings provides a numerical score for each team mate that will be used in the course’s final grade.
This peer review provides an opportunity for group members to identify and fix problems with the group dynamics, work distribution, or interpersonal issues and should not be taken lightly. A team that can perform a successful peer review will work better as a team. Each person in the team must fill out a review separately, and then the whole team meets to finalize and submit one peer review.
24
VI. Final Vehicle DevelopmentIn the second half of the course, you will work through the engineering development process. By the date of the competition you will have performed steps 6-10 of the 10-stage design process as described in the book. Once again, instead of following these steps in a linear order, you will need to work on all 5 of the deliverables concurrently, turning them in as indicated by the syllabus.
Deliverable 6: Implementation and Testing of PrototypesPrototypes and test results Due: See Syllabus
It’s time to start building (if you have not already).
You have already developed your concepts, it is time to put them into motion. You may want to begin with the prototypes that are most likely to be successful. The more prototypes you build and test the more likely your final design is to succeed. You may find that your prototype is so successful that it becomes your final design. If this is the case, you do not have to rebuild your model and may use a successful prototype, or components of, for your final design. It is possible that after prototyping and testing your design fails, and you will have to rethink your concept.
You will likely NOT have enough class time during lab meetings to finish your prototypes and models. Therefore, you should make plans to meet with your team outside of class to work on your models.
Each group must produce AT LEAST four working prototypes (two for speed and two for distance). For each prototype built, document the building process (e.g. how it was assembled, what went wrong, etc…), take pictures and video of the finished product, and show plots of data from your tests.
25
Deliverable 7: Decision TablesDue: See Syllabus
By now you should have tested prototypes, and possibly modified your original concepts.
You now have enough information to decide which of your original concepts from stages 4 and 5 are most promising for your final vehicles.
You are to create a decision table (Pg. 356) comparing your original designs. Select a number of working criteria, allot each a certain weight, and evaluate each model accordingly.
Below are two decision tables for speed and distance prototypes. For each category on the table (e.g cost, adjustability, durability, etc…) you are to assign a score to each of your prototypes. Assume, for example, that Distance Car 1 is more expensive to make than Distance Car 2. Accordingly, Distance Car 2, which is the cheapest car, is given a high score of 13, while Distance Car 1, which costs more than Distance Car 2 but is still relatively inexpensive, is given a lower score of 10. When scores for each category are assigned, the sums of each column are compared. The highest scoring prototype should be selected as your final design.
Keep in mind that these tables are examples only. Each group should choose categories that are relevant to their own situation. For instance, some groups may not include cost in their chart because neither of their prototypes requires a significant investment.
Distance SelectionExample Criteria Points Available Distance 1 Distance 2Cost 15 10 13Adjustability 15 10 12Durability 10 10 10Distance 30 25 23Technical Feasibility 20 12 16
10 10 9 100 77 83
26
Speed SelectionExample Criteria Points Available Speed 1 Speed 2Cost 15 11 12Speed 15 12 12Traction 20 18 16Weight 20 15 17Technical Feasibility 20 16 18
10 9 10 100 81 85
10 Breakthrough Technologies Report
This week you will also prepare PowerPoint slides on MIT Technology Review’s 10 Breakthrough Technologies. Each group will be assigned specific technologies in class and will be required to give a 15-minute presentation on them (generally, a slide represents about one minute of speaking, so aim for 15 slides). Design your slides on the following outline:
Introduction to your technology Concepts or theories behind the technology Applications for the technology Engineering challenges to develop the technology in the future Related fields or spinoffs of the technology
Include visuals where necessary and a ‘Works Cited’ page at the end.
27
Deliverable 8: Final DesignDue: See Syllabus
Here you will finalize and submit design sketches and specifications for your final design. No further modifications will be allowed to proposed designs after submission.
Save any sketches you have created as they will be included in your final design presentation.
You may want to take photos or prototyped parts or parts assembled on your final vehicle.
Write a brief report (½ page) discussing how your prototypes influenced your final design. Discuss whether you settled on a certain design, and whether or how factors (e.g., time constraint) affected your decisions.
Deliverable 9: Final Test DataDue: See Syllabus
At this stage you want to complete the implementation (designing, building, testing) of your final designs.
You must complete all of the assigned experiments and tests, which will help you gather quantitative information to include in your final presentation. The excel spreadsheets for these tests are all available on the course website.
In addition, you must include graphs with information about your speed/distance tests. Plot at least 20 points on a graph with ‘speed’ or ‘distance’ as the y-axis and ‘trail #’ as the x-axis. Also, take video footage during the testing process. This video will be used in your Final presentation.
28
VII. CompetitionDue: See Syllabus
RUNNING THE CONTEST:
1. The race track is the hallway floor outside the Haas Lab or outside room JD1592.
2. Each team contestant will be given three attempts for the speed event and the distance event. The winner will be the team with the highest winning index, which has this formula: winning index = (best time of the class/your best time of the three attempts) + (your longest distance of the three attempts/longest distance of the class). Any ties will be decided by a single run off between the racers which tied.
Deliverable 10: Post Implementation and Review AssessmentTo be Included with Final Design Presentation
Complete a chart comparing your predicted performance outcomes and goals with our actual performance.
In your final design presentation, prepare some slides to discuss How you met, exceeded, or failed to meet your goals and predicted performance
outcomes. What would your team do differently if given more time to modify your designs and
test? Do you feel your designs were successful? Why or why not?
29
VIII. Final PresentationDue: See Syllabus
Final Presentation Requirements
*Read and follow the guidelines in the lecture Oral Communication Skills
The following is an outline of the basic requirements for your Final Design Presentation. Your presentation must include all of these elements, but the order and organization is up to your group. Make sure that the information is presented in a logical way and tells the ‘story’ of your group’s progress. Also make sure that:
All of your slides contain iterative information. (E.g. multiple designs of each prototype, gannt chart changes throughout the semester, changes to group dynamics or roles, etc…)
Vehicle test data is shown visually though a combination of pictures and video and engineering plots.
Labeling is clear. Make sure to label every figure and indicate the context of each slides (e.g. if you have a slide of prototypes, be sure to indicate whether they are distance or speed.)
1. Cover Page, Including:
Title Team members Class name Instructor Department University (Include logo) Date of presentation
2. Agenda
Inform audience as to what is coming up Should not have more than 5 or 6 bullet points
3. Team Contract and Biography
Brief discussion of team members and their roles. Make sure to explain the team structure. Who made decisions, and how? Who performed which role? How did various roles interact throughout the course of the project?
4. Introduction:
30
Problem Statement/Objectives and requirements of the project (time, budget, human resources, design specifications, etc.)
5. Project Management Plan
Project Charter Milestones Updated Gantt and PERT charts (On time, ahead, behind schedule)
6. Main Body:
Definition of working criteria and goals What specific, quantifiable goals do your team with to achieve for speed and distance
vehicles? How did your team set these goals?
Discuss what data is currently available for your problem
Brainstorm and generation of creative ideas Identify controllable variables Basic variable and effect table Calculated performance of basic vehicles Discuss the initial ideas for improving performance of basic vehicles Sketches, computer aided drawings, and/or pictures
Analysis of Potential Solutions Updated 5X5 Risk Matrix Predicted performance and solutions FRDPARRC Table
Development and Testing of Prototypes Summary of 4 concepts
Decision Tables Show your design table Discuss how you decided on each working criteria and weight.
Final Design Present your final design: Sketches, SolidWorks models, and photos including key design
components. Quantitative figures are a must.
Final Test Data
31
Discuss any issues you had in completing your final vehicles. Did you have to modify your planned design?
Post Implementation and Review Assessment Table of predicted performance and actual performance Experimental test data Discuss what you would have done differently
7. Conclusion What did you and your team learn from this project
o Technical skillso Personal, interpersonal, and professional skills
Recommendations for future designs
8. References Include properly cited references. Regardless of which format you use, make sure to be
consistent across all citations.9. Acknowledgements
Include a slide thanking those who helped you throughout the semester (e.g., Personnel at the Machine Shop, Mentors, Industry Contacts).
Page and Presentation Time Limits 15 minutes for presentation, followed by a 5-minute Q&A Approximately 1-2 slides per minute
32