Embed Size (px)
Citation preview

M&E Plan D&P Indonesia
1
M&E plan
Indonesian – Dutch programme on food security:
poultry & dairy sector
Version 28112015
Centre for Development Innovation, Wageningen
UR

M&E Plan D&P Indonesia
2
Abbreviations
CDI Centre for Development Innovation, Wageningen UR
M&E Monitoring and Evaluation
WP Work Package
ASG Animal Sciences Group at WUR, the Netherlands
CVI Central Veterinary Institute at WUR, the Netherlands
DG Director General
DGLAHS Directorate General for Livestock & Animal Health Services, Indonesia
EKN Embassy of the Kingdom of the Netherlands
FAPET Faculty of Animal Science at IPB, Indonesia
FEMA Faculty of Human Ecology at IPB, Indonesia
IPB Institut Pertanian Bogor (Agricultural Institute Bogor)
MSM Maastricht School of Management, the Netherlands
WUR Wageningen University & Research, the Netherlands

M&E Plan D&P Indonesia
3
Contents
Abbreviations ............................................................................................................................ 2
Introduction about the programme ............................................................................................... 4
1. Work Package 1: Consumer awareness .................................................................................. 5
1.1 Theory of Change ........................................................................................................ 5
1.2 Monitoring .................................................................................................................. 7
2. Work package 2: Poultry Processing .................................................................................... 10
2.1 Theory of change ....................................................................................................... 10
2.2 Monitoring ................................................................................................................ 11
3. Work package 3: Poultry farming systems ............................................................................ 16
3.1 Theory of Change ...................................................................................................... 16
3.2 Monitoring ................................................................................................................ 17
4. Work Package 4: Dairy feed improvements ........................................................................... 22
4.1 Theory of change ....................................................................................................... 22
4.2 Monitoring ................................................................................................................ 23
Monitoring and Evaluation ......................................................................................................... 29
Communication and reporting .................................................................................................... 29

M&E Plan D&P Indonesia
4
Food Security
When people have access to sufficient, safe and
nutritious food to maintain a healthy and active life at all
times, we speak of ‘food security’. Commonly, the
concept of food security includes both physical and
economic access to food. The Dutch food security
support foresees outcomes in one or more of the
following areas: (a) sustainable increase in food
production; (b) more efficient markets for agricultural
and food products; (c) improved access to healthy and
safe food; (d) an enabling environment for agribusiness
development.
Introduction about the programme
The Governments of Indonesia and the Netherlands work together on strengthening the food security
situation in Indonesia. This bilateral food security programme centres on the priority commodities
identified by the Indonesian Government, including vegetables, fish, poultry meat and dairy products.
For the latter two commodity sectors the Animal Sciences Group (ASG) of Wageningen University &
Research (WUR) in the Netherlands had prepared a general work plan and cost estimate in September
2013. The Embassy of the Kingdom of the Netherlands in Jakarta (EKN) thereupon contracted ASG to
implement the inception phase of this programme. The inception phase started on 1 November 2013 and
was concluded by the end of March 2014.
The food security programme in the poultry and dairy sectors is implemented in close cooperation with
the Directorate General for Livestock and Animal Health at the Ministry of Agriculture (DGLAH of the
MoA). The focus will be on West Java as main production and sourcing area of dairy and poultry meat
products for Jakarta and other main urban centres. The supply chain partners – comprising input
suppliers, primary producers, processing companies, traders and consumers – will be the main target
groups of this programme. The overall goal of the livestock components of the Dutch – Indonesian
programme on food security and agribusiness development in the livestock sector was formulated as
follows:
⇒ Viable models for domestic production and supply of affordable, nutritious and safe animal-based
products are developed.
With the development and testing of these
models the programme contributes towards
higher income levels of Indonesian
smallholder producers and improved access
to affordable and safe animal protein
products among urban consumers. This is
in line with the overall aims and strategies
of the Indonesian policy on self-sufficiency
in the production of major agricultural
commodities and the Dutch policies on food
security (see
text box).
This programme exists of three work packages (WP):
1. WP 1: Consumer awareness and supply chain initiatives
2. WP 2: Improving poultry processing standards
3. WP 3: Poultry farming systems
4. WP 4: Dairy feed improvements
The following sections describe for each work package (WP) the Theory of Change (ToC) and this will be
monitored. The ToCs have been developed in consultation with the WP leaders. They map how we think
that change happens within the different work packages. A workshop with all WP leaders was held in
order to explore linkages between the work packages and to learn from one another. The ToC for each
WP is first illustrated visually and in the case of WP 1 followed by a narrative explaining the logic from
top to bottom. After the ToC, we outline how results will be monitored within the different work
packages.

M&E Plan D&P Indonesia
5
Increased number of urban
consumers that desire to
consume cooled and
frozen poultry products
Consumer campaign
implemented
Increased consumer
intention to buy
cooled and frozen
poultry products
Middle and higher
income segment of
consumers in
Jakarta region
Increased consumer
awareness of cooled
and frozen poultry
products
Schuttelaar
Directorate of
Veterinary Public
Health at DGLAH
Governorate of DKI
Jakarta
LEI Wageningen UR
IPB FEMA
Indonesian PR
company
Indonesian
consumer
organisation
Accreditation
bodies for halal
certification
Slaughterhouses Retail Associations
Other
stakeholders
Impact
Outcome
Output
Target group
Implementers
Developing the
consumer campaign
Activity
Developing the
communication
plan
Implementing the
consumer
campaignSteering committee
approves consumer
campaign
Government support for the design and
implementation of the campaign
Poultry meat will remain at a
similar price level (in relation to
other food products and
keeping the inflation in mind).Increased number of urban
consumers buy cooled and
frozen poultry meat
Beyond the
scope of
this projectThere will be no scarcity or a
significant food safety crisis;
consumer behaviour will change
during times of food crises.
Consumers participating in the first
consumer survey are easily to be
traced and found for the second
survey
A division of regions for the
consumer Campaign is possible, so
that a group is exposed to the
campaign and another group is not
exposed. This is important to have a
control group.
Impact analysis, including
baseline and endline done on the
impact of the consumer
campaign
Chain parties involved in this project will
succeed in developing a cooled poultry
chain that can deliver cooled poultry meat
(availability & affordability).
Sufficient resources (interviewers
and other professional staff, funds,
IPads for computer aided data
collection and compilation, etc.).
Chain parties involved in this project will
succeed in developing a cooled poultry
chain that can deliver the safety and
quality standards that (future) Indonesian
consumers prefer and produce sufficient
to meet the market demand of Jakarta.
Assumptions
Sphere of interest
Sphere of
influence
Sphere
of
control
Evaluation and
dissemination activities
under this WP
Communication
plan developed
Consumer campaign
developed
Communicate results to relevant
stakeholders
Results communicated to relevant
stakeholders as in input for discussions on
policies, laws and regulations that support
the transition towards consumption of
cooled and frozen poultry meat
Other WP
Consumer survey
done in inception
phase
Baseline and endline
reports
1. Work Package 1: Consumer awareness 1.1 Theory of Change

M&E Plan D&P Indonesia
6
Narrative – Consumer Awareness
Work package 1 will work on increasing awareness of cooled and frozen poultry meat among middle and
higher income consumers in the Jakarta. Awareness is regarded as a precondition for stimulating
intentions to buy cooled and frozen poultry meat. Stronger intentions will contribute an increased
number of consumers will desire cooled and frozen poultry meat. These three determinants of behaviour
are the main focus of WP 1.
It should be noted that the actual buying of cooled and frozen poultry meat is beyond the scope of this
project as this depends largely on availability and pricing of cooled and frozen of poultry meat. The other
components of this project aim to contribute to availability of cooled and frozen poultry meat, though.
Furthermore, it is assumed that once the middle and higher segments buy cooled and frozen poultry, the
lower economic segments will copy this behaviour.
A key output of the WP package is a consumer campaign. The campaign is expected to influence
awareness, intention and desire to consume cooled and frozen poultry meat. The campaign will be
targeting the middle and higher income segment of consumers in the Jakarta region. The campaign will
be based on the insights gained through a consumer survey that was conducted during the inception
project’s inception phase.
The extent of the impact of the consumer campaign on awareness, intention and desire, will be studied
with an impact analysis comparing baseline findings with end-line findings (a before and and after
design).
The findings of the baseline and end-line studies will communicated and discussed with the relevant
stakeholders so that they can be used as input for discussions on policies, laws and regulations that
support the transition towards consumption of cooled and frozen poultry meat (also in other WPs).
For the campaign to lead to awareness, intention and desire for cooled and frozen poultry meat the
following assumptions are relevant:
- Chain parties involved in this project will succeed in developing a cooled poultry chain that can
deliver cooled poultry meat (availability & affordability).
- Chain parties involved in this project will succeed in developing a cooled poultry chain that can
deliver the safety and quality standards that (future) Indonesian consumers prefer and produce
sufficient to meet the market demand of Jakarta.
The implementing partners of the campaign are: LEI Wageningen UR; Schuttelaar; IPB FEMA;
Indonesian PR company and an Indonesian Market Research company.
Other relevant stakeholders include the Indonesian consumer organisation, retail associations,
producers organisations, directorate of veterinary public health at DGLAH, association of
slaughterhouses, governorate of DKI Jakarta, governates in the direct surroundings of Jakarta and the
accreditation bodies for halal certification.

M&E Plan D&P Indonesia
7
1.2 Monitoring NUMBER RESULTS VERIFIABLE
INDICATORS MEANS OF VERIFICATION WHO IS
RESPONSIBLE WHEN REQUIRED
BUDGET
Outcome 1 Increased consumer awareness of cooled and frozen poultry meat (=outcome “consumer awareness on food safety and quality of poultry meat increased” in MoC; food safety and quality has been replaced by cooled and frozen based on research
during inception phase)
Awareness of cooled and frozen poultry meat among middle and higher segment of urban consumers
Awareness Intention Desire (Action) (AIDA) study Activity Impact analysis, including baseline and endline done on the impact of the consumer campaign
Questionnaire to be developed in WP 1 - Gemma
Baseline: October 2015 Endline: December 2016
Already budgeted in WP 1
Outcome 2 Increased intention to buy cooled and frozen poultry meat among consumers (= linked to outcome indicator “increased number of urban consumers demand safe poultry products” in MoC) (= related to impact indicator “consumption
levels of quality dairy and poultry meat among poor segments of urban consumers increased” in MoC)
Intention to buy cooled and frozen poultry meat among middle and higher segment of urban consumers
AIDA study Activity Impact analysis, including baseline and endline done on the impact of the consumer campaign
Questionnaire to be developed in WP 1 - Gemma
Baseline: October 2015 Endline: December 2016
Already budgeted in WP 1
Outcome 3 Increased number of urban consumers that desire to consume cooled and frozen poultry products (= outcome indicator
“increased number of urban consumers demand safe poultry products” in MoC)
Perceptions (desire) of cooled and frozen poultry meat among middle and higher segment of urban consumers
AIDA study Activity Impact analysis, including baseline and endline done on
the impact of the consumer campaign
Questionnaire to be developed in WP 1 - Gemma
Baseline: October 2015 Endline: December
2016
Already budgeted in WP 1

M&E Plan D&P Indonesia
8
NUMBER RESULTS VERIFIABLE INDICATORS
MEANS OF VERIFICATION WHO IS RESPONSIBLE
WHEN REQUIRED BUDGET
Output 1
Consumer campaign implemented (= output indicator
“consumer education and awareness campaign developed and implemented in MoC) (=related to outcome “improved marketing systems in respective supply chains”) Activity Implement consumer campaign
Publication of the campaign
Review of publication of the campaign
Steering committee approves consumer campaign
Gemma October 2015 – November 2016
No budget required to check whether
this has been published
Output 2
Consumer campaign developed (= output indicator “consumer education and awareness campaign developed and implemented in MoC) Activity Develop consumer campaign
Consumer campaign ready to be implemented
Review of consumer campaign materials to be launched
Gemma September-October 2015
No budget required to check whether this has been developed
Output 3
Communication plan developed (= needed for output indicator “consumer education and awareness campaign developed and implemented in MoC) Activity
Develop communication plan
Communication plan Review of communication plan document
Gemma March – September 2015
No budget required to check whether this has been developed

M&E Plan D&P Indonesia
9
NUMBER RESULTS VERIFIABLE INDICATORS
MEANS OF VERIFICATION WHO IS RESPONSIBLE
WHEN REQUIRED BUDGET
Output 4
Consumer survey on purchasing behaviour of poultry meat done
(= related to output indicator “better understanding of consumer behaviour”)
Consumer survey done Report on consumer survey Gemma January 2014 (during inception
phase)
No budget required to check whether
this has been done
Output 5
Baseline and endline report on impact analysis of the consumer campaign Activity Impact analysis including
baseline and endline done on the impact of the consumer campaign
Baseline and endline report finished
Review of baseline report Gemma Baseline report: ready by November 2015 Endline
report: ready by end of project
Already budgeted in WP 1
Output 6
Results communicated to relevant stakeholders (= linked to outcome indicator “policies, laws and regulations implemented that support the transition towards a safer poultry
production and consumption based on documentation and dialogue” in MoC) Activity Communicate results of impact analysis to relevant stakeholders
Joint closing meeting of the project (not budgeted for in WP1) with relevant stakeholders.
Minutes of meeting Frank End of the project
Overall project budget

M&E Plan D&P Indonesia
10
2. Work package 2: Poultry Processing
2.1 Theory of change

M&E Plan D&P Indonesia
11
2.2 Monitoring NUMBER RESULTS VERIFIABLE
INDICATORS MEANS OF VERIFICATION WHO IS
RESPONSIBLE WHEN REQUIRED
BUDGET
Impact 1 Reduction of poultry slaughtering pollution in the city (= linked to impact indicator “reduced poultry meat related food safety incidence” in MoC) (=linked to outcome indicator “Increased animal welfare and food safety in the broiler sub-sector in West Java”)
# and kind of reported incidents of poor food safety at slaughter houses at wet markets in Jakarta
Food surveillance inspection reports from public health inspectors in Jakarta
Frank and Peter will meet with Governor to see who is responsible for data collection and reporting what kind of data is being collected in Jakarta - September, 2015
Baseline: September tbd Endline: June 2017
To be defined
Impact 2 Increased quantity of poultry meat marketed (retail) that meets food safety standards (= impact: “urban consumers access to safe animal protein products increased” in MoC) (=outcome indicator “More poultry meat marketed that meet safe certified standards” in MoC) (= related to impact indicator “consumption levels of quality
dairy and poultry meat among poor segments of urban consumers increased” in MoC) (=related to outcome “improved marketing systems in respective supply chains”)
Volume of certified poultry products leaving participating slaughterhouses
Collect and review records from participating slaughterhouses
Peter to organise collection and review records slaughterhouses and report
Baseline: once slaughterhouses are selected Endline: June 2017
Review records: tbd
Outcome 1 (NKV =
Veterinary Public Health Authority)
Improved waste management and good hygienic practices in the slaughter plant (e.g. handling of ice for cooling)
(=output “improved poultry processing standards and practices (safety and quality)” in MoC) (= linked to output indicator “Policies, laws and regulations implemented that support the transition towards a safer poultry production and consumption
Number of NKV certificates issued to participating slaughterhouses
# participating slaughterhouses that render blood and have waste water treatment Number of water treatment plants
Review records NKV participating slaughterhouses Visits to participating
slaughterhouses to survey and observe current processing practices
NKV collect info from contact provincial veterinary public health
authority and report on this Peter to organise visits and interviews of managers (survey) Peter to describe
Baseline: once participating slaughterhou
ses are selected Endline: June 2017
Review NKV records: tbd Observation
visits and survey: tbd

M&E Plan D&P Indonesia
12
NUMBER RESULTS VERIFIABLE INDICATORS
MEANS OF VERIFICATION WHO IS RESPONSIBLE
WHEN REQUIRED BUDGET
(based on documentation and dialogue)” in MoC)
installed at participating slaughterhouses
# participating slaughterhouses whose waste is re-used (collected)
processing practices incl. waste (water) treatment based on
data collected and report
Outcome 2 Improved skills and knowledge among slaughterers at pilot facilities (=linked to output indicator “approaches and capacities for
promoting food safety standards are in place in Western Java” in MoC)
Skill and knowledge improvement needs reported by participating slaughter plants
# of trained slaughterhouse staff (managers and employees) that show improved skill and knowledge
SWOT analysis (visits to participating slaughterhouses to survey and observe current processing skill and knowledge)
Evaluation of training (evaluation forms) Visits to participating slaughterhouses to survey and observe processing skill and knowledge
Ferry to report on SWOT analysis (Richard Merxs) Ferry to organise evaluation of
training and report Peter to organise visits and interviews of managers (survey) Peter to describe processing skill and knowledge and report
Baseline: once participating slaughterhouses are
selected Immediately after training: once staff members are trained Endline: June 2017
SWOT analysis: Evaluation of training:
Observation visits and survey: tbd
Outcome 3
Improved insights among
government (nat, prov, loc) in economic, environmental and chain consequences of modernising slaughtering practices (=linked to output indicators “better understanding of socio-economic drivers of current practices” in MoC) (= linked to output indicator “Policies, laws and regulations
implemented that support the transition towards a safer poultry production and consumption (based on documentation and dialogue)” in MoC)
Level of
understanding of employment, costs, income, logistics, blood/water pollution of modernising practices among key government officials
Interviews with government
officials at different levels (national, province, district)
Ferry to organise 3-
4 interviews Ferry to describe insights and report
Mid-term:
September 2016
Interviews
officials: tbd

M&E Plan D&P Indonesia
13
NUMBER RESULTS VERIFIABLE INDICATORS
MEANS OF VERIFICATION WHO IS RESPONSIBLE
WHEN REQUIRED BUDGET
Outcome 4 Improved skills and knowledge among advisors and inspectors (= output indicator “approaches
and capacities for promoting food safety standards are in place in Western Java” in MoC)
Skill and knowledge improvement needs reported by
Department /Ministry
Evaluation of training (evaluation forms)
Peter to organise evaluation of training and report
Immediately after training: once staff
members are trained
Evaluation of training:
Output 1
Management of slaughterer plants have received advice and business support (= linked to output indicator “realistic and competing supply models developed for hygienic slaughtering practices”
Activity Advice on hygiene, waste management and management of a slaughter plant
# of managers of slaughterer plants that have received advice on hygiene and waste # of managers of slaughterer plants
that have received business plan support
Reports from advice meetings and business plans reviews
Ferry & Peter September 2016, 2017
Output 2 Business plans for small and medium slaughterhouses (linked to outcome indicator “Economic viability of improved practices in broiler sub-sector” in
MoC) (=linked to output indicator “realistic and competing supply models developed for hygienic slaughtering practices” in MoC) Activity Asking 5/6 slaughterhouses what they want/need support with Developing business plans for specific slaughter plants
# of business plans developed by poultry slaughter plants
Business plans documents
Ferry September 2016
Output 3
Knowledge development with BPPT (=linked to output indicator “evidence based models documented and innovations brought to scale”)
Memorandum of Cooperation Reports/presentations on BPPT tested waste improvements
Review MoC & other documents
Peter September 2016
M&E Plan D&P Indonesia
14
NUMBER RESULTS VERIFIABLE INDICATORS
MEANS OF VERIFICATION WHO IS RESPONSIBLE
WHEN REQUIRED BUDGET
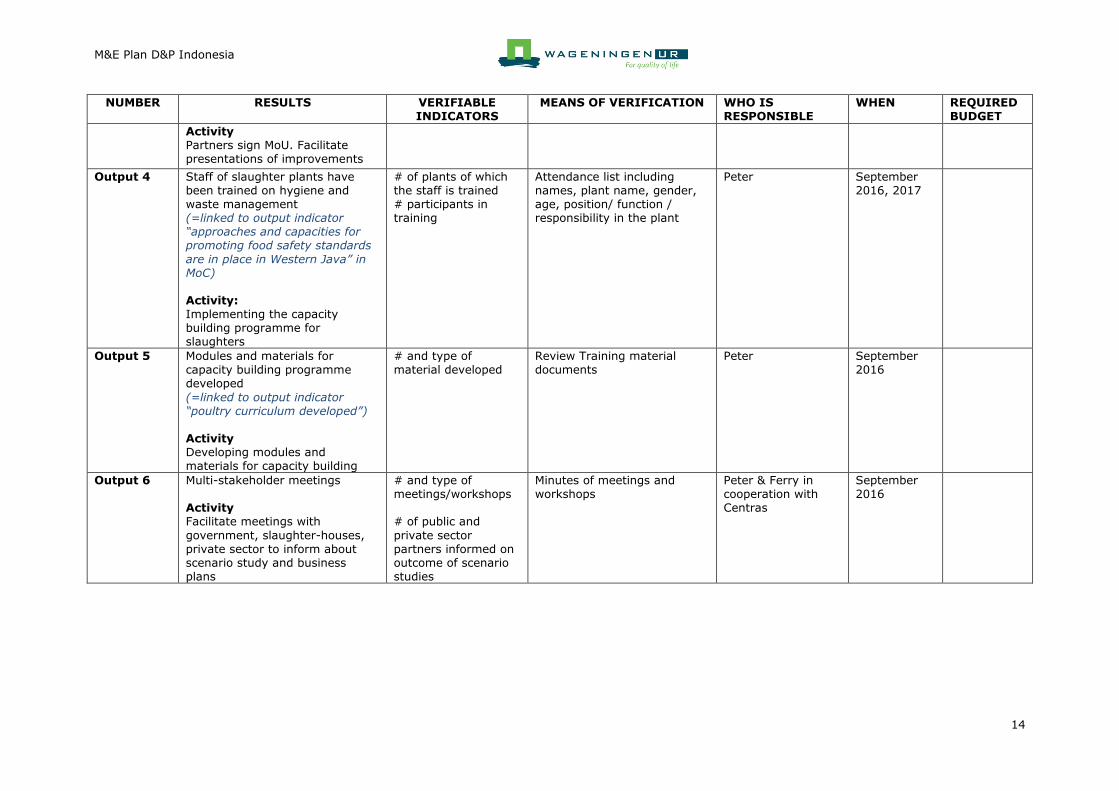
Activity Partners sign MoU. Facilitate presentations of improvements
Output 4 Staff of slaughter plants have been trained on hygiene and waste management (=linked to output indicator “approaches and capacities for promoting food safety standards
are in place in Western Java” in MoC) Activity: Implementing the capacity building programme for slaughters
# of plants of which the staff is trained # participants in training
Attendance list including names, plant name, gender, age, position/ function / responsibility in the plant
Peter September 2016, 2017
Output 5
Modules and materials for capacity building programme developed
(=linked to output indicator “poultry curriculum developed”) Activity Developing modules and materials for capacity building
# and type of material developed
Review Training material documents
Peter September 2016
Output 6
Multi-stakeholder meetings Activity Facilitate meetings with
government, slaughter-houses, private sector to inform about scenario study and business plans
# and type of meetings/workshops # of public and
private sector partners informed on outcome of scenario studies
Minutes of meetings and workshops
Peter & Ferry in cooperation with Centras
September 2016

M&E Plan D&P Indonesia
15
NUMBER RESULTS VERIFIABLE INDICATORS
MEANS OF VERIFICATION WHO IS RESPONSIBLE
WHEN REQUIRED BUDGET
Output 7 Scenario study including policy advice about improvement of the poultry meat supply chain
(=linked to output indicators “better understanding of socio-economic drivers of current practices” Activity Studying different scenarios for their impact on employment, costs, transport and environment
Results of scenario study are captured in a presentation or
report
Scenario study report presented to steering committee
Ferry
September 2015
Output 8
District advisors of food safety control authority (NKV) trained Activity Training inspectors and auditors of food safety control authority (NKV)
# and type / level of Staff trained by age and gender
Attendance list including names, department, gender, age, position/ function / responsibility in the department
Peter September 2016, 2017
Output 9
Provincial inspectors of food safety control authority (NKV) trained
Activity Training inspectors and auditors of food safety control authority (NKV)
# and type / level of Staff trained by age and gender
Attendance list including names, department, gender, age, position/ function /
responsibility in the department
Peter September 2016, 2017

M&E Plan D&P Indonesia
16
3. Work package 3: Poultry farming systems
3.1 Theory of Change

M&E Plan D&P Indonesia
17
3.2 Monitoring NUMBER RESULTS VERIFIABLE INDICATORS MEANS OF VERIFICATION WHO IS
RESPONSIBLE WHEN REQUIRED
BUDGET
Impact 1
Increase in broiler farmers’ income from broiler business for selected broiler farms
(=similar to impact “Increase in dairy and broiler farm households’ income” as in MoC) (=linked to impact indicator “Increased annual farm income over the year”)
Estimate of annual income of the broiler farm (based on feed margin per 100 broilers
per round)
Baseline among selected broiler farmers through data recording sheet.
After implementation of new elements or concept, experimental houses and control houses will be followed using the data recording sheets.
Medion (farm supervisors with broiler farmers -
collect data) WUR assist development form and data analysis
Baseline: 2015 Q3
After intervention: 2016 Q4
Subresult 1.3 and 1.6
Outcome 1
Improved productivity and animal welfare in poultry production farming systems
(=similar to outcome “Improved productivity of poultry and dairy production farming systems” in MoC) (=linked to “50% of broiler farmers trained and supported by the programme will have a >30% productivity increase”)
Percentage of broiler farmers trained and supported by the
programme that has a productivity increase Productivity increase indicators: 1. feed conversion ratio 2. Body Weight at earlier
age 1. body weights sat laughter
age 3. profits 4. costs Animal welfare indicators:
1. Broiler temperatures 2. mortality
Baseline among selected broiler farmers through data recording sheet.
After implementation of new elements or concept, experimental houses and control houses will be followed using the data recording sheets.
Medion (farm supervisors with broiler farmers -
collect data) WUR assist development form and data analysis
Baseline: 2015 Q3
After intervention: 2016 Q4
Subresult 1.3 and 1.6
Outcome 2
Improved poultry production practices (=output “improved smallholder poultry production practices” in MoC) (=output in MoC and indicator of the outcome “improved marketing systems in the
respective supply chains”)
# trained farmers that apply Animal Focused Management (AFM)
Review if the forms for animal behaviour observations are filled in correctly
Sander Medion farm supervisors with broiler farmers
Baseline: 2015 Q3 After intervention: 2016 Q4

M&E Plan D&P Indonesia
18
NUMBER RESULTS VERIFIABLE INDICATORS MEANS OF VERIFICATION WHO IS RESPONSIBLE
WHEN REQUIRED BUDGET
Outcome 3 Increased commercial uptake of
improved broiler house model (related to indicator of the outcome “Enhanced sustainability in the broiler and dairy sub-sectors” in the MoC) (=linked to “increased number of farmers part of effective and economically viable supply chain arrangements in dairy and poultry sectors” in MoC?) (=linked to outcome indicator
“economic viability of improved practices in broiler sector is proven’ in MoC) (=related to outcome “improved marketing systems in respective supply chains”)
# of farms that adopt the
model in 2016-17
Sales and client records Medion
Phone survey broiler farms
Medion with
assistance from WUR
2017 TBD
Outcome 4 Increased insight into effective innovations in broiler farming practices (broiler farm model) (=linked to output indicator
“best practices are developed and analysed”) (=linked to outcome indicator “economic viability of improved practices in broiler sector is proven’ in MoC)
Documentation on innovations # and types of visitors at Medion pilot farm
Review documentation Register visits and keep recording
Sander Medion
2017 throughout
tbd
Outcome 5 Increased AFM knowledge and skill among selected broiler farmers (= a step in between the
outcome “farmers selling broiler farmers according to GAP standards”)
# of trained broiler farmers that show improved skill and knowledge after training
Assessment of knowledge by means of a knowledge test before and after training for broiler farmers
Sander, Medion PTC+
Before and after training
Linked to Subresult 3.1
Outcome 6 Increased capacity to support innovations by broiler farms among private and public service providers
# of trained trainers # of relevant graduates from targeted vocational training institutes
Review records ToT Review records targeted vocational training institutes
Medion Participating training institute
2017 tbd
Outcome 7 Improved vocational training # participating vocational training institutes
Records participants Sander 2017 tdb

M&E Plan D&P Indonesia
19
NUMBER RESULTS VERIFIABLE INDICATORS MEANS OF VERIFICATION WHO IS RESPONSIBLE
WHEN REQUIRED BUDGET
Output 1 Report on results of prototype
farms (= output indicator of “improved information for supply chain partners and support organisations in the broiler and dairy sub-sectors” in MoC) output indicator “best practices are developed and analysed” in MoC)
(=linked to output indicator “evidence based models documented and innovations brought to scale”)
Activity: Evaluate outcome of prototype
pilot broiler farms
Reports with data available
on: • Financial return on
investment • Mortality rates • FCR • Weight of broilers at
slaughter age • Animal health indicators • Productivity indicators
Individual reports to each
participating broiler farmer Report with overall results
Sander, Medion 2016 Q3
Q4
Subresult
1.8
Output 2 Broiler house prototypes constructed Activity: Construction of broiler house prototypes at selected broiler farms
Permits issued Building is completed
Review records on permits Review records on building plans Observations
Medion 2016 Q3 tbd
Output 3 Report on improved design of broiler house Activity: Assess current performance among selected broiler farms
Report approved by partners Report approved by partners Sander , medion 2016 Q2 tbd
Output 4 Broiler farm managers at selected broiler farms trained in AFM
(=linked to output indicator “broiler farmers trained in GAP+” in MoC � where GAP
has been replaced by AFM) Activity: Train broiler farmers
# of participating broiler farmers trained
Reported satisfaction with training trainees
Attendance list including names, name of employer / business, gender, age, position/
function / responsibility Satisfaction questionnaire among trained broiler farmers (survey monkey)
Medion 2015 Q3- 2016 Q4
Linked to subresult 3.1

M&E Plan D&P Indonesia
20
NUMBER RESULTS VERIFIABLE INDICATORS MEANS OF VERIFICATION WHO IS RESPONSIBLE
WHEN REQUIRED BUDGET
Output 5 Individual business innovation
plan for selected broiler farms developed (=linked to outcome indicator “increased number of farmers part of effective and economically viable supply chain arrangements in poultry sector” and “economic viability of improved practices in broiler sector is proven’ in MoC)
Activity: Develop business innovation plans with selected broiler farmers
# of individual business
plans developed # business plans with cost estimate of improvements
Review business plans Sander, Medion 2016 Sub result
1.4 Linked to subresults 2.3; 2.4; 2.5
Output 6 Report on broiler farmer capacity development needs (=linked to output indicator “better understanding of socio-economic and financial drivers for current practices”)
Activity: Assess current performance among selected broiler farms
Approved report on need assessment of farms
Review and approval by project partners
Sander, Medion 2015 Q3 tbd
Output 7 Trainers trained Activity: Train trainers of broiler farmers
# of trainers trained Reported satisfaction with
training trainees
Attendance list including names, name of employer / business, gender, age, position/ function / responsibility Satisfaction questionnaire among trained broiler farmer
trainers (survey monkey)
Sander, Medion 2016 tbd

M&E Plan D&P Indonesia
21
NUMBER RESULTS VERIFIABLE INDICATORS MEANS OF VERIFICATION WHO IS RESPONSIBLE
WHEN REQUIRED BUDGET
Output 8 Specific ToT and materials for
broiler farming developed (=linked to output indicator “poultry curriculum developed”) Activity: Develop broiler farmer training of trainers modules and materials
Approved training materials
Practical broiler farming guide for general use
Review and approval by project
partners
Sander, Medion 2016 Q3-
2017Q2
Sub result
3.3
Output 9 Report on broiler farming
service providers capacity development needs Activity: Assess current capacity development needs among selected training broiler farming service providers (private and public)
Approved report on need
assessment of farms
Review and approval by project
partners
Sander 2015 Q3 tbd
Output 10 Specific modules on animal
focused management (AFM) materials for broiler farming developed Activity: Develop broiler farmer training of trainers modules and materials
Approved training program
Training material includes a scoring lists for AFM parameters
Review and approval of training
materials
Sander 2015 Q3 –
2016 Q4
Linked to
subresult 3.1
Output 11 Report on need for improvements in curriculum of
vocational training institutes Activity: Assess current curriculum of vocational training institutes
Approved report on assessment of curriculum of
vocational training institutes
Review and approval by project partners
Sander 2016 tbd

M&E Plan D&P Indonesia
22
4. Work Package 4: Dairy feed improvements
4.1 Theory of change

M&E Plan D&P Indonesia
23
4.2 Monitoring NUMBER RESULTS VERIFIABLE
INDICATORS MEANS OF
VERIFICATION WHO IS RESPONSIBLE
WHEN REQUIRED BUDGET
Impact 1
Increase in dairy farm households’ income (=similar to impact “Increase in dairy and broiler farm households’ income” as in MoC) (=linked to impact indicator
“Increased annual farm income over the year”)
gross revenue : Annual income from milk sales of farmers in selected farmer groups
Data (amount of milk * milk price) from dairy coop on milk sales from farmers in selected farmer groups
WUR-LR/TNI: Data to be collected and processed by field officers
Baseline: 2015 specific month End-line: 2017 specific month
Estimated base- and end-line plus evaluation : €108.000
(=linked to impact indicator “level of investment in farming system”)
net income: Gross margin (IDR) Milk minus Feed = Milk revenue – total feed costs (including feed costs of non-producing animals) of farms in selected farmer groups
Data (feed costs and income from milk sales) from dairy coop on feed purchases and milk sales Farm survey among
selected farmers
WUR-LR/TNI: Data to be collected and processed by field officers WUR-LR/TNI: Third party implementing survey
Baseline: 2015 specific month End-line: 2017 specific month
See impact 1 above
Total net income: Net income from dairy farming on demo farms
Data on all costs and income from dairy farming captured in farm accounts kept by demo farmers
WUR-LR/TNI: Data to be collected and processed by field officer
Baseline: 2015 specific month End-line: 2017 specific month
Part of project implemen-tation cost
Outcome 1
Improved cow productivity (=similar to impact “Increase in
dairy and broiler farm households’ income” as in MoC)
Average kg milk per cow per day on farms in
selected farmer groups
Data (average amount of milk
delivered/ no of cows in milk) from dairy coop Farm survey among selected farmers
WUR-LR/TNI: Data to be collected and
processed by field officer WUR-LR/TNI: Third party implementing farm survey
Baseline: 2015 specific month
End-line: 2017 specific month
See impact 1
(linked to outcome “improved productivity of poultry and dairy production farming systems”) (=linked to outcome indicator
“>25% higher and more consistent level of milk production per cow”)
Average milk production per cow per day on selected demo farms (9*2 farms)
Data collected by means of milk production recording at farm level
WUR-LR/TNI: Data to be collected and processed by field officer
Monthly records
Part of project implemen-tation cost

M&E Plan D&P Indonesia
24
NUMBER RESULTS VERIFIABLE INDICATORS
MEANS OF VERIFICATION
WHO IS RESPONSIBLE
WHEN REQUIRED BUDGET
Average reproduction status of cows on selected demo farms (9*2 farms)
Data to be collected from breeding records to be kept at farm
level
WUR LR/TNI: Data to be collected and processed by field
officer
to be processed annually
Part of project implemen-
tation cost
Outcome 2
Improved feeding practices adopted (=linked to outcome indicator “improved feed rations adopted by >50% of dairy farmers at cooperatives or in farmers groups included in the programme”)
No of farmers who adopted improved feeding practices (including improved rations) in selected farmer groups
Farm survey WUR-LR/TNI: Third party implementing farm survey
Baseline: 2015 specific month End-line: 2017 specific month
See impact 1
(=linked to outcome indicator “improved fodder supplies used by >50% of farmers at cooperatives or in farmers’ groups included in the programme”)
Types of improved feeding practices (e.g. concentrate feed utilization; use of improved foragers, better crop residue utilization) adopted in selected farmer groups
Farm survey WUR-LR/TNI: Third party implementing farm survey
Baseline: 2015 specific month End-line: 2017 specific month
See impact 1
Number of farmers using the improved quality
concentrate feeds in selected farmer groups
Farm survey WUR-LR/TNI: Third party implementing
farm survey
Baseline: 2015 specific month
End-line: 2017 specific month
See impact 1
Types (quality) of specific concentrates used on farms in selected farmer groups
Farm survey WUR-LR/TNI: Third party implementing farm survey
Baseline: 2015 specific month End-line: 2017 specific month
See impact 1
(=linked to outcome indicator “higher nutritional value of feed
rations for dairy cattle”)
Types (quality) of rations fed to different categories
of cows (on the demo farms (2*9))
Recording and analysis of data of
regular weighing and sampling of rations (quality assessment)
WUR-LR/TNI: Data to be collected and
processed by field officer
monthly Part of project
implemen-tation cost
Outcome 3
Economic viability of improved rations are proven (=related to outcome indicator “economically viable supply chain arrangements in dairy and poultry sectors”)
Feed costs (fodder/ concentrate) per kg milk Margin: Income from milk- feed costs
Review of records of feed and milk production and financial accounts at demo farms
WUR-LR/TNI: Data to be collected and processed by field officer
2015, 2016, 2017 Part of project implemen-tation cost

M&E Plan D&P Indonesia
25
NUMBER RESULTS VERIFIABLE INDICATORS
MEANS OF VERIFICATION
WHO IS RESPONSIBLE
WHEN REQUIRED BUDGET
Outcome 4
Improved fodder supply and fodder management (=linked to output ”Increased
high quality fodder production and supply”) (=linked to output indicator “pilots implemented; improved fodder supply (including through new area forage production, improved cultivation& utilisation”)
Quality of fodder produced and processed based on scores on quality tests and
productivity data of new forage species, quality of crop residues, silage in selected farmer groups
Reports of testing results
WUR-LR/IPB Data to be collected and processed by IPB -
FAS
2016, 2017 Part of project implemen-
tation cost
Cost fodders (new forages, silage) per kg
Cost analysis WUR-LR/ IPB (data to be collected and
analysed)
2016, 2017 Part of project
implemen-tation cost
(=linked to outcome indicator pilots implemented: “improved fodder supply”)
Amount of fodder produced and fed at the demo farms
Analysis of production and feeding
WUR-LR: Data to be collected and processed by field officers
2015, 2016, 2017 Part of project implemen-tation cost
# farms where fodder management takes pace:
inputs and outputs in relation to fodder production on demo farms are monitored
Recording of measurements at
demo farms
WUR-LR: Data to be collected and
processed by field officers
2015, 2016, 2017 Part of project
implemen-tation cost
Outcome 5
Improved concentrate supply (=linked to outcome “increased quality and availability of complete feed supplies for dairy farms”)
Quality test results of improved concentrate feed production (by different types)
Reports of feed test results and production
TNI in cooperation with coop and partners
2015-2017 Part of project implemen-tation cost
(=linked to output indicator improved feed available, farm tested and evaluated”
Amount of concentrate produced by cooperative (by types)
Analysis of production by cooperative
WUR-LR/TNI: Data to be collected at coop
2015, 2016, 2017 Part of project implemen-tation cost
Outcome 6
Economic viability of production of good quality concentrate (=linked to output indicator
“viable supply chain for good quality feed supply organised”)
Income from concentrate sales versus concentrate marketing and production
costs at coop level
Calculations of costs and revenues
TNI (data to be collected by field officer)
2015- 2017 Part of project implemen-
tation cost

M&E Plan D&P Indonesia
26
NUMBER RESULTS VERIFIABLE INDICATORS
MEANS OF VERIFICATION
WHO IS RESPONSIBLE
WHEN REQUIRED BUDGET
Outcome 7
Improved supply of ingredients for concentrate feed
Availability of raw materials secured
Contracts with suppliers
TNI 2015, 2016, 2017 Part of project implemen-
tation cost
Quality test of raw materials
Reports of testing results: proximate analysis, energy Ca, P, aflatoxin level
TNI (in cooperation with field officer, Master Lab)
Part of project implemen-tation cost
Compare cost per feed nutrient unit: - IDR/gram Crude Protein
(by DM) - IDR / K Cal ME
Nutrition cost analysis TNI (data from Master lab and dairy coops)
2015, 2016, 2017 Part of project implemen-
tation cost
Outcome 8
Increased knowledge of extension workers and staff feed production regarding feeding dairy cattle and feed production linked to output “improved information for supply chain partners and support
organisations in the broiler and dairy sub-sectors”)
Reported use of training insights among extension staff and feed plant staff
Survey among trainees
WUR-LR/TNI: Third party implementing farm survey
2017
See impact 1
Level of knowledge about basic feeding principles and feed formulation and production among extension staff and feed plant staff
Trainee self-assessment of knowledge by means questionnaire
WUR-LR /TNI 2015/6 before and after training
Part of project implemen-tation cost
Outcome 9
Increased knowledge of farmers regarding feeding dairy cattle and feed production (linked to output “improved information for supply chain partners and support organisations in the broiler and dairy sub-sectors”)
Level of knowledge with farmers on improved feeding practices increased
Self-assessment in the farm survey among farms in selected farmer groups
WUR-LR/TNI: Third party implementing farm survey
2015 and 2017
See impact 1

M&E Plan D&P Indonesia
27
NUMBER RESULTS VERIFIABLE INDICATORS
MEANS OF VERIFICATION
WHO IS RESPONSIBLE
WHEN REQUIRED BUDGET
Output 1
Feasibility system for small scale commercial fodder production
A fodder production system initiated as pilot and introduced by partners
if economic feasibility is proven
Minutes of progress meetings with partners
WUR-LR 2017 Part of project implemen-
tation cost
Output 2
System for improved quality control of raw materials and end products of concentrate
A concentrate quality control system developed accepted and introduced by partners
Minutes of progress meetings with partners
TNI 2017 Part of project implemen-tation cost
Output 3
Feasibility studied for improvement of facilities
concentrate feed production (=linked to output indicator “better understanding of socio-economic and financial drivers for current practices”)
Feasibility study implemented
Report TNI/Ottevanger/ LEI?
2016 Part of project
implemen-tation cost
Output 4
Better sourcing of crop-residues developed
Crop residue sourcing improved and applied
Minutes of progress meetings with partners
WUR-LR 2017 Part of project implemen-tation cost
Output 5
Fodder conservation introduced (silage making)
A fodder conservation system accepted and introduced by partners
Minutes of progress meetings with partners
WUR-LR 2017 Part of project implemen-tation cost
Output 6
Training materials Modules and materials for capacity building of KUD extension workers and dairy farmers on improved dairy feeding practices and
feed production for feed plant staff
Review and use of existing and newly developed materials
WUR-LR/TNI 2015-2017 Part of project implemen-tation cost
Output 7
Staff feed production of dairy coop trained
Number of staff trained Attendance records by subject – should be kept by the cooperative
TNI 2015 thru 2017
Part of project implemen-tation cost
Output 8
Training of field officer, feed
advisor, local DINAS staff
Number of field officer,
feed advisor, local DINAS staff trained by subject
Attendance records
by subject
WUR-LR/TNI 2015 thru 2017
Part of
project implemen-tation cost

M&E Plan D&P Indonesia
28
NUMBER RESULTS VERIFIABLE INDICATORS
MEANS OF VERIFICATION
WHO IS RESPONSIBLE
WHEN REQUIRED BUDGET
Output 9
Training of demo farmers Number of demo farmers trained by subject
Attendance records by subject
WUR-LR 2015 thru 2017
Part of project implemen-
tation cost
Output 10
Farmers of selected farmer groups trained
Number of farmers trained by subject
Attendance records by subject
WUR-LR 2015 thru 2017
Part of project implemen-tation cost
Output 11
Farmers of other farmer groups of Dairy coop trained
Number of farmers trained by subject
Attendance records by subject
WUR-LR 2015 thru 2017
Part of project implemen-
tation cost
Output 12
Seminar to disseminate results feed pilots to other dairy coops and stakeholders (=linked to output indicator “better understanding of socio-economic and financial drivers for current practices”)
No of seminars No and types of attendees
Attendance records WUR-LR 2017 Part of project implemen-tation cost
Output 13
Meetings Dairy Cattle Feed Round Table Group to exchange and coordinate with other feed related projects (=linked to output indicator “better understanding of socio-economic and financial drivers for current practices”)
No of meetings No and types of attendees
Attendance records WUR-LR 2016 Part of project implemen-tation cost

M&E Plan D&P Indonesia
29
Monitoring and Evaluation
The results table above provide an overview of how results will be monitored. In some cases this still
needs to be accompanied by dedicated budgets. Each WP is responsible for monitoring its own results.
The reason for this is that we regard monitoring of project results as part of the work package
management responsibilities. The main purpose of monitoring is to steer the implementation process and
to inform all partners on performance. The project manager keeps oversight on this and supports where
necessary.
The main purpose of evaluation is to adjust and improve the projects strategy. It also aims to stimulate
learning by sharing insights within and outside the partnership. For this purpose the project will
undertake an internal Midterm review. This review will be coordinated by the M&E team. A peer review
mechanism will be used to review each other’s strategies and performance. This will be done in a one
day workshop and 1 day preparation by each key team member second half of 2016.
It involves reviewing the logic explained in the Theory of Change (see the previous sections) and
adapting the theory and / or the implementation of the project. During the review stakeholders will
reflect on the following questions:
i. What are the main successes in relation to the issue being monitored during the last half year?
Why?
ii. What are the main challenges in relation to the issue being monitored during the last half year?
Why?
iii. What should be done differently in the future by i) you as a stakeholder; and ii) the project as a
whole? Why? And what has priority?
iv. What advice would you give to someone else trying to do the same things in another area from
the lessons you have learnt?
As part of the end-evaluation of the project, the peer review will be repeated at the end of the project,
mid 2017. In addition, the EKN might hire an external evaluator to conduct an end-of project evaluation.
Each review will result in a user-friendly report that may also be shared outside the partnership. The
M&E team will be responsible for managing the review and the review report.
Communication and reporting
Internal communication within the project team
The project team communicates internally per email, telephone, face-to-face meetings and progress
meetings every few months to update each other on new developments. To share final documents a
google drive folder is used. The project manager is responsible for ensuring M&E information is properly
shared internally.
External communication to other stakeholders / the outside world.
The M&E information collected by the different stakeholders can only be used for the intended purposes if
it is appropriately reported, shared, or communicated to the stakeholders of the Dairy and Poultry
project. The M&E findings of the project could be communicated to all or certain stakeholder groups for
accountability, decision-making as well as knowledge sharing and learning purposes. The project
manager is responsible for coordinating sharing of M&E information externally.

M&E Plan D&P Indonesia
30
Reporting
In order to ensure that reporting requirements are fulfilled; it is important to try and avoid
overburdening the different individuals and organizations that will be involved. Subsequently,
considerable effort should be made to align the project reporting requirements with existing
requirements. Furthermore, reporting on the project should be kept to a minimum and focus only on the
very essential information relating to a particular time period. In line with the overall purpose and
principles of the M&E system; reporting should not be one-way. The project manager is responsible for
ensuring M&E information is properly reported.
Other Communication Mechanisms
Reporting is only one form in which information and knowledge can be communicated. It is highly
beneficial to also use other forms of communication for different audiences. For example; posters,
brochures, videos, radio, social media and events – all of which can have much more impact than
reports. It is recommended that the dairy and the poultry components each discuss internally how to
organise this and to organise a seminar at the end of the project to share main lessons learnt in a
broader setting.