Embed Size (px)
Citation preview

http://d3s.mff.cuni.czCrash Dump Analysis 2015/2016
CHARLES UNIVERSITY IN PRAGUE
faculty of mathematics and physicsfaculty of mathematics and physics
mdbmdb
Crash Dump Analysis 2015/2016 2mdb
mdb – modular debuggermdb – modular debugger
Low-level toolAssembly-level debugging, printing C structuresSupport for both user space and kernel debuggingSupport for live/post-mortem debuggingAllows writing custom modules with new debugger commandsBundled in all Solaris distributions
Crash Dump Analysis 2015/2016 3mdb
kmdb – kernel mdbkmdb – kernel mdb
Allows debugging of live kernelShares most of mdb features
Both mdb and kmdb built from same sourcesFull control over kernel
Debugger stops kernelRequires console accessAllows single stepping, breakpoints and watchpoints inside kernel
Crash Dump Analysis 2015/2016 4mdb
ReferencesReferences
Oracle Solaris 11.2 Modular Debugger Guidehttp://docs.oracle.com/cd/E36784_01/html/E36864/toc.html
Man pagesmdb(1), kmdb(1)
Crash Dump Analysis 2015/2016 5mdb
mdb evolutionmdb evolution
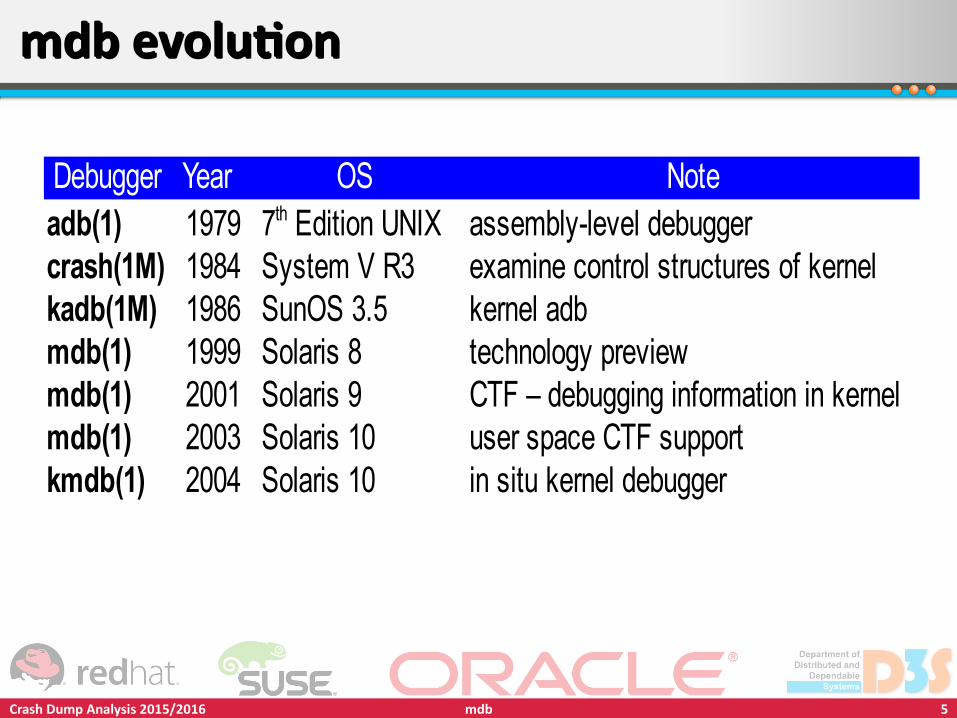
Debugger Year OS Noteadb(1) 1979 assembly-level debuggercrash(1M) 1984 System V R3 examine control structures of kernelkadb(1M) 1986 SunOS 3.5 kernel adbmdb(1) 1999 Solaris 8 technology previewmdb(1) 2001 Solaris 9 CTF – debugging information in kernelmdb(1) 2003 Solaris 10 user space CTF supportkmdb(1) 2004 Solaris 10 in situ kernel debugger
7th Edition UNIX
Crash Dump Analysis 2015/2016 6mdb
Starting mdbStarting mdb
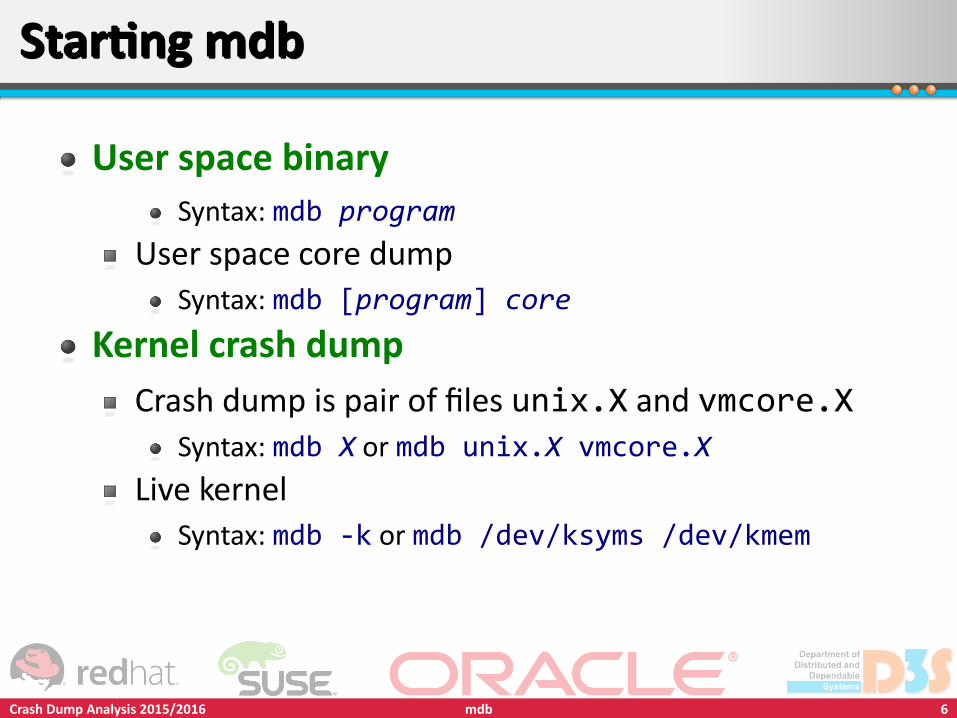
User space binarySyntax: mdb program
User space core dumpSyntax: mdb [program] core
Kernel crash dumpCrash dump is pair of files unix.X and vmcore.X
Syntax: mdb X or mdb unix.X vmcore.XLive kernel
Syntax: mdb -k or mdb /dev/ksyms /dev/kmem
Crash Dump Analysis 2015/2016 7mdb
Basic commandsBasic commands
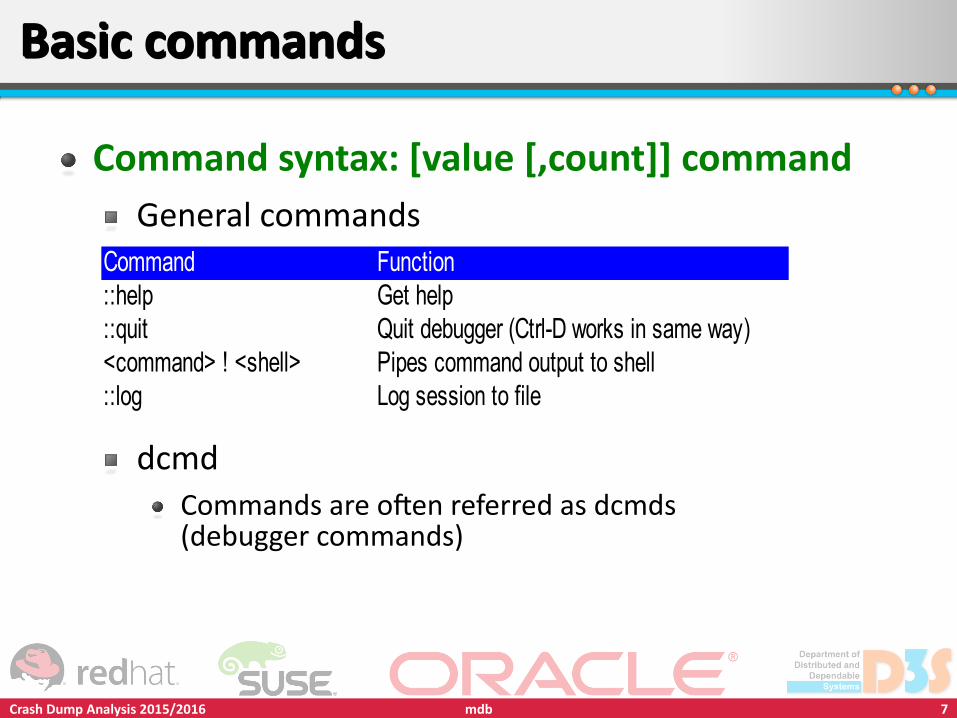
Command syntax: [value [,count]] commandGeneral commands
dcmdCommands are often referred as dcmds(debugger commands)
Command Function::help Get help::quit Quit debugger (Ctrl-D works in same way)<command> ! <shell> Pipes command output to shell::log Log session to file
Crash Dump Analysis 2015/2016 8mdb
ExpressionsExpressions
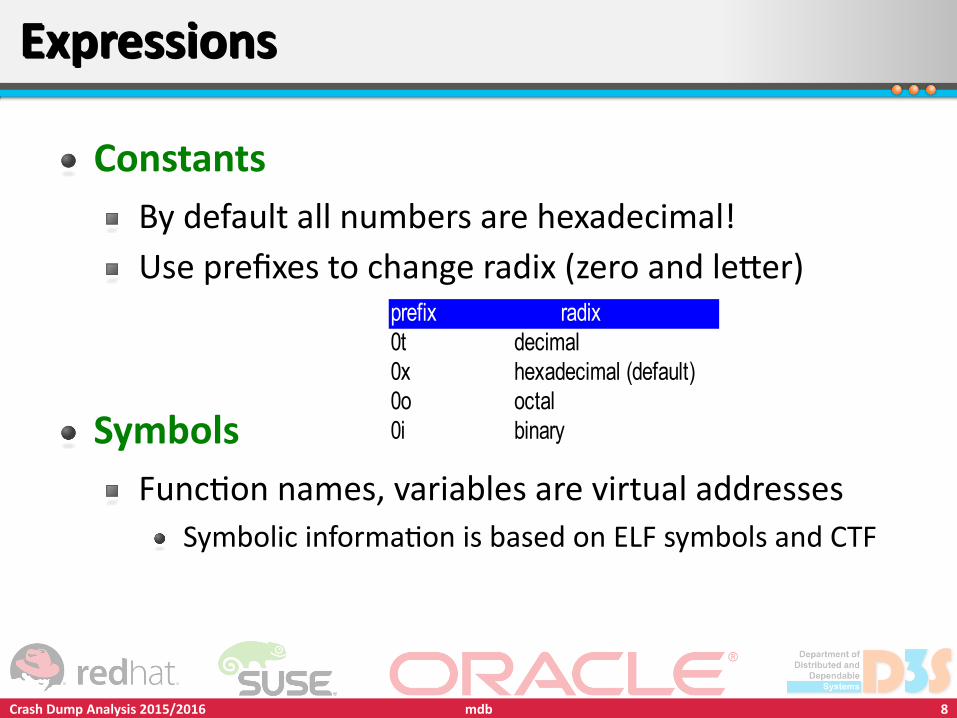
ConstantsBy default all numbers are hexadecimal!Use prefixes to change radix (zero and letter)
SymbolsFunction names, variables are virtual addresses
Symbolic information is based on ELF symbols and CTF
prefix radix0t decimal0x hexadecimal (default)0o octal0i binary
Crash Dump Analysis 2015/2016 9mdb
Expressions (2)Expressions (2)
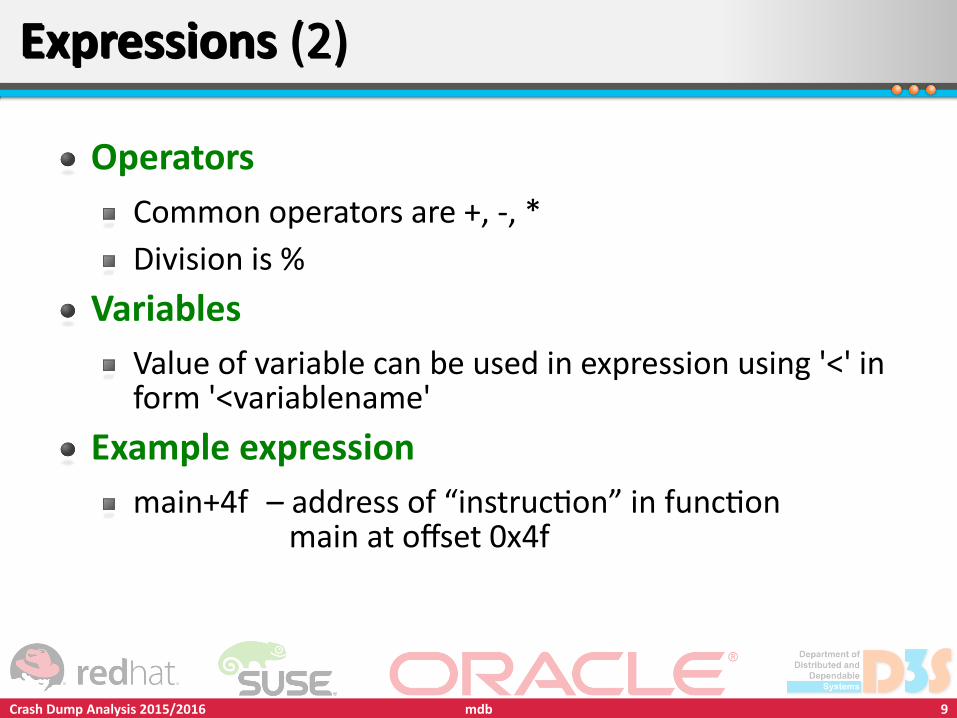
OperatorsCommon operators are +, -, *Division is %
VariablesValue of variable can be used in expression using '<' in form '<variablename'
Example expressionmain+4f – address of “instruction” in function main at offset 0x4f
Crash Dump Analysis 2015/2016 10mdb
Displaying dataDisplaying data
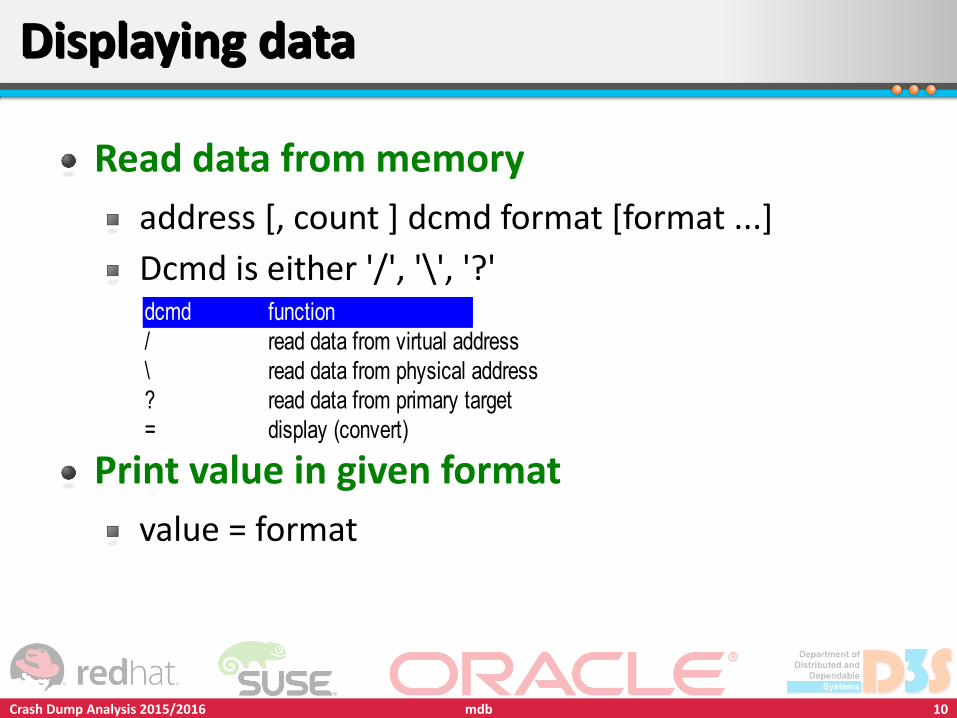
Read data from memoryaddress [, count ] dcmd format [format ...]Dcmd is either '/', '\', '?'
Print value in given formatvalue = format
function/ read data from virtual address\ read data from physical address? read data from primary target= display (convert)
dcmd
Crash Dump Analysis 2015/2016 11mdb
Displaying data (2)Displaying data (2)
FormatsFormat is single character (::formats)Format groups: read, write, search, special
Read formatsHexadecimal byte (B), Hexadecimal int (X)Decimal int (D), Hexadecimal long long (J)Instruction (I), Symbol (p)C string (s)
Crash Dump Analysis 2015/2016 12mdb
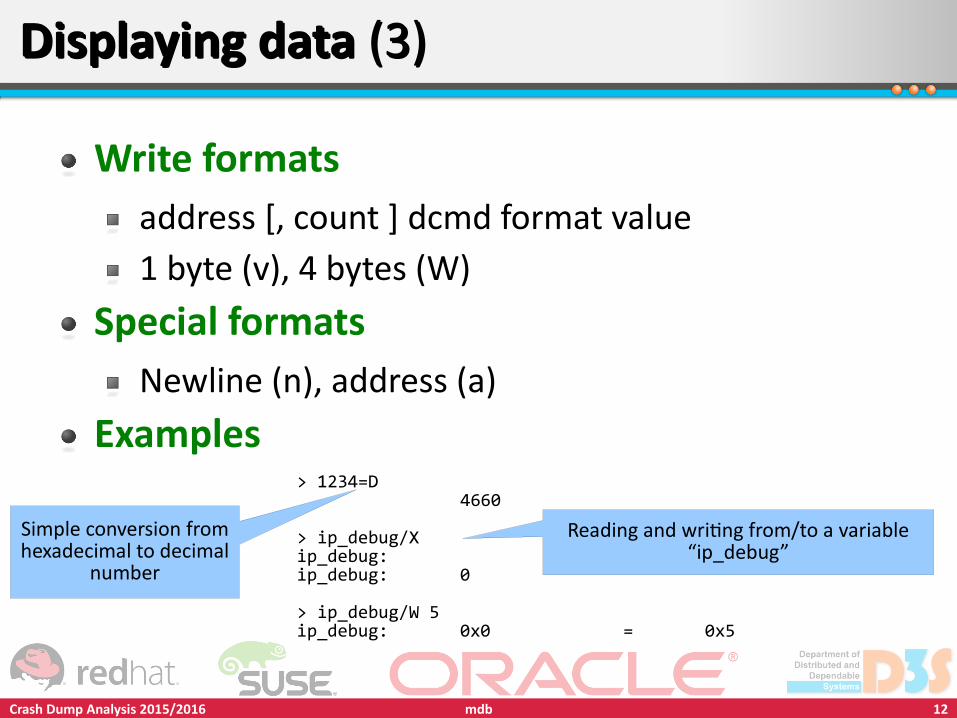
> 1234=D 4660
> ip_debug/Xip_debug:ip_debug: 0
> ip_debug/W 5ip_debug: 0x0 = 0x5
Displaying data (3)Displaying data (3)
Write formatsaddress [, count ] dcmd format value1 byte (v), 4 bytes (W)
Special formatsNewline (n), address (a)
Examples
Simple conversion from hexadecimal to decimal
number
Reading and writing from/to a variable “ip_debug”
Crash Dump Analysis 2015/2016 13mdb
Displaying data (4)Displaying data (4)
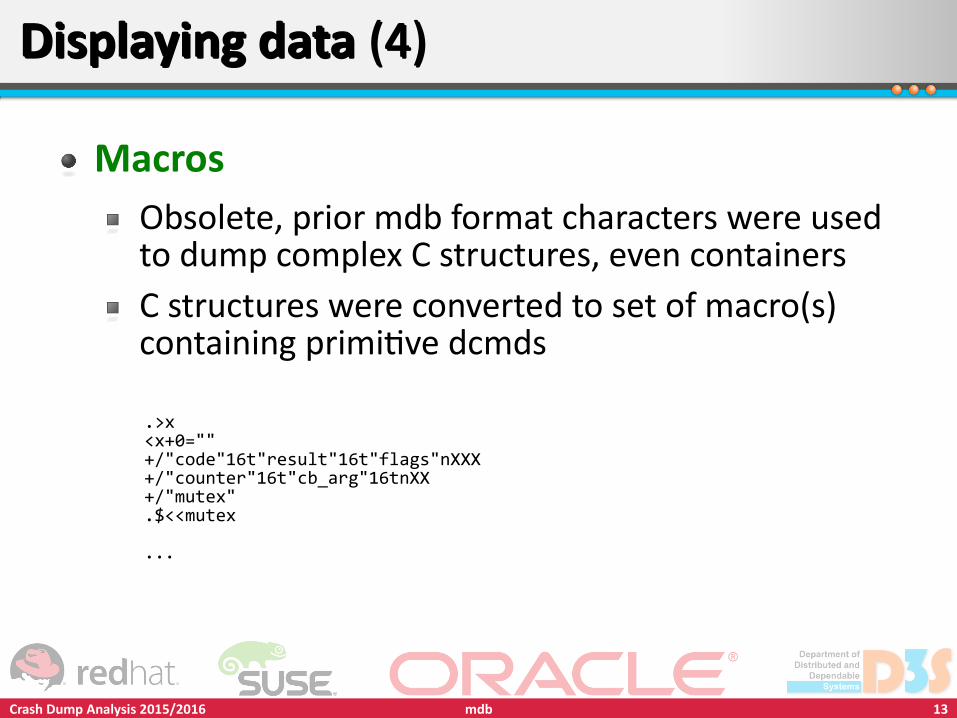
MacrosObsolete, prior mdb format characters were used to dump complex C structures, even containersC structures were converted to set of macro(s) containing primitive dcmds
.>x<x+0=""+/"code"16t"result"16t"flags"nXXX+/"counter"16t"cb_arg"16tnXX+/"mutex".$<<mutex
...
Crash Dump Analysis 2015/2016 14mdb
Displaying data (5)Displaying data (5)
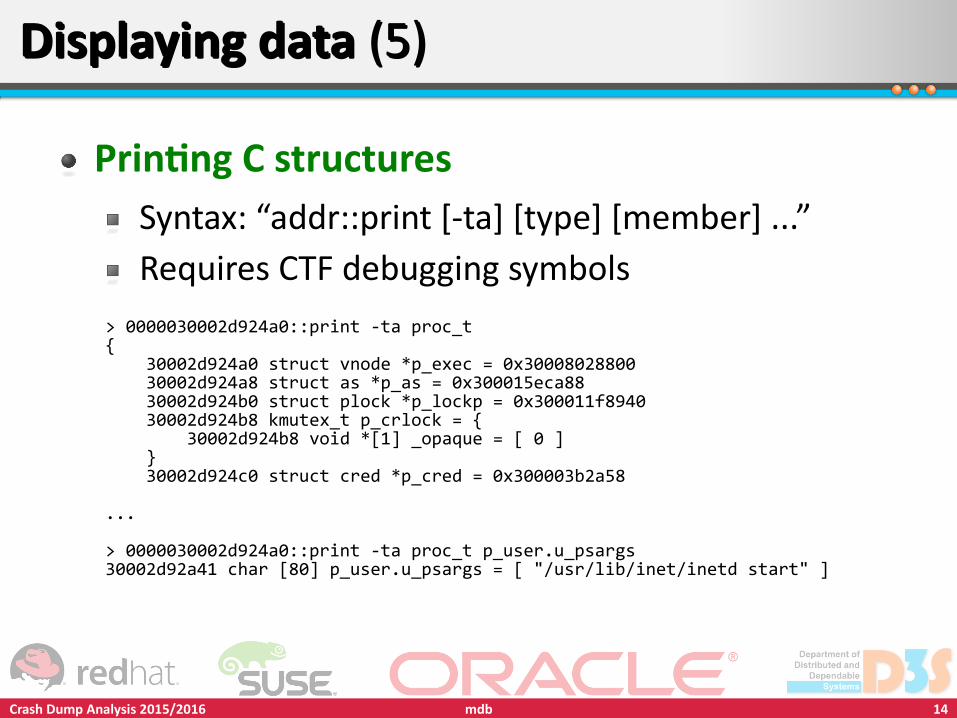
Printing C structuresSyntax: “addr::print [-ta] [type] [member] ...”Requires CTF debugging symbols
> 0000030002d924a0::print -ta proc_t{ 30002d924a0 struct vnode *p_exec = 0x30008028800 30002d924a8 struct as *p_as = 0x300015eca88 30002d924b0 struct plock *p_lockp = 0x300011f8940 30002d924b8 kmutex_t p_crlock = { 30002d924b8 void *[1] _opaque = [ 0 ] } 30002d924c0 struct cred *p_cred = 0x300003b2a58
...
> 0000030002d924a0::print -ta proc_t p_user.u_psargs30002d92a41 char [80] p_user.u_psargs = [ "/usr/lib/inet/inetd start" ]
Crash Dump Analysis 2015/2016 15mdb
Displaying instructionsDisplaying instructions
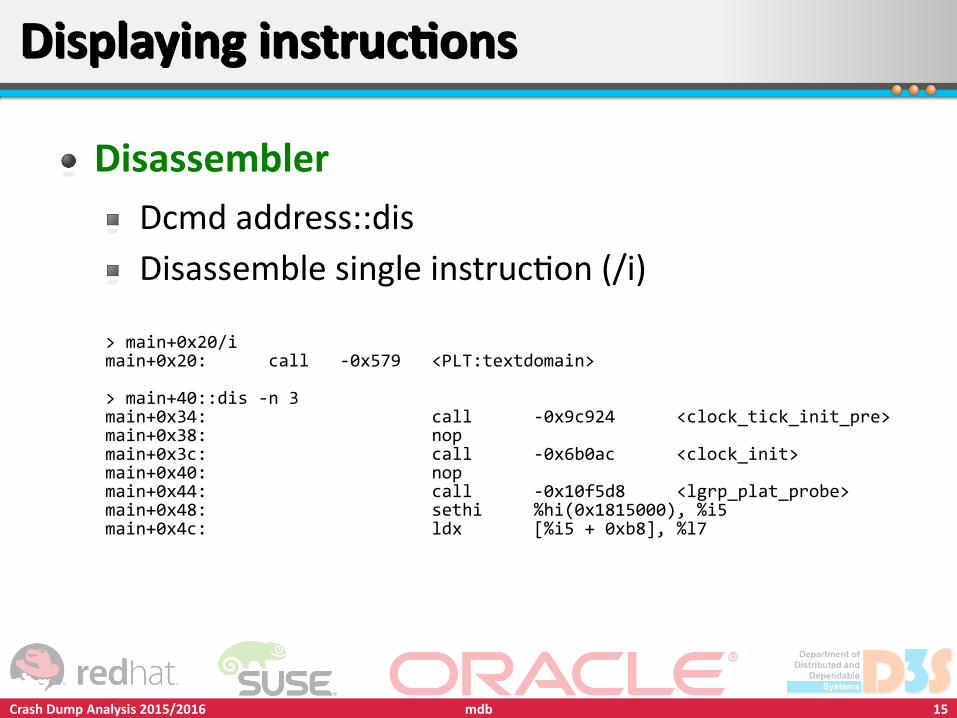
DisassemblerDcmd address::disDisassemble single instruction (/i)
> main+0x20/imain+0x20: call -0x579 <PLT:textdomain>
> main+40::dis -n 3main+0x34: call -0x9c924 <clock_tick_init_pre>main+0x38: nopmain+0x3c: call -0x6b0ac <clock_init>main+0x40: nopmain+0x44: call -0x10f5d8 <lgrp_plat_probe>main+0x48: sethi %hi(0x1815000), %i5main+0x4c: ldx [%i5 + 0xb8], %l7
Crash Dump Analysis 2015/2016 16mdb
RegistersRegisters
Registers are internal variables in mdbUsing register value
<rip::dis – disassemble instructions around program counter
::regs - displaying registersTrap frames (trap-frame-addr::print struct regs)Alternatively use heuristic to find register values on stack
Crash Dump Analysis 2015/2016 17mdb
Program stackProgram stack
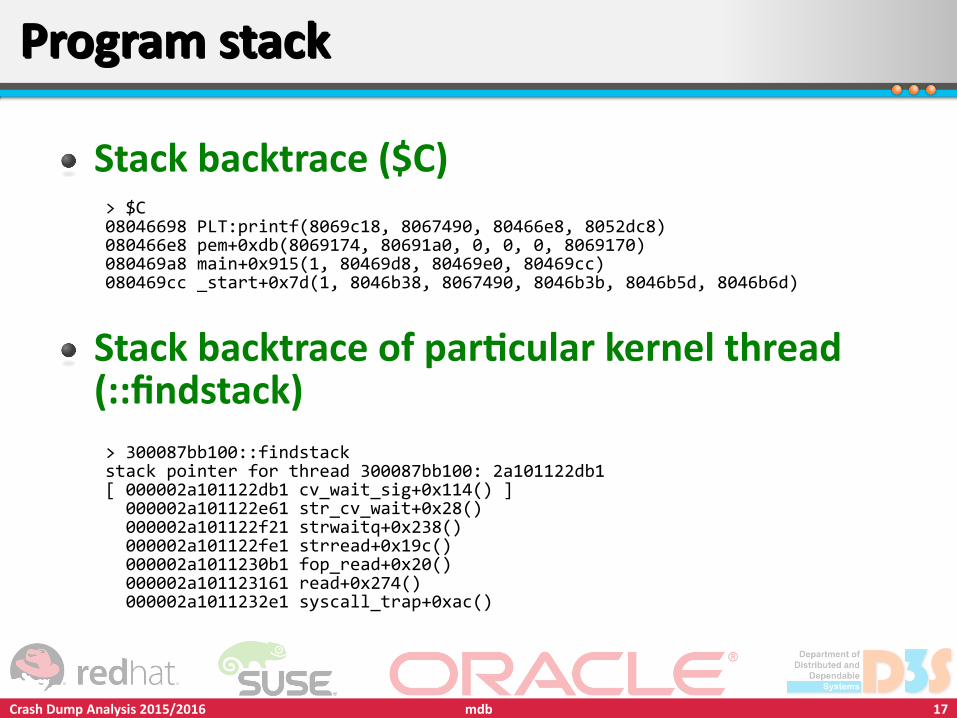
Stack backtrace ($C)
Stack backtrace of particular kernel thread (::findstack)
> $C08046698 PLT:printf(8069c18, 8067490, 80466e8, 8052dc8)080466e8 pem+0xdb(8069174, 80691a0, 0, 0, 0, 8069170)080469a8 main+0x915(1, 80469d8, 80469e0, 80469cc)080469cc _start+0x7d(1, 8046b38, 8067490, 8046b3b, 8046b5d, 8046b6d)
> 300087bb100::findstackstack pointer for thread 300087bb100: 2a101122db1[ 000002a101122db1 cv_wait_sig+0x114() ] 000002a101122e61 str_cv_wait+0x28() 000002a101122f21 strwaitq+0x238() 000002a101122fe1 strread+0x19c() 000002a1011230b1 fop_read+0x20() 000002a101123161 read+0x274() 000002a1011232e1 syscall_trap+0xac()
Crash Dump Analysis 2015/2016 18mdb
Program stack (2)Program stack (2)
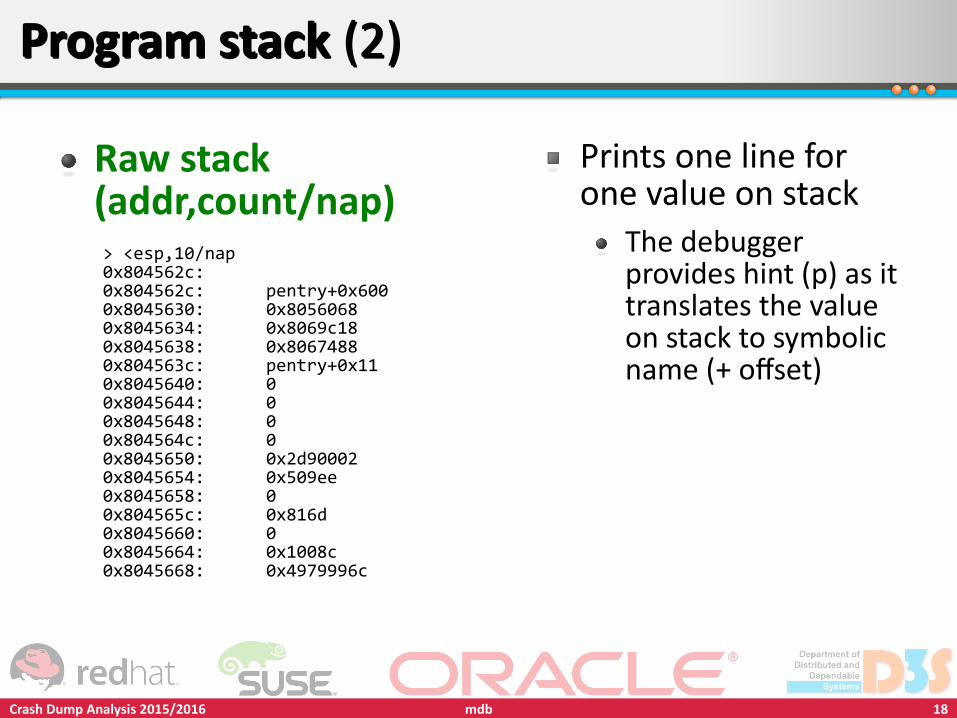
Raw stack (addr,count/nap)> <esp,10/nap0x804562c: 0x804562c: pentry+0x6000x8045630: 0x80560680x8045634: 0x8069c180x8045638: 0x80674880x804563c: pentry+0x110x8045640: 00x8045644: 00x8045648: 00x804564c: 00x8045650: 0x2d900020x8045654: 0x509ee0x8045658: 00x804565c: 0x816d0x8045660: 00x8045664: 0x1008c0x8045668: 0x4979996c
Prints one line for one value on stack
The debugger provides hint (p) as it translates the value on stack to symbolic name (+ offset)
Crash Dump Analysis 2015/2016 19mdb
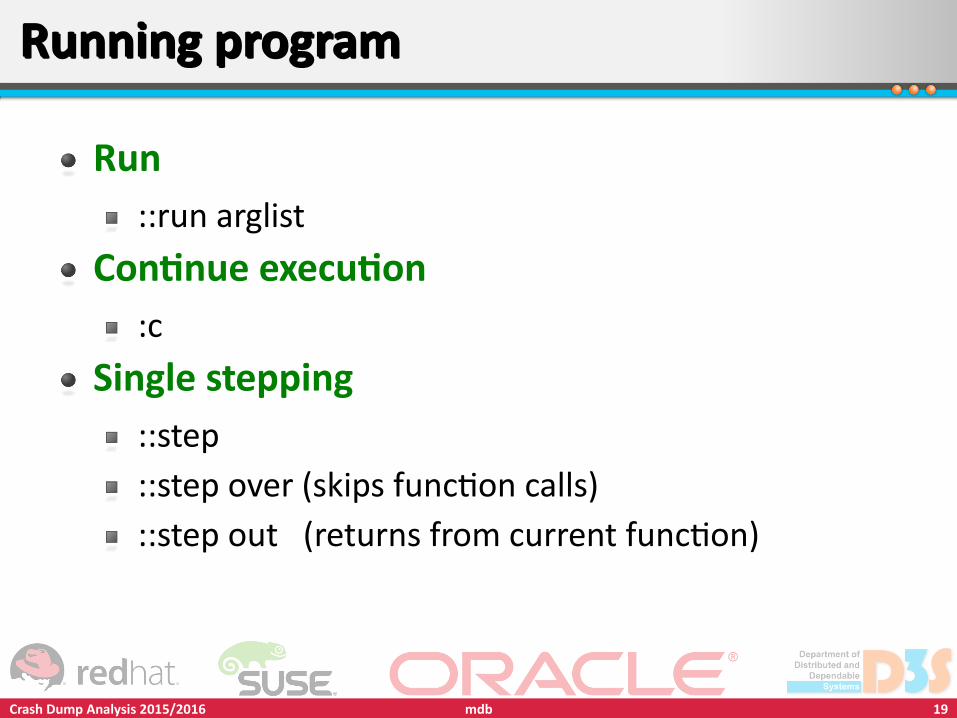
Running programRunning program
Run::run arglist
Continue execution:c
Single stepping::step::step over (skips function calls)::step out (returns from current function)
Crash Dump Analysis 2015/2016 20mdb
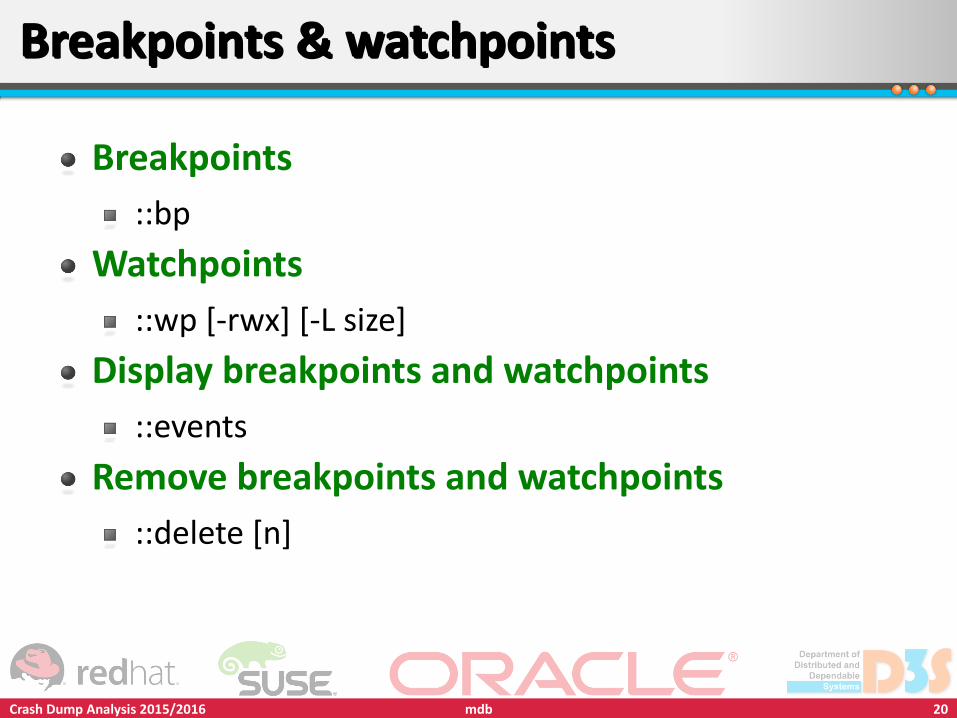
Breakpoints & watchpointsBreakpoints & watchpoints
Breakpoints::bp
Watchpoints::wp [-rwx] [-L size]
Display breakpoints and watchpoints::events
Remove breakpoints and watchpoints::delete [n]
Crash Dump Analysis 2015/2016 21mdb
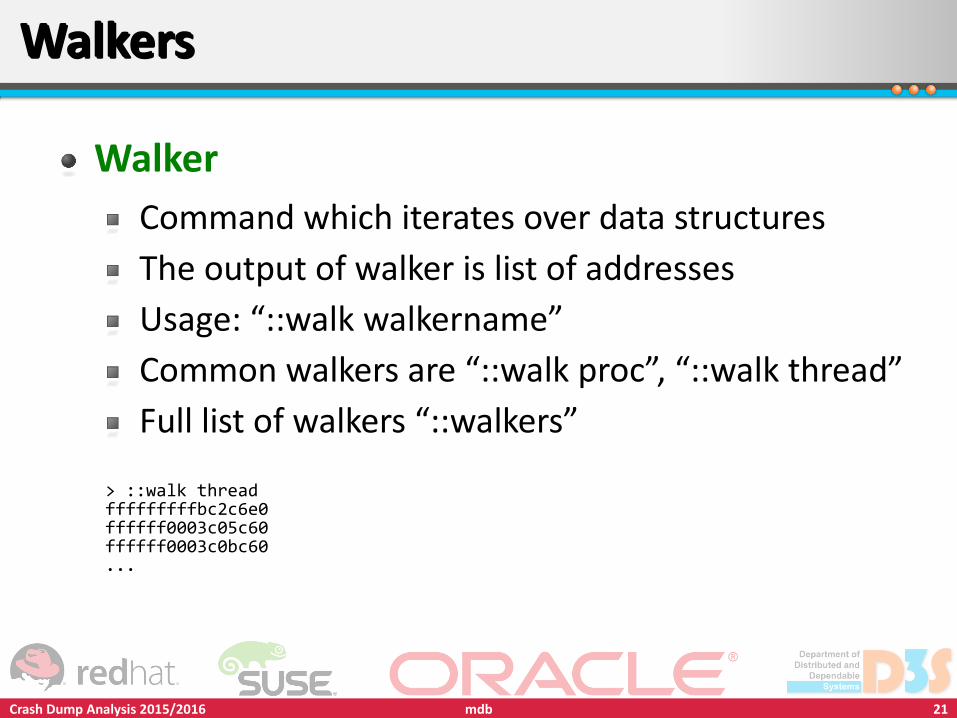
WalkersWalkers
WalkerCommand which iterates over data structuresThe output of walker is list of addressesUsage: “::walk walkername”Common walkers are “::walk proc”, “::walk thread”Full list of walkers “::walkers”
> ::walk threadfffffffffbc2c6e0ffffff0003c05c60ffffff0003c0bc60...
Crash Dump Analysis 2015/2016 22mdb
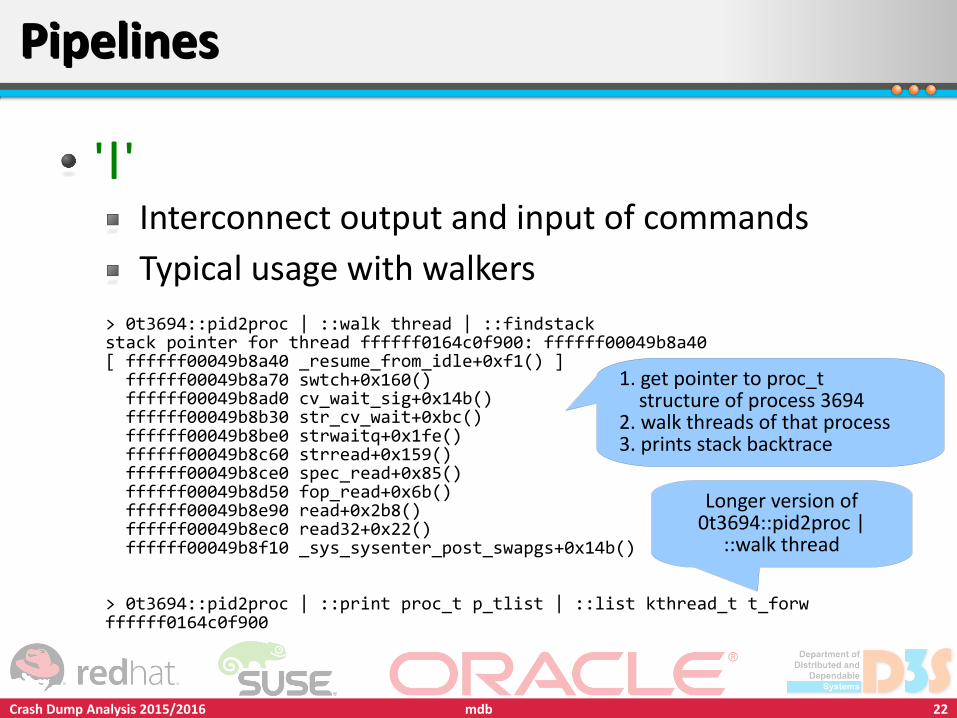
PipelinesPipelines
'|'Interconnect output and input of commandsTypical usage with walkers
1. get pointer to proc_t structure of process 36942. walk threads of that process3. prints stack backtrace
Longer version of 0t3694::pid2proc |
::walk thread
> 0t3694::pid2proc | ::walk thread | ::findstackstack pointer for thread ffffff0164c0f900: ffffff00049b8a40[ ffffff00049b8a40 _resume_from_idle+0xf1() ] ffffff00049b8a70 swtch+0x160() ffffff00049b8ad0 cv_wait_sig+0x14b() ffffff00049b8b30 str_cv_wait+0xbc() ffffff00049b8be0 strwaitq+0x1fe() ffffff00049b8c60 strread+0x159() ffffff00049b8ce0 spec_read+0x85() ffffff00049b8d50 fop_read+0x6b() ffffff00049b8e90 read+0x2b8() ffffff00049b8ec0 read32+0x22() ffffff00049b8f10 _sys_sysenter_post_swapgs+0x14b()
> 0t3694::pid2proc | ::print proc_t p_tlist | ::list kthread_t t_forwffffff0164c0f900
Crash Dump Analysis 2015/2016 23mdb
CTFCTF
Compact debugging informationDesigned for production systemsDescribes C structures, types, functions, argumentsNo line informationPresent in kernel/libraries
Crash Dump Analysis 2015/2016 24mdb
CTF (2)CTF (2)
CTF toolsPart of ON sources – ctfdump, ctfmerge, ctfconvert
Dcmds using CTFShow type definition - ::print [-ta] <type>Build internal type graph - ::typegraphPrint size of a type ::sizeof <type>Attempt to determine what type corresponds to an address <addr>::whattype
Requires built type graph
Crash Dump Analysis 2015/2016 25mdb
Example crash dumpExample crash dump
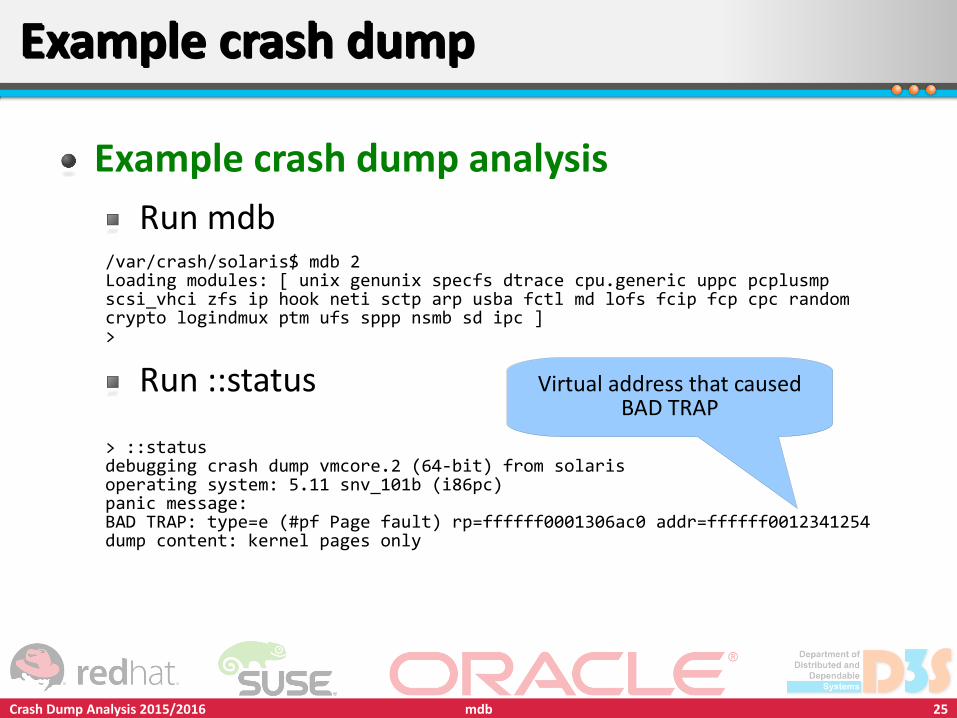
Example crash dump analysisRun mdb
Run ::status Virtual address that caused BAD TRAP
/var/crash/solaris$ mdb 2Loading modules: [ unix genunix specfs dtrace cpu.generic uppc pcplusmpscsi_vhci zfs ip hook neti sctp arp usba fctl md lofs fcip fcp cpc randomcrypto logindmux ptm ufs sppp nsmb sd ipc ]>
> ::statusdebugging crash dump vmcore.2 (64-bit) from solarisoperating system: 5.11 snv_101b (i86pc)panic message:BAD TRAP: type=e (#pf Page fault) rp=ffffff0001306ac0 addr=ffffff0012341254dump content: kernel pages only
Crash Dump Analysis 2015/2016 26mdb
Example crash dump (2)Example crash dump (2)
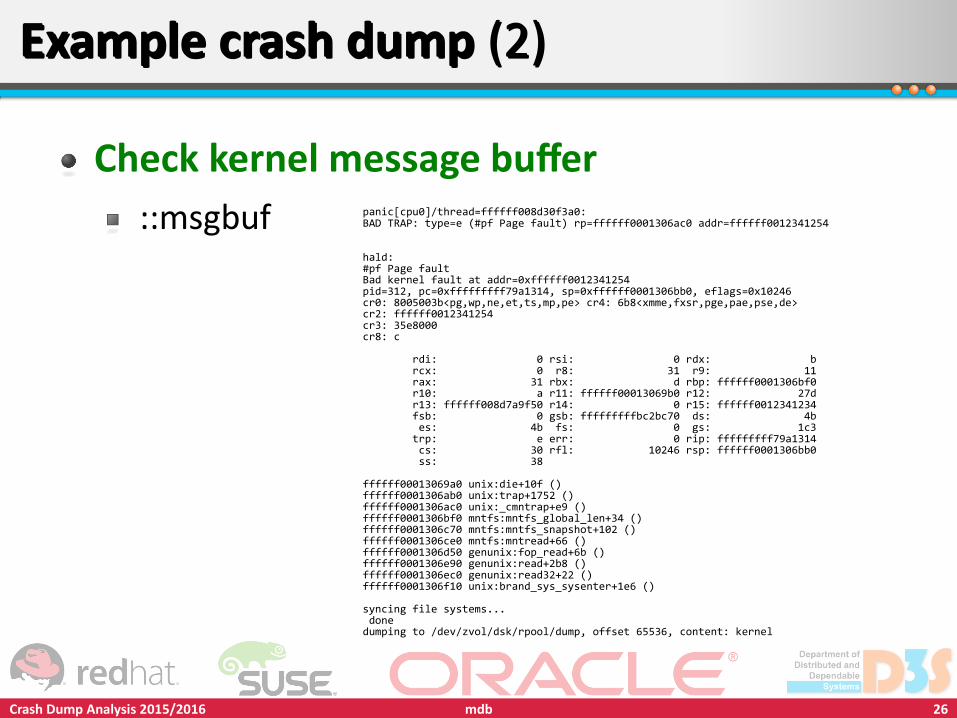
Check kernel message buffer::msgbuf panic[cpu0]/thread=ffffff008d30f3a0:
BAD TRAP: type=e (#pf Page fault) rp=ffffff0001306ac0 addr=ffffff0012341254
hald:#pf Page faultBad kernel fault at addr=0xffffff0012341254pid=312, pc=0xfffffffff79a1314, sp=0xffffff0001306bb0, eflags=0x10246cr0: 8005003b<pg,wp,ne,et,ts,mp,pe> cr4: 6b8<xmme,fxsr,pge,pae,pse,de>cr2: ffffff0012341254cr3: 35e8000cr8: c
rdi: 0 rsi: 0 rdx: b rcx: 0 r8: 31 r9: 11 rax: 31 rbx: d rbp: ffffff0001306bf0 r10: a r11: ffffff00013069b0 r12: 27d r13: ffffff008d7a9f50 r14: 0 r15: ffffff0012341234 fsb: 0 gsb: fffffffffbc2bc70 ds: 4b es: 4b fs: 0 gs: 1c3 trp: e err: 0 rip: fffffffff79a1314 cs: 30 rfl: 10246 rsp: ffffff0001306bb0 ss: 38
ffffff00013069a0 unix:die+10f ()ffffff0001306ab0 unix:trap+1752 ()ffffff0001306ac0 unix:_cmntrap+e9 ()ffffff0001306bf0 mntfs:mntfs_global_len+34 ()ffffff0001306c70 mntfs:mntfs_snapshot+102 ()ffffff0001306ce0 mntfs:mntread+66 ()ffffff0001306d50 genunix:fop_read+6b ()ffffff0001306e90 genunix:read+2b8 ()ffffff0001306ec0 genunix:read32+22 ()ffffff0001306f10 unix:brand_sys_sysenter+1e6 ()
syncing file systems... donedumping to /dev/zvol/dsk/rpool/dump, offset 65536, content: kernel
Crash Dump Analysis 2015/2016 27mdb
Example crash dump (3)Example crash dump (3)
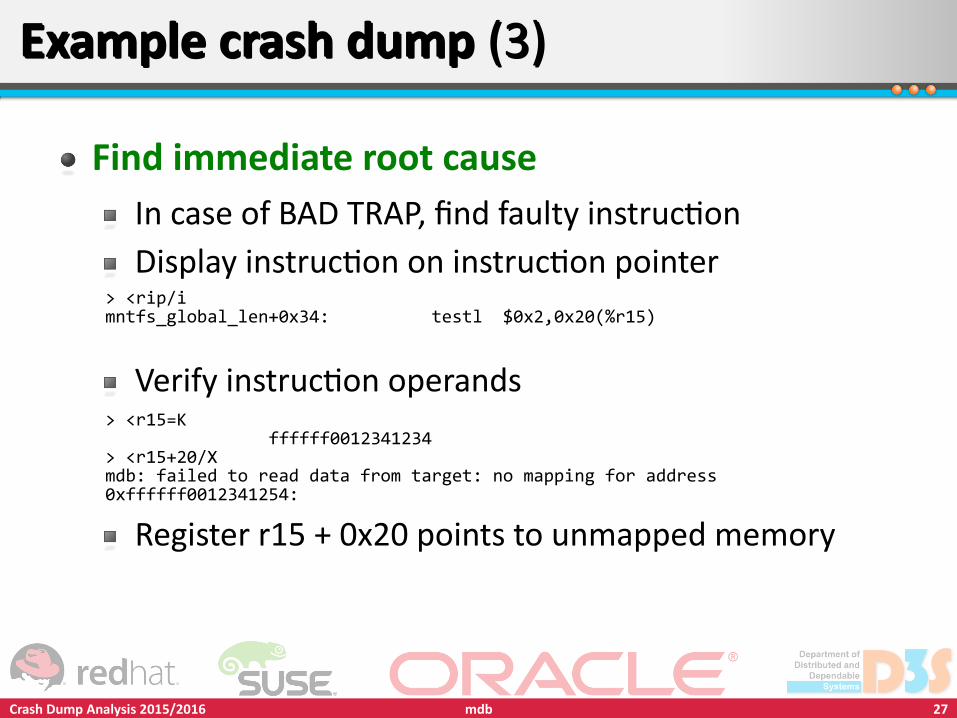
Find immediate root causeIn case of BAD TRAP, find faulty instructionDisplay instruction on instruction pointer
Verify instruction operands
Register r15 + 0x20 points to unmapped memory
> <rip/imntfs_global_len+0x34: testl $0x2,0x20(%r15)
> <r15=K ffffff0012341234> <r15+20/Xmdb: failed to read data from target: no mapping for address0xffffff0012341254:
Crash Dump Analysis 2015/2016 28mdb
Example crash dump (4)Example crash dump (4)
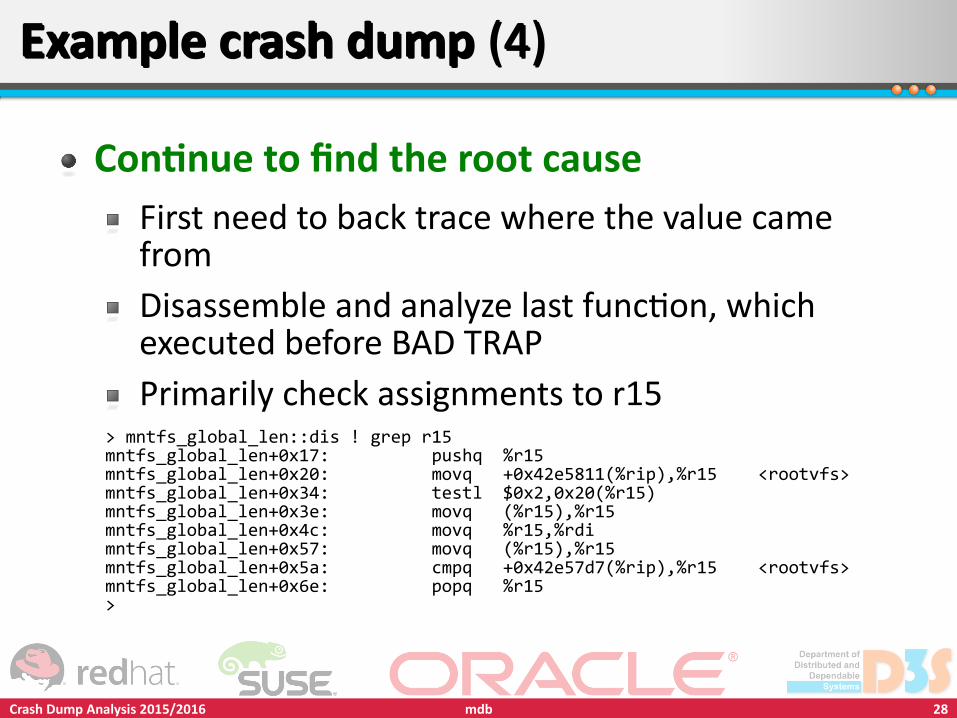
Continue to find the root causeFirst need to back trace where the value came fromDisassemble and analyze last function, which executed before BAD TRAPPrimarily check assignments to r15
> mntfs_global_len::dis ! grep r15mntfs_global_len+0x17: pushq %r15mntfs_global_len+0x20: movq +0x42e5811(%rip),%r15 <rootvfs>mntfs_global_len+0x34: testl $0x2,0x20(%r15)mntfs_global_len+0x3e: movq (%r15),%r15mntfs_global_len+0x4c: movq %r15,%rdimntfs_global_len+0x57: movq (%r15),%r15mntfs_global_len+0x5a: cmpq +0x42e57d7(%rip),%r15 <rootvfs>mntfs_global_len+0x6e: popq %r15>
Crash Dump Analysis 2015/2016 29mdb
Example crash dump (5)Example crash dump (5)
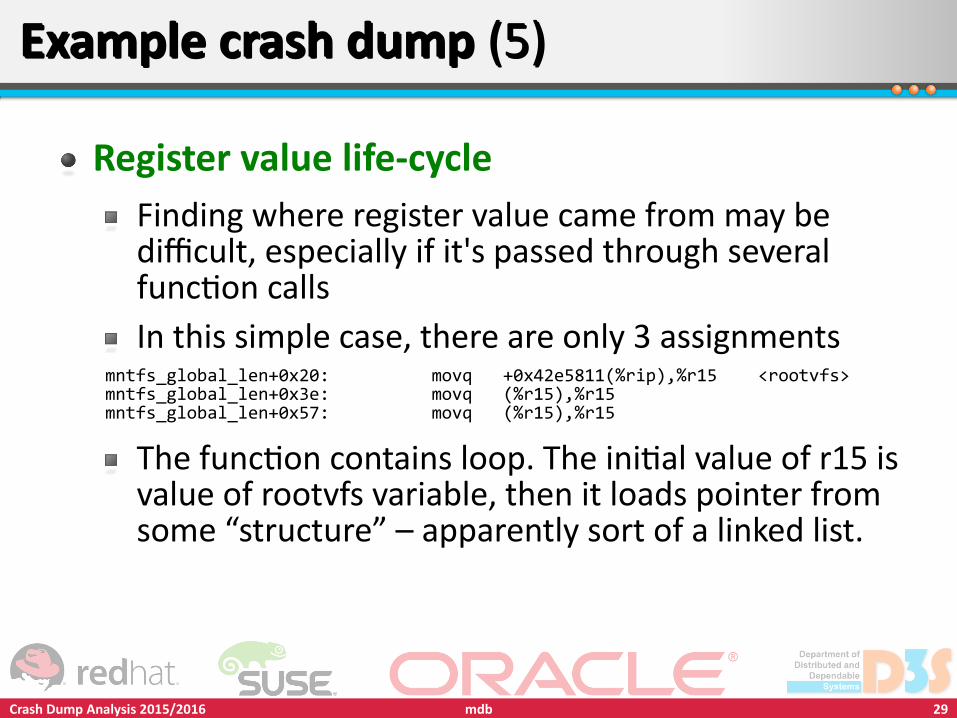
Register value life-cycleFinding where register value came from may be difficult, especially if it's passed through several function callsIn this simple case, there are only 3 assignments
The function contains loop. The initial value of r15 is value of rootvfs variable, then it loads pointer from some “structure” – apparently sort of a linked list.
mntfs_global_len+0x20: movq +0x42e5811(%rip),%r15 <rootvfs>mntfs_global_len+0x3e: movq (%r15),%r15mntfs_global_len+0x57: movq (%r15),%r15
Crash Dump Analysis 2015/2016 30mdb
Example crash dump (6)Example crash dump (6)
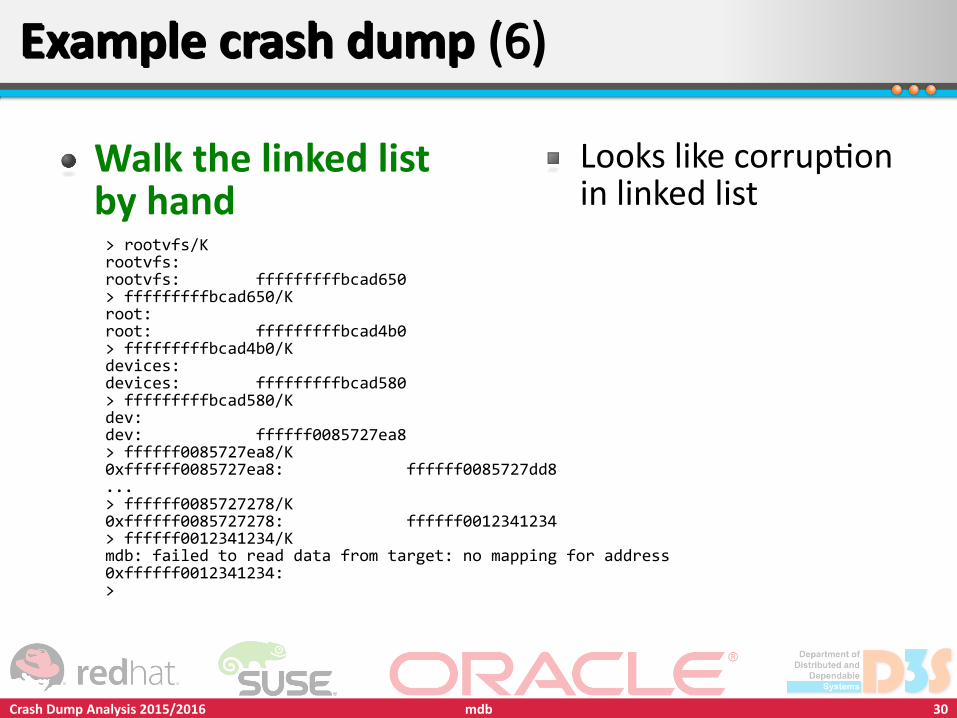
Walk the linked list by hand> rootvfs/Krootvfs:rootvfs: fffffffffbcad650> fffffffffbcad650/Kroot:root: fffffffffbcad4b0> fffffffffbcad4b0/Kdevices:devices: fffffffffbcad580> fffffffffbcad580/Kdev:dev: ffffff0085727ea8> ffffff0085727ea8/K0xffffff0085727ea8: ffffff0085727dd8...> ffffff0085727278/K0xffffff0085727278: ffffff0012341234> ffffff0012341234/Kmdb: failed to read data from target: no mapping for address0xffffff0012341234:>
Looks like corruption in linked list
Crash Dump Analysis 2015/2016 31mdb
Example crash dump (7)Example crash dump (7)
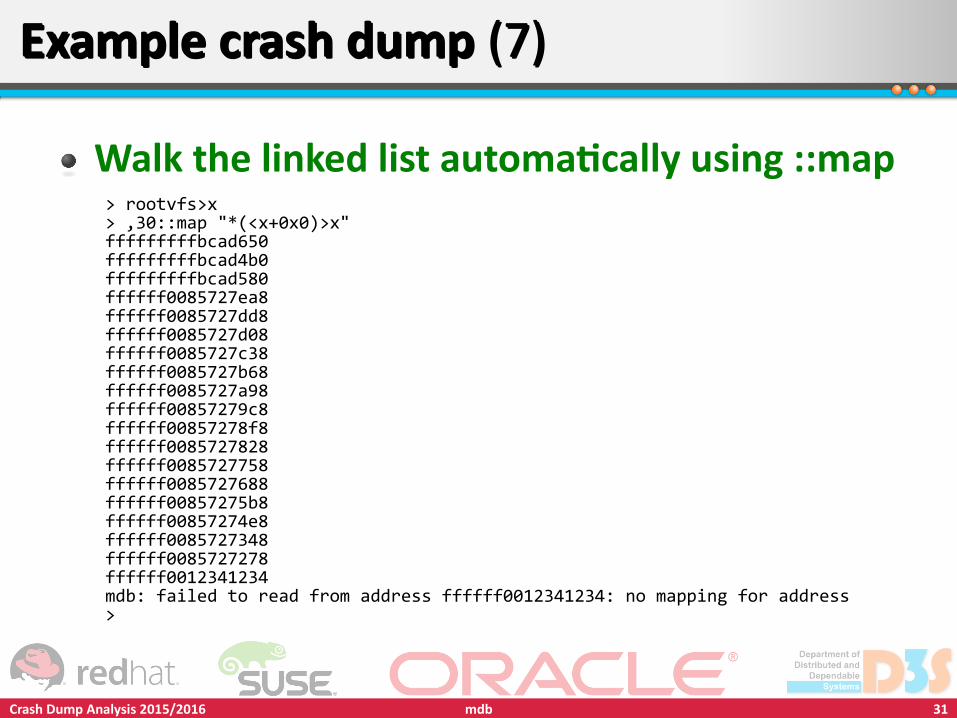
Walk the linked list automatically using ::map> rootvfs>x> ,30::map "*(<x+0x0)>x"fffffffffbcad650fffffffffbcad4b0fffffffffbcad580ffffff0085727ea8ffffff0085727dd8ffffff0085727d08ffffff0085727c38ffffff0085727b68ffffff0085727a98ffffff00857279c8ffffff00857278f8ffffff0085727828ffffff0085727758ffffff0085727688ffffff00857275b8ffffff00857274e8ffffff0085727348ffffff0085727278ffffff0012341234mdb: failed to read from address ffffff0012341234: no mapping for address>
Crash Dump Analysis 2015/2016 32mdb
Example crash dump (8)Example crash dump (8)
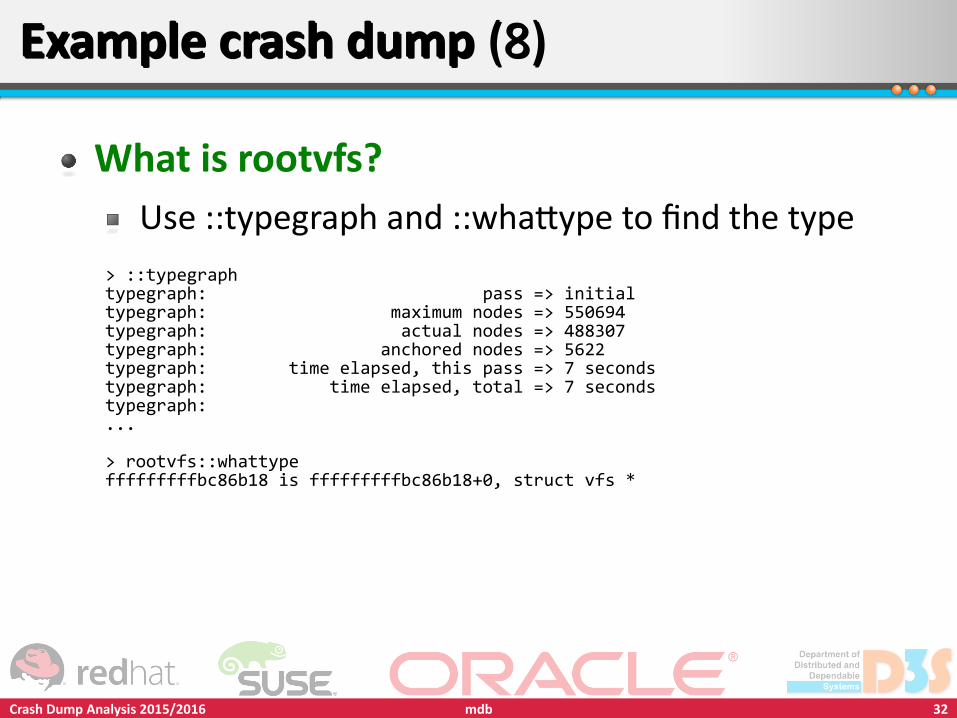
What is rootvfs?Use ::typegraph and ::whattype to find the type
> ::typegraphtypegraph: pass => initialtypegraph: maximum nodes => 550694typegraph: actual nodes => 488307typegraph: anchored nodes => 5622typegraph: time elapsed, this pass => 7 secondstypegraph: time elapsed, total => 7 secondstypegraph:...
> rootvfs::whattypefffffffffbc86b18 is fffffffffbc86b18+0, struct vfs *
Crash Dump Analysis 2015/2016 33mdb
Example crash dump (9)Example crash dump (9)
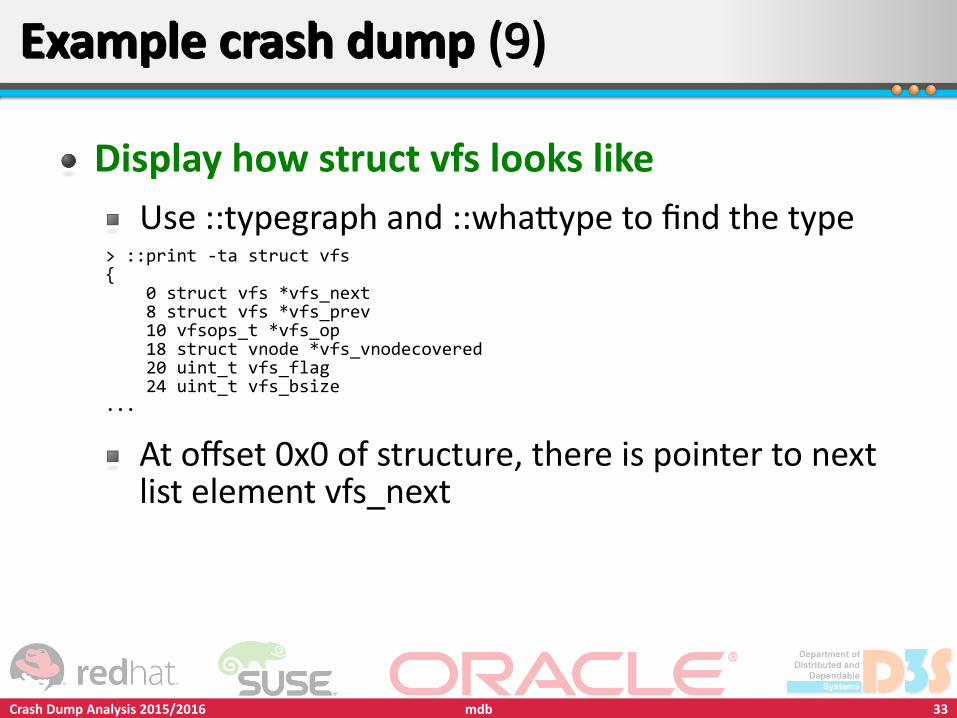
Display how struct vfs looks likeUse ::typegraph and ::whattype to find the type
At offset 0x0 of structure, there is pointer to next list element vfs_next
> ::print -ta struct vfs{ 0 struct vfs *vfs_next 8 struct vfs *vfs_prev 10 vfsops_t *vfs_op 18 struct vnode *vfs_vnodecovered 20 uint_t vfs_flag 24 uint_t vfs_bsize...
Crash Dump Analysis 2015/2016 34mdb
Example crash dump (10)Example crash dump (10)
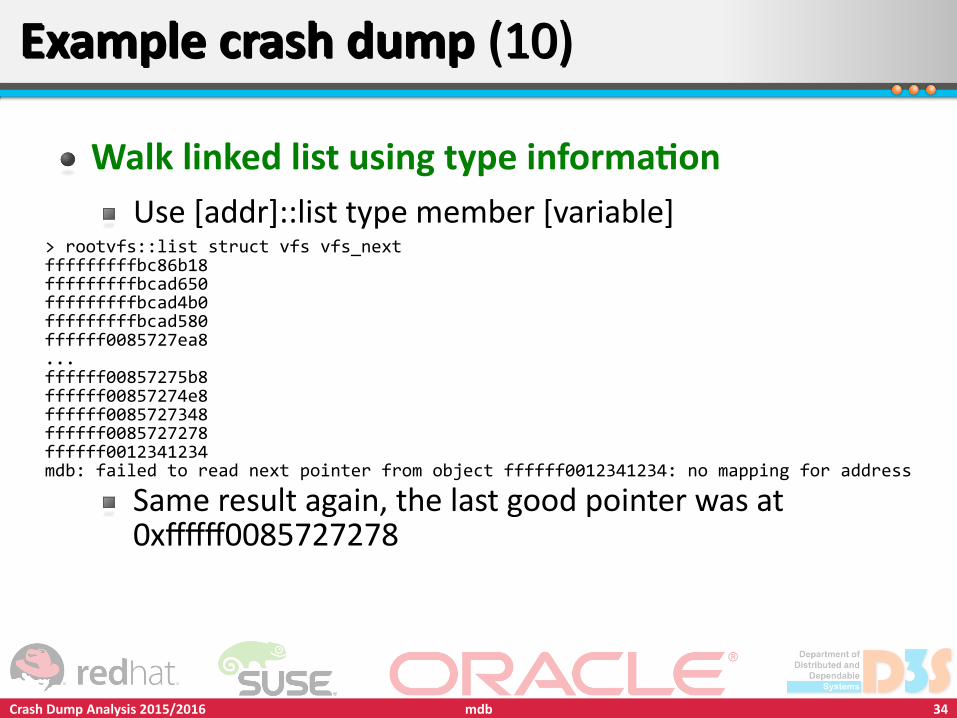
Walk linked list using type informationUse [addr]::list type member [variable]
Same result again, the last good pointer was at 0xffffff0085727278
> rootvfs::list struct vfs vfs_nextfffffffffbc86b18fffffffffbcad650fffffffffbcad4b0fffffffffbcad580ffffff0085727ea8...ffffff00857275b8ffffff00857274e8ffffff0085727348ffffff0085727278ffffff0012341234mdb: failed to read next pointer from object ffffff0012341234: no mapping for address
Crash Dump Analysis 2015/2016 35mdb
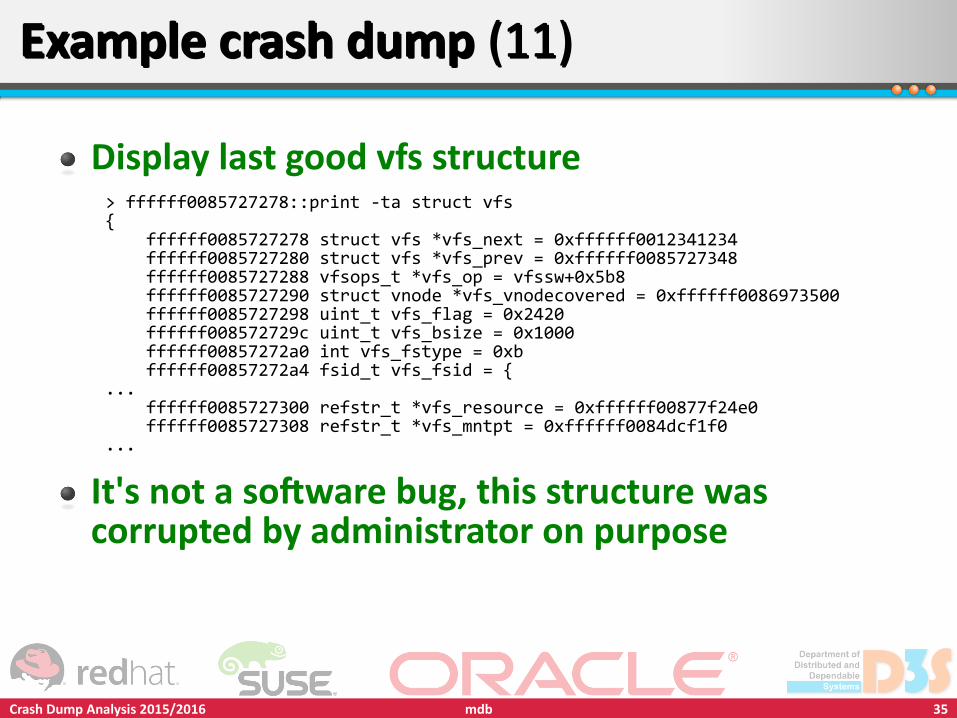
Example crash dump (11)Example crash dump (11)
Display last good vfs structure
It's not a software bug, this structure was corrupted by administrator on purpose
> ffffff0085727278::print -ta struct vfs{ ffffff0085727278 struct vfs *vfs_next = 0xffffff0012341234 ffffff0085727280 struct vfs *vfs_prev = 0xffffff0085727348 ffffff0085727288 vfsops_t *vfs_op = vfssw+0x5b8 ffffff0085727290 struct vnode *vfs_vnodecovered = 0xffffff0086973500 ffffff0085727298 uint_t vfs_flag = 0x2420 ffffff008572729c uint_t vfs_bsize = 0x1000 ffffff00857272a0 int vfs_fstype = 0xb ffffff00857272a4 fsid_t vfs_fsid = {... ffffff0085727300 refstr_t *vfs_resource = 0xffffff00877f24e0 ffffff0085727308 refstr_t *vfs_mntpt = 0xffffff0084dcf1f0...
Crash Dump Analysis 2015/2016 36mdb
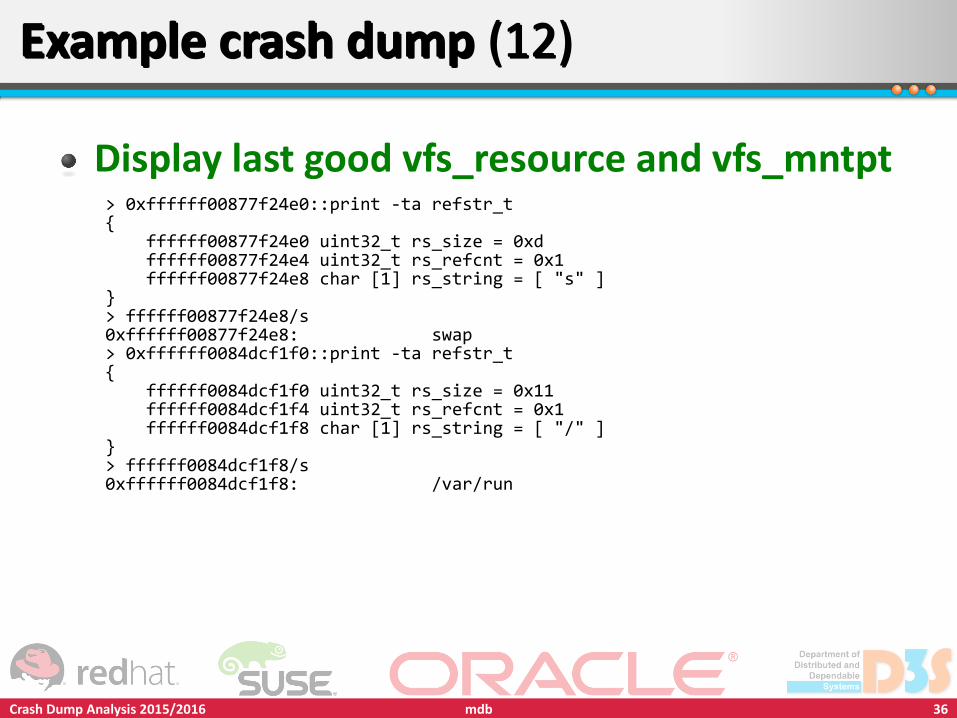
Example crash dump (12)Example crash dump (12)
Display last good vfs_resource and vfs_mntpt> 0xffffff00877f24e0::print -ta refstr_t{ ffffff00877f24e0 uint32_t rs_size = 0xd ffffff00877f24e4 uint32_t rs_refcnt = 0x1 ffffff00877f24e8 char [1] rs_string = [ "s" ]}> ffffff00877f24e8/s0xffffff00877f24e8: swap> 0xffffff0084dcf1f0::print -ta refstr_t{ ffffff0084dcf1f0 uint32_t rs_size = 0x11 ffffff0084dcf1f4 uint32_t rs_refcnt = 0x1 ffffff0084dcf1f8 char [1] rs_string = [ "/" ]}> ffffff0084dcf1f8/s0xffffff0084dcf1f8: /var/run