Embed Size (px)
Citation preview

MDA Zero-to-Fourteen Consumer Experience Study 2015
© Media Development Authority Singapore

Content
1. Executive Summary
2. Research Objectives and Methodology
3. Media Consumption Habits
4. Online Usage and Habits
5. Social Media Usage and Habits
Zero-to-Fourteen Consumer Experience Study 2015 / 2© Media Development Authority Singapore

Zero-to-Fourteen Consumer Experience Study 2015 / 3
1. Executive Summary
© Media Development Authority Singapore

Executive SummaryMedia Consumption Habits
• Children spent the most time watching Mediacorp on TV, at 0.9 hours daily, and it was thetop activity amongst older children (7 to 14 years). However, younger children (0 to 6 years)spent the most time watching Pay TV and other content.
• Amongst Mediacorp channels, Okto was the most watched channel by children aged 10 andbelow, while Channel 8 remained the most watched channel by older children (aged 11 to14).
Internet Take-Up
• Almost 8 in 10 children (79.8%) have used the Internet in 2015. On average, children startedusing the Internet at 6.1 years old.
• The smartphone and tablet remained the top two devices most often used to access theInternet in 2015 at 86.1% and 78.3% respectively, while handheld video game players tookthird place with a score of 74.5%.
Social Media Usage
• 65.0% of children have used social media, an increase from 2014’s 49.8%.
• YouTube was both the most used (91.4%) and favourite (79.1%) social media networkamongst children.
Zero-to-Fourteen Consumer Experience Study 2015 / 4© Media Development Authority Singapore

Zero-to-Fourteen Consumer Experience Study 2015 / 5
2. Research Objectives and Methodology
© Media Development Authority Singapore

Research Objectives and Methodology
The Zero-to-Fourteen Consumer Experience Study (CS) was conceptualised as acomplementary study to the Media Consumer Experience Study (MCES), aimed atunderstanding children’s media consumption habits and preferences. The CS was conductedfor the second time in 2015, and aims to:
• Analyse children’s traditional and online media consumption behaviour and habits; and
• Provide insights into children’s Internet usage patterns, including the use of social mediain terms of websites and devices.
The CS was conducted by Degree Census Consultancy Pte Ltd. A representative sample of1,200 Singapore Citizens and Permanent Residents aged 0 to 14 years was surveyed, withthe parents of those aged 0 to 6 years old answering on their behalf. Face-to-face Interviewswere conducted from November to December 2015 and lasted about 30 minutes each.
Zero-to-Fourteen Consumer Experience Study 2015 / 6© Media Development Authority Singapore
Note: • Throughout this report, figures in blue indicate a statistically significant increase from the previous year, while figures in red indicate a statistically significant decrease. • Results from a sample size of less than 30 respondents should be interpreted with caution.

Zero-to-Fourteen Consumer Experience Study 2015 / 7
3. Media Consumption Habits
© Media Development Authority Singapore

Children spent the most time watching Mediacorp programmes on television
0.07
0.07
0.2
0.2
0.2
0.2
0.8
0.7
0.4
1.6
0.02
0.07
0.1
0.1
0.3
0.3
0.6
0.6
0.6
0.9
Listen to the radio
Watch non-Mediacorp and Pay TV content on TV
Go online for social networking
Listen to music
Do homework
Read books
Watch Pay TV on TV
Play video games
Watch non-Mediacorp and Pay TV content online
Watch Mediacorp TV on TV
Chart 1: Daily Time Spent on Media Activities (hours) – overall
2015 2014
© Media Development Authority Singapore
Note: Time spent figures were based on the total sample (n = 1,200).
• Despite a drop from last year, watching Mediacorp programmes on Free-to-Air TVremained the media activity children spent the most time on, at 0.9 hours daily.
Accompanied by:
Family
Alone
Family
Alone
Alone
Alone
Alone
Alone
Alone
Family
Zero-to-Fourteen Consumer Experience Study 2015 / 8
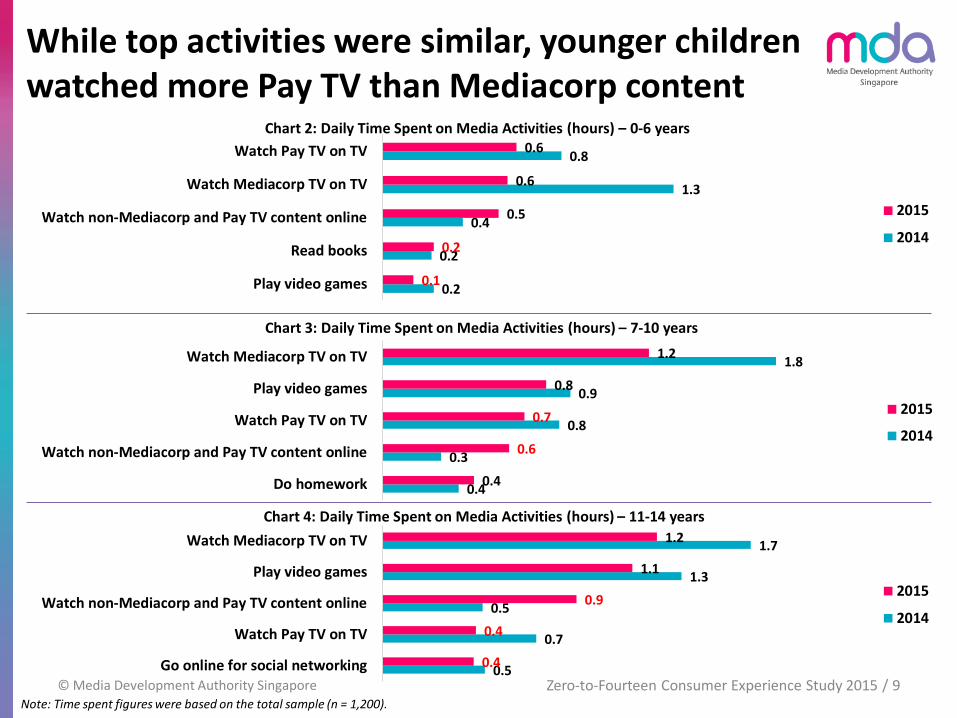
While top activities were similar, younger children watched more Pay TV than Mediacorp content
Zero-to-Fourteen Consumer Experience Study 2015 / 9© Media Development Authority Singapore
0.2
0.2
0.4
1.3
0.8
0.1
0.2
0.5
0.6
0.6
Play video games
Read books
Watch non-Mediacorp and Pay TV content online
Watch Mediacorp TV on TV
Watch Pay TV on TV
Chart 2: Daily Time Spent on Media Activities (hours) – 0-6 years
2015
2014
0.4
0.3
0.8
0.9
1.8
0.4
0.6
0.7
0.8
1.2
Do homework
Watch non-Mediacorp and Pay TV content online
Watch Pay TV on TV
Play video games
Watch Mediacorp TV on TV
Chart 3: Daily Time Spent on Media Activities (hours) – 7-10 years
2015
2014
0.5
0.7
0.5
1.3
1.7
0.4
0.4
0.9
1.1
1.2
Go online for social networking
Watch Pay TV on TV
Watch non-Mediacorp and Pay TV content online
Play video games
Watch Mediacorp TV on TV
Chart 4: Daily Time Spent on Media Activities (hours) – 11-14 years
2015
2014
Note: Time spent figures were based on the total sample (n = 1,200).

More than half of children surveyed watched Mediacorp’s TV programmes
59.8
74.2
2015 2014
Chart 5: Children who watched Mediacorp TV (%)
2015 2014
Zero-to-Fourteen Consumer Experience Study 2015 / 10© Media Development Authority Singapore
0 - 6, 31.5%
7-10, 31.8%
11 - 14, 36.8%
Chart 6: Watched Mediacorp TV – age breakdown (%)
0 - 6, 62.4%
7-10, 18.7%
11 - 14, 18.9%
Chart 7: Did not watch Mediacorp TV – age breakdown (%)
• Amongst children who have never watched Mediacorp TV, 6 in 10 (62.4%) were aged 0to 6 years.

Okto remained the channel most children have watched
13.9
21.8
14.4
27.0
54.5
56.7
76.4
7.1
13.2
14.5
27.2
44.2
51.1
71.2
Vasantham
Suria
Channel NewsAsia
Channel U
Channel 8
Channel 5
Okto
Chart 8: Ever watched Mediacorp channels (%)
2015 2014
Zero-to-Fourteen Consumer Experience Study 2015 / 11© Media Development Authority Singapore
Note: Respondents were children who watched Mediacorp channels.
• While most channels saw a drop in viewers, Channel U and Channel NewsAsia’sviewership remained consistent.
89.481.1
68.6
28.8
53.1 57.6
26.5
46.1 47
0 - 6 7 - 10 11 - 14
Chart 9: Ever watched Mediacorp channels – by age groups (%)
Okto Ch 5 Ch 8

Okto was also the most frequently watched channel by children
1.1
3.1
2.9
5.1
13.0
27.8
47.0
0.3
2.4
3.1
5.7
14.5
24.5
49.6
Channel NewsAsia
Channel U
Vasantham
Suria
Channel 5
Channel 8
Okto
Chart 10: Most often watched Mediacorp channel (%)
2015 2014
Zero-to-Fourteen Consumer Experience Study 2015 / 12© Media Development Authority Singapore
Note: Respondents were children who watched Mediacorp channels.
• When looking at the different age groups, it can be observed that children’s channelpreferences also became more diverse as they grew older.
80.1
56.1
41.7
9.719.3 23.5
4.912.6
17.8
0 - 6 7 - 10 11 - 14
Chart 11: Most often watched Mediacorp channel – by age groups (%)
Okto Ch 5 Ch 8

Better content on other platforms the main reason for not watching Free-to-Air TV
10.3
1.3
3.2
3.9
7.1
22.3
4.8
14.8
50.6
6.8
1.8
2.0
3.8
11.3
13.7
19.3
27.4
51.1
Others
Don't understand the language
No suitable content
Too many repeats
Too young to be exposed to TV
Shows not interesting, no favouritecelebrities
Not allowed to watch TV
Better programming online
Newer shows, better programming on Pay TV
Chart 12: Reasons for seldom/ not watching Mediacorp TV
2015 2014
Zero-to-Fourteen Consumer Experience Study 2015 / 13© Media Development Authority Singapore
Note: Respondents were children who watched Mediacorp for less than once a month, or never watched Mediacorp TV.
Other reasons include:Shows not educational, programmesare old, child prefers to play games/watch DVDs, etc.
• In particular, there was an increase in children who chose not to watch Mediacorp TVdue to better content online.
Tend to be aged 0 to 6 years
Tend to be aged 11 to 14 years
Tend to be aged 7 to 10 years

• When it came to the individual channels, the Disney Channel, Disney Junior andNickelodeon remained the top 3 channels.
Less than 4 in 10 children watched Pay TV in 2015, a drop compared to 2014
36.5
48.3
2015 2014
Chart 13: Children who watched Pay TV (%)
2015 2014
Zero-to-Fourteen Consumer Experience Study 2015 / 14© Media Development Authority Singapore
Rank Channel %
1 Disney Channel 47.3%
2 Disney Junior 46.8%
3 Nickelodeon 44.7%
4 Cartoon Network 28.8%
5 Nick Jr. 18.0%
6 National Geographic Channel 10.3%
7 Discovery Kids 9.4%
8 Baby TV 7.5%
9 National Geographic Wild 5.5%
10 Toonami 5.3%
Table 1: Top Pay TV channels

Amongst children who multitask, traditional and digital media were used in tandem
20.8
25.3
2015 2014
Chart 14: Used multiple devices at the same time (%)
Zero-to-Fourteen Consumer Experience Study 2015 / 15© Media Development Authority Singapore
Paired Activities %
Watch TV and use mobile devices 77.6
Use laptop/ PC and use mobile devices 26.0
Use mobile devices and listen to music/ radio 22.8
Watch TV and use laptop/ PC 14.4
Use mobile devices and read newspaper/ magazines 12.4
Table 2: Top paired multitasking activities
• The top paired media activities was watching the TV and using mobile devices at thesame time, with nearly 8 in 10 children doing so.
Amongst those who did so, 74.4% multitasked often
0 - 6, 12%
7-10, 25.6%
11 - 14, 62.4%
Chart 15: Children who multitask – age breakdown

Zero-to-Fourteen Consumer Experience Study 2015 / 16
4. Online Usage and Habits
© Media Development Authority Singapore

More children have gone online, and at a young age
Zero-to-Fourteen Consumer Experience Study 2015 / 17© Media Development Authority Singapore
79.876.8
2015 2014
Chart 16: Children who used the Internet (%)
Average Starting Age: 6.1 years old
• On average, around 8 in 10 children (79.8%) have used the Internet.
• Children started accessing the Internet at 6.1 years old, and generally go online 4 to 6days a week.
6.3
68.5
22.6
2.4 0.2
Daily 4 - 6 days aweek
2 - 3 days aweek
Once a week Less thanonce a week
Chart 18: Frequency of using the Internet (%)
0 - 6, 50.3%7-10,
42.2%
11 - 14, 7.5%
Chart 17: Starting age of children using the Internet
Note: Charts 17 and 18 are new questions added in 2015. These is no past year data available for comparison.

Children’s device of choice for going online: Smartphone
74.0
48.8
62.4
48.5
55.6
80.1
84.1
60.9
62.7
64.9
66.6
74.5
78.3
86.1
PC/ Laptop
Video Game Player
Smart TV
Internet-enabled Music Player*
Handheld Video Game Player*
Tablet
Smartphone
Chart 19: Devices normally used to access the Internet (%)
2015 2014
Zero-to-Fourteen Consumer Experience Study 2015 / 18© Media Development Authority Singapore
• While the smartphone and tablet remained the most often used devices, usage of thePC/ laptop dropped from third to last.
* Indicates device chosen by less than 30 respondents. Results should be interpreted with caution.

• Majority accessed the Internet at home at least 4 to 6 days a week, through theirsmartphones.
37.6
28.5 26.1
5.22.2 0.3
49.7
20.2 21.4
6.81.3 0.7
Daily 4 - 6 days aweek
2 - 3 days aweek
Once a week Less thanonce a week
Less thanonce amonth
Chart 20: Frequency of accessing the Internet (%)
2015 2014
Amongst children who have gone online, almost all have accessed the Internet at home
Zero-to-Fourteen Consumer Experience Study 2015 / 19© Media Development Authority Singapore
40.937.7
15.6
2.3
40.5
31.126.1
1.6
Smartphone Tablet PC/ laptop Internet-enabledmusic player
Chart 21: Device mostly used to access the Internet (%)
99.6% of children used the Internet at home in 2015,
up from 97.5% in 2014

• Amongst these children, more than half had gone online at least weekly, with mostusing their PC or laptops.
12.07.6
17.5
38.1
13.711.012.1 12.5
19.6
32.9
14.38.6
Daily 4 - 6 days aweek
2 - 3 days aweek
Once a week Less thanonce a week
Less thanonce amonth
Chart 22: Frequency of accessing the Internet (%)
2015 2014
Less than a third have gone online in school or at a library
© Media Development Authority Singapore
63.6
28.2
6.2 2.1
67.5
26.8
5.40.4
PC/ laptop Smartphone Tablet Internet-enabledmusic player
Chart 23: Device mostly used to access the Internet (%)
30.4% of children used the Internet in school or a library
in 2015, the same as 2014
Zero-to-Fourteen Consumer Experience Study 2015 / 20

• More than half went online while travelling at least two times a week, with nearly allusing smartphones.
26.0
17.9
37.8
12.5
3.8 1.9
37.4
13.2
25.2
14.7
6.72.8
Daily 4 - 6 days aweek
2 - 3 days aweek
Once a week Less thanonce a week
Less thanonce a month
Chart 24: Frequency of accessing the Internet (%)
2015 2014
Nearly a third of children have used the Internet on-the-go
© Media Development Authority Singapore
89.4
7.1 2.9 0.6
78.2
0.9
17.8
3.1
Smartphone Internet-enabledmusic player
Tablet PC/ laptop
Chart 25: Device mostly used to access the Internet (%)
32.6% of children used the Internet on-the-go in 2015, a slight drop from 2014’s 35.4%
Zero-to-Fourteen Consumer Experience Study 2015 / 21

While websites were used to read content, video consumption took place mostly via apps
13.6
14.3
15.4
20.8
31.3
33.3
37.4
55.6
60.0
66.7
80.0
95.2
86.4
85.7
84.6
79.2
68.7
66.7
62.6
44.4
40.0
33.3
20.0
4.8
Watch non-Mediacorp and Pay TV content online
Listen to the radio
Watch Mediacorp TV online*
Play video games
Listen to music
Read books
Go online for social networking
Access non-media websites online
Read news
Read magazines
Watch Pay TV online*
Do homework
Chart 26: Methods mostly used to access online content (%)
Go to website Use an app
Zero-to-Fourteen Consumer Experience Study 2015 / 22© Media Development Authority Singapore
* Indicates media activities chosen by less than 30 respondents. Results should be interpreted with caution.

Zero-to-Fourteen Consumer Experience Study 2015 / 23
5. Social Media Usage and Habits
© Media Development Authority Singapore

0 - 6, 42.4%
7-10, 43.5%
11 - 14, 14.1%
Chart 29: Age started using social media – age breakdown
More children used social media in 2015
Zero-to-Fourteen Consumer Experience Study 2015 / 24© Media Development Authority Singapore
65.0
49.8
2015 2014
Chart 27: Children who have used social media (%)
0 - 6, 31.9%
7-10, 28.3%
11 - 14, 39.7%
Chart 28: Ever used social media – age breakdown
Average Starting Age: 8.6 years old
• Similar to 2014, most children started using social media between 7 to 10 years old, withthe average starting age being 8.6 years old.

YouTube overtook Facebook to become the most used social media network
2.6
3.6
3.5
10.0
1.4
19.9
51.4
78.4
71.6
2.2
2.2
2.3
3.8
10.0
12.7
14.7
38.2
57.8
91.4
Tumblr
Vine
Ask.FM
Snapchat
Google+
YouTube
Chart 30: Social media networks currently using (%)
2015 2014
Zero-to-Fourteen Consumer Experience Study 2015 / 25© Media Development Authority Singapore
Note: Google+ option was newly added in 2015
46.9
64.573.5
16.1
37.1
69.9
0.4
25.2
60.8
0 - 6 7 - 10 11 - 14
Chart 31: Social media networks currently using – by age groups (%)
YouTube Facebook Instagram
• As children grew older, usage of social media networks increased and diversified.

YouTube was also the children’s favourite social media network
0.1
0.1
0.1
0.1
0.4
0.6
6.8
12.3
79.1
Vine
Ask.FM
Google+
Snapchat
YouTube
Chart 32: Favourite social media network (%)
Zero-to-Fourteen Consumer Experience Study 2015 / 26© Media Development Authority Singapore
• While YouTube was consistently the favourite social media network, older childrenpreferred Instagram over Facebook.
98.487.3
57.7
1.28.1
28.1
0.4 3.610.3
0 - 6 7 - 10 11 - 14
Chart 33: Favourite social media network – by age groups (%)
YouTube Facebook Instagram
Top reasons for choosing YouTube include:Interesting videos available, friends being on the network and ability to get updates on friends
Note: New question added in 2015. These is no past year data available for comparison.

Instagram was the social media network most frequently accessed via mobile devices
22.2
27.8
37.0
45.2
35.3
39.7
47.1
36.7
53.8
58.1
7.1
12.6
6.1
5.9
13.3
17.6
6.7
9.0
13.1
9.1
16.7
11.5
12.2
23.5
13.7
5.9
30.0
16.7
12.1
25.3
11.1
4.5
5.2
11.8
7.3
5.9
6.7
10.3
5.4
5.1
16.7
1.7
2.6
11.8
3.1
11.8
10.0
1.3
1.0
21.2
16.7
20.2
23.5
11.8
17.7
11.8
10.0
7.7
7.7
10.1
11.1
12.5
5.2
5.1
1.3
2.7
Google+
Vine*
YouTube
Tumblr*
Pinterest*
Ask.FM
Snapchat
Chart 34: Frequency of using mobile devices to access social media networks (%)
Daily 4 - 6 days a week 2 - 3 days a week Once a week Less than once a week Less than once a month Never
Zero-to-Fourteen Consumer Experience Study 2015 / 27© Media Development Authority Singapore
* Indicates social media networks chosen by less than 30 respondents. Results should be interpreted with caution.

twitter/MDASingapore | youtube/MDASingapore | www.mda.gov.sgfacebook/MDASingapore |
Thank You
© Media Development Authority Singapore
Copyright © 2015 MDA All rights reserved.
No part of this material may be stored in a retrieval system, transmitted, or reproduced in any way, including but not limited to photocopy, photograph,magnetic or other record, without the prior agreement and written permission of the Media Development Authority.
Notwithstanding the above, part or parts of this publication may be used with the proper acknowledgement of its source without having to first obtain theprior agreement and written permission of the Media Development Authority.