Embed Size (px)
Citation preview

.,“1
MD SIMULATIONS OF CARBONMONOXYMYOGLOBIN AND CALCULATIONS OF HEMECD
ROBERT W. WOODY’, CHRISTOPH KIEFL’, NARASIMHASREERAMA’, YI LU2, YAN QIU2, and JOHN A. SHELNUTT2
‘Department of Biochemistry and Molecular Biology, Colorado State University, Fort
Collins CO 80525, USA2Biomolecular Materials and Intetiaces Department, Sandia National .luboratories,Albuquerque NM 87185 USA
Key words: Myoglobin, Heme isomerism, Circular dichroism, Molecular dynamics, Non-planar heme distortions, Normal coordinate structural decomposition
Abstracti The Soret circular dichroism (CD) spectrum of carbonmonoxy myoglobin dtifersstrikingly for the two heme isomers: Aqzl =+90 M-’cm-’ for isomer A, AQ21= -7 M-’cm-’ for isomer B (Aojula et al., BiochemJ. 250, 853(1988)). Thisobservation implies significant differences in the protein conformation andlordistortions of the heme from planarity between the two isomers. Moleculardynamics simulations of the two isomers have been performed, using bothneutron diffraction (ND) and NMR structures for stwting geometries. Thegeometry for isomer B was generated from the isomer A geometry by rotationof the heme by 180° about the a-y methine carbon axis. Four ND-basedtrajectories for isomer A, each of 600 ps duration, gave average CD spectrathat reproduced the strong positive Soret CD inferred for isomer fromexperiment. Four such trajectories for isomer B gave results similar to thosefor isomer A, and therefore disagreed with the weak negative Soret CD bandinferred from experiment for isomer B. The two NMR-based hajectories foreach isomer gave poor agreement with experiment. We attribute the failure ofthe calculations for isomer B to a poor starting structure for this isomer, andwe are conducting further studies to overcome this problem. In the successfulcalculations for isomer A, heme-aromatic side chain coupling accounts for
1
.— —— -.-—

DISCLAIMER
This report was.prepared as an account of work sponsoredby an agency of the United States Government. Neitherthe United States Government nor any agency thereof, norany of their employees, make any warranty, express orimplied, or assumes any legal liability or responsibility forthe accuracy, completeness, or usefulness of anyinformation, apparatus, product, or process disclosed, orrepresents that its use would not infringe privately ownedrights. Reference herein to any specific commercialproduct, process, or service by trade name, trademark,manufacturer, or otherwise does not necessarily constituteor imply its endorsement, recommendation, or favoring bythe United States Government or any agency thereof. Theviews and opinions of authors expressed herein do notnecessarily state or reflect those of the United StatesGovernment or any agency thereof.
... ..- fi. w.r --..7, .- .,.—.. . —.—. . . .. . ... , ..— ..__. - . . —- —---- . . . ..- ..-— .-—

DISCLAIMER
Portions of this document may be illegiblein electronic image products. Images areproduced from the best available originaldocument.
“-c-’-e, ., , . ,Xr:- . -7 ,L.. . . ! ..-,.?<Tzi ,. . . > , , . .. —, --- .72 , ?- %.7<-.;7. . ... . . . .. .,, ...,,.>. 7,7,7,.,..,, . . . . . . . . . . . —- = .- - ,- ,. —-.-, .--e - ----

2
1.
t 1
Woody et al.
40% of the total Soret rotational strength, whereas heme-peptide couplingand intrinsic heme CD account for-30% each. Heme nonplanarity has beenanalyzed by normal coordinate structural decomposition (Jentzen et al., J. Am.Chem. Sot. 117, 11085 (1995)). Of the out-of-plane normal modes, rufflingcorrelates well with the rotational strengths of the two Soret components,which usually are opposite in sign. Correlation of rufflhrg with the net Soretrotational strength is relatively weak. The out-of-plane deformations of theheme are similar in isomers A and B, consistent with the similarity in thecalculated Soret CD spectra.
INTRODUCTION
Axel Wollmer and I first became acquainted through the literature. Axel noted
the communication that Ming-Chu Hsu and I published in 1969 (Hsu & Woody,
1969) in which we provided an explanation of the circular dichroism of heme
absorption bands in heme protein. Ming-Chu and I found that the sign and
approximate magnitude of all four observable heme mt* bands in Mb and Hb (HSU
& Woody, 1971) could be accounted for by coupled-oscillator interactions between
the heme and aromatic side chains in the protein. Axel collaborated with JorgFleischhauer to apply this approach to Chhwmmus hemoglobin, the monomeric
heme protein that Axel was studying intensively at that time. This hemoglobin was
of special interest because its Soret CD is opposite in sign (Formanek & Engel,
1968; Wollmer et aL, 1970) to those of mammalian and other vertebrate Mb and Hb.
Jorg and Axel (Fleischhauer & Wollmer, 1972) showed that the coupled-oscillator
mechanism accounted for the observed Soret CD band in Chironomus Hb, includingthe sign reversal, thus greatly strengthening the case for the generrdity of this
mechanism.I finally met Axel and Jorg in 1982 on a visit to Aachen that had been
arranged through Wolfgang Strassburger, whom I had met at a British Biophysicrd
Society meeting held in York - another Alcuin connection! Since then I haveenjoyed AxeI’s hospitality in Aachen many times, including a most enjoyable and
productive sabbatical year with Axel and Jorg in 1995-96. So far, I have only been
able to reciprocate on one occasion, when Axel and Biirbel visited us for several
days in Fort Collins. I hope that we will have more opportunities now that Axel will
have a more relaxed schedule.
2. HEME ISOMERISM
In this paper, we present some recent results we have obtained in our effort to
understand the implications of heme isomerism for the CD of hemoproteins. Hemeisomerism refers to the existence of two isomers of hemoproteins containing
noncovalently bound protoheme IX, such as Mb, Hb and the cytochromes b. Three

I J
MD Simulations and Heme CD calculations of CO Myoglobin 3
groups – those of Gerd LaMar and Klaus Gersonde (LaMar et al., 1978a), Kurt
Wiittilch (Keller et al., 1976) and Hans Ruterjans (Ribbing et al., 1978) – observed
a doubling of the resonances of the heme, with each heme methyl or methine groupgiving rise to two peaks of unequal intensity. Two explanations for this doubling
were proposed: protein isomerism resulting from cis-trans isomerism in a critical
proline residue or from sequence variants, or heme isomerism resulting from the
pseudo two-fold axis of protoheme IX (Figure 1). LaMar and co-workers (LaMar er
al., 1978b) conclusively demonstrated that heme isomerism was the source of the
methyl resonance doubling, using isotonically substituted protohemes. As shown in
Figure 1, the a-y axis is a pseudo two-fold axis relating the two equivalent
propionate side chains of the porphyrin, which must be on the outside of the protein.
Rotation about this axis also interchanges methyl and vinyl substituents on the
opposite edge of the porphyrin ring. The protein discriminates between these
methyls and vinyls imperfectly, with isomeric ratios for the native protein varying
from ca. 10:1 for sperm whale Mb (LaMar et al., 1984) to ca. 1:1.5 for yellow fintuna Mb (Levy et al., 1985). LaMar and coworkers have also shown (Jue et aL,
1983) that the apoprotein cannot discriminate between these two kinds of
substittrents at all, so Mb freshly reconstituted from the apoprotein and protohemin
IX has a 1:1 isomeric ratio.
‘R Isomer A\
Isomer B
x A
Figure 1. Orientation of protoheme IX in isomers A and B, differing by a 180° rotation of theheme about the cq methine carbon axis. This isomerization exchanges the position of the 2-vinyl with the 3-methyl and the 4-vinyl with the 1-methyl. The view is from the proximal sideof the heme. In sperm-whale Mb, isomer A is the major form (-90%) and isomer B is theminor fqrrn (-10%).
Does heme isomerism have any physiological significance? Originally,LaMar’s group (Livingston et al., 1984) reported that the two heme isomers of
sperm-whale myoglobin have OZaffinities that differ by an order of magnitude, withisomer B binding Oz more strongly. However, two groups (AojuIa et al., 1986;

I 1
4 Woody et al.
Light et al., 1987) have re-examined this question and found no difference in the 02
affinity for the two isomers, beyond experimental error. Differences of possible
physiological relevance have been reported for two other heme proteins, however.A difference of 27 mV in the reduction potential of the hvo isomers of cytochrome
b5 has been found (Walker et al., 1988), and the Bohr effect of Chironomus thummi
thummi hemoglobin has been shown to be different for the two isomers (LaMar,
1978a).
In their study of the putative differences in Oz affinity of the two sperm-whale
Mb isomers, both Aojula et al. (1986) and Light et al. (1987) made a very
interesting observation concerning the CD spectra of the heme isomers. They found
that the Soret CD of the freshly reconstituted protein was only about half as intense
as that of the native protein. Since freshly reconstituted Mb is a 1:1 mixture of the
two isomers and the native protein is a 10:1 mixture, this implies that isomer B has a
very weak Soret CD band, relative to that of isomer A. In a later study, Aojula et aL
(1988) investigated this question quantitatively, measuring both the NMR spectrum
and the CD spectrum of reconstituted Mb during the course of equilibration. A plot
of the measured Soret CD for MbCO as a function of the heme isomer ratio based
upon NMR showed a linear relationship from which the Soret CD of the pure A and
B forms can readily be obtained by extrapolation. The A isomer has a strong
positive Soret CD (+90 M1 cm-l), whereas the B isomer has As = –7 M-l cm’1 at the
Soret maximum. Thus the two isomers give Soret CD bands of opposite sign.
Can the coupled-oscillator model of heme protein CD (Hsu and Woody, 1969,
197 1) account for this huge difference? If we consider the heme to be planar and
neglect any changes in the protein conformation upon rotating the heme about the a-y axis, the answer is No! Firs~ it must be recalled that the Soret band of
metalloporphyrins is doubly degenerate (or nearly so) (PlatL 1956) with the two
Soret transitions polarized in the heme plane and perpendicular to each other. Since
Ming-Chu and I had no a priori knowledge of the direction of these transition
moments, we were concerned about how the absolute directions might affect our
results. We showed (Hsu and Woody, 1971) that rotation of the transition moments
in the plane has no effect on the net Soret rotational strength resulting from the twocomponents, although it does affect the distribution of the rotational strengths
between the hvo Soret components. A simple rotation by 180° about the a-y axis isequivalent to rotation of the Soret transition moments and thus should not affect the
net Soret rotational strength, although it might affect the band shape.
Therefore, the large difference in the Soret CD for the two heme isomers
requires that either non-planar distortions of the heme make significant contributionsand differ for the two forms, or that there are significant differences in the heme-
aromatic side chain interactions, probably due to changes in the relative position and
orientation of the side chains. One hypothetical model (Moench, 1985) that couldqualitatively account for the observations without requiring substantial
rearrangements of the protein is as follows: contributions of heme non-planarity are
——....- -—-- .-— --------—------

MD Simulations and Heme CD calculations of CO Myoglobin 5
comparable in magnitude to those of heme-aromatic coupling, and the heme adopts
approximately enantiomenc conformations in the two isomers, whereas the protein
conformation is largely unchanged. In isomer A, the non-planar heme contributions
are positive, like those of the heme-aromatic interactions and give rise to the inferred
strong positive CD for this isomer. On the other hand, isomer B has negative
contributions from the non-planar heme that slightly outweigh positive heme-
aromatic coupling contributions and yield a weak negative Soret CD band!
30 METHODS
To test this and other possible explanations of the dramatic CD spectral
differences between isomers A and B, we have undertaken CD calculations for the
two heme isomers of sperm whale MbCO. For isomer A, high-resolution structures
are available from x-ray diffraction (Yang and Phillips, 1996), neutron diffraction
(Cheng and Schoenborn, 1991) and NMR (Osapay et al., 1994). For isomer B,
however, no structures are available since one can obtain at most a 50:50 mixture ofisomer B with isomer A. We therefore have performed molecular dynamics
simulations for both isomers A and B. In addition to providing a structure (actually
many structures!) for isomer B, simulations on isomer A will provide an assessment
of the effects of dynamics on the predicted CD of isomer A. This is an area in which
Axel Wollmer, Jorg Fleischhauer and I have long shared an interest and in which we
have actively collaborated (Fleischhauer et al., 199% Koslowsld et al., 1996).To construct a starting structure for dynamics on isomer B, we took the
neutron diffraction structure of isomer A (PDB entry 2mb5, Cheng & Schoenbom,
1991), removed the heme, rotated it by 180° about the a-y axis, then reinserted it in
the heme pocket. The starting structures for isomers A and B were then subjected toenergy minimization using the GROMOS96 force field (van Gunsteren er al., 1996),after immersion in a box of water molecules with NH4+,S042-, and Cl- ions to assureelectroneutrality. For each isomer, we carried out four simulations at 300K, each of
600 ps duration, with different sets of initial velocities. We also used two out of
twelve NMR structures (Osapay et al., 1994) as starting structures for a 600 ps
simulation of isomer A and, after rotation of the heme, of isomer B.
For each of the structures along the trajectories (12,000 structures per
trajectory), we calculated the intrinsic heme CD, using n-electron theory and treating
the heme as a divinyl porphyrin dianion, i.e., neglecting the iron and the alkyl
substituents but considering the vinyl groups as part of the n-electron system. The“standard” parameters of Weiss et al. (1965) were used and the 32 lowest energyexcited configurations were used in the configuration interaction. The transitionparameters for the heme were also used to calculate the coupling of the Soret
transitions with the aromatic side chains and the peptide groups of the protein. The
CD spectrum in the Soret region was then calculated for each structure along the

1
6 Woody et al.
trajectory, assuming Gaussian band shapes and a band width of 8.1 nm, and these
spectra were then averaged for the trajectory to calculate the average CD.
4. RESULTS AND DISCUSSION
4.1 Calculated Soret CD Spectra
Figure 2 compares the calculated spectra for the six trajectories (1-4 based on
neutron diffraction, 5 and 6 on NMR structures) with one another and with
experimen t(tlickline). First let’s look atthespectra for isomer A. Itcan be seen
that the four ND-based trajectories give predicted spectra that are similar in
amplitude toone another and to experiment. The wavelengths fortrajectones land
2 are also very similar, but those for trajectories 3 and 4 are somewhat red-shifted.
The calculated curves are blue-shifted by about 30 nm relative to the experimental
curve, but this is a dkcrepancy to be expected because of the neglect of the iron
atom inthen-electron calcttlations. l%ally, note that thetwo NMR structures give
calculated curves that differ significantly in amplitude from the ND-based curves
and from experiment. In the case of trajectory 6, differences in shape are predicted.
A(E)
100
75
50
25
0
-25-
350 375 400 425 450 375 400 425 450Wavelength
Figure 2. Soret CD spectra of MbCO, calculated from MD trajectories (thin curves),compared with CD spectra for isomers A and B based on experiment (thick curves). Thecurves numbered I-4 for each isomer are based on the, neutron diffraction structure (Chengturd Schoenbom, 1991). Curves 5 and 6 are based on two NMR-derived structures (Osapay etal., 1994). The experimentally based spectrum for isomer A is calculated from the CDspectrum of the equilibrium mixture of MbCO isomers, multiplied by a factor such thatA~X=+90 M-l cm-t, as reported for isomer A (Aojula et al., 1988). For isomer B, a factorsuch that A~aX= -7 M-* cm-l was used.

,
MD Simulations and Heme CD calculations of CO Myoglobin 7
Turning to the results for isomer B, we find that the calculated CD curves forthe ND-based trajectories, 1-4, are comparable in amplitude to those for the ND-
based trajectories of isomer A but not to the experimentally inferred weak negative
band. Again, as with isomer A, the NMR -based trajectories give a weaker Soret
CD band and, in the case of trajectory 6, a positive couplet that contrasts with the
negative couplet for trajectory 6 of isomer A.
Tabfe I. Soret Rotational Strength Contributions in CO-Myoglobin”
Isomer A Isomer B
Rotational Standard Rotational StandardStrength Deviation Strength Deviation
Total 0.4973 0.0896 0.6780 0.1173Heme 0.1464 0.0627 0.2506 0.0921
Aromatic 0.1984 0.0102 0.2984 0.0464Peptide 0.1550 0.0357 0.1291 0.0202
‘ Results are presented as averages and standard deviations over four 600 ps simulations
based on the ND structure. Rotational strengths are given in Debye-Bohr magnetons.
The different contributions to the Soret CD are shown in Table I, averaged
over the ND-based trajectories. For isomer A, we obtain an average of 0.50 DBM
with a standard deviation of 0.09. This is to be compared with the experimental
value of 0.71 DBM for the equilibrium mixture of isomers. About 40% of the
rotational strength (0.20 DBM) results from the coupling with the aromatic groups,with a standard deviation of 570 of the mean. The peptides contribute about 3070 of
the total, with a standard deviation of about 2070 of the mean. Finally, the intrinsic
heme contribution averages about so~o of the total, with a larger standard deviation,about 4070 of the mean value.
For isomer B, the peptide-coupling contribution is comparable to that for A,
with a comparable standard deviation. The aromatic-coupling contribution is 44’ZO
of the total, with a larger standard deviation than for isomer A. The intrinsic heme
contribution is larger, with a standard deviation that is 37% of the mean. The total
for isomer B (0.68 DBM) is somewhat larger than that for isomer A, with a standard
deviation of about 15% of the mean, largely attributable to the spread in the intrinsicheme contributions. However, the predicted large positive rotational strength for
isomer B disagrees with the small negative rotationrd strength inferred for isomer B.
Overall, we can draw the following conclusions from the MD simulations:
First, the calculations for isomer A give good agreement with experiment if
the ND structure is used as the starting geometry. The intrinsic heme contributions
are significant but only account for about 3070 of the total. The aromatic-coupling
contribution is the largest single factor. This supports the earlier work of Hsu and
Woody (1969, 1971) and the results of Fleischhauer and Wollmer (1972). Thesignificant contribution of heme coupling with peptide groups is consistent with a
8 Woody et al.
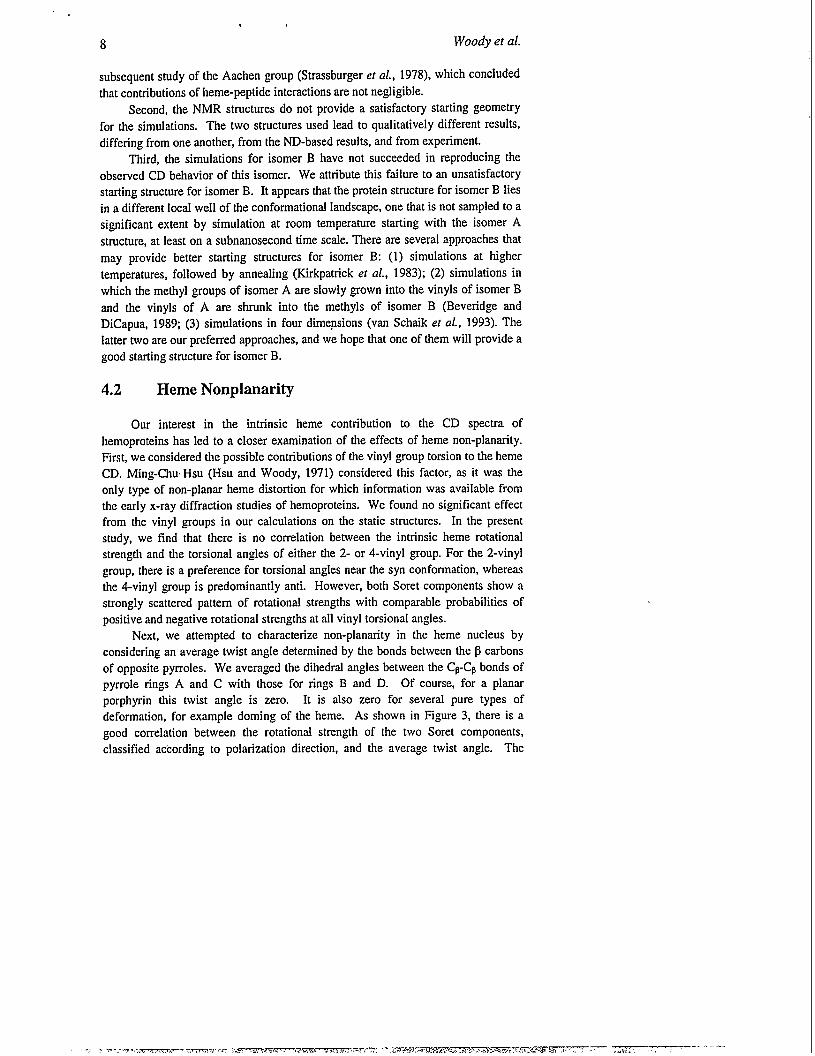
subsequent study of the Aachen group (Strrrssburger et al., 1978), which concluded
that contributions of heme-peptide interactions are not negligible.Second, the NMR structures do not provide a satisfactory starting geometry
for the simulations. The two structures used lead to qualitatively different results,
differing from one another, from the ND-based results, and from experiment.
Third, the simulations for isomer B have not succeeded in reproducing theobserved CD behavior of this isomer. We attribute this failure to an unsatisfactory
starting structure for isomer B. It appears that the protein structure for isomer B lies
in a different local well of the conformatiorral landscape, one that is not sampled to a
significant extent by simulation at room temperature starting with the isomer A
structure, at least on a subnanosecond time scrde. There are several approaches that
may provide better starting structures for isomer B: (1) simulations at higher
temperatures, followed by annealing (Kirkpatrick et al., 1983); (2) simulations in
which the methyl groups of isomer A are slowly grown into the vinyls of isomer B
and the vinyls of A are shrunk into the methyls of isomer B (Beveridge and
DiCapua, 1989; (3) simulations in four dimensions (van Schaik et al., 1993). The
latter two are our preferred approaches, and we hope that one of them will provide a
good starting structure for isomer B.
4.2 Heme Nonplanarity
Our interest in the intrinsic heme contribution to the CD spectra of
hemoproteins has led to a closer examination of the effects of heme non-planarity.Fhst, we considered the possible contributions of the vinyl group torsion to the heme
CD. Ming-Chw Hsu (Hsu and Woody, 1971) considered this factor, as it was theonly type of non-planar heme distortion for which information was available from
the early x-ray diffraction studies of hemoproteins. We found no significant effect
from the vinyl groups in our calculations on the static structures. In the present
study, we find that there is no comelation between the intrinsic heme rotationalstrength and the torsional angles of either the 2- or 4-vinyl group. For the 2-vinyl
group, there is a preference for torsional angles near the syn conformation, whereasthe 4-vinyl group is predominantly anti. However, both Soret components show a
strongly scattered pattern of rotational strengths with comparable probabilities ofpositive and negative rotational strengths at all vinyl torsional angles.
Next, we attempted to characterize non-planarity in the heme nucleus byconsidering an average Wist angle determined by the bonds between the ~ carbons
of opposite pymoles. We averaged the dihedral angles between the CP-CPbonds ofpyrrole rings A and C with those for rings B and D. Of course, for a planarporphyrin this twist angle is zero. It is also zero for several pure types of
deformation, for example doming of the heme. As shown in Figure 3, there is a
good correlation between the rotational strength of the two Soret components,
classified according to polarization direction, and the average twist angle. The
.. -7-—--7. .- Z.. . -m= , r- -,- FFv-,7JG77-mY-? ~- -,-,XWJ ->7?r4?,w’?P-- . ..... .. . ...’-..- -... >.,..,-c=a>:< ,.. . , ,.. — . ..>., , -,. -- ..— --

MD Simulations and Heme CD calculations of CO Myoglobin 9
correlation is similar for isomers A and B. Note that the individual structures along
the trajectory give rise to rotational strengths for individual components as large as
*2 DBM. However, such a large rotational strength for one component is invariably
associated with a large rotational strength of opposite sign for the other, and the net
rotational strengths of the Soret band arising from heme distortions are relatively
modest and show only a weak correlation with the average twist angle.
Nevertheless, there is a distinct bias toward positive rotational strengths (Table I).
Isomer A Isomer B3, I
2
1
50mQ .1
=p .2
g=
Zn
Ri2
2gl
20
.1
-2
-- -40 .20 0 20 40 .40 .20 0 20 41
AverageTwistAngle
Figure 3. Correlation of the rotational strengths of the two Soret components, classifiedaccording to their polarization, with the average twist angle. The average twist angle iscalculated from the virtual dihedral angles between the two sets of opposing pyrrole rings, ~~cand ‘t210.The average twist angle is defined as I‘tI=(ITAC I + I~BOI) / 2 withhesignofT*C.
John Shelnutt and co-workers (Jentzen et al., 1995, 1996 Shelnutt ef al.,
1998) have developed a very attractive method for analyzing non-planar distortions
in porphyrins, using the six lowest frequency normal modes for out-of-plane
vibrations. The method is called normal-coordinate structural decomposition
(NSD). Shelnutt and co-workers have shown that distortions along these normal
modes can describe the out-of-plane deformations of the porphyrins in the severalhundred hemoproteins for which high-resolution structures are available in theProtein Data Bank. This approach is illustrated in Figure 4 for the case ofcytochrome c. The distorted porphyrin is shown at the top left and the total
distortion (the total deviation from the mean-square plane) is just over 1A. The six
fundamental types of distortions (normal modes) are shown on the left. The

10 Woody et al.
distortions are called saddling, ruffling, doming, waving (x), waving (y) and
propellering, in approximate order of increasing energy and decreasing amplitude
for an unperturbed porphyrin. We see that the heme in cytochrome c is primarily
deformed by ruffling, which by itself (solid bar) accounts for most of the observed
deviations. There are also small amplitudes of saddling and waving, but these are in
opposite directions and make only a small net contribution.
sad (B2u)
– ruf (Blu)
dom (A2u)
wav(x) ( Egx)
~~
wav(y) ( Egy)
—— Dro— WW(Y)_ wav(x)— dom— mf— sad
zero
‘FJ —
-0.5 0.0 0.5
Deformation (in )
. .. ....- .... --— .-, —s —..—— --=— . . —..> -- . . ..-. ., . . . . . . . ..— ,. ~—. . .
I
pro (Alu)
Figure 4. Types of heme distortions and their contribution to the description of thedeformation of the heme in horse-heart cytochrome c (PDB file Ihrc, Bushnell er al., 1990).The heme structure is shown at the top left, with the deformation modes shown below. On theright, deformations are quantimted, with the modes indicated by shading as shown at the topright.
In the present work, the average structure over various time periods for one Aand one B trajectory has been analyzed by NSD. In addition, the individualstructures over a 5-ps interval have been analyzed for a trajectory of isomer A. (The
“.
MD Simulation and Hem; CD cal&lations of CO Myoglobin 11
code for the NSD analysis program requires a manurd start for each structure
studied, so it is far too labor intensive to examine a full trajectory point by point!)
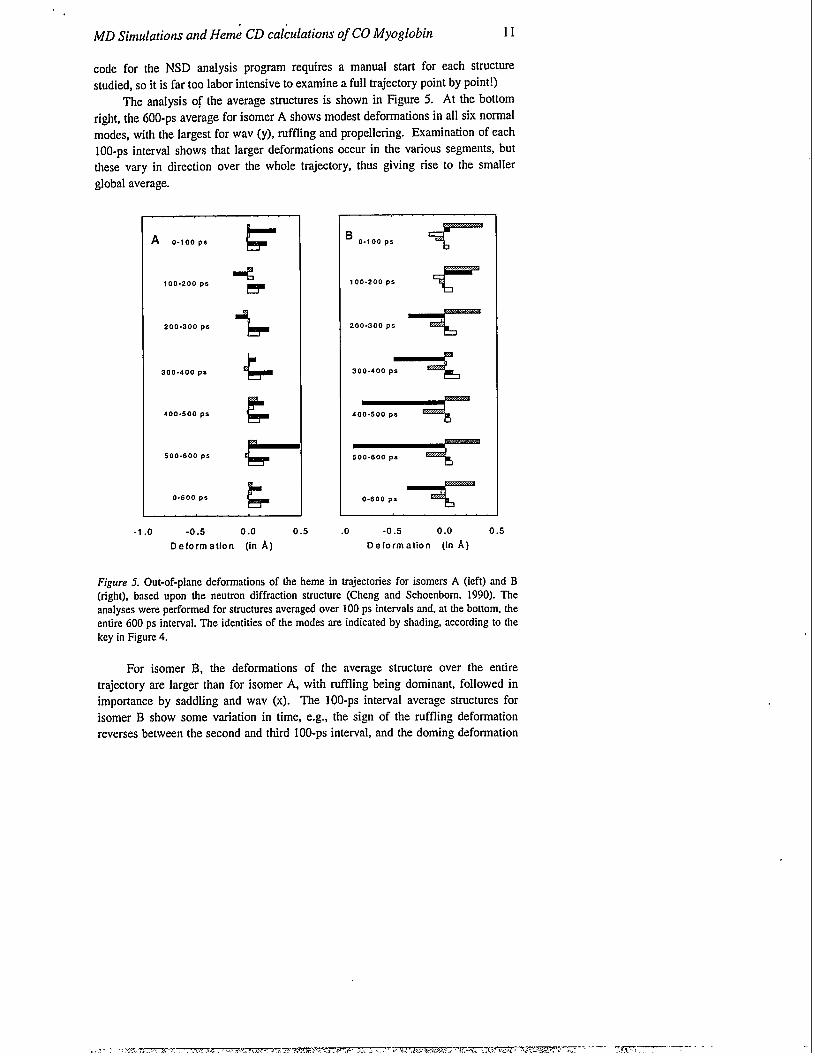
The analysis of the average structures is shown in Figure 5. At the bottom
right, the 600-ps average for isomer A shows modest deformations in all six normal
modes, with the largest for wav (y), ruffling and propellering. Examination of each
100-ps interval shows that larger deformations occur in the various segments, butthese vary in direction over the whole trajectory, thus giving rise to the smaller
global average.
A 0.100 ps
100-200 ps
200-300 PS
300-400 ps
400.500 ps
500-600 PS
0-600 PS
%!!!s=
I!&
3O-lOOps c
100-200 psr
200-300ps r
300-400,-
do~
s~
0-600ps T
-1.0 -0.5 0.0 0.5Deformation (in A)
.0 -0.5 0.0 0.5
f)eformation (in A)
Figure 5. Out-of-plane deformations of the heme in trajectories for isomers A (left) and B(right), based upon the neutron diffraction structure (Cheng and Schoenbom, 1990). Theanalyses were performed for structures averaged over 100 ps intervals and, at fire bottom, theentire 600 ps interval. The identities of the modes are indicated by shading, according to thekey in Figure 4.
For isomer B, the deformations of the average structure over the entire
trajectory are larger than for isomer A, with ruffling being dominant, followed in
importance by saddling and wav (x). The 100-ps interval average structures for
isomer B show some variation in time, e.g., the sign of the ruffling deformation
reverses between the second and third 100-ps interval, and the doming deformation

12 Woody et al.
tread y vanishes in the fifth 100-ps interval, but the most striking effect is that the
ruffling deformation increases strongly in the last half of the simulation.
iuf+ -ruf
sad + sad
dom + -dom
Wav(x) + -Wav(y)
Wav(y) + -Wav(x)
pro + pro
Figure 6. Transformation properties of the out-of-plane normal modes describing hemedeformations. The modes on the left transform to the modes on the right when the heme isrotated by 180°aboutthe a-y methine carbon axis.
It can be seen from Figure 5 that the time-averaged structures for isomers A and
B frequently have the opposite signs of deformation, especially the prominentruffling distortion that, as will be seen, is especially important for CD. However, in
comparing the deformations for isomers A and B, one must take into account the
effect of the two-fold rotation about the a-y axis that interconverts the two forms.
When this is considered, the rules for transformation are given in Figure 6. We see
then that, in fact, the structure averaged over the full 600 ps has qualitatively the
same deformations for each normal mode. This extends to most of the structuresaveraged over 100-ps intervals as well. Thus, it appears that the time-average
deformations imposed on the heme by the protein are qualitatively the same for
isomers A and B. This is consistent with the result noted earlier, that the net
intrinsic rotational strength for the heme transitions is positive for both isomers. This
may be an artifact of the present calculations for isomer B, however. If we can get
into the right region of confirmational space for isomer B in further simulations, the
time-average conformations may be different and the intrinsic heme contribution to
the Soret rotational strength may have a net negative value when averaged over thetrajectory.

MD Simulations and Heme CD calculations of CO A4yoglobin 13
1.2
1.0
0.8
~ 0.6
5 0.4
jj 0.2
~ 0.0
.0.2
.0.4
-0.6
0.0 0.5 1.0 1.5 2.0 2.5 3.0 3.5 4.0 4.5 5.o 5.5 6.0
Time (PS)
1.2
1.0
0.8
~ 0.6
~ 0.4
g 0.2.Q 0.0
4.2
-0.4
46~0.0 0.5 1.0 1.5 2.0 2.5 3.0 3.5 4.o 4.5 5.o 5.5 6.0
Time (Ps)
Figure 7. Time course of the individual deformation modes for the initial 6.4 ps of an MDsimulation for isomer A, starting from the neutron diffraction structure. Top: sad, ruf, anddom deformations; Bottom, wav(x), wav(y), pro and total deformations.
When we examine the individual structures, we find rapid fluctuations in aIl of
the deformations, as seen in Figure 7 for the O-6 ps interval of a trajectory for isomer
A. Each of the deformations reverses sign a number of times over the interval. AFourier amdysis of these time series has been performed. The most conspicuous
feature from this analysis is a peak in the ruffling deformation with a frequency ofca. 50 cm-l, comparable to the frequency predicted from a vibrational arrafysis
(Jentzen er af., 1997) of Cu-porphine (88 cm-l). However, none of thesedeformations give simple vibrationrd patterns because of interactions with the heme
pocket.We have sought correlations between the normal coordinates and the average
twist angle discussed above, and between the normal coordinates and the sign of theintrinsic rotational strengths of the Soret components. Only the ruffling component

.
14 Woody et al.
correlates with these other parameters. It is therefore not surprising that the x- and y-
components of the Soret band correlate well with the ruffling distortion but with
none of the other types of distortion.
In summary, the NSD analysis of the MD trajectory has revealed two important
conclusions:
1. Ruffling distortions are the most important contributors to the inherent CD of
porphyrins, and2. The distortions of the heme stabilized by the protein are qualitatively the same
for isomers A and B, as emerges from the simulations thus far. However, it is
very possible (perhaps even likely) that simulations using a more suitable
starting structure for isomer B will reveal qualitative differences.
5. ACKNOWLEDGMENTS
Support of grants from NH-I (GM22994) and the Pittsburgh Supercomputer
Center (MCB980029P) are gratefully acknowledged. Sandia is a mukiprogram
laboratory operated by Sandia Corporation, a Lockheed Martin Company, for the
United States Department of Energy under Contract DE-AcC04-94AL85000. Thisstudy was initiated when RWW was on sabbatical in the Laboratory of Physical
Chemistry, University of Groningen. RWW sincerely thanks Wilfred van Gunsteren
for his guidance and for many helpful discussions, and both Wilfred and Herman
Berendsen for their warm hospitality during his sabbatical. Support for the
sabbatical was generously provided by a Fogarty Senior Intemationrd Fellowship
(F06 TW01417) and Colorado State University. We thank Conrad Schaefer for
measuring the CD spectrum of MbCO used in Figure 2 and for the determination of
the rotational strength.
6. REFERENCES
Aojoula, H. S., Wilson, M. T. and Drake, A. ( 1986) Characterization of haem disorder bycircular dichroism, Biochem. J. 237,613-616.
Aojula, H. S., Wilson, M. T., Moore, G. R. and Williamson, D. J. (1988) ‘H-NMR and CDstudies of haem orientational disorder in sperm-whale myogIobin and humanhemoglobin, Biochem. J. 250,853-858.
Beveridge, D. L. and DiCapua, F. M. (1989) Free energy via molecular simulation:Application to chemical and biochemical systems, Atmu. Rev. Biophys. Biophys. Chem.
18,431-492.
Bushnell, G. W., Louie, G. V., and Brayer, G. D. (1990) High-resolution three-dimensionalstructure of horse heart cytochrome c. J. Mol. BioL 214,585-595.
Cheng, X. and Schoenborn,B.P.(1991 ) Neutron diffraction study of carbonmonoxy-myoglobin. J. Mol. Biol. 220,381-399.
. . -:, ...,,- ..- ; ---rvr.-* -? . T$.-K73v7r.m ,-<T. -, -. .— ~>~.,. . . . . . . .
. . . . ..y.-.. m.. .,. > ? . . ... . ‘.,., . . . . ,.

MD Simulations and Heme CD calculations of CO Myoglobin 15
Flcischhauer, J. and Wollmer,A.(1972) Influence of aromatic amino-acid side chains on signof Soret Cotton effect in Chironomus hemoglobin (CITIII), Z Natu~orsch. B 27,530-
532.
Fleischhrwer, J., Grotzinger, J., Kramer, B., Kruger, P., Wollmer, A., Woody, R. W., andZobel, E. (1994) Calculation of the CD spectrum of cycIo (L-Tyr-L-Tyr) based on amoIecular dynamics simulation, Biophys. Chem. 49, 141-152.
Formanek, H. and Engel, J. (1968) Optical rotatory dispersion of a respiratory hemeprotein ofChironomus thummi. Biochim. Biophys. Acts 160,151-158.
Hstr, M.-C. and Woody, R. W. (1969) Origin of the rotational strength of heme transitions inmyoglobin, J. Am. Chem. Sot. 91,3679-3681.
Hsu, M.-C. and Woody, R. W. ( 1971) The origin of the heme Cotton effects in myoglobin andhemoglobin. J. Am. Chem. Sot. 93,3515-3525.
Jerttzen, W., Simpson, M. C., Hobbbs, J. D., Song, X.-Z., Ems, T., Nelson, N. Y., Medforth,C. J., Smith, K. M., Veyraq M., Mazzanti, M., Ramasseul, R., Marchon, J.-C., Takeuchi,T.; Goddard, W. A. III and ShelhruL J. A. (1995) J. Am. Chem. Sot. 117, 11085-11097.
Jerrtzen, W., Song, X.-Z. and Shehrut6 J. A. (1997) Structural characterization of syntheticand protein-bound porphyrins in terms of the lowest-frequency normal coordinates of themacrocycle. J. F%ys. Chem. B 101, 1684-1699.
Jue, T., Krishnamoorthi, R., and LaMar, G. N. (1983) Proton NMR study of the mechanism ofheme-apoprotein reaction for myoglobin, J. Am. Chem. Sot. 105,5701-5703.
Keller, R., Groudinsky, O. and Wtithrich, K. (1976) Contact-shifted resonances in the ‘HNMR spectra of cytochrome b5. Resonance identification and spin density distribution onthe heme group, Biochim. Biophys. Acfa 427,497-511.
Kirkpatrick, S., Gelatt, C. D., Jr., Vecchi, M. P. (1983) Optimization by simulated annealing.Science 220,671-680.
Koslowski, A., BotterwecL H., Ffeischhauer, J., KurapkaQ G., Wollmer, A., and Woody, R.W. (1996) Calculation of the CD spectrum of ribonucIease, Progr. Biophy.s. JMof.BioL 65,Suppl. 1,43.
LaMar, G. N., Overkamp,M., Sick, H., and Gersonde,K. (1978a)Proton nuclear magneticresonance hyperfke shifts as indicators of tertiary structural changes accompanying theBohr effect on monomeric insect hemoglobins. Biochemist-y 17,352-361.
LaMar, G. N., Budd, D. L., Viscio, D. B., Smith, K. M., and Langry, K. C. (1978b) Protonnuclear magnetic-resonance characterization of heme disorder in hemoproteins, Proc.Natl. Acad. Sci. USA 75,5755-5759.
LaMar, G. N., Davis, N. L., Parish, D. W. and Smith, K. M. (1983) Heme orientationaldisorder in reconstituted and native sperm whale myoglobin. J. Mol. Bid. 168,887-896.
La Mar, G. N., Toi, H., and Krishnamoorthi, R. (1984) Proton NMR investigation of the rateand mechanism of heme rotation in sperm whale myoglobin: evidence for intramolecularreorientation about a heme twofold axis, J. Am. Chenr. Sot. 106,6395-6401.
Levy, M. J., La Mar, G. N., Jue, T., Smith, K. M., Parrdey, R. K., Smith, W. S., Livingston, D.J. and Brown, W.D. (1985) Proton NMR study of yellowtin tuna myoglobin in wholemuscle and solution. J. Biol. Cheur. 260, 13694-13698.
Light, W. R., Rohlf, R. J., PaImer, G., and Olson, J. S. (1987) Functional effects of hemeorientational disorder in sperm whale myoglobin, J. Bid. Chem. 262,46-52.
Livingston, D. J., Davis, N. L., LaMar, G. N., and Brown, W. D. (1984) Influence of hemeorientation on oxygen affinity in native sperm whale myoglobin, J. Am. Chenr. Sac. 106,3025-3026.
Moench, S. J. (1985) CD and lH NMR studies of native hemeproteins and hemeproteinscontaining modified heroes. Ph.D. Thesis, Colorado State University.
.
16 Woody et al.
Osapay, K., Theriau14Y., Wright, P. E. and Case, D. (1994) Sohstionstructure ofcarbonmonoxymyoglobin determinedfrom nuclear magnetic resonance distanceandchemical shift constraints.J. Mol.Biol. 244, 183-197.
Platt, J. R. (1956)Electronic structure and excitation of polyenes and porphyrins, in RadiationBiology, Hollaender, A., Ed. McGraw-Hill, New York, vol. III, pp. 71-123.
Ribbing, W., Kriimpelmann, D. and Riiterjans, H. (1978) Isomeric incorporation of haem intotwo monomeric hemoglobins of Chironomusthummirhumnri,FEBS Left. 92, 105-108.
Shelnut~ J. A., Song, X.-Z., Ma, J.-G., Jia, S. L., Jentzen, W. and Medforth, C. J. (1998)NonpIanar porphyrins and their significance in proteins, Chem. SOc. Rev. 27,31-41.
Strassburger, W., WoIlmer, A., Thiele, H., Fleischhauer, J., Steigemann, W. and Weber, E.(1978) Calculation of the circular dichroism of Chironomus hemoglobin in the light of thequality of its X-ray structure,.2 iVatu#orsch. C 33,908-911.
van Gunsteren, W. F., BilIeter, S. R., Eking, A. A., Hunenberger, P. H., I@ger, P., Mark, A.E,, Scott, W. R. R. and Tironi, I. G. (1996) Bimolecular Simulations: The Gromos96
Manual and User Guide, Ziirich, Hochschulverlag AG an der ETH.van Schai~ R. C., Berendsen, H. J. C., Torda, A. E. and van Gunsteren, W. F. (1993) A
structural refinement method based on molecular dynamics in four spatial dimensions, J.Mol. Biol. 234,751-762.
Walker, F. A., Emric~ D., Rivera, J. E., Hanquet, B. J., and Buttlaire, D. H. (1988) Effect ofheme orientation on the reduction potential of cytochrome b~,J. Am. Chem. Sot. 110,6234-6240.
Weiss, C., Kobayashi, H., and Gouterman, M. (1965) Spectra of porphyrins. Part III. Self-consistent molecular orbital calculations of porphyrin and related ring systems, J. Mol.Spectrosc.16, 415-450.
Wo[lmer, A., Sick H., and Gersonde, K. (1970) ConformationaI1y induced circular dichroismin hemoglobins of Chironomus thummi thumrni, Eur. J. Biochem. 16,303-312.
Yang, F. and Phillips, G.N., Jr. (1996) Crystal structures of CO-, deoxy-, and met-myoglobinsat various pH values. J. Mol. BioL 271,762-774.