Embed Size (px)
Citation preview
MD Monthly – AUGUST 2015 Membership Development Report – Page 1
This report is issued monthly on behalf of the IEEE Member & Geographic Activities Board. Source data is IEEE membership statistics. Contact: Elyn Perez, [email protected]
MD Summary Pages 1-4 Member Recruitment Pages 11-12
Membership Year Goals & Progress Page 5-8 Active Membership Pages 13
Retention & Recovery Page 10 Society & Special Interest Memberships Pages 14-17
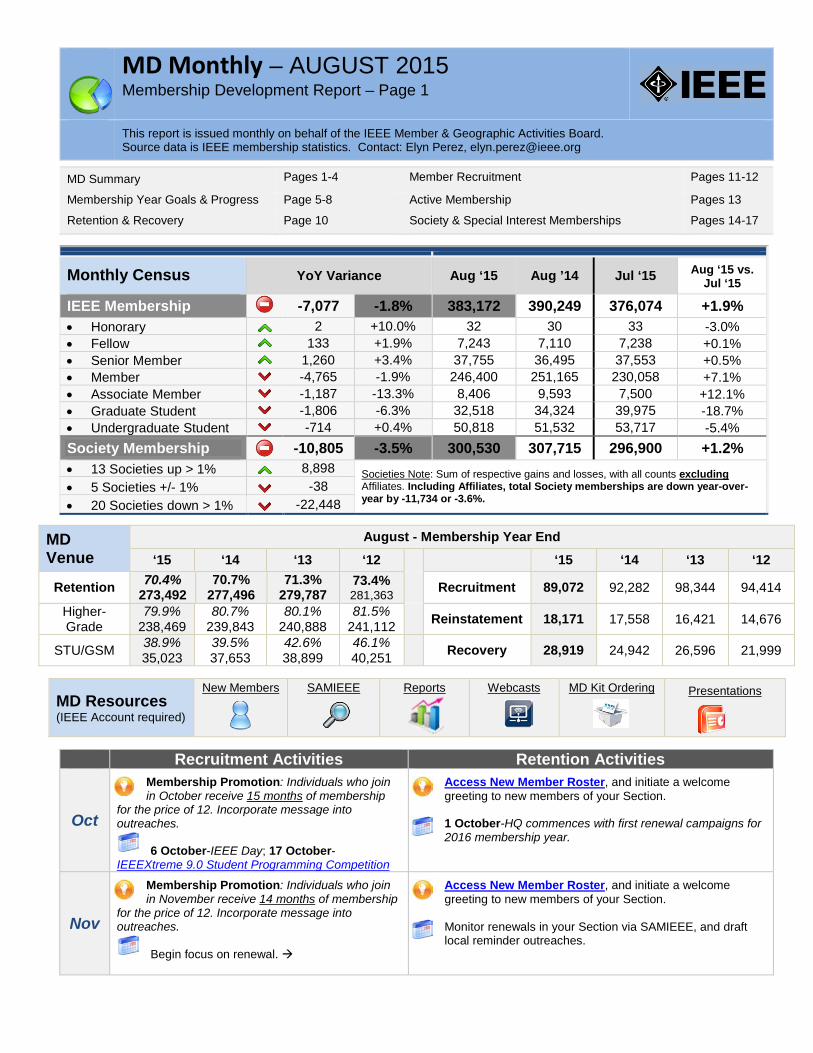
Monthly Census
YoY Variance Aug ‘15 Aug ’14 Jul ‘15
Aug ‘15 vs. Jul ‘15
IEEE Membership
-7,077 -1.8% 383,172 390,249 376,074 +1.9%
• Honorary 2 +10.0% 32 30 33 -3.0% • Fellow 133 +1.9% 7,243 7,110 7,238 +0.1% • Senior Member 1,260 +3.4% 37,755 36,495 37,553 +0.5% • Member -4,765 -1.9% 246,400 251,165 230,058 +7.1% • Associate Member -1,187 -13.3% 8,406 9,593 7,500 +12.1% • Graduate Student -1,806 -6.3% 32,518 34,324 39,975 -18.7% • Undergraduate Student -714 +0.4% 50,818 51,532 53,717 -5.4%
Society Membership
-10,805 -3.5% 300,530 307,715 296,900 +1.2% • 13 Societies up > 1% 8,898 Societies Note: Sum of respective gains and losses, with all counts excluding
Affiliates. Including Affiliates, total Society memberships are down year-over-year by -11,734 or -3.6%.
• 5 Societies +/- 1% -38 • 20 Societies down > 1% -22,448
MD Resources (IEEE Account required)
New Members
SAMIEEE
Reports
Webcasts
MD Kit Ordering
Presentations
Recruitment Activities Retention Activities
Oct
Membership Promotion: Individuals who join in October receive 15 months of membership
for the price of 12. Incorporate message into outreaches.
6 October-IEEE Day; 17 October-
IEEEXtreme 9.0 Student Programming Competition
Access New Member Roster, and initiate a welcome greeting to new members of your Section. 1 October-HQ commences with first renewal campaigns for 2016 membership year.
Nov
Membership Promotion: Individuals who join in November receive 14 months of membership
for the price of 12. Incorporate message into outreaches.
Begin focus on renewal.
Access New Member Roster, and initiate a welcome greeting to new members of your Section. Monitor renewals in your Section via SAMIEEE, and draft local reminder outreaches.
MD Venue
August - Membership Year End
‘15 ‘14 ‘13 ‘12 ‘15 ‘14 ‘13 ‘12
Retention
70.4% 273,492
70.7% 277,496
71.3% 279,787
73.4% 281,363
Recruitment 89,072 92,282 98,344 94,414
Higher-Grade
79.9% 238,469
80.7% 239,843
80.1% 240,888
81.5% 241,112
Reinstatement 18,171 17,558 16,421 14,676
STU/GSM
38.9% 35,023
39.5% 37,653
42.6% 38,899
46.1% 40,251
Recovery 28,919 24,942 26,596 21,999
MD Monthly – AUGUST 2015 – Page 2
August MD Highlights IEEE Membership August marks the end of the 2015 membership year. We closed the year with 383,172 total members, a decline of -1.8% over 2014. The rate of decline remained the same from July. This marks the second year in row that overall IEEE membership has been in decline. In 2014, the year ended with membership down -1.3%. Retention is the biggest predictor in overall membership growth. As retention rates decline (a trend we have in common with many professional associations), we begin each year with a smaller base of members to renew - it becomes a vicious cycle. Add to this the declines we’ve seen in recruitment over the years, and this is not an unexpected outcome. However, we can reverse this trend in 2016 by keeping a sharp focus on recruitment opportunities as well as engaging existing members. We did see some good success this year with 28 Sections that increased both their recruitment and retention. Along those lines, this year also marked the first year that Sections received individual membership development goals, as opposed to the Region-level goals. This better enables local Sections to become more engaged and get an understanding of how local efforts make an impact. As mentioned above, twenty-eight Sections worldwide met or exceeded their goals for recruitment and retention – congratulations! In September, these Section leaders will be receiving a certificate and a token of appreciation and recognition for their efforts. See the list on page 5. In addition, 83 Sections have met their recruitment goals, and 83 Sections have met their retention goals. These Sections are recognized on the following pages as well, and will be receiving certificates of appreciation. Recruitment We ended the 2015 membership year with overall recruitment behind last year by -3.5%. Recruitment had been positive the first half of the membership year, but starting in February it slowly started to reverse that trend. That being said, last year, at the end of the 2014 membership year, recruitment was behind by -6.2%. So in the long term trend we are seeing recruitment declines flatten. This year, we have seen positive gains in undergraduate recruitment slowly shrink, and in graduate student numbers, the recruitment deficit began the year shrinking, but has been widening the past few months. Higher grade recruitment, however, continues to close its YoY gap. See more detail on recruitment, page 11. The 2016 membership year is underway. Start planning recruitment activities now. New membership collateral for 2016 began shipping to Sections and student branches in August. Links to all MD resources plus communications templates can be found at www.ieee.org/md. Retention The 2015 membership year ended with an overall member retention rate at 70.4%, three tenths behind where we ended last year. Looking at the longer term trend, we are seeing a slower rate of decline as far as retention rates go. This is the smallest year-over-year retention gap in four years. But the smaller recruitment opportunity is hampering growth in total number of members. If we keep improving retention rates by adding member value, then over time we will see growth return. Eight regions saw continued overall retention declines. Regions 9 and 10 improved their YoY retention. Region 9 improved by just a tenth of a percent, driven by undergraduate and higher grade retention gains. Region 10 improved their retention by an impressive 1.8%, solely due to improved undergraduate retention. Higher-grade retention ended the year behind -0.8%, having been on an up and down trend throughout the year. Region 9 was the only region to have positive YoY HG retention. Although the United States has the greatest retention among higher grade members than in other regions, the retention rate in the US HG member population is behind last year by -0.9%. GSM retention continued to widen its YoY deficits, ending 2015 behind last year by -3.4% following -3.0% last month. Undergraduate student retention is behind by -0.8%, and has been keeping this pace for several months. See more detail on retention, page 10.
MD Monthly – AUGUST 2015 – Page 3
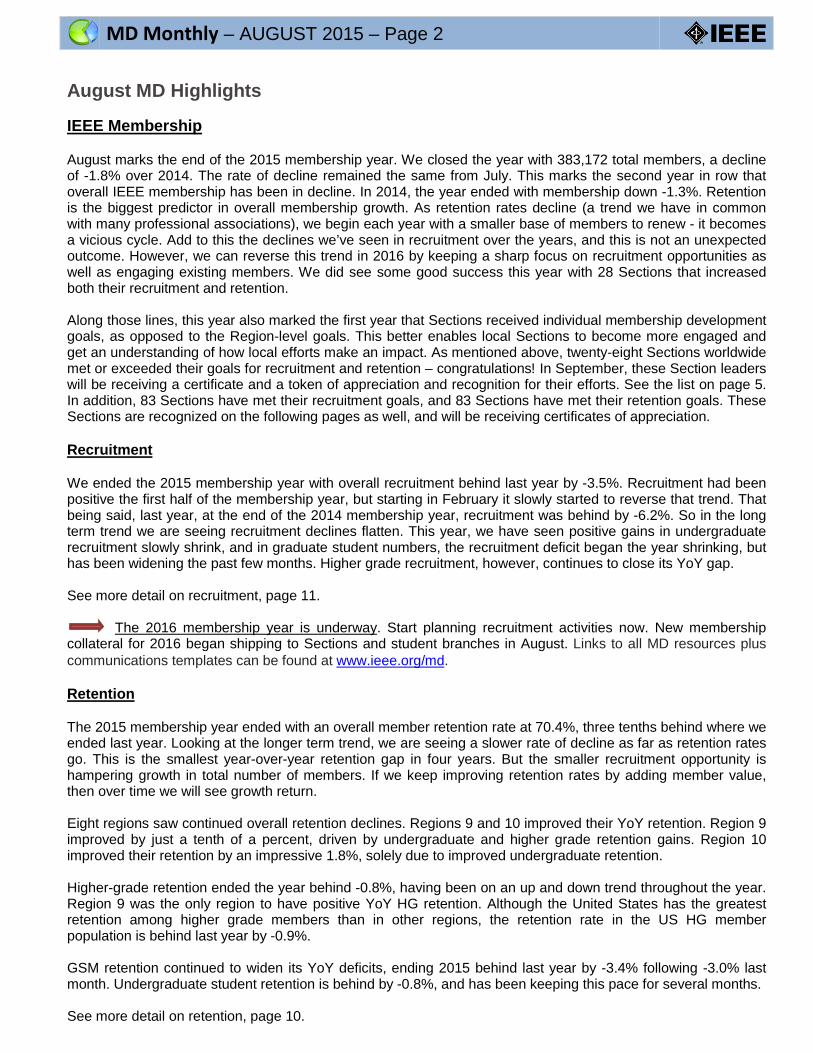
Society Membership Overall Society memberships ended the membership year down -3.5% year-over-year. The main reason for this continues to be Communications Society losses, which continue to widen and are now down -37.1%, or -17,493 members, over last year. If we remove the CommSoc losses from the overall decline, Society memberships would actually be positive year-over-year. As we’ve been reporting for several months, CommSoc recently eliminated marketing programs that offered free membership. While this anomaly has little financial impact, from a total membership perspective we will have to wait until next year to see this trend correct itself in the year-over-year reporting. The top societies in terms of percentage growth in August were Computational Intelligence Society (+14.3%), Signal Processing Society (+13.4%) and Industry Applications Society (+12.8%). Society membership details begin on page 14. Get More Senior Members, Increase Your Section’s Retention It has been demonstrated that there is a relationship between the grade a member holds and that member's likelihood to keep their IEEE membership. The higher the grade, the more likely they are to renew. For example, last year the retention rate among Senior Members was 96.0%, compared to the overall retention rate of 70.7%. Each year, every Region is tasked with a goal to elevate roughly one percent of their eligible members to Senior Member grade. This year you will see new materials being shipped in the MD kits to encourage more participation in the area of growing Senior Membership, to help Regions to reach their goals. With four months left in the calendar year, here is how each region is performing against their goal:
Look for brand new brochures in your MD kit, and download web graphics in various sizes, like the one to right to place on your websites and newsletters in the online promotional library, www.ieee.org/md.
Region Membership as of 31 December 2014 (Member grade)
2015 Senior Member Goal
YTD SM Elevations as of
August 2015
Percentage of Goal
1 19,528 195 143 73%
2 17,834 180 115 64%
3 16,914 215 135 63%
4 13,616 165 107 65%
5 17,616 180 102 57%
6 34,428 340 224 66%
7 10,655 110 75 68%
8 45,436 575 481 84%
9 8,993 110 47 43%
10 51,376 660 515 78%
Total 236,396 2,730 1,944 71%
MD Monthly – AUGUST 2015 – Page 4
IEEE Day 2015: Save the Date IEEE Day this year will be on 6 October 2015. Start planning your events now! If you’re looking to schedule an event or activity in October, simply schedule it for the week of IEEE Day and submit it as an event on the IEEE Day website (http://www.ieeeday.org). During this week, IEEE will once again be offering a special membership discount for new members. This is a great opportunity for Sections to get a good start on 2016 recruitment, plus an opportunity to engage your members and let them know they are appreciated.
There are two exciting events being planned this year in conjunction with the IEEE Foundation. One is a day at the Intrepid Air, Sea & Space Museum in New York on 6 October. Members plus one guest are invited to the museum at no charge (excludes entrance to the Space Shuttle Pavilion). This is limited to the first 500 people who register. Registration for this event will close on 4 October, or when the 500 person maximum is reached.
The other event is a free admission day at the Computer History Museum in California. On 20 September 2015, IEEE members and their family and friends are invited to a day at the Computer History Museum at no cost.
Both of these events require online registration. For more information on how to register, or any questions related to IEEE Day, please contact Denise Maestri, [email protected].
Also, the IEEE Day team needs ambassadors to help promote this program locally. We are in need of ambassadors especially in the United States and Africa. Help spread the word! If you are interested in becoming an IEEE Day Ambassador, please contact Denise Maestri, [email protected]
‘Put the World of IEEE into Focus’
IEEE members are involved in a lot of interesting activities all over the world. Not just on the job, but also through mentoring, volunteer work, seminars, and other activities. The 'IEEE Into Focus' photo contest gives members a chance to show off what they do by submitting photos of what they think best represents their experiences as an IEEE member.
The photo contest is a great way to engage member audiences through IEEE websites, social media channels, email newsletters, conferences, etc.
Member participants have a chance to win the following prizes:
• Grand prize – One US$250 Amazon gift card and IEEE selfie stick • Second prize – One $100 Amazon gift card and IEEE selfie stick • Third prize – One $50 Amazon gift card and IEEE selfie stick • 10 runners up winners will receive an IEEE selfie stick
Entry period runs from 1 September 2015 to midnight 31 December 2015. For more information or to submit a photo, go to ieee-into-focus.org.
For information and resources to help promote this contest among your members, such as the web graphic above, please contact Nicole Dewhurst, [email protected].
MD Monthly – AUGUST 2015 – Page 5
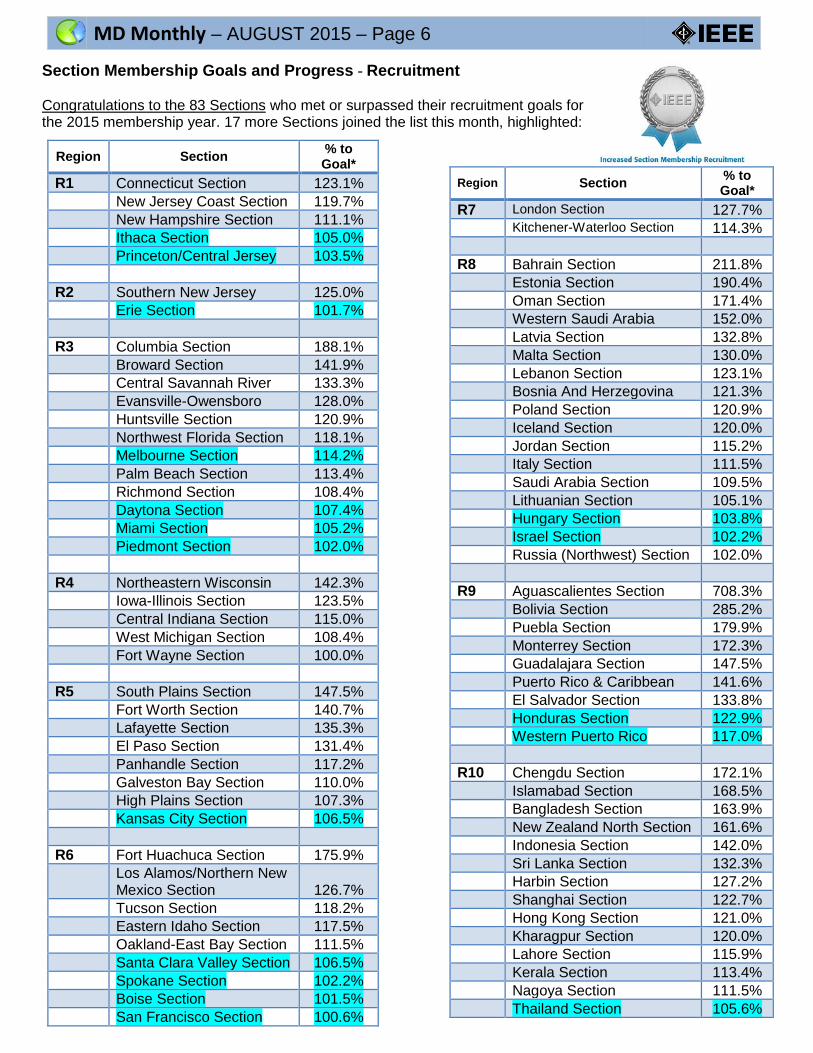
2015 Membership Development Goals Congratulations to the 28 Sections who have achieved outstanding performance in both recruitment and retention for the 2015 membership year. These Sections have met or surpassed their goals in both categories. Four more Sections join the list this month, highlighted below.
MD goals are created for each individual Section for both recruitment and retention. Section goals are rolled up to the Region level,
producing the Region goal for recruitment, retention and overall membership. Goals are focused on overall membership growth (comprised of an overall recruitment, retention and reinstatement goal), and do not include separate goals for HG versus student. A benefit of this is that the service deactivation and student elevation processes do not impact progress to goals, because it focuses only on the number of members that join or renew (regardless of grade), and not on the total number of members. Detail on the Section goals and progress are included in the Region level MD reports. These reports are sent via e-mail once monthly. If you are not receiving your region MD report, please contact your Region MD Chair. Region summary performance is on page 8. See pages 6 and 7 of this report to see which Sections have achieved their recruitment and retention goals. Goals for 2016 are now being distributed to the Sections, and a region summary of the 2016 goals is on page 9. Tracking Progress and Section Recognition of Goal Achievement Every month, the regional MD reports contain the Section level progress for recruitment and retention. To monitor progress and ensure Sections are on track, the goals and progress to goal will be published in the region reports. Each Section that meets their goal receives a special recognition in the form of an electronic banner that can be placed on Section websites, in newsletters, and even in e-mail signatures. Banners are distributed to the Section’s Membership Development Chair, and/or Section Chair. These Sections will also be recognized in the MD Monthly report, region level MD reports and on the MD portal, www.ieee.org/md. Banners include the membership year and Section name in the graphic. A silver award will be given in either the recruitment or retention category once met. A gold medal of recognition will be given once both goals are met. Year-End Awards Section MD Chairs and Section Chairs that earned the gold banner of recognition will be receiving a special gift item in the mail in September – a portable battery charger with cords and case, engraved with the IEEE logo – along with a certificate of recognition. Section MD Chairs and Section Chairs that earned the silver banner of recognition in either category will be receiving certificates of recognition as well.
Region Section R1 New Jersey Coast
Princeton/Central Jersey Section R2 Southern New Jersey R3 Columbia Section Northwest Florida Section R4 Iowa-Illinois Section Fort Wayne Section R5 Lafayette Section Panhandle Section
Kansas City Section R8 Bahrain Section Iceland Section Latvia Section Lithuania Section R9 Aguascalientes Section Bolivia Section
Honduras Section Monterrey Section R10 Harbin Section Hong Kong Section Kerala Section Kharagpur Section Islamabad Section Nagoya Section Shanghai Section Sri Lanka Section New Zealand North Section
Thailand Section
Antonio Luque [email protected]
MD Monthly – AUGUST 2015 – Page 6
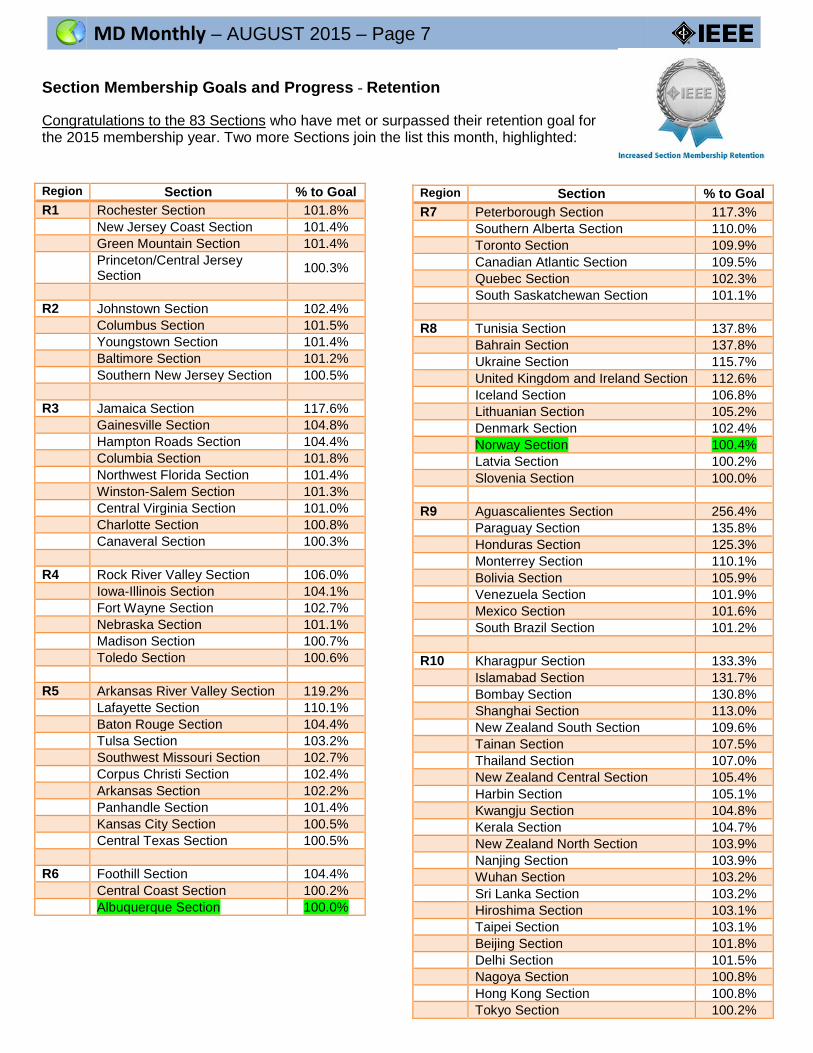
Section Membership Goals and Progress - Recruitment Congratulations to the 83 Sections who met or surpassed their recruitment goals for the 2015 membership year. 17 more Sections joined the list this month, highlighted:
Region Section % to Goal*
R7 London Section 127.7% Kitchener-Waterloo Section 114.3% R8 Bahrain Section 211.8% Estonia Section 190.4% Oman Section 171.4% Western Saudi Arabia 152.0% Latvia Section 132.8% Malta Section 130.0% Lebanon Section 123.1% Bosnia And Herzegovina 121.3% Poland Section 120.9% Iceland Section 120.0% Jordan Section 115.2% Italy Section 111.5% Saudi Arabia Section 109.5% Lithuanian Section 105.1% Hungary Section 103.8% Israel Section 102.2% Russia (Northwest) Section 102.0% R9 Aguascalientes Section 708.3% Bolivia Section 285.2% Puebla Section 179.9% Monterrey Section 172.3% Guadalajara Section 147.5% Puerto Rico & Caribbean 141.6% El Salvador Section 133.8% Honduras Section 122.9% Western Puerto Rico 117.0% R10 Chengdu Section 172.1% Islamabad Section 168.5% Bangladesh Section 163.9% New Zealand North Section 161.6% Indonesia Section 142.0% Sri Lanka Section 132.3% Harbin Section 127.2% Shanghai Section 122.7% Hong Kong Section 121.0% Kharagpur Section 120.0% Lahore Section 115.9% Kerala Section 113.4% Nagoya Section 111.5% Thailand Section 105.6%
Region Section % to Goal*
R1 Connecticut Section 123.1% New Jersey Coast Section 119.7% New Hampshire Section 111.1% Ithaca Section 105.0% Princeton/Central Jersey 103.5% R2 Southern New Jersey 125.0% Erie Section 101.7% R3 Columbia Section 188.1% Broward Section 141.9% Central Savannah River 133.3% Evansville-Owensboro 128.0% Huntsville Section 120.9% Northwest Florida Section 118.1% Melbourne Section 114.2% Palm Beach Section 113.4% Richmond Section 108.4% Daytona Section 107.4% Miami Section 105.2% Piedmont Section 102.0% R4 Northeastern Wisconsin 142.3% Iowa-Illinois Section 123.5% Central Indiana Section 115.0% West Michigan Section 108.4% Fort Wayne Section 100.0% R5 South Plains Section 147.5% Fort Worth Section 140.7% Lafayette Section 135.3% El Paso Section 131.4% Panhandle Section 117.2% Galveston Bay Section 110.0% High Plains Section 107.3% Kansas City Section 106.5% R6 Fort Huachuca Section 175.9% Los Alamos/Northern New
Mexico Section 126.7% Tucson Section 118.2% Eastern Idaho Section 117.5% Oakland-East Bay Section 111.5% Santa Clara Valley Section 106.5% Spokane Section 102.2% Boise Section 101.5% San Francisco Section 100.6%
MD Monthly – AUGUST 2015 – Page 7
Section Membership Goals and Progress - Retention Congratulations to the 83 Sections who have met or surpassed their retention goal for the 2015 membership year. Two more Sections join the list this month, highlighted:
Region Section % to Goal R7 Peterborough Section 117.3% Southern Alberta Section 110.0% Toronto Section 109.9% Canadian Atlantic Section 109.5% Quebec Section 102.3% South Saskatchewan Section 101.1% R8 Tunisia Section 137.8% Bahrain Section 137.8% Ukraine Section 115.7% United Kingdom and Ireland Section 112.6% Iceland Section 106.8% Lithuanian Section 105.2% Denmark Section 102.4% Norway Section 100.4% Latvia Section 100.2% Slovenia Section 100.0% R9 Aguascalientes Section 256.4% Paraguay Section 135.8% Honduras Section 125.3% Monterrey Section 110.1% Bolivia Section 105.9% Venezuela Section 101.9% Mexico Section 101.6% South Brazil Section 101.2% R10 Kharagpur Section 133.3% Islamabad Section 131.7% Bombay Section 130.8% Shanghai Section 113.0% New Zealand South Section 109.6% Tainan Section 107.5% Thailand Section 107.0% New Zealand Central Section 105.4% Harbin Section 105.1% Kwangju Section 104.8% Kerala Section 104.7% New Zealand North Section 103.9% Nanjing Section 103.9% Wuhan Section 103.2% Sri Lanka Section 103.2% Hiroshima Section 103.1% Taipei Section 103.1% Beijing Section 101.8% Delhi Section 101.5% Nagoya Section 100.8% Hong Kong Section 100.8% Tokyo Section 100.2%
Region Section % to Goal R1 Rochester Section 101.8% New Jersey Coast Section 101.4% Green Mountain Section 101.4% Princeton/Central Jersey
Section 100.3%
R2 Johnstown Section 102.4% Columbus Section 101.5% Youngstown Section 101.4% Baltimore Section 101.2% Southern New Jersey Section 100.5% R3 Jamaica Section 117.6% Gainesville Section 104.8% Hampton Roads Section 104.4% Columbia Section 101.8% Northwest Florida Section 101.4% Winston-Salem Section 101.3% Central Virginia Section 101.0% Charlotte Section 100.8% Canaveral Section 100.3% R4 Rock River Valley Section 106.0% Iowa-Illinois Section 104.1% Fort Wayne Section 102.7% Nebraska Section 101.1% Madison Section 100.7% Toledo Section 100.6% R5 Arkansas River Valley Section 119.2% Lafayette Section 110.1% Baton Rouge Section 104.4% Tulsa Section 103.2% Southwest Missouri Section 102.7% Corpus Christi Section 102.4% Arkansas Section 102.2% Panhandle Section 101.4% Kansas City Section 100.5% Central Texas Section 100.5% R6 Foothill Section 104.4% Central Coast Section 100.2% Albuquerque Section 100.0%
MD Monthly – AUGUST 2015 – Page 8
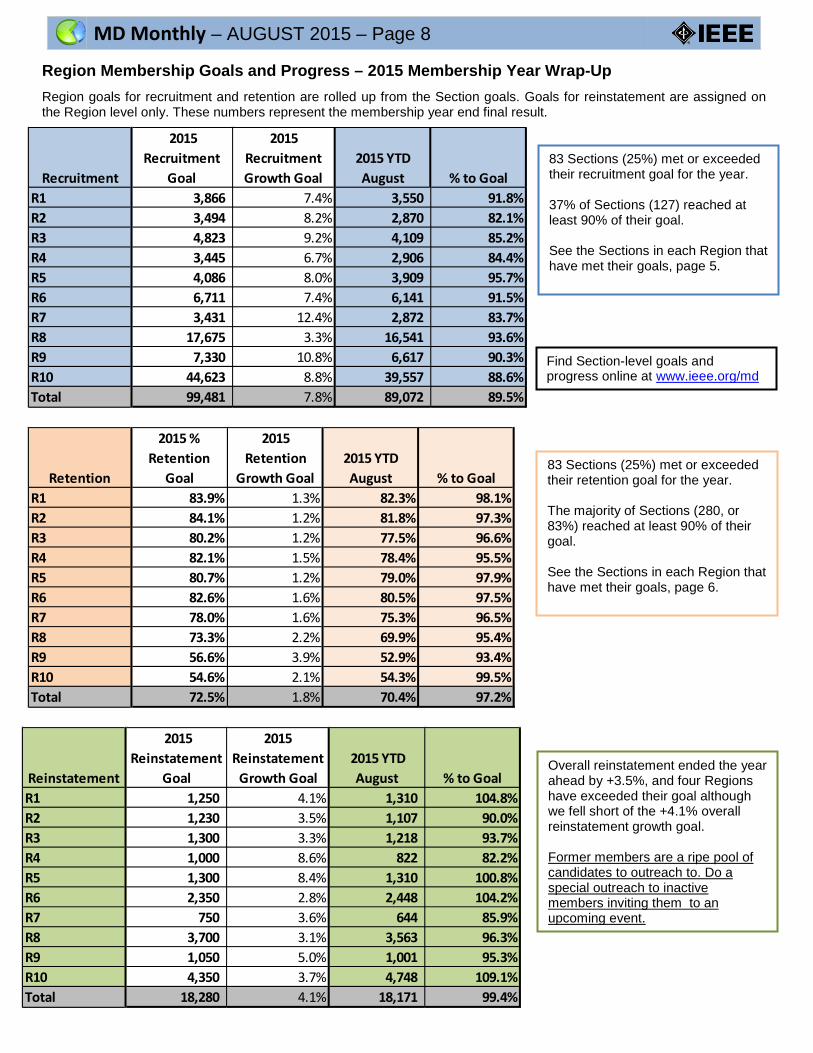
Region Membership Goals and Progress – 2015 Membership Year Wrap-Up
Region goals for recruitment and retention are rolled up from the Section goals. Goals for reinstatement are assigned on the Region level only. These numbers represent the membership year end final result.
Recruitment
2015 Recruitment
Goal
2015 Recruitment Growth Goal
2015 YTDAugust % to Goal
R1 3,866 7.4% 3,550 91.8%R2 3,494 8.2% 2,870 82.1%R3 4,823 9.2% 4,109 85.2%R4 3,445 6.7% 2,906 84.4%R5 4,086 8.0% 3,909 95.7%R6 6,711 7.4% 6,141 91.5%R7 3,431 12.4% 2,872 83.7%R8 17,675 3.3% 16,541 93.6%R9 7,330 10.8% 6,617 90.3%R10 44,623 8.8% 39,557 88.6%Total 99,481 7.8% 89,072 89.5%
Retention
2015 % Retention
Goal
2015 Retention
Growth Goal2015 YTDAugust % to Goal
R1 83.9% 1.3% 82.3% 98.1%R2 84.1% 1.2% 81.8% 97.3%R3 80.2% 1.2% 77.5% 96.6%R4 82.1% 1.5% 78.4% 95.5%R5 80.7% 1.2% 79.0% 97.9%R6 82.6% 1.6% 80.5% 97.5%R7 78.0% 1.6% 75.3% 96.5%R8 73.3% 2.2% 69.9% 95.4%R9 56.6% 3.9% 52.9% 93.4%R10 54.6% 2.1% 54.3% 99.5%Total 72.5% 1.8% 70.4% 97.2%
Reinstatement
2015 Reinstatement
Goal
2015 Reinstatement
Growth Goal 2015 YTD
August % to GoalR1 1,250 4.1% 1,310 104.8%R2 1,230 3.5% 1,107 90.0%R3 1,300 3.3% 1,218 93.7%R4 1,000 8.6% 822 82.2%R5 1,300 8.4% 1,310 100.8%R6 2,350 2.8% 2,448 104.2%R7 750 3.6% 644 85.9%R8 3,700 3.1% 3,563 96.3%R9 1,050 5.0% 1,001 95.3%R10 4,350 3.7% 4,748 109.1%Total 18,280 4.1% 18,171 99.4%
83 Sections (25%) met or exceeded their recruitment goal for the year. 37% of Sections (127) reached at least 90% of their goal. See the Sections in each Region that have met their goals, page 5.
83 Sections (25%) met or exceeded their retention goal for the year. The majority of Sections (280, or 83%) reached at least 90% of their goal. See the Sections in each Region that have met their goals, page 6.
Overall reinstatement ended the year ahead by +3.5%, and four Regions have exceeded their goal although we fell short of the +4.1% overall reinstatement growth goal. Former members are a ripe pool of candidates to outreach to. Do a special outreach to inactive members inviting them to an upcoming event.
Find Section-level goals and progress online at www.ieee.org/md
MD Monthly – AUGUST 2015 – Page 9
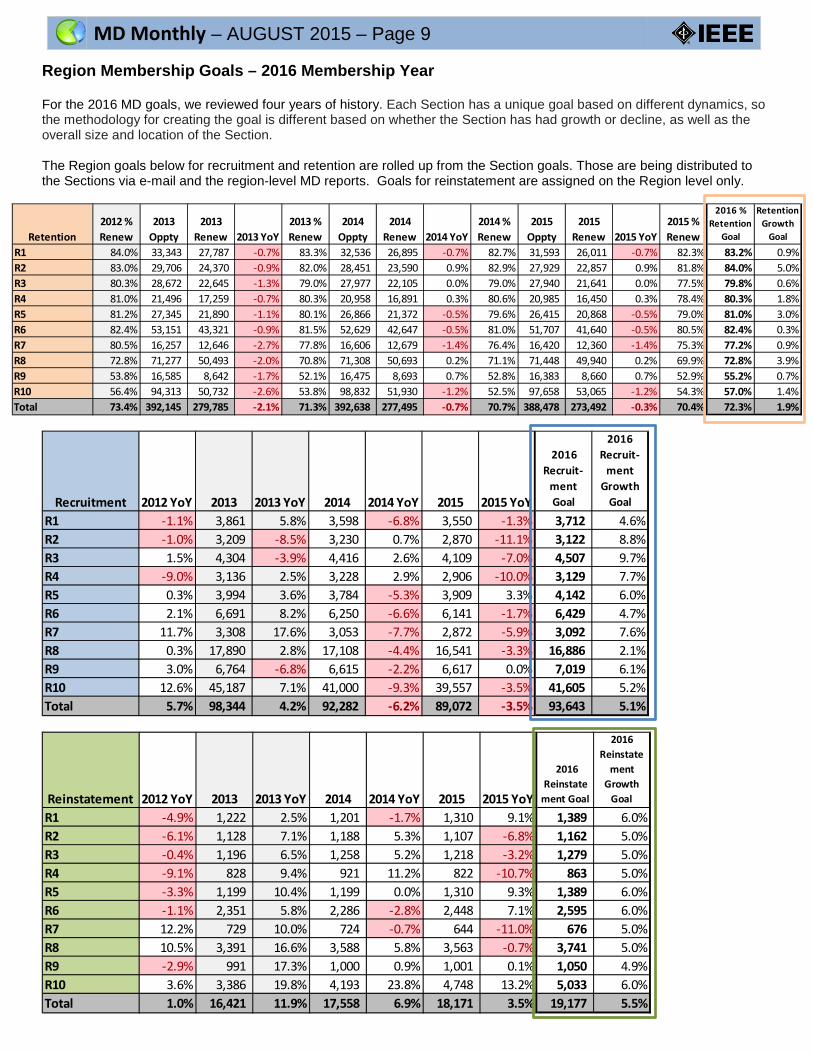
Region Membership Goals – 2016 Membership Year For the 2016 MD goals, we reviewed four years of history. Each Section has a unique goal based on different dynamics, so the methodology for creating the goal is different based on whether the Section has had growth or decline, as well as the overall size and location of the Section. The Region goals below for recruitment and retention are rolled up from the Section goals. Those are being distributed to the Sections via e-mail and the region-level MD reports. Goals for reinstatement are assigned on the Region level only.
Retention2012 % Renew
2013 Oppty
2013 Renew 2013 YoY
2013 % Renew
2014 Oppty
2014 Renew 2014 YoY
2014 % Renew
2015 Oppty
2015 Renew 2015 YoY
2015 % Renew
2016 % Retention
Goal
Retention
Growth Goal
R1 84.0% 33,343 27,787 -0.7% 83.3% 32,536 26,895 -0.7% 82.7% 31,593 26,011 -0.7% 82.3% 83.2% 0.9%R2 83.0% 29,706 24,370 -0.9% 82.0% 28,451 23,590 0.9% 82.9% 27,929 22,857 0.9% 81.8% 84.0% 5.0%R3 80.3% 28,672 22,645 -1.3% 79.0% 27,977 22,105 0.0% 79.0% 27,940 21,641 0.0% 77.5% 79.8% 0.6%R4 81.0% 21,496 17,259 -0.7% 80.3% 20,958 16,891 0.3% 80.6% 20,985 16,450 0.3% 78.4% 80.3% 1.8%R5 81.2% 27,345 21,890 -1.1% 80.1% 26,866 21,372 -0.5% 79.6% 26,415 20,868 -0.5% 79.0% 81.0% 3.0%R6 82.4% 53,151 43,321 -0.9% 81.5% 52,629 42,647 -0.5% 81.0% 51,707 41,640 -0.5% 80.5% 82.4% 0.3%R7 80.5% 16,257 12,646 -2.7% 77.8% 16,606 12,679 -1.4% 76.4% 16,420 12,360 -1.4% 75.3% 77.2% 0.9%R8 72.8% 71,277 50,493 -2.0% 70.8% 71,308 50,693 0.2% 71.1% 71,448 49,940 0.2% 69.9% 72.8% 3.9%R9 53.8% 16,585 8,642 -1.7% 52.1% 16,475 8,693 0.7% 52.8% 16,383 8,660 0.7% 52.9% 55.2% 0.7%R10 56.4% 94,313 50,732 -2.6% 53.8% 98,832 51,930 -1.2% 52.5% 97,658 53,065 -1.2% 54.3% 57.0% 1.4%Total 73.4% 392,145 279,785 -2.1% 71.3% 392,638 277,495 -0.7% 70.7% 388,478 273,492 -0.3% 70.4% 72.3% 1.9%
Recruitment 2012 YoY 2013 2013 YoY 2014 2014 YoY 2015 2015 YoY
2016 Recruit-
ment Goal
2016 Recruit-
ment Growth
Goal
R1 -1.1% 3,861 5.8% 3,598 -6.8% 3,550 -1.3% 3,712 4.6%R2 -1.0% 3,209 -8.5% 3,230 0.7% 2,870 -11.1% 3,122 8.8%R3 1.5% 4,304 -3.9% 4,416 2.6% 4,109 -7.0% 4,507 9.7%R4 -9.0% 3,136 2.5% 3,228 2.9% 2,906 -10.0% 3,129 7.7%R5 0.3% 3,994 3.6% 3,784 -5.3% 3,909 3.3% 4,142 6.0%R6 2.1% 6,691 8.2% 6,250 -6.6% 6,141 -1.7% 6,429 4.7%R7 11.7% 3,308 17.6% 3,053 -7.7% 2,872 -5.9% 3,092 7.6%R8 0.3% 17,890 2.8% 17,108 -4.4% 16,541 -3.3% 16,886 2.1%R9 3.0% 6,764 -6.8% 6,615 -2.2% 6,617 0.0% 7,019 6.1%R10 12.6% 45,187 7.1% 41,000 -9.3% 39,557 -3.5% 41,605 5.2%Total 5.7% 98,344 4.2% 92,282 -6.2% 89,072 -3.5% 93,643 5.1%
Reinstatement 2012 YoY 2013 2013 YoY 2014 2014 YoY 2015 2015 YoY
2016 Reinstate
ment Goal
2016 Reinstate
ment Growth
Goal
R1 -4.9% 1,222 2.5% 1,201 -1.7% 1,310 9.1% 1,389 6.0%R2 -6.1% 1,128 7.1% 1,188 5.3% 1,107 -6.8% 1,162 5.0%R3 -0.4% 1,196 6.5% 1,258 5.2% 1,218 -3.2% 1,279 5.0%R4 -9.1% 828 9.4% 921 11.2% 822 -10.7% 863 5.0%R5 -3.3% 1,199 10.4% 1,199 0.0% 1,310 9.3% 1,389 6.0%R6 -1.1% 2,351 5.8% 2,286 -2.8% 2,448 7.1% 2,595 6.0%R7 12.2% 729 10.0% 724 -0.7% 644 -11.0% 676 5.0%R8 10.5% 3,391 16.6% 3,588 5.8% 3,563 -0.7% 3,741 5.0%R9 -2.9% 991 17.3% 1,000 0.9% 1,001 0.1% 1,050 4.9%R10 3.6% 3,386 19.8% 4,193 23.8% 4,748 13.2% 5,033 6.0%Total 1.0% 16,421 11.9% 17,558 6.9% 18,171 3.5% 19,177 5.5%
MD Monthly – AUGUST 2015 – Page 10
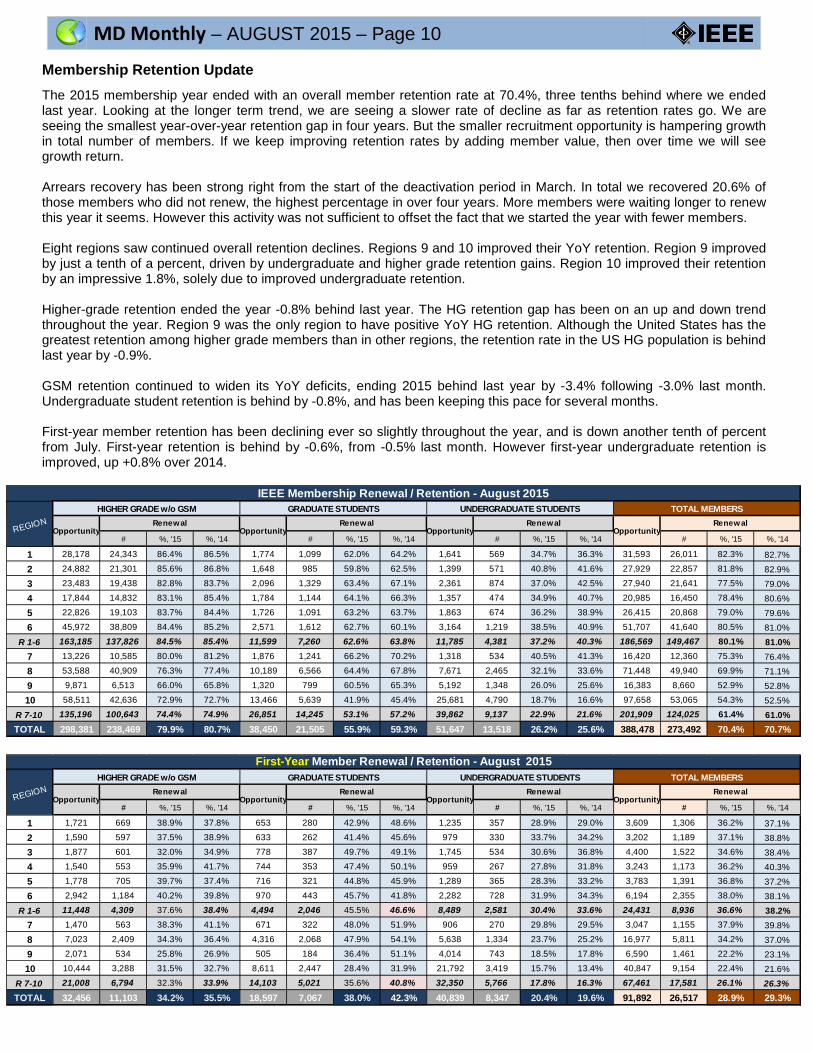
Membership Retention Update
The 2015 membership year ended with an overall member retention rate at 70.4%, three tenths behind where we ended last year. Looking at the longer term trend, we are seeing a slower rate of decline as far as retention rates go. We are seeing the smallest year-over-year retention gap in four years. But the smaller recruitment opportunity is hampering growth in total number of members. If we keep improving retention rates by adding member value, then over time we will see growth return. Arrears recovery has been strong right from the start of the deactivation period in March. In total we recovered 20.6% of those members who did not renew, the highest percentage in over four years. More members were waiting longer to renew this year it seems. However this activity was not sufficient to offset the fact that we started the year with fewer members. Eight regions saw continued overall retention declines. Regions 9 and 10 improved their YoY retention. Region 9 improved by just a tenth of a percent, driven by undergraduate and higher grade retention gains. Region 10 improved their retention by an impressive 1.8%, solely due to improved undergraduate retention. Higher-grade retention ended the year -0.8% behind last year. The HG retention gap has been on an up and down trend throughout the year. Region 9 was the only region to have positive YoY HG retention. Although the United States has the greatest retention among higher grade members than in other regions, the retention rate in the US HG population is behind last year by -0.9%. GSM retention continued to widen its YoY deficits, ending 2015 behind last year by -3.4% following -3.0% last month. Undergraduate student retention is behind by -0.8%, and has been keeping this pace for several months. First-year member retention has been declining ever so slightly throughout the year, and is down another tenth of percent from July. First-year retention is behind by -0.6%, from -0.5% last month. However first-year undergraduate retention is improved, up +0.8% over 2014.
REGION
IEEE Membership Renewal / Retention - August 2015HIGHER GRADE w/o GSM GRADUATE STUDENTS UNDERGRADUATE STUDENTS TOTAL MEMBERS
# %, '15 %, '14 # %, '15 %, '14 # %, '15 %, '14 # %, '15 %, '14
1 28,178 24,343 86.4% 86.5% 1,774 1,099 62.0% 64.2% 1,641 569 34.7% 36.3% 31,593 26,011 82.3% 82.7%
2 24,882 21,301 85.6% 86.8% 1,648 985 59.8% 62.5% 1,399 571 40.8% 41.6% 27,929 22,857 81.8% 82.9%
3 23,483 19,438 82.8% 83.7% 2,096 1,329 63.4% 67.1% 2,361 874 37.0% 42.5% 27,940 21,641 77.5% 79.0%
4 17,844 14,832 83.1% 85.4% 1,784 1,144 64.1% 66.3% 1,357 474 34.9% 40.7% 20,985 16,450 78.4% 80.6%
5 22,826 19,103 83.7% 84.4% 1,726 1,091 63.2% 63.7% 1,863 674 36.2% 38.9% 26,415 20,868 79.0% 79.6%
6 45,972 38,809 84.4% 85.2% 2,571 1,612 62.7% 60.1% 3,164 1,219 38.5% 40.9% 51,707 41,640 80.5% 81.0%
R 1-6 163,185 137,826 84.5% 85.4% 11,599 7,260 62.6% 63.8% 11,785 4,381 37.2% 40.3% 186,569 149,467 80.1% 81.0%7 13,226 10,585 80.0% 81.2% 1,876 1,241 66.2% 70.2% 1,318 534 40.5% 41.3% 16,420 12,360 75.3% 76.4%
8 53,588 40,909 76.3% 77.4% 10,189 6,566 64.4% 67.8% 7,671 2,465 32.1% 33.6% 71,448 49,940 69.9% 71.1%
9 9,871 6,513 66.0% 65.8% 1,320 799 60.5% 65.3% 5,192 1,348 26.0% 25.6% 16,383 8,660 52.9% 52.8%
10 58,511 42,636 72.9% 72.7% 13,466 5,639 41.9% 45.4% 25,681 4,790 18.7% 16.6% 97,658 53,065 54.3% 52.5%
R 7-10 135,196 100,643 74.4% 74.9% 26,851 14,245 53.1% 57.2% 39,862 9,137 22.9% 21.6% 201,909 124,025 61.4% 61.0%TOTAL 298,381 238,469 79.9% 80.7% 38,450 21,505 55.9% 59.3% 51,647 13,518 26.2% 25.6% 388,478 273,492 70.4% 70.7%
REGIONOpportunity
RenewalOpportunity
RenewalOpportunity
RenewalOpportunity
RenewalHIGHER GRADE w/o GSM GRADUATE STUDENTS UNDERGRADUATE STUDENTS TOTAL MEMBERS
First-Year Member Renewal / Retention - August 2015
REGIONHIGHER GRADE w/o GSM GRADUATE STUDENTS UNDERGRADUATE STUDENTS TOTAL MEMBERS
# %, '15 %, '14 # %, '15 %, '14 # %, '15 %, '14 # %, '15 %, '14
1 1,721 669 38.9% 37.8% 653 280 42.9% 48.6% 1,235 357 28.9% 29.0% 3,609 1,306 36.2% 37.1%
2 1,590 597 37.5% 38.9% 633 262 41.4% 45.6% 979 330 33.7% 34.2% 3,202 1,189 37.1% 38.8%
3 1,877 601 32.0% 34.9% 778 387 49.7% 49.1% 1,745 534 30.6% 36.8% 4,400 1,522 34.6% 38.4%
4 1,540 553 35.9% 41.7% 744 353 47.4% 50.1% 959 267 27.8% 31.8% 3,243 1,173 36.2% 40.3%
5 1,778 705 39.7% 37.4% 716 321 44.8% 45.9% 1,289 365 28.3% 33.2% 3,783 1,391 36.8% 37.2%
6 2,942 1,184 40.2% 39.8% 970 443 45.7% 41.8% 2,282 728 31.9% 34.3% 6,194 2,355 38.0% 38.1%
R 1-6 11,448 4,309 37.6% 38.4% 4,494 2,046 45.5% 46.6% 8,489 2,581 30.4% 33.6% 24,431 8,936 36.6% 38.2%7 1,470 563 38.3% 41.1% 671 322 48.0% 51.9% 906 270 29.8% 29.5% 3,047 1,155 37.9% 39.8%
8 7,023 2,409 34.3% 36.4% 4,316 2,068 47.9% 54.1% 5,638 1,334 23.7% 25.2% 16,977 5,811 34.2% 37.0%
9 2,071 534 25.8% 26.9% 505 184 36.4% 51.1% 4,014 743 18.5% 17.8% 6,590 1,461 22.2% 23.1%
10 10,444 3,288 31.5% 32.7% 8,611 2,447 28.4% 31.9% 21,792 3,419 15.7% 13.4% 40,847 9,154 22.4% 21.6%
R 7-10 21,008 6,794 32.3% 33.9% 14,103 5,021 35.6% 40.8% 32,350 5,766 17.8% 16.3% 67,461 17,581 26.1% 26.3%TOTAL 32,456 11,103 34.2% 35.5% 18,597 7,067 38.0% 42.3% 40,839 8,347 20.4% 19.6% 91,892 26,517 28.9% 29.3%
REGIONHIGHER GRADE w/o GSM GRADUATE STUDENTS UNDERGRADUATE STUDENTS TOTAL MEMBERS
Opportunity OpportunityRenewalRenewal
OpportunityRenewal
OpportunityRenewal
MD Monthly – AUGUST 2015 – Page 11
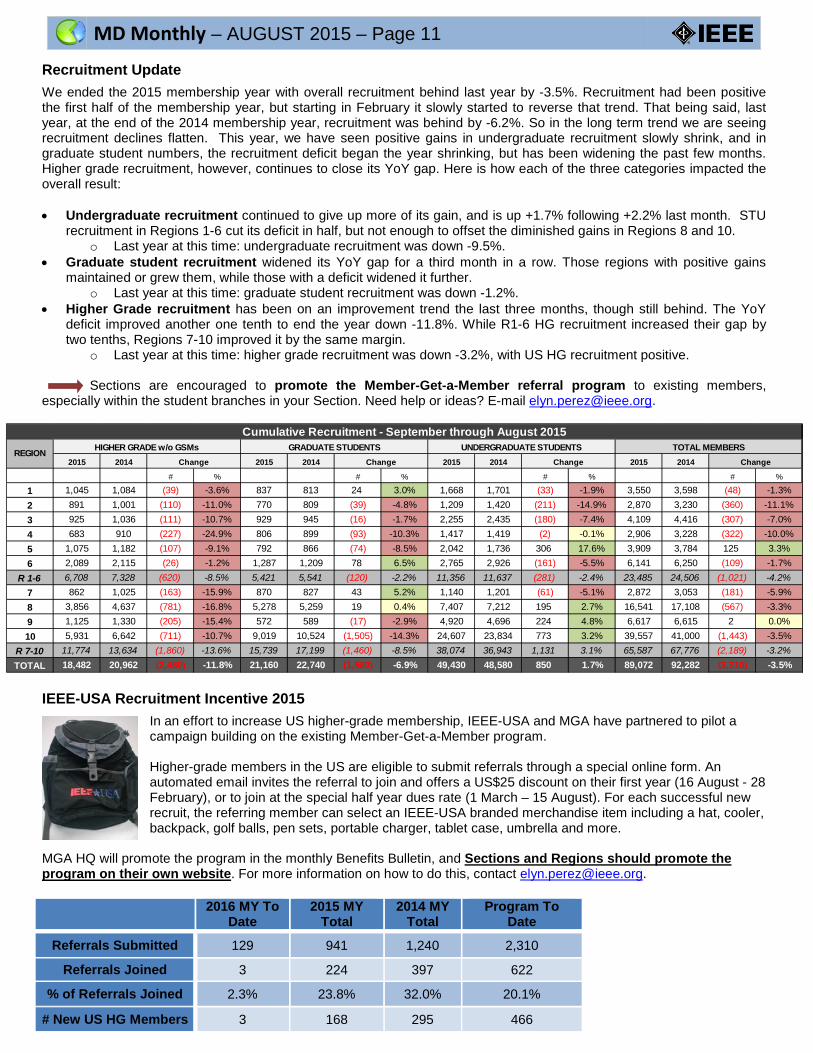
Recruitment Update
We ended the 2015 membership year with overall recruitment behind last year by -3.5%. Recruitment had been positive the first half of the membership year, but starting in February it slowly started to reverse that trend. That being said, last year, at the end of the 2014 membership year, recruitment was behind by -6.2%. So in the long term trend we are seeing recruitment declines flatten. This year, we have seen positive gains in undergraduate recruitment slowly shrink, and in graduate student numbers, the recruitment deficit began the year shrinking, but has been widening the past few months. Higher grade recruitment, however, continues to close its YoY gap. Here is how each of the three categories impacted the overall result: • Undergraduate recruitment continued to give up more of its gain, and is up +1.7% following +2.2% last month. STU
recruitment in Regions 1-6 cut its deficit in half, but not enough to offset the diminished gains in Regions 8 and 10. o Last year at this time: undergraduate recruitment was down -9.5%.
• Graduate student recruitment widened its YoY gap for a third month in a row. Those regions with positive gains maintained or grew them, while those with a deficit widened it further.
o Last year at this time: graduate student recruitment was down -1.2%. • Higher Grade recruitment has been on an improvement trend the last three months, though still behind. The YoY
deficit improved another one tenth to end the year down -11.8%. While R1-6 HG recruitment increased their gap by two tenths, Regions 7-10 improved it by the same margin.
o Last year at this time: higher grade recruitment was down -3.2%, with US HG recruitment positive.
Sections are encouraged to promote the Member-Get-a-Member referral program to existing members, especially within the student branches in your Section. Need help or ideas? E-mail [email protected].
IEEE-USA Recruitment Incentive 2015
In an effort to increase US higher-grade membership, IEEE-USA and MGA have partnered to pilot a campaign building on the existing Member-Get-a-Member program. Higher-grade members in the US are eligible to submit referrals through a special online form. An automated email invites the referral to join and offers a US$25 discount on their first year (16 August - 28 February), or to join at the special half year dues rate (1 March – 15 August). For each successful new recruit, the referring member can select an IEEE-USA branded merchandise item including a hat, cooler, backpack, golf balls, pen sets, portable charger, tablet case, umbrella and more.
MGA HQ will promote the program in the monthly Benefits Bulletin, and Sections and Regions should promote the program on their own website. For more information on how to do this, contact [email protected].
2015 2014 2015 2014 2015 2014 2015 2014
# % # % # % # %
1 1,045 1,084 (39) -3.6% 837 813 24 3.0% 1,668 1,701 (33) -1.9% 3,550 3,598 (48) -1.3%2 891 1,001 (110) -11.0% 770 809 (39) -4.8% 1,209 1,420 (211) -14.9% 2,870 3,230 (360) -11.1%3 925 1,036 (111) -10.7% 929 945 (16) -1.7% 2,255 2,435 (180) -7.4% 4,109 4,416 (307) -7.0%4 683 910 (227) -24.9% 806 899 (93) -10.3% 1,417 1,419 (2) -0.1% 2,906 3,228 (322) -10.0%5 1,075 1,182 (107) -9.1% 792 866 (74) -8.5% 2,042 1,736 306 17.6% 3,909 3,784 125 3.3%6 2,089 2,115 (26) -1.2% 1,287 1,209 78 6.5% 2,765 2,926 (161) -5.5% 6,141 6,250 (109) -1.7%
R 1-6 6,708 7,328 (620) -8.5% 5,421 5,541 (120) -2.2% 11,356 11,637 (281) -2.4% 23,485 24,506 (1,021) -4.2%7 862 1,025 (163) -15.9% 870 827 43 5.2% 1,140 1,201 (61) -5.1% 2,872 3,053 (181) -5.9%8 3,856 4,637 (781) -16.8% 5,278 5,259 19 0.4% 7,407 7,212 195 2.7% 16,541 17,108 (567) -3.3%9 1,125 1,330 (205) -15.4% 572 589 (17) -2.9% 4,920 4,696 224 4.8% 6,617 6,615 2 0.0%10 5,931 6,642 (711) -10.7% 9,019 10,524 (1,505) -14.3% 24,607 23,834 773 3.2% 39,557 41,000 (1,443) -3.5%
R 7-10 11,774 13,634 (1,860) -13.6% 15,739 17,199 (1,460) -8.5% 38,074 36,943 1,131 3.1% 65,587 67,776 (2,189) -3.2%TOTAL 18,482 20,962 (2,480) -11.8% 21,160 22,740 (1,580) -6.9% 49,430 48,580 850 1.7% 89,072 92,282 (3,210) -3.5%
Cumulative Recruitment - September through August 2015
REGION HIGHER GRADE w/o GSMs GRADUATE STUDENTS UNDERGRADUATE STUDENTS TOTAL MEMBERSChange Change Change Change
2016 MY To Date
2015 MY Total
2014 MY Total
Program To Date
Referrals Submitted 129 941 1,240 2,310
Referrals Joined 3 224 397 622
% of Referrals Joined 2.3% 23.8% 32.0% 20.1%
# New US HG Members 3 168 295 466
MD Monthly – AUGUST 2015 – Page 12
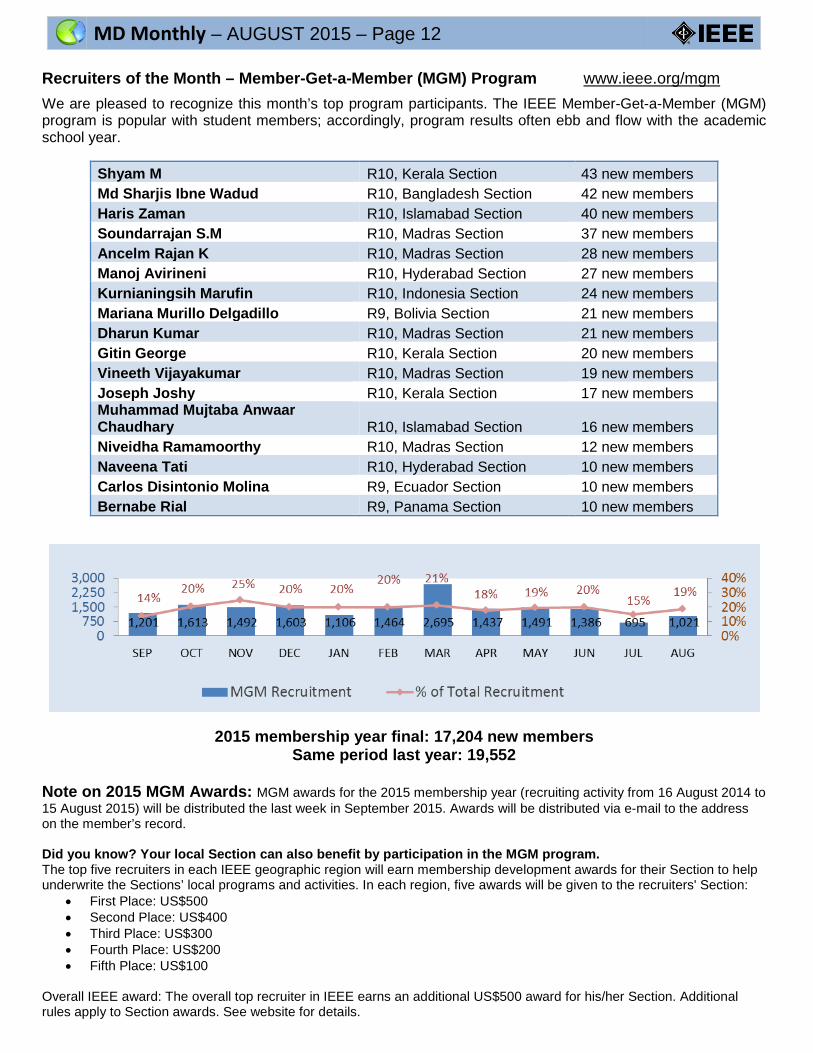
Recruiters of the Month – Member-Get-a-Member (MGM) Program www.ieee.org/mgm
We are pleased to recognize this month’s top program participants. The IEEE Member-Get-a-Member (MGM) program is popular with student members; accordingly, program results often ebb and flow with the academic school year.
Shyam M R10, Kerala Section 43 new members Md Sharjis Ibne Wadud R10, Bangladesh Section 42 new members Haris Zaman R10, Islamabad Section 40 new members Soundarrajan S.M R10, Madras Section 37 new members Ancelm Rajan K R10, Madras Section 28 new members Manoj Avirineni R10, Hyderabad Section 27 new members Kurnianingsih Marufin R10, Indonesia Section 24 new members Mariana Murillo Delgadillo R9, Bolivia Section 21 new members Dharun Kumar R10, Madras Section 21 new members Gitin George R10, Kerala Section 20 new members Vineeth Vijayakumar R10, Madras Section 19 new members Joseph Joshy R10, Kerala Section 17 new members Muhammad Mujtaba Anwaar Chaudhary R10, Islamabad Section 16 new members Niveidha Ramamoorthy R10, Madras Section 12 new members Naveena Tati R10, Hyderabad Section 10 new members Carlos Disintonio Molina R9, Ecuador Section 10 new members Bernabe Rial R9, Panama Section 10 new members
2015 membership year final: 17,204 new members Same period last year: 19,552
Note on 2015 MGM Awards: MGM awards for the 2015 membership year (recruiting activity from 16 August 2014 to 15 August 2015) will be distributed the last week in September 2015. Awards will be distributed via e-mail to the address on the member’s record. Did you know? Your local Section can also benefit by participation in the MGM program. The top five recruiters in each IEEE geographic region will earn membership development awards for their Section to help underwrite the Sections’ local programs and activities. In each region, five awards will be given to the recruiters' Section:
• First Place: US$500 • Second Place: US$400 • Third Place: US$300 • Fourth Place: US$200 • Fifth Place: US$100
Overall IEEE award: The overall top recruiter in IEEE earns an additional US$500 award for his/her Section. Additional rules apply to Section awards. See website for details.
MD Monthly – AUGUST 2015 – Page 13
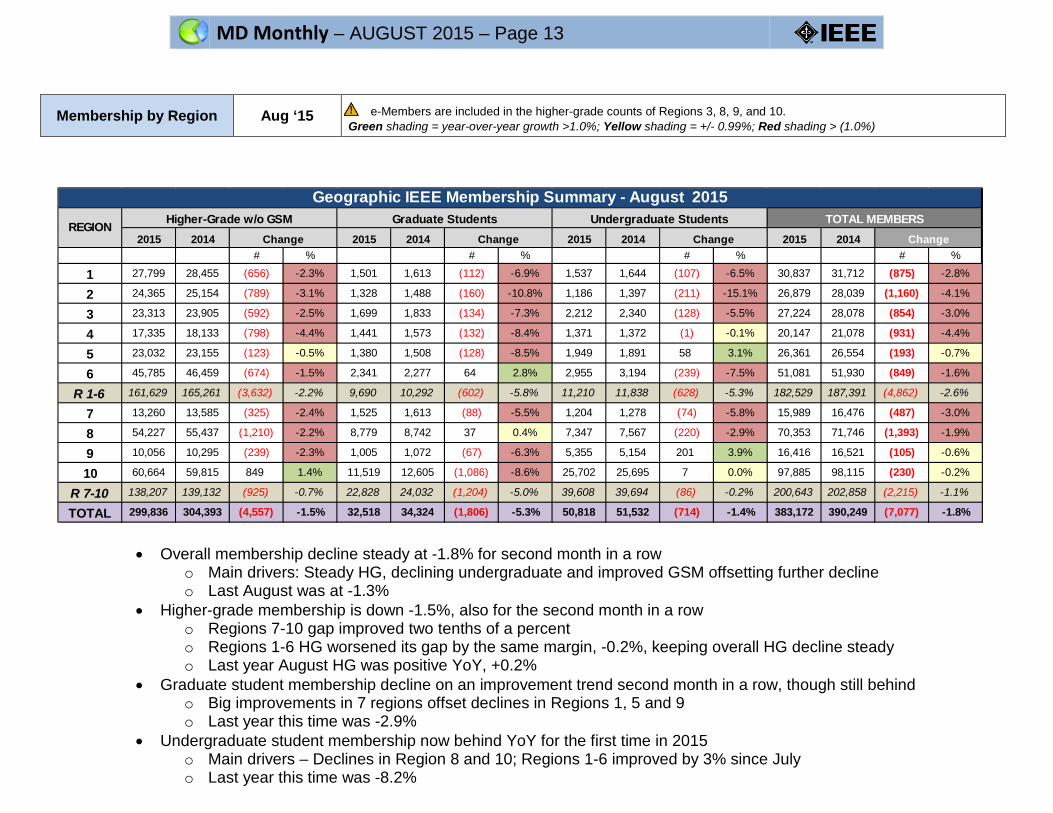
Membership by Region Aug ‘15
e-Members are included in the higher-grade counts of Regions 3, 8, 9, and 10.
Green shading = year-over-year growth >1.0%; Yellow shading = +/- 0.99%; Red shading > (1.0%)
2015 2014 2015 2014 2015 2014 2015 2014# % # % # % # %
1 27,799 28,455 (656) -2.3% 1,501 1,613 (112) -6.9% 1,537 1,644 (107) -6.5% 30,837 31,712 (875) -2.8%
2 24,365 25,154 (789) -3.1% 1,328 1,488 (160) -10.8% 1,186 1,397 (211) -15.1% 26,879 28,039 (1,160) -4.1%
3 23,313 23,905 (592) -2.5% 1,699 1,833 (134) -7.3% 2,212 2,340 (128) -5.5% 27,224 28,078 (854) -3.0%
4 17,335 18,133 (798) -4.4% 1,441 1,573 (132) -8.4% 1,371 1,372 (1) -0.1% 20,147 21,078 (931) -4.4%
5 23,032 23,155 (123) -0.5% 1,380 1,508 (128) -8.5% 1,949 1,891 58 3.1% 26,361 26,554 (193) -0.7%
6 45,785 46,459 (674) -1.5% 2,341 2,277 64 2.8% 2,955 3,194 (239) -7.5% 51,081 51,930 (849) -1.6%
R 1-6 161,629 165,261 (3,632) -2.2% 9,690 10,292 (602) -5.8% 11,210 11,838 (628) -5.3% 182,529 187,391 (4,862) -2.6%
7 13,260 13,585 (325) -2.4% 1,525 1,613 (88) -5.5% 1,204 1,278 (74) -5.8% 15,989 16,476 (487) -3.0%
8 54,227 55,437 (1,210) -2.2% 8,779 8,742 37 0.4% 7,347 7,567 (220) -2.9% 70,353 71,746 (1,393) -1.9%
9 10,056 10,295 (239) -2.3% 1,005 1,072 (67) -6.3% 5,355 5,154 201 3.9% 16,416 16,521 (105) -0.6%
10 60,664 59,815 849 1.4% 11,519 12,605 (1,086) -8.6% 25,702 25,695 7 0.0% 97,885 98,115 (230) -0.2%
R 7-10 138,207 139,132 (925) -0.7% 22,828 24,032 (1,204) -5.0% 39,608 39,694 (86) -0.2% 200,643 202,858 (2,215) -1.1%
TOTAL 299,836 304,393 (4,557) -1.5% 32,518 34,324 (1,806) -5.3% 50,818 51,532 (714) -1.4% 383,172 390,249 (7,077) -1.8%
Geographic IEEE Membership Summary - August 2015TOTAL MEMBERS
Change
Higher-Grade w/o GSM Undergraduate StudentsChange Change
Graduate StudentsChange
REGION
• Overall membership decline steady at -1.8% for second month in a row o Main drivers: Steady HG, declining undergraduate and improved GSM offsetting further decline o Last August was at -1.3%
• Higher-grade membership is down -1.5%, also for the second month in a row o Regions 7-10 gap improved two tenths of a percent o Regions 1-6 HG worsened its gap by the same margin, -0.2%, keeping overall HG decline steady o Last year August HG was positive YoY, +0.2%
• Graduate student membership decline on an improvement trend second month in a row, though still behind o Big improvements in 7 regions offset declines in Regions 1, 5 and 9 o Last year this time was -2.9%
• Undergraduate student membership now behind YoY for the first time in 2015 o Main drivers – Declines in Region 8 and 10; Regions 1-6 improved by 3% since July o Last year this time was -8.2%
MD Monthly – AUGUST 2015 – Page 14
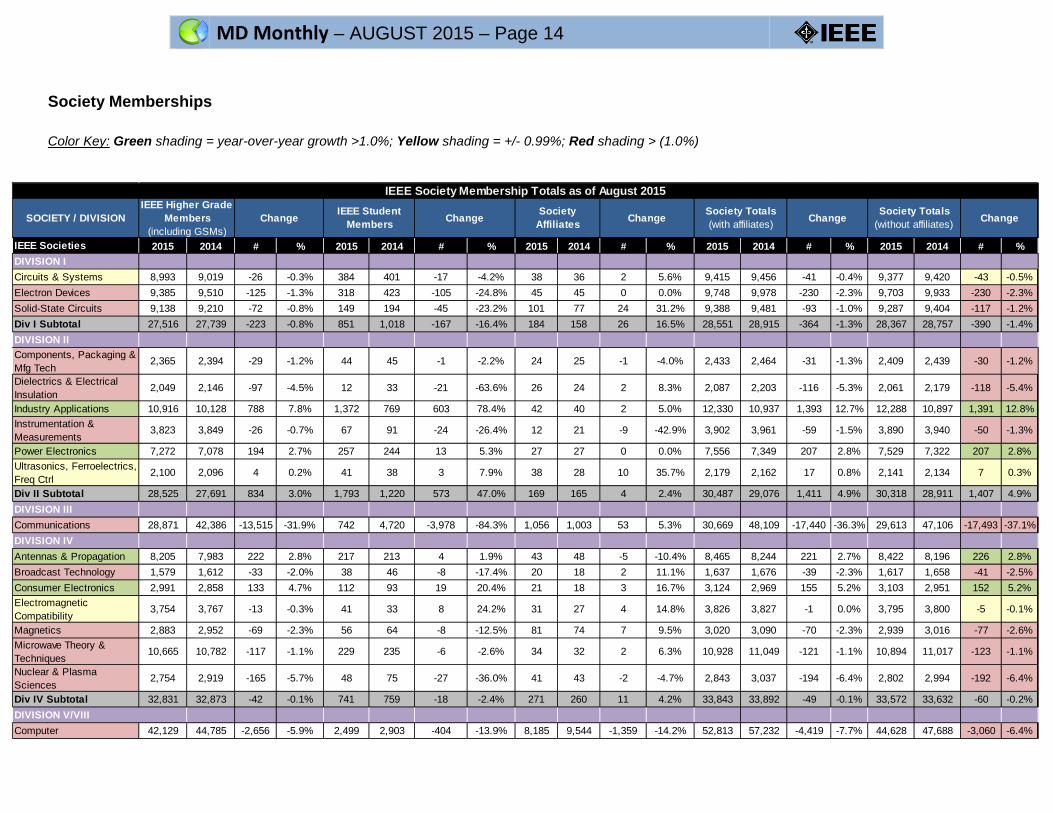
Society Memberships
Color Key: Green shading = year-over-year growth >1.0%; Yellow shading = +/- 0.99%; Red shading > (1.0%)
SOCIETY / DIVISION
IEEE Societies 2015 2014 # % 2015 2014 # % 2015 2014 # % 2015 2014 # % 2015 2014 # %DIVISION ICircuits & Systems 8,993 9,019 -26 -0.3% 384 401 -17 -4.2% 38 36 2 5.6% 9,415 9,456 -41 -0.4% 9,377 9,420 -43 -0.5%Electron Devices 9,385 9,510 -125 -1.3% 318 423 -105 -24.8% 45 45 0 0.0% 9,748 9,978 -230 -2.3% 9,703 9,933 -230 -2.3%Solid-State Circuits 9,138 9,210 -72 -0.8% 149 194 -45 -23.2% 101 77 24 31.2% 9,388 9,481 -93 -1.0% 9,287 9,404 -117 -1.2%Div I Subtotal 27,516 27,739 -223 -0.8% 851 1,018 -167 -16.4% 184 158 26 16.5% 28,551 28,915 -364 -1.3% 28,367 28,757 -390 -1.4%DIVISION II Components, Packaging & Mfg Tech
2,365 2,394 -29 -1.2% 44 45 -1 -2.2% 24 25 -1 -4.0% 2,433 2,464 -31 -1.3% 2,409 2,439 -30 -1.2%
Dielectrics & Electrical Insulation
2,049 2,146 -97 -4.5% 12 33 -21 -63.6% 26 24 2 8.3% 2,087 2,203 -116 -5.3% 2,061 2,179 -118 -5.4%
Industry Applications 10,916 10,128 788 7.8% 1,372 769 603 78.4% 42 40 2 5.0% 12,330 10,937 1,393 12.7% 12,288 10,897 1,391 12.8%Instrumentation & Measurements
3,823 3,849 -26 -0.7% 67 91 -24 -26.4% 12 21 -9 -42.9% 3,902 3,961 -59 -1.5% 3,890 3,940 -50 -1.3%
Power Electronics 7,272 7,078 194 2.7% 257 244 13 5.3% 27 27 0 0.0% 7,556 7,349 207 2.8% 7,529 7,322 207 2.8%Ultrasonics, Ferroelectrics, Freq Ctrl
2,100 2,096 4 0.2% 41 38 3 7.9% 38 28 10 35.7% 2,179 2,162 17 0.8% 2,141 2,134 7 0.3%
Div II Subtotal 28,525 27,691 834 3.0% 1,793 1,220 573 47.0% 169 165 4 2.4% 30,487 29,076 1,411 4.9% 30,318 28,911 1,407 4.9%DIVISION IIICommunications 28,871 42,386 -13,515 -31.9% 742 4,720 -3,978 -84.3% 1,056 1,003 53 5.3% 30,669 48,109 -17,440 -36.3% 29,613 47,106 -17,493 -37.1%DIVISION IVAntennas & Propagation 8,205 7,983 222 2.8% 217 213 4 1.9% 43 48 -5 -10.4% 8,465 8,244 221 2.7% 8,422 8,196 226 2.8%Broadcast Technology 1,579 1,612 -33 -2.0% 38 46 -8 -17.4% 20 18 2 11.1% 1,637 1,676 -39 -2.3% 1,617 1,658 -41 -2.5%Consumer Electronics 2,991 2,858 133 4.7% 112 93 19 20.4% 21 18 3 16.7% 3,124 2,969 155 5.2% 3,103 2,951 152 5.2%Electromagnetic Compatibility
3,754 3,767 -13 -0.3% 41 33 8 24.2% 31 27 4 14.8% 3,826 3,827 -1 0.0% 3,795 3,800 -5 -0.1%
Magnetics 2,883 2,952 -69 -2.3% 56 64 -8 -12.5% 81 74 7 9.5% 3,020 3,090 -70 -2.3% 2,939 3,016 -77 -2.6%Microwave Theory & Techniques
10,665 10,782 -117 -1.1% 229 235 -6 -2.6% 34 32 2 6.3% 10,928 11,049 -121 -1.1% 10,894 11,017 -123 -1.1%
Nuclear & Plasma Sciences
2,754 2,919 -165 -5.7% 48 75 -27 -36.0% 41 43 -2 -4.7% 2,843 3,037 -194 -6.4% 2,802 2,994 -192 -6.4%
Div IV Subtotal 32,831 32,873 -42 -0.1% 741 759 -18 -2.4% 271 260 11 4.2% 33,843 33,892 -49 -0.1% 33,572 33,632 -60 -0.2%DIVISION V/VIIIComputer 42,129 44,785 -2,656 -5.9% 2,499 2,903 -404 -13.9% 8,185 9,544 -1,359 -14.2% 52,813 57,232 -4,419 -7.7% 44,628 47,688 -3,060 -6.4%
IEEE Society Membership Totals as of August 2015IEEE Higher Grade
Members (including GSMs)
Change IEEE Student Members Change Society
Affiliates Change Society Totals (with affiliates) Change Society Totals
(without affiliates) Change
MD Monthly – AUGUST 2015 – Page 15
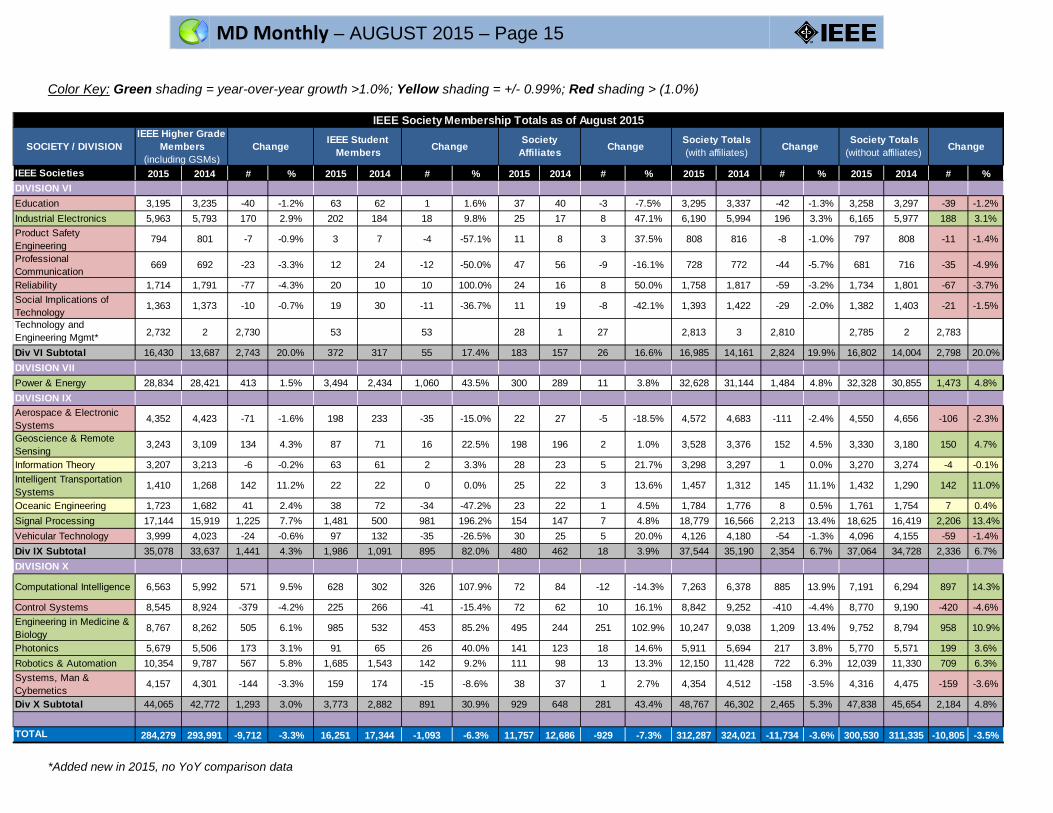
Color Key: Green shading = year-over-year growth >1.0%; Yellow shading = +/- 0.99%; Red shading > (1.0%)
*Added new in 2015, no YoY comparison data
SOCIETY / DIVISION
IEEE Societies 2015 2014 # % 2015 2014 # % 2015 2014 # % 2015 2014 # % 2015 2014 # %DIVISION VI Education 3,195 3,235 -40 -1.2% 63 62 1 1.6% 37 40 -3 -7.5% 3,295 3,337 -42 -1.3% 3,258 3,297 -39 -1.2%Industrial Electronics 5,963 5,793 170 2.9% 202 184 18 9.8% 25 17 8 47.1% 6,190 5,994 196 3.3% 6,165 5,977 188 3.1%Product Safety Engineering
794 801 -7 -0.9% 3 7 -4 -57.1% 11 8 3 37.5% 808 816 -8 -1.0% 797 808 -11 -1.4%
Professional Communication
669 692 -23 -3.3% 12 24 -12 -50.0% 47 56 -9 -16.1% 728 772 -44 -5.7% 681 716 -35 -4.9%
Reliability 1,714 1,791 -77 -4.3% 20 10 10 100.0% 24 16 8 50.0% 1,758 1,817 -59 -3.2% 1,734 1,801 -67 -3.7%Social Implications of Technology
1,363 1,373 -10 -0.7% 19 30 -11 -36.7% 11 19 -8 -42.1% 1,393 1,422 -29 -2.0% 1,382 1,403 -21 -1.5%
Technology and Engineering Mgmt* 2,732 2 2,730 53 53 28 1 27 2,813 3 2,810 2,785 2 2,783
Div VI Subtotal 16,430 13,687 2,743 20.0% 372 317 55 17.4% 183 157 26 16.6% 16,985 14,161 2,824 19.9% 16,802 14,004 2,798 20.0%DIVISION VII Power & Energy 28,834 28,421 413 1.5% 3,494 2,434 1,060 43.5% 300 289 11 3.8% 32,628 31,144 1,484 4.8% 32,328 30,855 1,473 4.8%DIVISION IXAerospace & Electronic Systems
4,352 4,423 -71 -1.6% 198 233 -35 -15.0% 22 27 -5 -18.5% 4,572 4,683 -111 -2.4% 4,550 4,656 -106 -2.3%
Geoscience & Remote Sensing
3,243 3,109 134 4.3% 87 71 16 22.5% 198 196 2 1.0% 3,528 3,376 152 4.5% 3,330 3,180 150 4.7%
Information Theory 3,207 3,213 -6 -0.2% 63 61 2 3.3% 28 23 5 21.7% 3,298 3,297 1 0.0% 3,270 3,274 -4 -0.1%Intelligent Transportation Systems
1,410 1,268 142 11.2% 22 22 0 0.0% 25 22 3 13.6% 1,457 1,312 145 11.1% 1,432 1,290 142 11.0%
Oceanic Engineering 1,723 1,682 41 2.4% 38 72 -34 -47.2% 23 22 1 4.5% 1,784 1,776 8 0.5% 1,761 1,754 7 0.4%Signal Processing 17,144 15,919 1,225 7.7% 1,481 500 981 196.2% 154 147 7 4.8% 18,779 16,566 2,213 13.4% 18,625 16,419 2,206 13.4%Vehicular Technology 3,999 4,023 -24 -0.6% 97 132 -35 -26.5% 30 25 5 20.0% 4,126 4,180 -54 -1.3% 4,096 4,155 -59 -1.4%Div IX Subtotal 35,078 33,637 1,441 4.3% 1,986 1,091 895 82.0% 480 462 18 3.9% 37,544 35,190 2,354 6.7% 37,064 34,728 2,336 6.7%DIVISION X
Computational Intelligence 6,563 5,992 571 9.5% 628 302 326 107.9% 72 84 -12 -14.3% 7,263 6,378 885 13.9% 7,191 6,294 897 14.3%
Control Systems 8,545 8,924 -379 -4.2% 225 266 -41 -15.4% 72 62 10 16.1% 8,842 9,252 -410 -4.4% 8,770 9,190 -420 -4.6%Engineering in Medicine & Biology
8,767 8,262 505 6.1% 985 532 453 85.2% 495 244 251 102.9% 10,247 9,038 1,209 13.4% 9,752 8,794 958 10.9%
Photonics 5,679 5,506 173 3.1% 91 65 26 40.0% 141 123 18 14.6% 5,911 5,694 217 3.8% 5,770 5,571 199 3.6%Robotics & Automation 10,354 9,787 567 5.8% 1,685 1,543 142 9.2% 111 98 13 13.3% 12,150 11,428 722 6.3% 12,039 11,330 709 6.3%Systems, Man & Cybernetics
4,157 4,301 -144 -3.3% 159 174 -15 -8.6% 38 37 1 2.7% 4,354 4,512 -158 -3.5% 4,316 4,475 -159 -3.6%
Div X Subtotal 44,065 42,772 1,293 3.0% 3,773 2,882 891 30.9% 929 648 281 43.4% 48,767 46,302 2,465 5.3% 47,838 45,654 2,184 4.8%
TOTAL 284,279 293,991 -9,712 -3.3% 16,251 17,344 -1,093 -6.3% 11,757 12,686 -929 -7.3% 312,287 324,021 -11,734 -3.6% 300,530 311,335 -10,805 -3.5%
IEEE Society Membership Totals as of August 2015IEEE Higher Grade
Members (including GSMs)
Change IEEE Student Members Change Society
Affiliates Change Society Totals (with affiliates) Change Society Totals
(without affiliates) Change
MD Monthly – AUGUST 2015 – Page 16
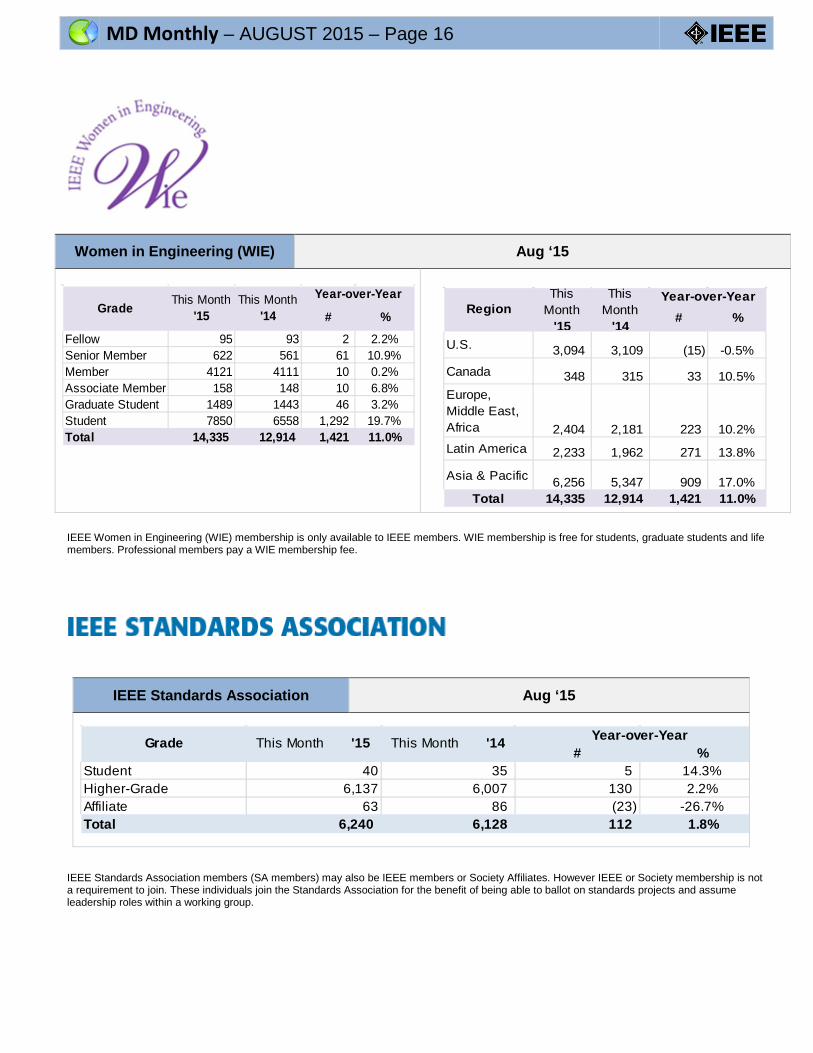
Women in Engineering (WIE) Aug ‘15
# %
Fellow 95 93 2 2.2%Senior Member 622 561 61 10.9%Member 4121 4111 10 0.2%Associate Member 158 148 10 6.8%Graduate Student 1489 1443 46 3.2%Student 7850 6558 1,292 19.7%Total 14,335 12,914 1,421 11.0%
Year-over-YearGrade This Month
'15This Month
'14
# %
U.S. 3,094 3,109 (15) -0.5%
Canada 348 315 33 10.5%Europe, Middle East, Africa 2,404 2,181 223 10.2%Latin America 2,233 1,962 271 13.8%
Asia & Pacific 6,256 5,347 909 17.0%Total 14,335 12,914 1,421 11.0%
Year-over-YearRegion
This Month
'15
This Month
'14
IEEE Women in Engineering (WIE) membership is only available to IEEE members. WIE membership is free for students, graduate students and life members. Professional members pay a WIE membership fee.
IEEE Standards Association members (SA members) may also be IEEE members or Society Affiliates. However IEEE or Society membership is not a requirement to join. These individuals join the Standards Association for the benefit of being able to ballot on standards projects and assume leadership roles within a working group.
IEEE Standards Association Aug ‘15
# %Student 40 35 5 14.3%Higher-Grade 6,137 6,007 130 2.2%Affiliate 63 86 (23) -26.7%Total 6,240 6,128 112 1.8%
Year-over-YearGrade This Month '15 This Month '14
MD Monthly – AUGUST 2015 – Page 17
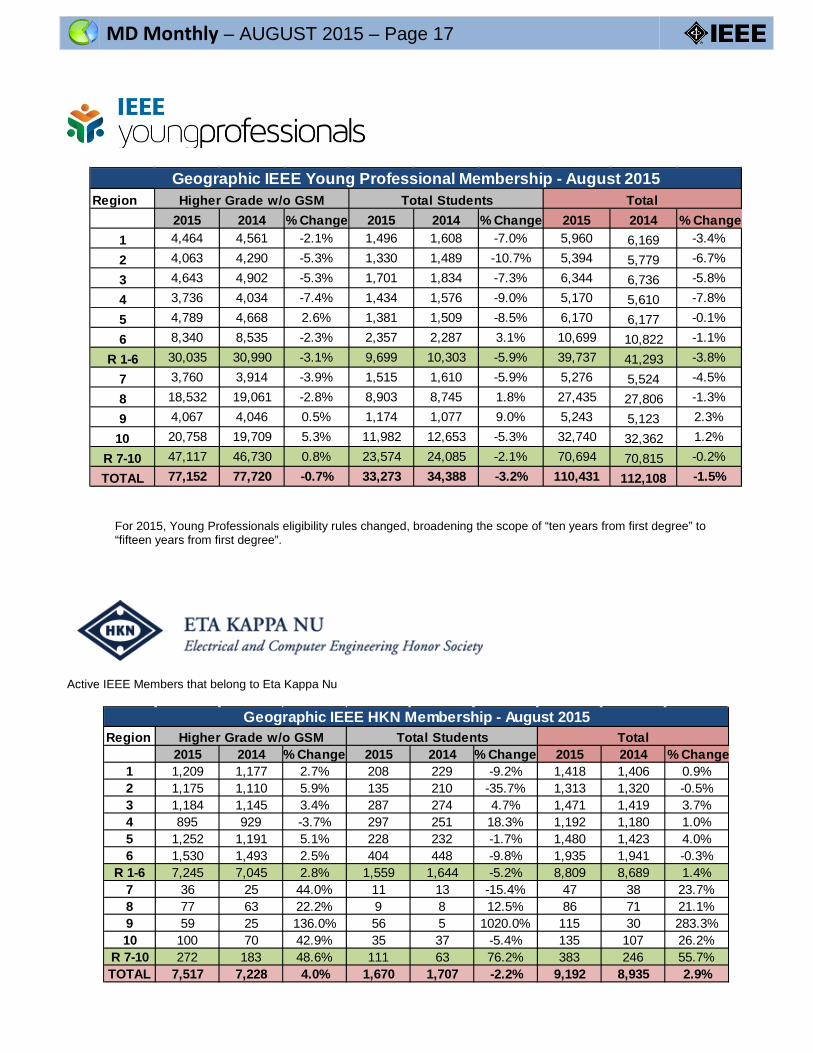
For 2015, Young Professionals eligibility rules changed, broadening the scope of “ten years from first degree” to “fifteen years from first degree”.
Active IEEE Members that belong to Eta Kappa Nu
Region2015 2014 % Change 2015 2014 % Change 2015 2014 % Change
1 4,464 4,561 -2.1% 1,496 1,608 -7.0% 5,960 6,169 -3.4%
2 4,063 4,290 -5.3% 1,330 1,489 -10.7% 5,394 5,779 -6.7%
3 4,643 4,902 -5.3% 1,701 1,834 -7.3% 6,344 6,736 -5.8%
4 3,736 4,034 -7.4% 1,434 1,576 -9.0% 5,170 5,610 -7.8%
5 4,789 4,668 2.6% 1,381 1,509 -8.5% 6,170 6,177 -0.1%
6 8,340 8,535 -2.3% 2,357 2,287 3.1% 10,699 10,822 -1.1%
R 1-6 30,035 30,990 -3.1% 9,699 10,303 -5.9% 39,737 41,293 -3.8%
7 3,760 3,914 -3.9% 1,515 1,610 -5.9% 5,276 5,524 -4.5%
8 18,532 19,061 -2.8% 8,903 8,745 1.8% 27,435 27,806 -1.3%
9 4,067 4,046 0.5% 1,174 1,077 9.0% 5,243 5,123 2.3%
10 20,758 19,709 5.3% 11,982 12,653 -5.3% 32,740 32,362 1.2%
R 7-10 47,117 46,730 0.8% 23,574 24,085 -2.1% 70,694 70,815 -0.2%
TOTAL 77,152 77,720 -0.7% 33,273 34,388 -3.2% 110,431 112,108 -1.5%
Geographic IEEE Young Professional Membership - August 2015Higher Grade w/o GSM Total Students Total
Region2015 2014 % Change 2015 2014 % Change 2015 2014 % Change
1 1,209 1,177 2.7% 208 229 -9.2% 1,418 1,406 0.9%2 1,175 1,110 5.9% 135 210 -35.7% 1,313 1,320 -0.5%3 1,184 1,145 3.4% 287 274 4.7% 1,471 1,419 3.7%4 895 929 -3.7% 297 251 18.3% 1,192 1,180 1.0%5 1,252 1,191 5.1% 228 232 -1.7% 1,480 1,423 4.0%6 1,530 1,493 2.5% 404 448 -9.8% 1,935 1,941 -0.3%
R 1-6 7,245 7,045 2.8% 1,559 1,644 -5.2% 8,809 8,689 1.4%7 36 25 44.0% 11 13 -15.4% 47 38 23.7%8 77 63 22.2% 9 8 12.5% 86 71 21.1%9 59 25 136.0% 56 5 1020.0% 115 30 283.3%10 100 70 42.9% 35 37 -5.4% 135 107 26.2%
R 7-10 272 183 48.6% 111 63 76.2% 383 246 55.7%TOTAL 7,517 7,228 4.0% 1,670 1,707 -2.2% 9,192 8,935 2.9%
Geographic IEEE HKN Membership - August 2015Higher Grade w/o GSM Total Students Total