Embed Size (px)
Citation preview
sustainable Growth
2010 AnnuAl finAnCiAl informAtion
Pri
nte
d in
Can
ada
Management’s Discussion and Analysis
1
SEMAFO (the “Corporation”) is a Canadian-based mining company with gold production and exploration activities in West Africa. The Corporation and its subsidiaries currently operate three gold mines: the Mana Mine in Burkina Faso, the Samira Hill Mine in Niger and the Kiniero Mine in Guinea. SEMAFO is committed to evolve in a conscientious manner to become a major player in its geographical areas of interest. SEMAFO’s strategic focus is to maximize shareholder value by effectively managing its existing assets as well as pursuing organic and strategic growth opportunities.
This Management’s Discussion and Analysis (“MD&A”) provides an analysis to enable readers to assess material changes in financial condition and results of operations for the three-month and nine-month periods ended September 30, 2011 compared to the corresponding periods last year. This MD&A, prepared as of November 8, 2011, is intended to complement and supplement our Unaudited Interim Consolidated Financial Statements (the “financial statements”) as at September 30, 2011. It should be read in conjunction with our MD&A and Audited Consolidated Financial Statements and notes thereto for the year ended December 31, 2010 as well as with our MD&A and Unaudited Interim Consolidated Financial Statements published for the first quarter of 2011. Our financial statements and this MD&A are intended to provide investors with a reasonable basis for assessing our results of operation and our financial performance.
Our financial statements have been prepared using accounting policies consistent with International Financial Reporting Standards (“IFRS”) and in accordance with International Accounting Standards 34, Interim Financial Reporting (“IAS 34”). Previously, the Corporation prepared its interim and annual consolidated financial statements in accordance with Canadian generally accepted accounting principles (“Canadian GAAP”). The Corporation’s 2010 comparatives in this MD&A have been presented in accordance with IFRS. All dollar amounts contained in this MD&A are expressed in US dollars, unless otherwise specified.
Where we say “we”, “us”, “our”, the “Corporation” or “SEMAFO”, we mean SEMAFO Inc. or SEMAFO Inc. and/or one or more or all of its subsidiaries, as it may apply.
1. Financial and Operating Highlights
Three-month period ended September 30
Nine-month period ended September 30
2011 2010 2011 2010
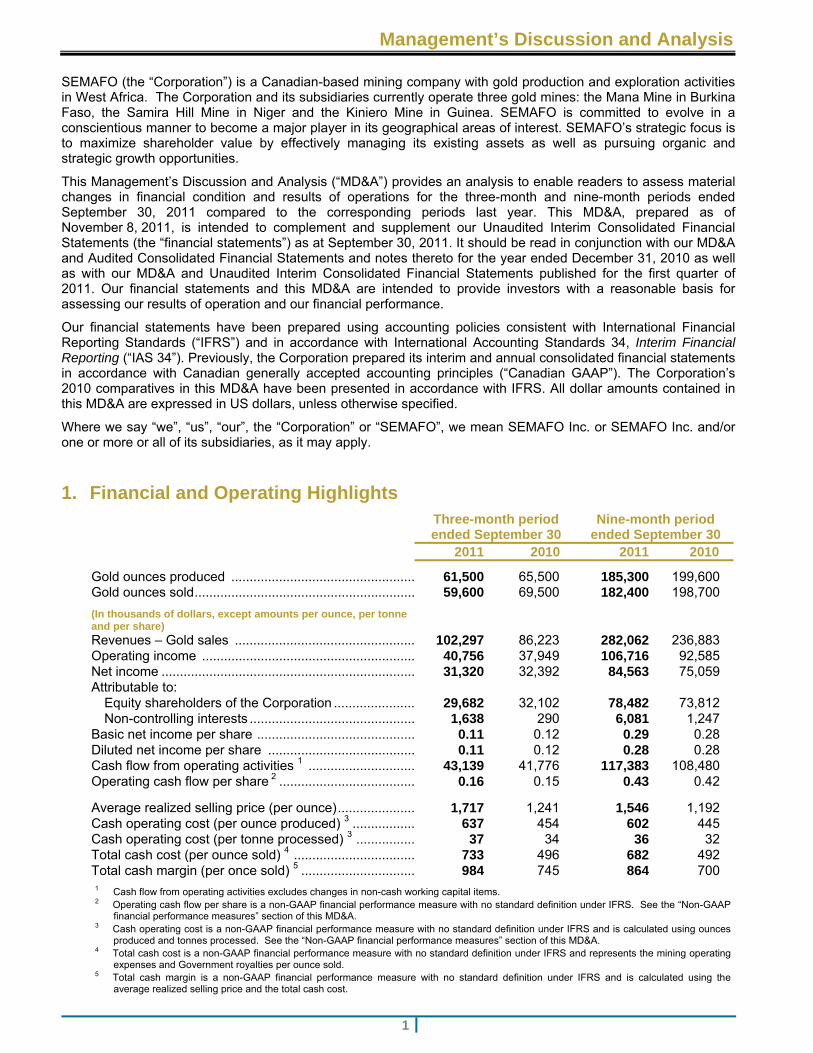
Gold ounces produced .................................................. 61,500 65,500 185,300 199,600 Gold ounces sold ............................................................ 59,600 69,500 182,400 198,700
(In thousands of dollars, except amounts per ounce, per tonne and per share) Revenues – Gold sales ................................................. 102,297 86,223 282,062 236,883 Operating income .......................................................... 40,756 37,949 106,716 92,585 Net income ..................................................................... 31,320 32,392 84,563 75,059 Attributable to:
Equity shareholders of the Corporation ...................... 29,682 32,102 78,482 73,812 Non-controlling interests ............................................. 1,638 290 6,081 1,247
Basic net income per share ........................................... 0.11 0.12 0.29 0.28 Diluted net income per share ........................................ 0.11 0.12 0.28 0.28 Cash flow from operating activities 1 ............................. 43,139 41,776 117,383 108,480 Operating cash flow per share 2 ..................................... 0.16 0.15 0.43 0.42
Average realized selling price (per ounce) ..................... 1,717 1,241 1,546 1,192 Cash operating cost (per ounce produced) 3 ................. 637 454 602 445 Cash operating cost (per tonne processed) 3 ................ 37 34 36 32 Total cash cost (per ounce sold) 4 ................................. 733 496 682 492 Total cash margin (per once sold) 5 ............................... 984 745 864 700 1 Cash flow from operating activities excludes changes in non-cash working capital items. 2 Operating cash flow per share is a non-GAAP financial performance measure with no standard definition under IFRS. See the “Non-GAAP
financial performance measures” section of this MD&A. 3 Cash operating cost is a non-GAAP financial performance measure with no standard definition under IFRS and is calculated using ounces
produced and tonnes processed. See the “Non-GAAP financial performance measures” section of this MD&A. 4 Total cash cost is a non-GAAP financial performance measure with no standard definition under IFRS and represents the mining operating
expenses and Government royalties per ounce sold. 5 Total cash margin is a non-GAAP financial performance measure with no standard definition under IFRS and is calculated using the
average realized selling price and the total cash cost.
Management’s Discussion and Analysis
2
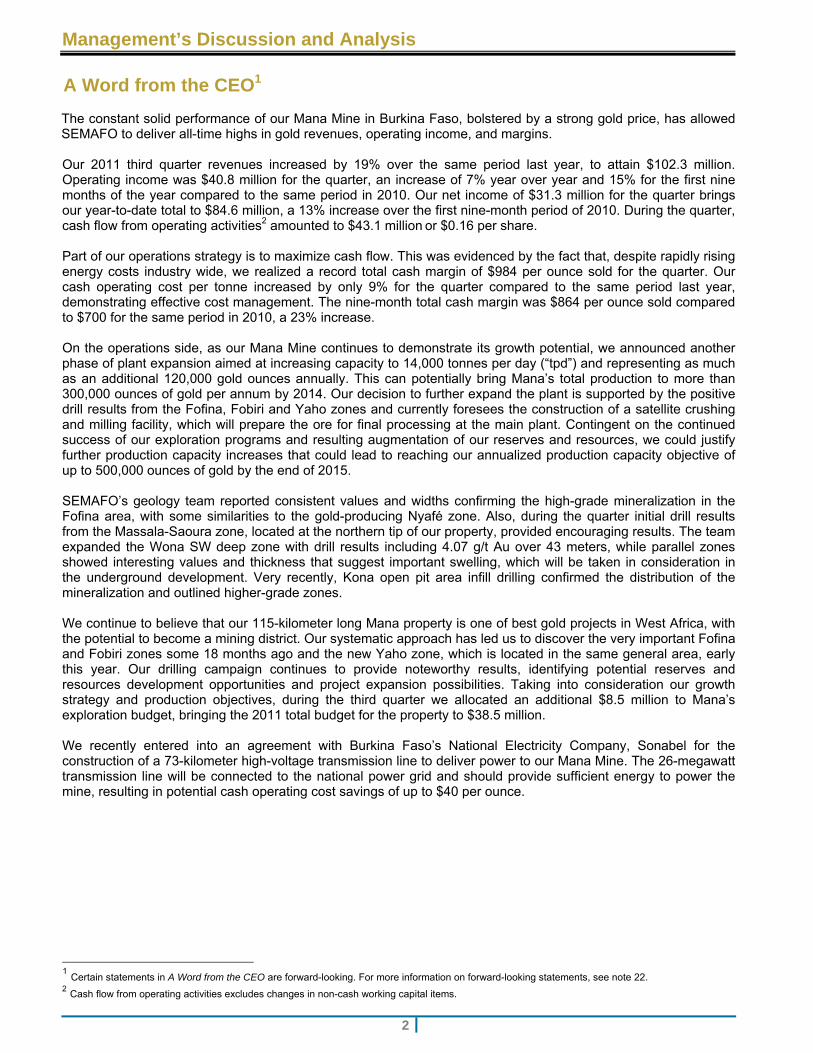
A Word from the CEO1 The constant solid performance of our Mana Mine in Burkina Faso, bolstered by a strong gold price, has allowed SEMAFO to deliver all-time highs in gold revenues, operating income, and margins. Our 2011 third quarter revenues increased by 19% over the same period last year, to attain $102.3 million. Operating income was $40.8 million for the quarter, an increase of 7% year over year and 15% for the first nine months of the year compared to the same period in 2010. Our net income of $31.3 million for the quarter brings our year-to-date total to $84.6 million, a 13% increase over the first nine-month period of 2010. During the quarter, cash flow from operating activities2 amounted to $43.1 million or $0.16 per share. Part of our operations strategy is to maximize cash flow. This was evidenced by the fact that, despite rapidly rising energy costs industry wide, we realized a record total cash margin of $984 per ounce sold for the quarter. Our cash operating cost per tonne increased by only 9% for the quarter compared to the same period last year, demonstrating effective cost management. The nine-month total cash margin was $864 per ounce sold compared to $700 for the same period in 2010, a 23% increase. On the operations side, as our Mana Mine continues to demonstrate its growth potential, we announced another phase of plant expansion aimed at increasing capacity to 14,000 tonnes per day (“tpd”) and representing as much as an additional 120,000 gold ounces annually. This can potentially bring Mana’s total production to more than 300,000 ounces of gold per annum by 2014. Our decision to further expand the plant is supported by the positive drill results from the Fofina, Fobiri and Yaho zones and currently foresees the construction of a satellite crushing and milling facility, which will prepare the ore for final processing at the main plant. Contingent on the continued success of our exploration programs and resulting augmentation of our reserves and resources, we could justify further production capacity increases that could lead to reaching our annualized production capacity objective of up to 500,000 ounces of gold by the end of 2015. SEMAFO’s geology team reported consistent values and widths confirming the high-grade mineralization in the Fofina area, with some similarities to the gold-producing Nyafé zone. Also, during the quarter initial drill results from the Massala-Saoura zone, located at the northern tip of our property, provided encouraging results. The team expanded the Wona SW deep zone with drill results including 4.07 g/t Au over 43 meters, while parallel zones showed interesting values and thickness that suggest important swelling, which will be taken in consideration in the underground development. Very recently, Kona open pit area infill drilling confirmed the distribution of the mineralization and outlined higher-grade zones. We continue to believe that our 115-kilometer long Mana property is one of best gold projects in West Africa, with the potential to become a mining district. Our systematic approach has led us to discover the very important Fofina and Fobiri zones some 18 months ago and the new Yaho zone, which is located in the same general area, early this year. Our drilling campaign continues to provide noteworthy results, identifying potential reserves and resources development opportunities and project expansion possibilities. Taking into consideration our growth strategy and production objectives, during the third quarter we allocated an additional $8.5 million to Mana’s exploration budget, bringing the 2011 total budget for the property to $38.5 million. We recently entered into an agreement with Burkina Faso’s National Electricity Company, Sonabel for the construction of a 73-kilometer high-voltage transmission line to deliver power to our Mana Mine. The 26-megawatt transmission line will be connected to the national power grid and should provide sufficient energy to power the mine, resulting in potential cash operating cost savings of up to $40 per ounce.
1 Certain statements in A Word from the CEO are forward-looking. For more information on forward-looking statements, see note 22. 2 Cash flow from operating activities excludes changes in non-cash working capital items.
Management’s Discussion and Analysis
3
A Word from the CEO1 (continued) We recently saw the commencement of trading of our common shares through a secondary listing on the NASDAQ OMX Stockholm exchange in Sweden. Via this new listing, we are providing European investors with the opportunity to take advantage of our unique savoir-faire, consistent solid operating results, and to participate in the potential discovery of a new mining district. With our continued solid performance and significant cash flows, SEMAFO is well-positioned to fund its operations and has the economic capacity to internally finance value-creation activities. It is with this in mind that on November 8, 2011, SEMAFO’s Board of Directors approved an inaugural cash dividend of CA $0.02 per common share. The Board of Directors is of the opinion that this is the right time to provide a dividend return to our shareholders. We believe that the payment of this inaugural dividend is evidence of SEMAFO’s ongoing commitment to maximize shareholder value. Our dedicated team is devoted to bringing Mana to be ranked among the best gold projects in Africa, thus delivering on our commitment to grow responsibly and create value for our shareholders.
Benoit La Salle, FCA
President and Chief Executive Officer
1 Certain statements in A Word from the CEO are forward-looking. For more information on forward-looking statements, see note 22.
Management’s Discussion and Analysis
4
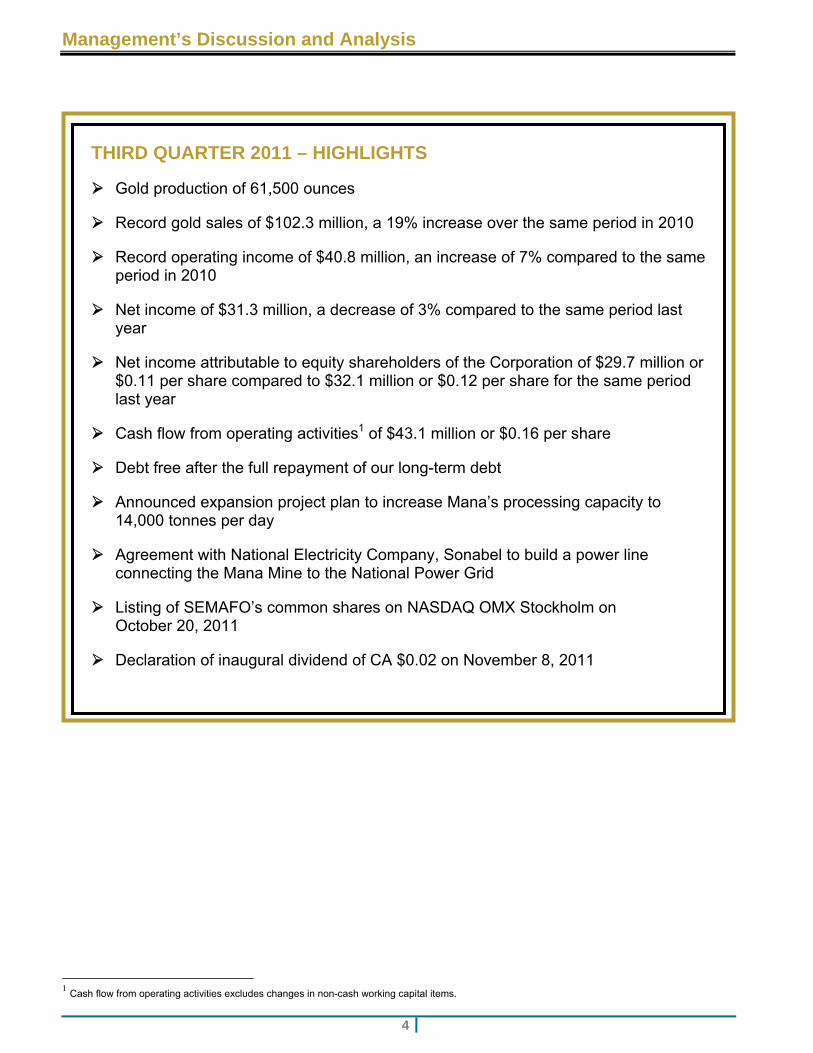
THIRD QUARTER 2011 – HIGHLIGHTS
Gold production of 61,500 ounces
Record gold sales of $102.3 million, a 19% increase over the same period in 2010
Record operating income of $40.8 million, an increase of 7% compared to the same period in 2010
Net income of $31.3 million, a decrease of 3% compared to the same period last year
Net income attributable to equity shareholders of the Corporation of $29.7 million or $0.11 per share compared to $32.1 million or $0.12 per share for the same period last year
Cash flow from operating activities1 of $43.1 million or $0.16 per share
Debt free after the full repayment of our long-term debt
Announced expansion project plan to increase Mana’s processing capacity to 14,000 tonnes per day
Agreement with National Electricity Company, Sonabel to build a power line connecting the Mana Mine to the National Power Grid
Listing of SEMAFO’s common shares on NASDAQ OMX Stockholm on October 20, 2011
Declaration of inaugural dividend of CA $0.02 on November 8, 2011
1 Cash flow from operating activities excludes changes in non-cash working capital items.
Management’s Discussion and Analysis
5
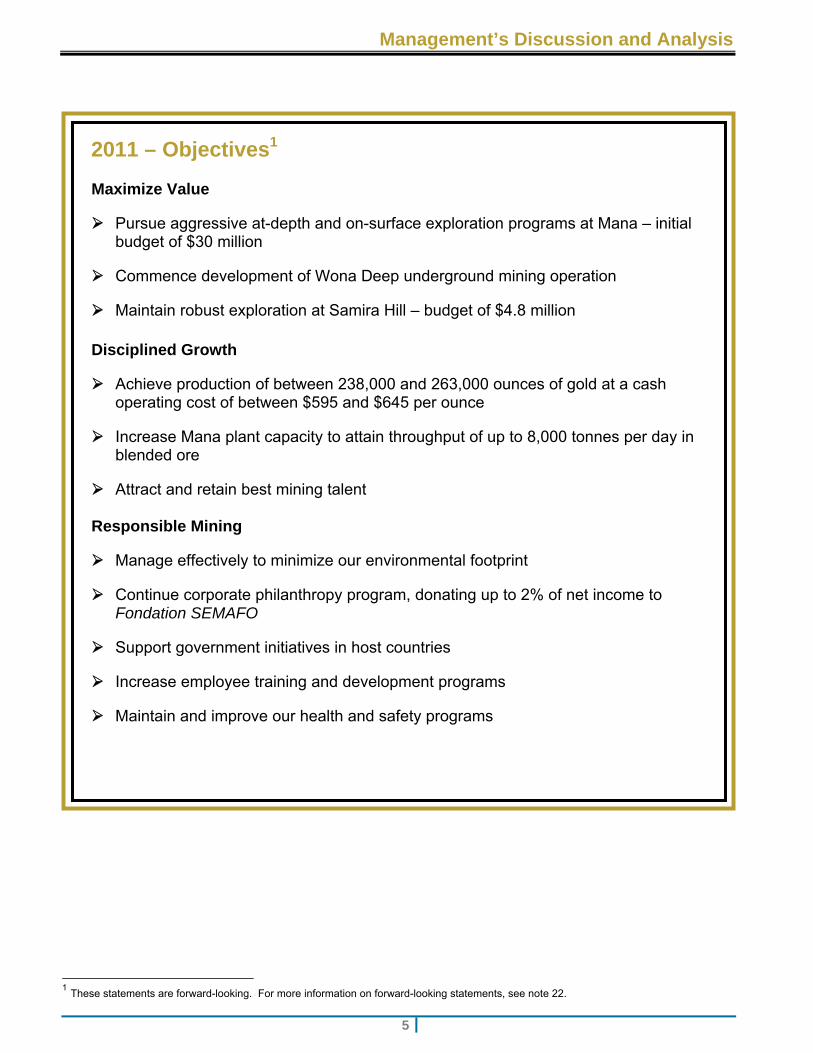
2011 – Objectives1
Maximize Value
Pursue aggressive at-depth and on-surface exploration programs at Mana – initial budget of $30 million
Commence development of Wona Deep underground mining operation
Maintain robust exploration at Samira Hill – budget of $4.8 million
Disciplined Growth
Achieve production of between 238,000 and 263,000 ounces of gold at a cash operating cost of between $595 and $645 per ounce
Increase Mana plant capacity to attain throughput of up to 8,000 tonnes per day in blended ore
Attract and retain best mining talent
Responsible Mining
Manage effectively to minimize our environmental footprint
Continue corporate philanthropy program, donating up to 2% of net income to Fondation SEMAFO
Support government initiatives in host countries
Increase employee training and development programs
Maintain and improve our health and safety programs
1 These statements are forward-looking. For more information on forward-looking statements, see note 22.
Management’s Discussion and Analysis
6
2. Key Economic Trends
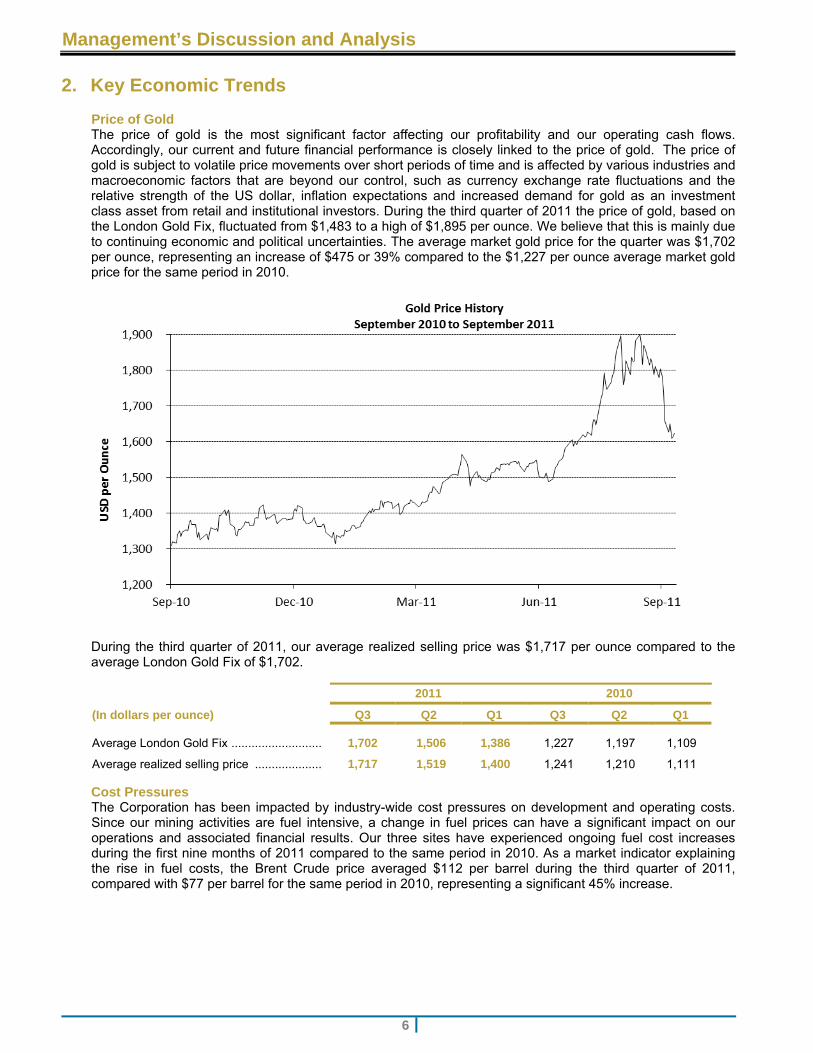
Price of Gold The price of gold is the most significant factor affecting our profitability and our operating cash flows. Accordingly, our current and future financial performance is closely linked to the price of gold. The price of gold is subject to volatile price movements over short periods of time and is affected by various industries and macroeconomic factors that are beyond our control, such as currency exchange rate fluctuations and the relative strength of the US dollar, inflation expectations and increased demand for gold as an investment class asset from retail and institutional investors. During the third quarter of 2011 the price of gold, based on the London Gold Fix, fluctuated from $1,483 to a high of $1,895 per ounce. We believe that this is mainly due to continuing economic and political uncertainties. The average market gold price for the quarter was $1,702 per ounce, representing an increase of $475 or 39% compared to the $1,227 per ounce average market gold price for the same period in 2010.
During the third quarter of 2011, our average realized selling price was $1,717 per ounce compared to the average London Gold Fix of $1,702.
2011 2010
(In dollars per ounce) Q3 Q2 Q1 Q3 Q2 Q1
Average London Gold Fix ........................... 1,702 1,506 1,386 1,227 1,197 1,109
Average realized selling price .................... 1,717 1,519 1,400 1,241 1,210 1,111
Cost Pressures The Corporation has been impacted by industry-wide cost pressures on development and operating costs. Since our mining activities are fuel intensive, a change in fuel prices can have a significant impact on our operations and associated financial results. Our three sites have experienced ongoing fuel cost increases during the first nine months of 2011 compared to the same period in 2010. As a market indicator explaining the rise in fuel costs, the Brent Crude price averaged $112 per barrel during the third quarter of 2011, compared with $77 per barrel for the same period in 2010, representing a significant 45% increase.
Management’s Discussion and Analysis
7
2. Key Economic Trends (continued)
Foreign Currencies Our mining operations and exploration activities are carried out in West Africa, with a portion of operating costs and capital expenditures denominated in foreign currencies, especially the Euro. Overall, during the third quarter of 2011, the Euro was stronger relative to the US dollar when compared with the same period in 2010, which negatively impacted our operating cost, except for the last part of the third quarter of 2011, where the US dollar had gained some strength relative to the Euro. Economists believe that the recovery of the US dollar is due to the loss of confidence in the Euro fuelled by the persistent inability of the region’s politicians to adequately resolve the debt crisis. Despite the recovery of the US dollar at the end of the third quarter of 2011, the overall impact on our 2011 third quarter operating cost is negative.
Management’s Discussion and Analysis
8
3. Exploration Programs
SEMAFO’s 2011 exploration program with a budget of $48.5 million, including $38.5 million for our Mana property in Burkina Faso, is well underway on our more than 4,500 square kilometers of permitted land.
Burkina Faso
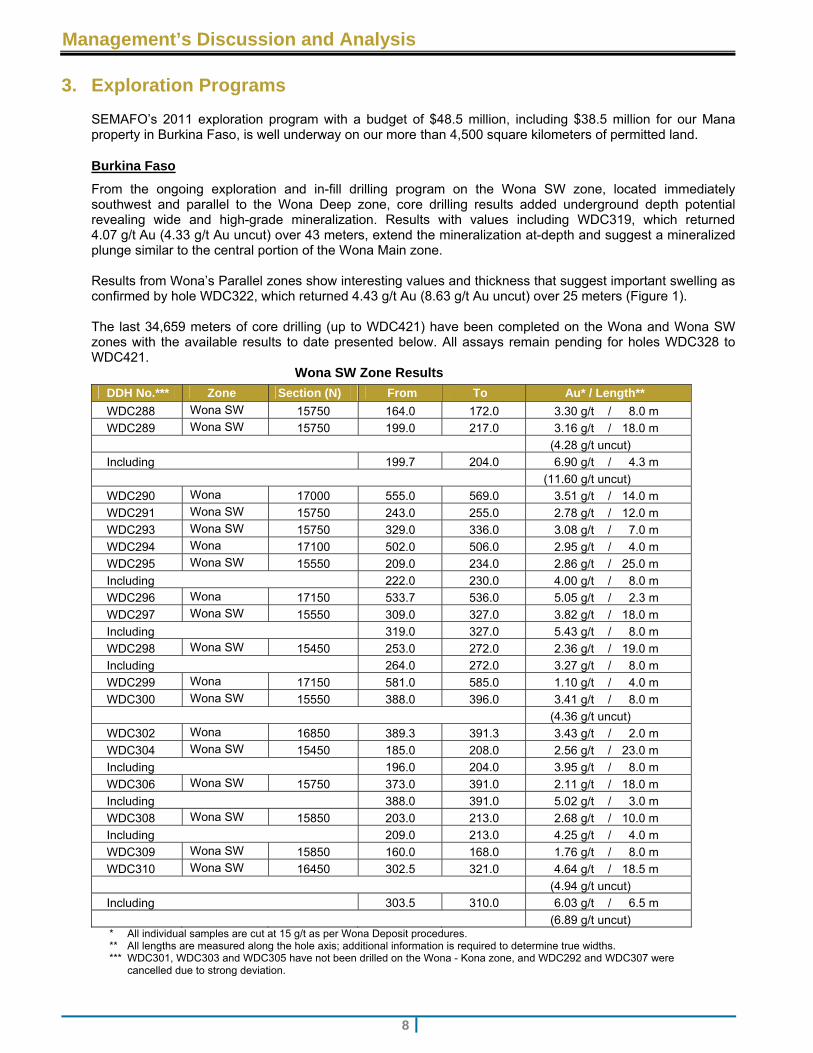
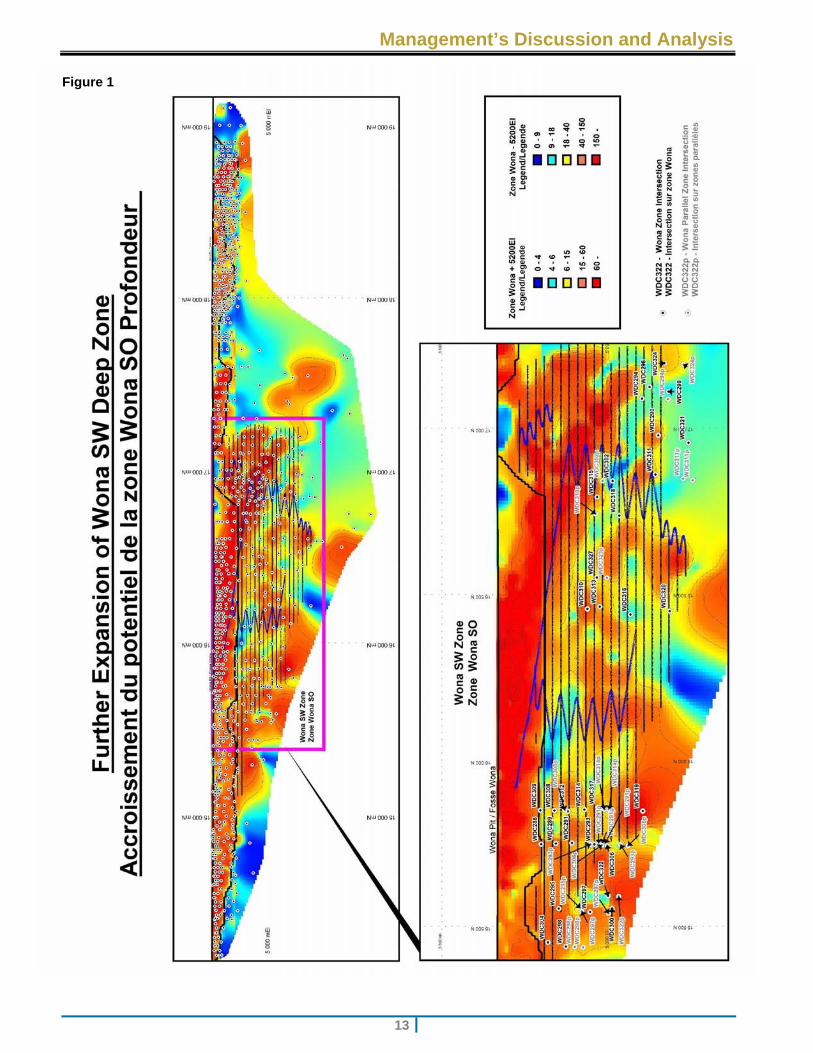
From the ongoing exploration and in-fill drilling program on the Wona SW zone, located immediately southwest and parallel to the Wona Deep zone, core drilling results added underground depth potential revealing wide and high-grade mineralization. Results with values including WDC319, which returned 4.07 g/t Au (4.33 g/t Au uncut) over 43 meters, extend the mineralization at-depth and suggest a mineralized plunge similar to the central portion of the Wona Main zone.
Results from Wona’s Parallel zones show interesting values and thickness that suggest important swelling as confirmed by hole WDC322, which returned 4.43 g/t Au (8.63 g/t Au uncut) over 25 meters (Figure 1).
The last 34,659 meters of core drilling (up to WDC421) have been completed on the Wona and Wona SW zones with the available results to date presented below. All assays remain pending for holes WDC328 to WDC421.
Wona SW Zone Results
DDH No.*** Zone Section (N) From To Au* / Length**
WDC288 Wona SW 15750 164.0 172.0 3.30 g/t / 8.0 m
WDC289 Wona SW 15750 199.0 217.0 3.16 g/t / 18.0 m
(4.28 g/t uncut)
Including 199.7 204.0 6.90 g/t / 4.3 m
(11.60 g/t uncut)
WDC290 Wona 17000 555.0 569.0 3.51 g/t / 14.0 m
WDC291 Wona SW 15750 243.0 255.0 2.78 g/t / 12.0 m
WDC293 Wona SW 15750 329.0 336.0 3.08 g/t / 7.0 m
WDC294 Wona 17100 502.0 506.0 2.95 g/t / 4.0 m
WDC295 Wona SW 15550 209.0 234.0 2.86 g/t / 25.0 m
Including 222.0 230.0 4.00 g/t / 8.0 m
WDC296 Wona 17150 533.7 536.0 5.05 g/t / 2.3 m
WDC297 Wona SW 15550 309.0 327.0 3.82 g/t / 18.0 m
Including 319.0 327.0 5.43 g/t / 8.0 m
WDC298 Wona SW 15450 253.0 272.0 2.36 g/t / 19.0 m
Including 264.0 272.0 3.27 g/t / 8.0 m
WDC299 Wona 17150 581.0 585.0 1.10 g/t / 4.0 m
WDC300 Wona SW 15550 388.0 396.0 3.41 g/t / 8.0 m
(4.36 g/t uncut)
WDC302 Wona 16850 389.3 391.3 3.43 g/t / 2.0 m
WDC304 Wona SW 15450 185.0 208.0 2.56 g/t / 23.0 m
Including 196.0 204.0 3.95 g/t / 8.0 m
WDC306 Wona SW 15750 373.0 391.0 2.11 g/t / 18.0 m
Including 388.0 391.0 5.02 g/t / 3.0 m
WDC308 Wona SW 15850 203.0 213.0 2.68 g/t / 10.0 m
Including 209.0 213.0 4.25 g/t / 4.0 m
WDC309 Wona SW 15850 160.0 168.0 1.76 g/t / 8.0 m
WDC310 Wona SW 16450 302.5 321.0 4.64 g/t / 18.5 m
(4.94 g/t uncut)
Including 303.5 310.0 6.03 g/t / 6.5 m
(6.89 g/t uncut) * All individual samples are cut at 15 g/t as per Wona Deposit procedures. ** All lengths are measured along the hole axis; additional information is required to determine true widths. *** WDC301, WDC303 and WDC305 have not been drilled on the Wona - Kona zone, and WDC292 and WDC307 were
cancelled due to strong deviation.
Management’s Discussion and Analysis
9
3. Exploration Programs (continued)
Burkina Faso (continued)
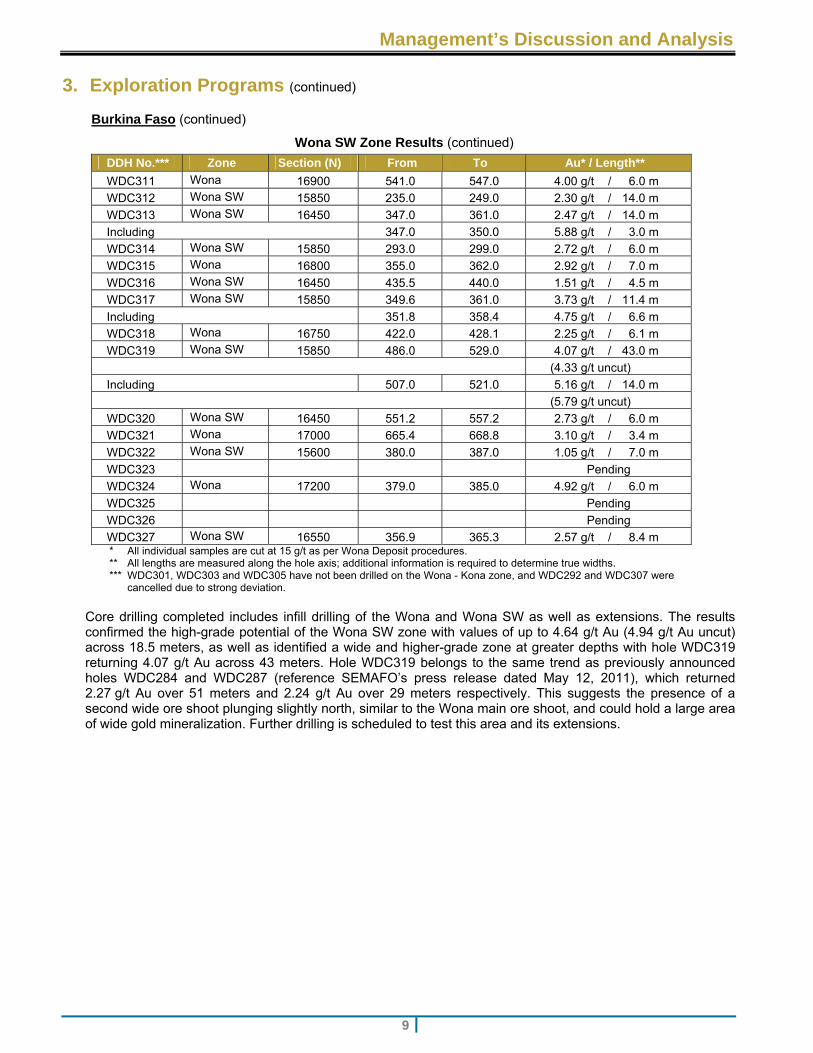
Wona SW Zone Results (continued)
DDH No.*** Zone Section (N) From To Au* / Length**
WDC311 Wona 16900 541.0 547.0 4.00 g/t / 6.0 m
WDC312 Wona SW 15850 235.0 249.0 2.30 g/t / 14.0 m
WDC313 Wona SW 16450 347.0 361.0 2.47 g/t / 14.0 m
Including 347.0 350.0 5.88 g/t / 3.0 m
WDC314 Wona SW 15850 293.0 299.0 2.72 g/t / 6.0 m
WDC315 Wona 16800 355.0 362.0 2.92 g/t / 7.0 m
WDC316 Wona SW 16450 435.5 440.0 1.51 g/t / 4.5 m
WDC317 Wona SW 15850 349.6 361.0 3.73 g/t / 11.4 m
Including 351.8 358.4 4.75 g/t / 6.6 m
WDC318 Wona 16750 422.0 428.1 2.25 g/t / 6.1 m
WDC319 Wona SW 15850 486.0 529.0 4.07 g/t / 43.0 m
(4.33 g/t uncut)
Including 507.0 521.0 5.16 g/t / 14.0 m
(5.79 g/t uncut)
WDC320 Wona SW 16450 551.2 557.2 2.73 g/t / 6.0 m
WDC321 Wona 17000 665.4 668.8 3.10 g/t / 3.4 m
WDC322 Wona SW 15600 380.0 387.0 1.05 g/t / 7.0 m
WDC323 Pending
WDC324 Wona 17200 379.0 385.0 4.92 g/t / 6.0 m
WDC325 Pending
WDC326 Pending
WDC327 Wona SW 16550 356.9 365.3 2.57 g/t / 8.4 m * All individual samples are cut at 15 g/t as per Wona Deposit procedures. ** All lengths are measured along the hole axis; additional information is required to determine true widths. *** WDC301, WDC303 and WDC305 have not been drilled on the Wona - Kona zone, and WDC292 and WDC307 were
cancelled due to strong deviation.
Core drilling completed includes infill drilling of the Wona and Wona SW as well as extensions. The results confirmed the high-grade potential of the Wona SW zone with values of up to 4.64 g/t Au (4.94 g/t Au uncut) across 18.5 meters, as well as identified a wide and higher-grade zone at greater depths with hole WDC319 returning 4.07 g/t Au across 43 meters. Hole WDC319 belongs to the same trend as previously announced holes WDC284 and WDC287 (reference SEMAFO’s press release dated May 12, 2011), which returned 2.27 g/t Au over 51 meters and 2.24 g/t Au over 29 meters respectively. This suggests the presence of a second wide ore shoot plunging slightly north, similar to the Wona main ore shoot, and could hold a large area of wide gold mineralization. Further drilling is scheduled to test this area and its extensions.
Management’s Discussion and Analysis
10
3. Exploration Programs (continued)
Burkina Faso (continued)
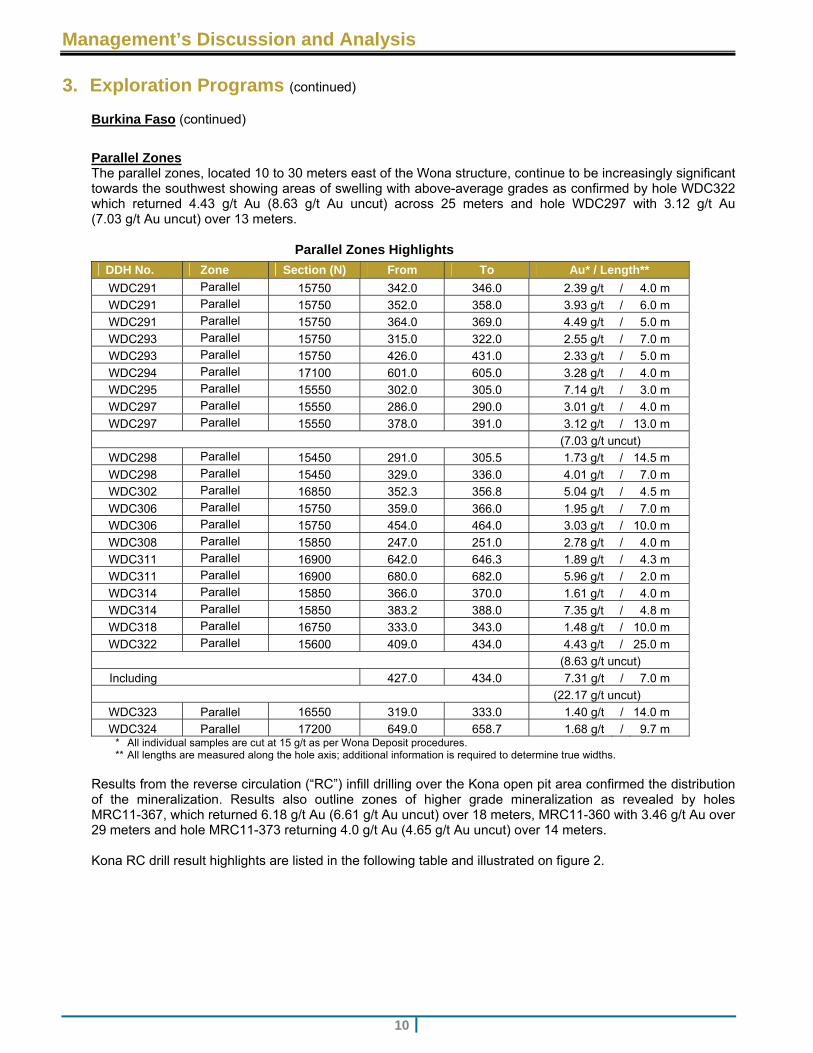
Parallel Zones The parallel zones, located 10 to 30 meters east of the Wona structure, continue to be increasingly significant towards the southwest showing areas of swelling with above-average grades as confirmed by hole WDC322 which returned 4.43 g/t Au (8.63 g/t Au uncut) across 25 meters and hole WDC297 with 3.12 g/t Au (7.03 g/t Au uncut) over 13 meters.
Parallel Zones Highlights
DDH No. Zone Section (N) From To Au* / Length**
WDC291 Parallel 15750 342.0 346.0 2.39 g/t / 4.0 m
WDC291 Parallel 15750 352.0 358.0 3.93 g/t / 6.0 m
WDC291 Parallel 15750 364.0 369.0 4.49 g/t / 5.0 m
WDC293 Parallel 15750 315.0 322.0 2.55 g/t / 7.0 m
WDC293 Parallel 15750 426.0 431.0 2.33 g/t / 5.0 m
WDC294 Parallel 17100 601.0 605.0 3.28 g/t / 4.0 m
WDC295 Parallel 15550 302.0 305.0 7.14 g/t / 3.0 m
WDC297 Parallel 15550 286.0 290.0 3.01 g/t / 4.0 m
WDC297 Parallel 15550 378.0 391.0 3.12 g/t / 13.0 m
(7.03 g/t uncut)
WDC298 Parallel 15450 291.0 305.5 1.73 g/t / 14.5 m
WDC298 Parallel 15450 329.0 336.0 4.01 g/t / 7.0 m
WDC302 Parallel 16850 352.3 356.8 5.04 g/t / 4.5 m
WDC306 Parallel 15750 359.0 366.0 1.95 g/t / 7.0 m
WDC306 Parallel 15750 454.0 464.0 3.03 g/t / 10.0 m
WDC308 Parallel 15850 247.0 251.0 2.78 g/t / 4.0 m
WDC311 Parallel 16900 642.0 646.3 1.89 g/t / 4.3 m
WDC311 Parallel 16900 680.0 682.0 5.96 g/t / 2.0 m
WDC314 Parallel 15850 366.0 370.0 1.61 g/t / 4.0 m
WDC314 Parallel 15850 383.2 388.0 7.35 g/t / 4.8 m
WDC318 Parallel 16750 333.0 343.0 1.48 g/t / 10.0 m
WDC322 Parallel 15600 409.0 434.0 4.43 g/t / 25.0 m
(8.63 g/t uncut)
Including 427.0 434.0 7.31 g/t / 7.0 m
(22.17 g/t uncut)
WDC323 Parallel 16550 319.0 333.0 1.40 g/t / 14.0 m
WDC324 Parallel 17200 649.0 658.7 1.68 g/t / 9.7 m * All individual samples are cut at 15 g/t as per Wona Deposit procedures. ** All lengths are measured along the hole axis; additional information is required to determine true widths.
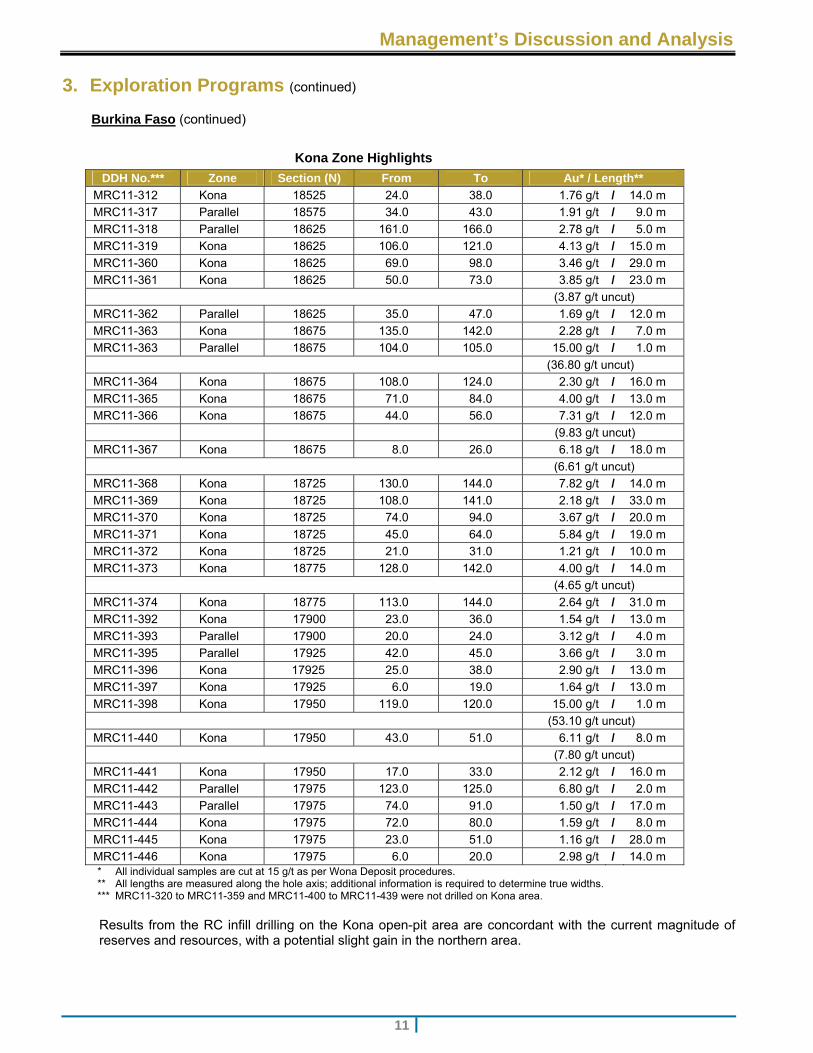
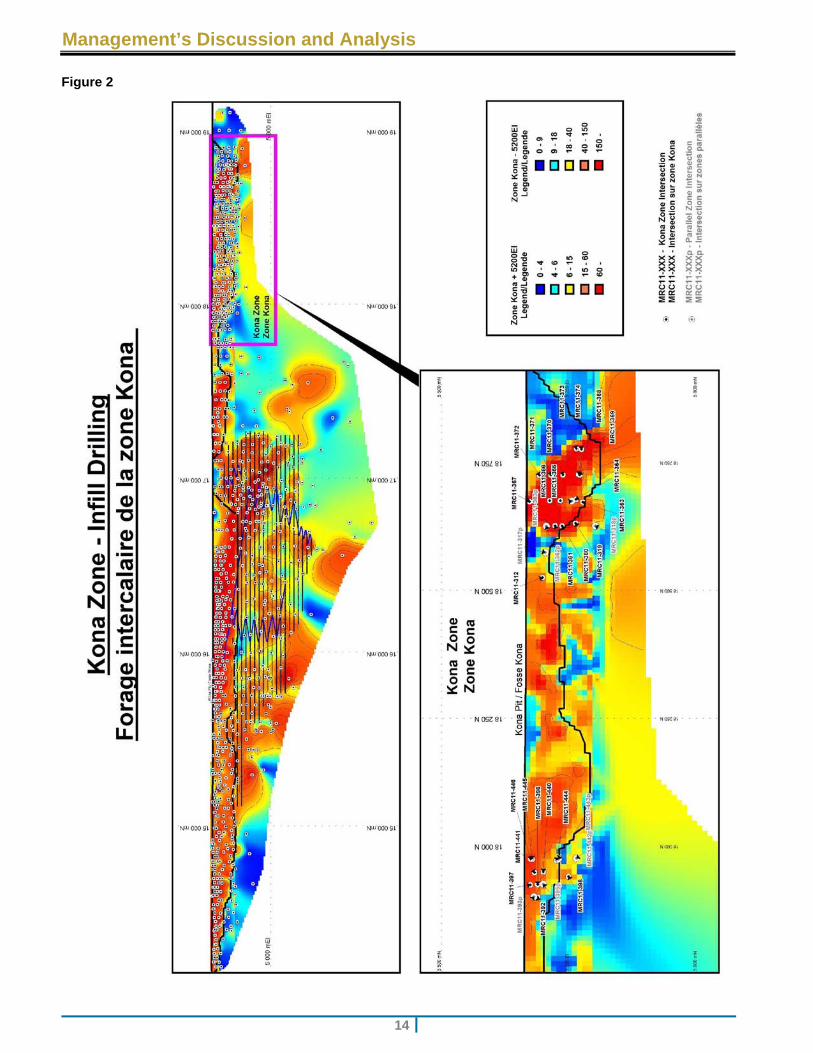
Results from the reverse circulation (“RC”) infill drilling over the Kona open pit area confirmed the distribution of the mineralization. Results also outline zones of higher grade mineralization as revealed by holes MRC11-367, which returned 6.18 g/t Au (6.61 g/t Au uncut) over 18 meters, MRC11-360 with 3.46 g/t Au over 29 meters and hole MRC11-373 returning 4.0 g/t Au (4.65 g/t Au uncut) over 14 meters. Kona RC drill result highlights are listed in the following table and illustrated on figure 2.
Management’s Discussion and Analysis
11
3. Exploration Programs (continued)
Burkina Faso (continued)
Kona Zone Highlights
DDH No.*** Zone Section (N) From To Au* / Length**
MRC11-312 Kona 18525 24.0 38.0 1.76 g/t / 14.0 m
MRC11-317 Parallel 18575 34.0 43.0 1.91 g/t / 9.0 m
MRC11-318 Parallel 18625 161.0 166.0 2.78 g/t / 5.0 m
MRC11-319 Kona 18625 106.0 121.0 4.13 g/t / 15.0 m
MRC11-360 Kona 18625 69.0 98.0 3.46 g/t / 29.0 m
MRC11-361 Kona 18625 50.0 73.0 3.85 g/t / 23.0 m
(3.87 g/t uncut)
MRC11-362 Parallel 18625 35.0 47.0 1.69 g/t / 12.0 m
MRC11-363 Kona 18675 135.0 142.0 2.28 g/t / 7.0 m
MRC11-363 Parallel 18675 104.0 105.0 15.00 g/t / 1.0 m
(36.80 g/t uncut)
MRC11-364 Kona 18675 108.0 124.0 2.30 g/t / 16.0 m
MRC11-365 Kona 18675 71.0 84.0 4.00 g/t / 13.0 m
MRC11-366 Kona 18675 44.0 56.0 7.31 g/t / 12.0 m
(9.83 g/t uncut)
MRC11-367 Kona 18675 8.0 26.0 6.18 g/t / 18.0 m
(6.61 g/t uncut)
MRC11-368 Kona 18725 130.0 144.0 7.82 g/t / 14.0 m
MRC11-369 Kona 18725 108.0 141.0 2.18 g/t / 33.0 m
MRC11-370 Kona 18725 74.0 94.0 3.67 g/t / 20.0 m
MRC11-371 Kona 18725 45.0 64.0 5.84 g/t / 19.0 m
MRC11-372 Kona 18725 21.0 31.0 1.21 g/t / 10.0 m
MRC11-373 Kona 18775 128.0 142.0 4.00 g/t / 14.0 m
(4.65 g/t uncut)
MRC11-374 Kona 18775 113.0 144.0 2.64 g/t / 31.0 m
MRC11-392 Kona 17900 23.0 36.0 1.54 g/t / 13.0 m
MRC11-393 Parallel 17900 20.0 24.0 3.12 g/t / 4.0 m
MRC11-395 Parallel 17925 42.0 45.0 3.66 g/t / 3.0 m
MRC11-396 Kona 17925 25.0 38.0 2.90 g/t / 13.0 m
MRC11-397 Kona 17925 6.0 19.0 1.64 g/t / 13.0 m
MRC11-398 Kona 17950 119.0 120.0 15.00 g/t / 1.0 m
(53.10 g/t uncut)
MRC11-440 Kona 17950 43.0 51.0 6.11 g/t / 8.0 m
(7.80 g/t uncut)
MRC11-441 Kona 17950 17.0 33.0 2.12 g/t / 16.0 m
MRC11-442 Parallel 17975 123.0 125.0 6.80 g/t / 2.0 m
MRC11-443 Parallel 17975 74.0 91.0 1.50 g/t / 17.0 m
MRC11-444 Kona 17975 72.0 80.0 1.59 g/t / 8.0 m
MRC11-445 Kona 17975 23.0 51.0 1.16 g/t / 28.0 m
MRC11-446 Kona 17975 6.0 20.0 2.98 g/t / 14.0 m * All individual samples are cut at 15 g/t as per Wona Deposit procedures. ** All lengths are measured along the hole axis; additional information is required to determine true widths. *** MRC11-320 to MRC11-359 and MRC11-400 to MRC11-439 were not drilled on Kona area.
Results from the RC infill drilling on the Kona open-pit area are concordant with the current magnitude of reserves and resources, with a potential slight gain in the northern area.
Management’s Discussion and Analysis
12
3. Exploration Programs (continued)
Niger
Exploration at the Samira Hill Mine, with a budget of $4.8 million, is focusing primarily on the identification of new oxide deposits. More than 30,000 meters of Air Core (“AC”) and 40,000 meters of RC drilling are planned including:
25,000 meters of RC drilling over the most prospective area around Boulon Jounga open pit, and 8,000 meters of AC over more distal potentials
3,000 meters of RC delineation drilling over Sikia
Various projects around Libiri
Early stage exploration program at Tondé Babangou, Gare Garé and Bouli.
Kiniero
Kiniero’s exploration drilling program recently began and will be continued through 2012 with a budget totalling $4 million, including:
$3 million in mining project development over SGA (Secteur Gobelé A plus Gobelé D) with 16,000 meters of drilling including 4,000 meters of core drilling and 12,000 meters of RC drilling
$900,000 for 10,000 meters of RC drilling over the OBD, OBE sectors as well as a portion of Zone D and Sud JG
$100,000 of soil geochemical surveying and trenching over our Siguiri assets.
Management’s Discussion and Analysis
13
Figure 1
Management’s Discussion and Analysis
14
Figure 2

Management’s Discussion and Analysis
15
4. Consolidated Results and Mining Operations
Three-month periodended September 30
Nine-month periodended September 30
2011 2010 Variation 2011 2010 Variation
Operating Highlights
Gold ounces produced ...................................... 61,500 65,500 (6%) 185,300 199,600 (7%) Gold ounces sold .............................................. 59,600 69,500 (14%) 182,400 198,700 (8%)
(In thousands of dollars, except amounts per ounce, per tonne and per share)
Revenues – Gold sales ..................................... 102,297 86,223 19% 282,062 236,883 19% Mining operating expenses (excluding
Government royalties) .................................... 38,555 31,267 23% 110,634 88,793 25% Government royalties ........................................ 5,270 3,236 63% 13,920 9,030 54% Operating income .............................................. 40,756 37,949 7% 106,716 92,585 15% Income tax expense .......................................... 9,006 6,767 33% 19,358 17,387 11% Net income ........................................................ 31,320 32,392 (3%) 84,563 75,059 13% Attributable to:
Equity shareholders of the Corporation .......... 29,682 32,102 (8%) 78,482 73,812 6% Non-controlling interests ................................ 1,638 290 465% 6,081 1,247 388%
Cash flow from operating activities 1 .................. 43,139 41,776 3% 117,383 108,480 8% Basic net income per share ............................... 0.11 0.12 (8%) 0.29 0.28 4% Diluted net income per share ............................ 0.11 0.12 (8%) 0.28 0.28 – Operating cash flow per share 2 ........................ 0.16 0.15 7% 0.43 0.42 2% Average realized selling price (per ounce) ........ 1,717 1,241 38% 1,546 1,192 30% Cash operating cost (per ounce produced) 3 ..... 637 454 40% 602 445 35% Cash operating cost (per tonne processed) 3 .... 37 34 9% 36 32 13% Total cash cost (per ounce sold) 4 ...................... 733 496 48% 682 492 39% Total cash margin (per ounce sold) 5 ................. 984 745 32% 864 700 23%
1 Cash flow from operating activities excludes changes in non-cash working capital items. 2 Operating cash flow per share is a non-GAAP financial performance measure with no standard definition under IFRS. See the “Non-GAAP
financial performance measures’’ section of this MD&A. 3 Cash operating cost is a non-GAAP financial performance measure with no standard definition under IFRS and is calculated using ounces
produced and tonnes processed. See the “Non-GAAP financial performance measures’’ section of this MD&A. 4 Total cash cost is a non-GAAP financial performance measure with no standard definition under IFRS and represents the mining operating
expenses and Government royalties per ounce sold. 5 Total cash margin is a non-GAAP financial performance measure with no standard definition under IFRS and is calculated using the
average realized selling price and the total cash cost.
Third Quarter 2011 v. Third Quarter 2010
Despite lower volume sold as a result of lower recovered head grade, our gold sales increased by 19% during the three-month period ended September 30, 2011 to $102,297,000 compared to $86,223,000 for the corresponding period in 2010. The improvement is the result of our higher average realized selling price, which remained superior to the average London Gold Fix.
2011 2010
(In dollars per ounce) Q3 Q2 Q1 Q3 Q2 Q1
Average London Gold Fix .............................. 1,702 1,506 1,386 1,227 1,197 1,109
Average realized selling price ........................ 1,717 1,519 1,400 1,241 1,210 1,111
The increase in mining operating expenses during the third quarter of 2011 reflects the higher fuel and reagent costs compared to the same period in 2010. Also, a factor was the incremental throughput of lower grade ore related to our higher processing capacity at the Mana Mine.
Management’s Discussion and Analysis
16
4. Consolidated Results and Mining Operations (continued)
Third Quarter 2011 v. Third Quarter 2010 (continued)
Our record operating income of $40,756,000 for the three-month period ended September 30, 2011, compared to $37,949,000 for the same period last year is due to our higher total cash margin per ounce sold.
Our 2011 third quarter net income slightly decreased by 3% to $31,320,000 as a result of a higher income tax expense reflecting the impact of foreign exchange movements on our foreign non-monetary assets.
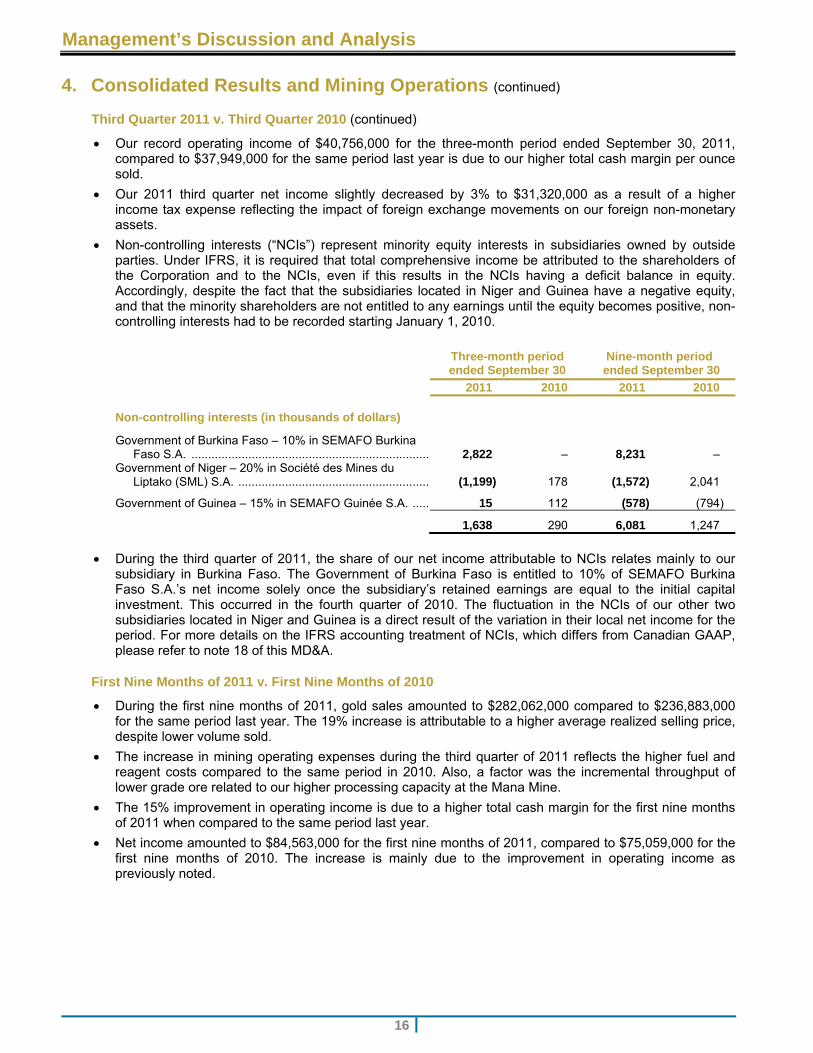
Non-controlling interests (“NCIs”) represent minority equity interests in subsidiaries owned by outside parties. Under IFRS, it is required that total comprehensive income be attributed to the shareholders of the Corporation and to the NCIs, even if this results in the NCIs having a deficit balance in equity. Accordingly, despite the fact that the subsidiaries located in Niger and Guinea have a negative equity, and that the minority shareholders are not entitled to any earnings until the equity becomes positive, non-controlling interests had to be recorded starting January 1, 2010.
Three-month period ended September 30
Nine-month period ended September 30
2011 2010 2011 2010
Non-controlling interests (in thousands of dollars)
Government of Burkina Faso – 10% in SEMAFO Burkina Faso S.A. ....................................................................... 2,822 – 8,231 –
Government of Niger – 20% in Société des Mines du Liptako (SML) S.A. ......................................................... (1,199) 178 (1,572) 2,041
Government of Guinea – 15% in SEMAFO Guinée S.A. ..... 15 112 (578) (794)
1,638 290 6,081 1,247
During the third quarter of 2011, the share of our net income attributable to NCIs relates mainly to our subsidiary in Burkina Faso. The Government of Burkina Faso is entitled to 10% of SEMAFO Burkina Faso S.A.’s net income solely once the subsidiary’s retained earnings are equal to the initial capital investment. This occurred in the fourth quarter of 2010. The fluctuation in the NCIs of our other two subsidiaries located in Niger and Guinea is a direct result of the variation in their local net income for the period. For more details on the IFRS accounting treatment of NCIs, which differs from Canadian GAAP, please refer to note 18 of this MD&A.
First Nine Months of 2011 v. First Nine Months of 2010
During the first nine months of 2011, gold sales amounted to $282,062,000 compared to $236,883,000 for the same period last year. The 19% increase is attributable to a higher average realized selling price, despite lower volume sold.
The increase in mining operating expenses during the third quarter of 2011 reflects the higher fuel and reagent costs compared to the same period in 2010. Also, a factor was the incremental throughput of lower grade ore related to our higher processing capacity at the Mana Mine.
The 15% improvement in operating income is due to a higher total cash margin for the first nine months of 2011 when compared to the same period last year.
Net income amounted to $84,563,000 for the first nine months of 2011, compared to $75,059,000 for the first nine months of 2010. The increase is mainly due to the improvement in operating income as previously noted.
Management’s Discussion and Analysis
17
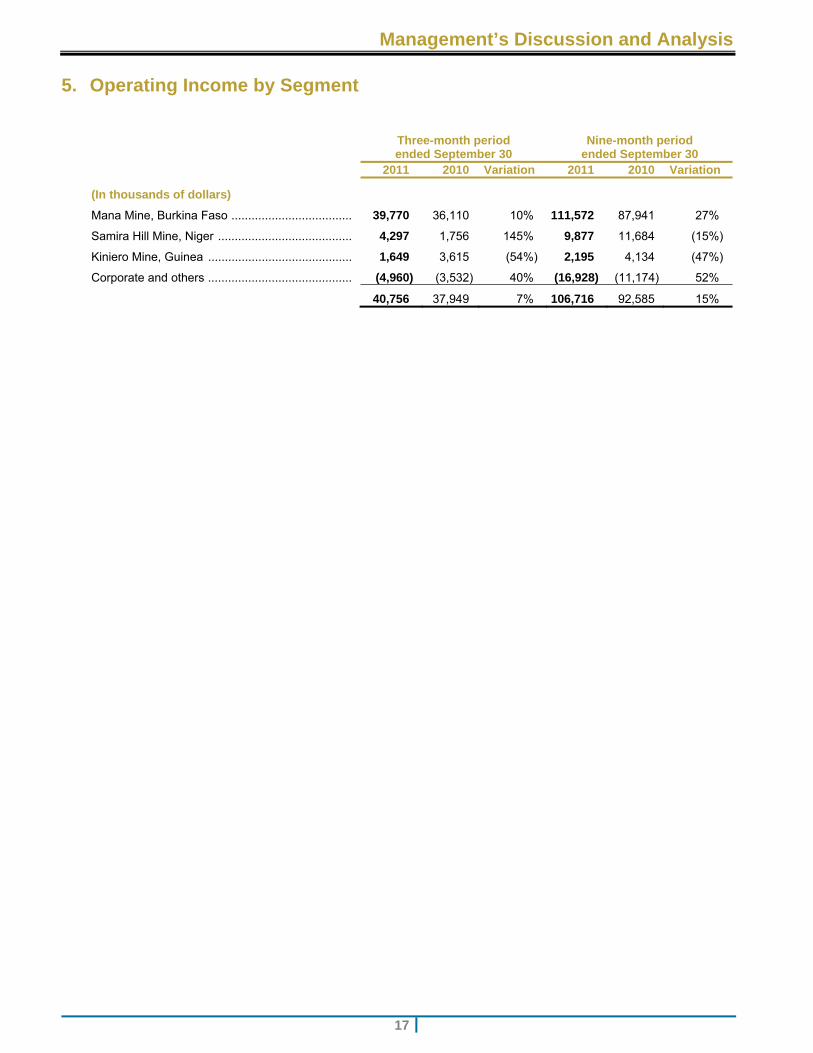
5. Operating Income by Segment
Three-month periodended September 30
Nine-month periodended September 30
2011 2010 Variation 2011 2010 Variation
(In thousands of dollars)
Mana Mine, Burkina Faso .................................... 39,770 36,110 10% 111,572 87,941 27%
Samira Hill Mine, Niger ........................................ 4,297 1,756 145% 9,877 11,684 (15%)
Kiniero Mine, Guinea ........................................... 1,649 3,615 (54%) 2,195 4,134 (47%)
Corporate and others ........................................... (4,960) (3,532) 40% (16,928) (11,174) 52%
40,756 37,949 7% 106,716 92,585 15%
Management’s Discussion and Analysis
18
6. Mining Operations
Mana, Burkina Faso
Three-month periodended September 30
Nine-month periodended September 30
2011 2010 Variation 2011 2010 Variation
Operating Data
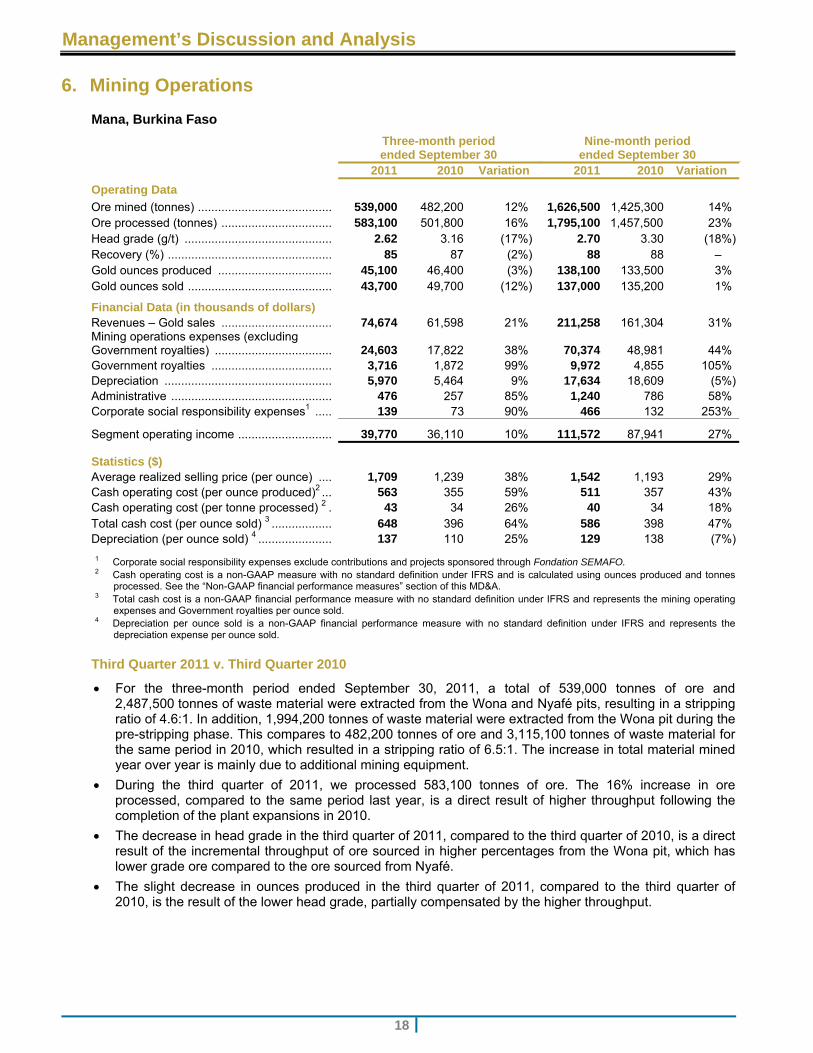
Ore mined (tonnes) ........................................ 539,000 482,200 12% 1,626,500 1,425,300 14% Ore processed (tonnes) ................................. 583,100 501,800 16% 1,795,100 1,457,500 23% Head grade (g/t) ............................................ 2.62 3.16 (17%) 2.70 3.30 (18%)Recovery (%) ................................................. 85 87 (2%) 88 88 – Gold ounces produced .................................. 45,100 46,400 (3%) 138,100 133,500 3% Gold ounces sold ........................................... 43,700 49,700 (12%) 137,000 135,200 1%
Financial Data (in thousands of dollars) Revenues – Gold sales ................................. 74,674 61,598 21% 211,258 161,304 31% Mining operations expenses (excluding Government royalties) ................................... 24,603 17,822 38% 70,374 48,981 44% Government royalties .................................... 3,716 1,872 99% 9,972 4,855 105% Depreciation .................................................. 5,970 5,464 9% 17,634 18,609 (5%)Administrative ................................................ 476 257 85% 1,240 786 58% Corporate social responsibility expenses1 ..... 139 73 90% 466 132 253%
Segment operating income ............................ 39,770 36,110 10% 111,572 87,941 27%
Statistics ($) Average realized selling price (per ounce) .... 1,709 1,239 38% 1,542 1,193 29% Cash operating cost (per ounce produced)2 ... 563 355 59% 511 357 43% Cash operating cost (per tonne processed) 2 . 43 34 26% 40 34 18% Total cash cost (per ounce sold) 3 .................. 648 396 64% 586 398 47% Depreciation (per ounce sold) 4 ...................... 137 110 25% 129 138 (7%)
1 Corporate social responsibility expenses exclude contributions and projects sponsored through Fondation SEMAFO. 2 Cash operating cost is a non-GAAP measure with no standard definition under IFRS and is calculated using ounces produced and tonnes
processed. See the “Non-GAAP financial performance measures” section of this MD&A. 3 Total cash cost is a non-GAAP financial performance measure with no standard definition under IFRS and represents the mining operating
expenses and Government royalties per ounce sold. 4 Depreciation per ounce sold is a non-GAAP financial performance measure with no standard definition under IFRS and represents the
depreciation expense per ounce sold.
Third Quarter 2011 v. Third Quarter 2010
For the three-month period ended September 30, 2011, a total of 539,000 tonnes of ore and 2,487,500 tonnes of waste material were extracted from the Wona and Nyafé pits, resulting in a stripping ratio of 4.6:1. In addition, 1,994,200 tonnes of waste material were extracted from the Wona pit during the pre-stripping phase. This compares to 482,200 tonnes of ore and 3,115,100 tonnes of waste material for the same period in 2010, which resulted in a stripping ratio of 6.5:1. The increase in total material mined year over year is mainly due to additional mining equipment.
During the third quarter of 2011, we processed 583,100 tonnes of ore. The 16% increase in ore processed, compared to the same period last year, is a direct result of higher throughput following the completion of the plant expansions in 2010.
The decrease in head grade in the third quarter of 2011, compared to the third quarter of 2010, is a direct result of the incremental throughput of ore sourced in higher percentages from the Wona pit, which has lower grade ore compared to the ore sourced from Nyafé.
The slight decrease in ounces produced in the third quarter of 2011, compared to the third quarter of 2010, is the result of the lower head grade, partially compensated by the higher throughput.
Management’s Discussion and Analysis
19
6. Mining Operations (continued)
Mana, Burkina Faso (continued)
Third Quarter 2011 v. Third Quarter 2010 (continued)
Our cash operating cost per tonne processed increased to $43 in the third quarter of 2011 compared to $34 in the third quarter of 2010. This variation is mainly due to the increased cost of fuel and reagents, and the need for supplementary drilling and blasting in 2011 compared to 2010. Our cash operating cost per ounce produced increased as a result of higher cash operating cost per tonne processed and lower head grade.
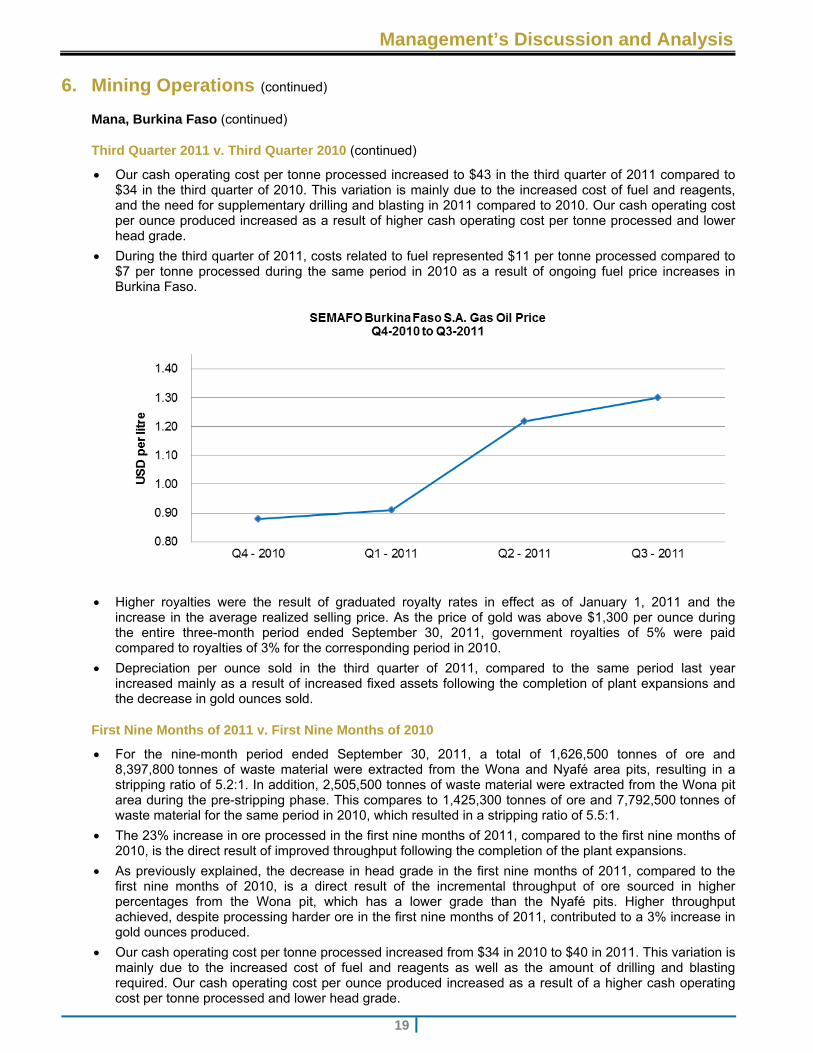
During the third quarter of 2011, costs related to fuel represented $11 per tonne processed compared to $7 per tonne processed during the same period in 2010 as a result of ongoing fuel price increases in Burkina Faso.
Higher royalties were the result of graduated royalty rates in effect as of January 1, 2011 and the increase in the average realized selling price. As the price of gold was above $1,300 per ounce during the entire three-month period ended September 30, 2011, government royalties of 5% were paid compared to royalties of 3% for the corresponding period in 2010.
Depreciation per ounce sold in the third quarter of 2011, compared to the same period last year increased mainly as a result of increased fixed assets following the completion of plant expansions and the decrease in gold ounces sold.
First Nine Months of 2011 v. First Nine Months of 2010
For the nine-month period ended September 30, 2011, a total of 1,626,500 tonnes of ore and 8,397,800 tonnes of waste material were extracted from the Wona and Nyafé area pits, resulting in a stripping ratio of 5.2:1. In addition, 2,505,500 tonnes of waste material were extracted from the Wona pit area during the pre-stripping phase. This compares to 1,425,300 tonnes of ore and 7,792,500 tonnes of waste material for the same period in 2010, which resulted in a stripping ratio of 5.5:1.
The 23% increase in ore processed in the first nine months of 2011, compared to the first nine months of 2010, is the direct result of improved throughput following the completion of the plant expansions.
As previously explained, the decrease in head grade in the first nine months of 2011, compared to the first nine months of 2010, is a direct result of the incremental throughput of ore sourced in higher percentages from the Wona pit, which has a lower grade than the Nyafé pits. Higher throughput achieved, despite processing harder ore in the first nine months of 2011, contributed to a 3% increase in gold ounces produced.
Our cash operating cost per tonne processed increased from $34 in 2010 to $40 in 2011. This variation is mainly due to the increased cost of fuel and reagents as well as the amount of drilling and blasting required. Our cash operating cost per ounce produced increased as a result of a higher cash operating cost per tonne processed and lower head grade.
Management’s Discussion and Analysis
20
6. Mining Operations (continued)
Mana, Burkina Faso (continued)
First Nine Months of 2011 v. First Nine Months of 2010 (continued)
During the first nine months of 2011, costs related to fuel represented $11 per tonne processed compared to $7 per tonne processed during the same period in 2010 as a result of ongoing fuel price increases in Burkina Faso.
The corporate social responsibility expenses relate mainly to SEMAFO Energy whose purpose is to increase electricity generation in our host countries.
Management’s Discussion and Analysis
21
6. Mining Operations (continued)
Mana, Burkina Faso (continued)
Project Updates
Plant Expansion - Phase IV
Plant capacity is expected to attain up to 7,200 tonnes per day (“tpd”) in bedrock and up to 8,000 tpd in blended ore.
Completion of Phase IV will increase throughput by 1,200 tpd, representing an additional 26,000 to 30,000 ounces of gold annually when compared to current plant capacity. Initially scheduled to be completed at year-end 2011, complete commissioning is rescheduled for early in the second quarter of 2012 due to supplier delays.
Budget for this fourth phase of plant expansion is $25 million, including $18 million for enhancements to the plant and $7 million for additional mining equipment.
As of September 30, 2011, $6.2 million were still committed for enhancements to the plant, while the $7 million additional mining equipment initially committed has been fully paid and is already on site.
Payback period is estimated at less than 16 months.
The primary modifications to the processing plant include:
Addition of a pebble crusher
Utilization of the third ball mill, previously used as back-up
Addition of two CIL tanks
Addition of a thickener
Additional gensets
Critical spares
Some equipment capacity upgrades.
New Facility - Phase V
In September, we announced plans to increase the processing capacity by 6,000 tpd at our Mana project in Burkina Faso. This new facility is aimed at increasing overall processing capacity to 14,000 tpd, representing as much as an additional 120,000 gold ounces annually and potentially bringing Mana’s total production to more than 300,000 ounces per annum. This phase of expansion is put forward because of the positive drill results received from the Fofina, Fobiri and Yaho zones. Currently, this new facility is planned to be located near the Fofina-Fobiri area in order to prepare the ore for final processing at the Mana plant.
Capital expenditures for this expansion are estimated at $100 to $125 million and are expected to be funded through SEMAFO’s cash flow. The anticipated payback period is less than one year.
As part of the plant expansion, we also plan to build a water pipeline, for which an engineering analysis is underway. The year-round accessibility will safeguard adequate water supply levels at the mill at all times and is scheduled for commissioning in the second quarter of 2012.
This phase of expansion is scheduled to begin in early 2012 and is expected to be completed during the second half of 2013.
Management’s Discussion and Analysis
22
6. Mining Operations (continued)
Mana, Burkina Faso (continued)
Wona Deep Development
At the end of the second quarter of 2011, we green-lighted the development of the underground project following the positive results of the Mana underground feasibility study, indicating a 49% internal rate of return based on a $1,400 gold price. SEMAFO’s underground technical team began engineering and optimization activities in July 2011. Additionally, surface drilling continues in the SW zone, the results of which continue to demonstrate opportunities to further increase underground reserves from those reported in the underground feasibility study.
Recent underground development activities include:
Appointment of underground technical team
Signature of an agreement with the mining contractor Dumas Contracting Ltd (“Dumas”). The agreement includes the scope of work to be provided by Dumas in the interim period leading to the execution of a definitive agreement expected to be signed in the coming months. To date approximately $4 million were paid to Dumas including a deposit to secure mining equipment. Equipment for all raise development will be on site by year end to commence work in January 2012. All development and production equipment are expected to be on site in the second quarter of 2012
Commencement of the recruitment process of national employees by Dumas
Continued engineering optimization of the underground project especially on the development and general approach to the ore bodies
Elaboration of long hole drilling plans and combinations for the various types of stopes to estimate quantities, drilling time in order to start block sequencing and mine planning
Detailed planning of the first two years of development on a monthly basis
Completion of detailed engineering for elaboration of plans for the mine dry, administration office, mechanical shop and warehouse.
Commencement of the construction of all surface infrastructures and services to support underground operations. Completion is expected by the end of the first quarter of 2012.
Completion of the camp expansion to accommodate the underground teams
Test hole drilling at the portal and ventilation raise to certify rock elevation and quality (RQD)
Procurement of more than $10 million of general equipment and mining materials to date, including: gensets, compressors, surface ventilators, underground support material, ventilation piping, mine rescue equipment, dewatering pumps, and others.
National Power Grid
In October, we announced an agreement with National Electricity Company Sonabel for the construction of a 73-kilometer high-voltage transmission line to deliver power to our Mana Mine.
The 26-megawatt transmission line will be connected directly to the national power grid and should provide sufficient energy to power the mine.
Under this new power delivery agreement and considering the actual economy, we would be paying $0.18 per kilowatt-hour. Based on current fuel and consumables costs, and compared to our current cost of $0.31 per kilowatt-hour, this could represent potential savings of approximately $3 per tonne processed and up to $40 per ounce of gold produced.
The total cost of the project is estimated at $19 million for Sonabel. We will advance $9.5 million to this project. This amount is reimbursable to SEMAFO by Sonabel over an eight-year period following commissioning, which is scheduled for the second half of 2013.
Management’s Discussion and Analysis
23
6. Mining Operations (continued)
Samira Hill, Niger
Three-month periodended September 30
Nine-month periodended September 30
2011 2010 Variation 2011 2010 Variation
Operating Data
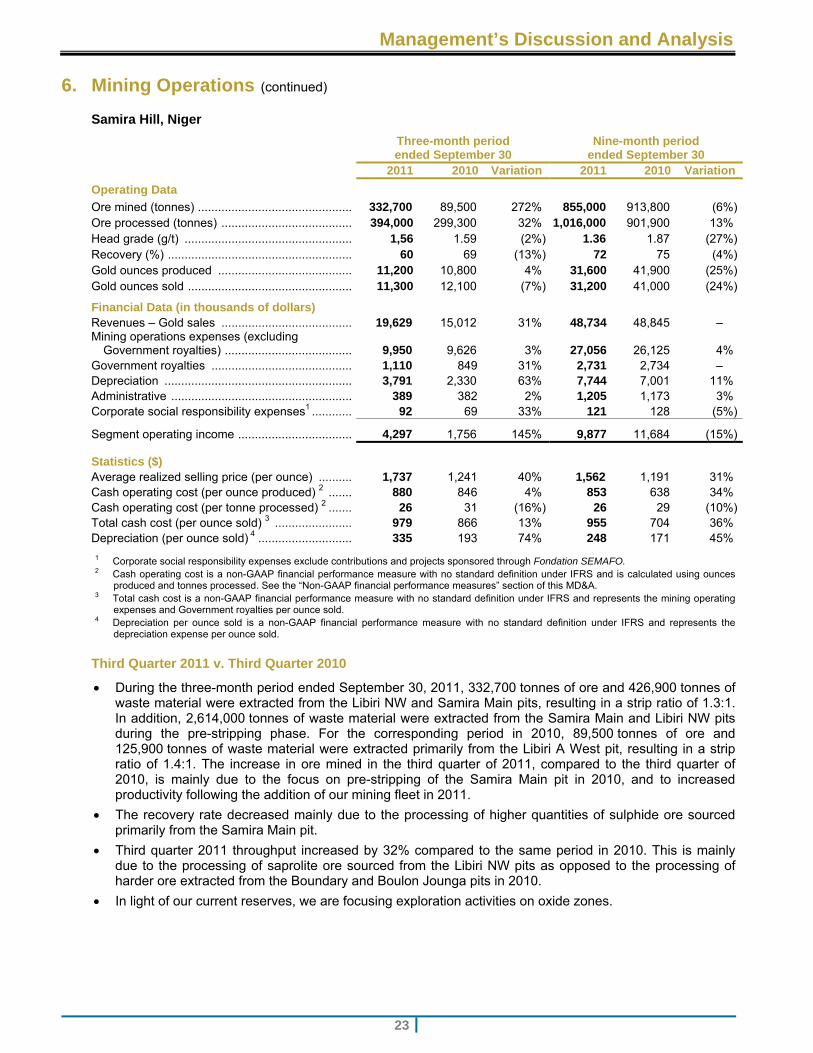
Ore mined (tonnes) .............................................. 332,700 89,500 272% 855,000 913,800 (6%)Ore processed (tonnes) ....................................... 394,000 299,300 32% 1,016,000 901,900 13% Head grade (g/t) .................................................. 1,56 1.59 (2%) 1.36 1.87 (27%)Recovery (%) ....................................................... 60 69 (13%) 72 75 (4%)Gold ounces produced ........................................ 11,200 10,800 4% 31,600 41,900 (25%)Gold ounces sold ................................................. 11,300 12,100 (7%) 31,200 41,000 (24%)
Financial Data (in thousands of dollars) Revenues – Gold sales ....................................... 19,629 15,012 31% 48,734 48,845 – Mining operations expenses (excluding
Government royalties) ...................................... 9,950 9,626 3% 27,056 26,125 4% Government royalties .......................................... 1,110 849 31% 2,731 2,734 – Depreciation ........................................................ 3,791 2,330 63% 7,744 7,001 11% Administrative ...................................................... 389 382 2% 1,205 1,173 3% Corporate social responsibility expenses1 ............ 92 69 33% 121 128 (5%)
Segment operating income .................................. 4,297 1,756 145% 9,877 11,684 (15%)
Statistics ($) Average realized selling price (per ounce) .......... 1,737 1,241 40% 1,562 1,191 31% Cash operating cost (per ounce produced) 2 ....... 880 846 4% 853 638 34% Cash operating cost (per tonne processed) 2 ....... 26 31 (16%) 26 29 (10%)Total cash cost (per ounce sold) 3 ....................... 979 866 13% 955 704 36% Depreciation (per ounce sold) 4 ............................ 335 193 74% 248 171 45%
1 Corporate social responsibility expenses exclude contributions and projects sponsored through Fondation SEMAFO. 2 Cash operating cost is a non-GAAP financial performance measure with no standard definition under IFRS and is calculated using ounces
produced and tonnes processed. See the “Non-GAAP financial performance measures” section of this MD&A. 3 Total cash cost is a non-GAAP financial performance measure with no standard definition under IFRS and represents the mining operating
expenses and Government royalties per ounce sold. 4 Depreciation per ounce sold is a non-GAAP financial performance measure with no standard definition under IFRS and represents the
depreciation expense per ounce sold.
Third Quarter 2011 v. Third Quarter 2010
During the three-month period ended September 30, 2011, 332,700 tonnes of ore and 426,900 tonnes of waste material were extracted from the Libiri NW and Samira Main pits, resulting in a strip ratio of 1.3:1. In addition, 2,614,000 tonnes of waste material were extracted from the Samira Main and Libiri NW pits during the pre-stripping phase. For the corresponding period in 2010, 89,500 tonnes of ore and 125,900 tonnes of waste material were extracted primarily from the Libiri A West pit, resulting in a strip ratio of 1.4:1. The increase in ore mined in the third quarter of 2011, compared to the third quarter of 2010, is mainly due to the focus on pre-stripping of the Samira Main pit in 2010, and to increased productivity following the addition of our mining fleet in 2011.
The recovery rate decreased mainly due to the processing of higher quantities of sulphide ore sourced primarily from the Samira Main pit.
Third quarter 2011 throughput increased by 32% compared to the same period in 2010. This is mainly due to the processing of saprolite ore sourced from the Libiri NW pits as opposed to the processing of harder ore extracted from the Boundary and Boulon Jounga pits in 2010.
In light of our current reserves, we are focusing exploration activities on oxide zones.
Management’s Discussion and Analysis
24
6. Mining Operations (continued)
Samira Hill, Niger (continued)
Third Quarter 2011 v. Third Quarter 2010 (continued)
Gold ounces produced increased by 4% year over year as a result of higher throughput.
The 16% improvement in cash operating cost per tonne processed during the third quarter of 2011, compared to the third quarter of 2010, related to a 32% increase in ore processed and lower transportation costs. The cash operating cost per ounce produced increased slightly as a result of lower recovered head grade.
The depreciation per once sold increased in the third quarter of 2011, compared to the third quarter of 2010, as a result of the depreciation of Samira Main and Libiri NW pit’s stripping costs as we began extracting ore in this area.
First Nine Months of 2011 v. First Nine Months of 2010
During the first nine months of 2011, 855,000 tonnes of ore and 2,119,200 tonnes of waste material were extracted from the Libiri NW and Samira Main pits, resulting in a stripping ratio of 2.5:1. In addition, 4,859,700 tonnes of waste material were extracted from the Samira Main and Libiri NW pits during the pre-stripping phase. For the corresponding period in 2010, 913,800 tonnes of ore and 1,612,200 tonnes of waste material were extracted from the Boundary and Boulon Jounga pits, for a stripping ratio of 1.8:1. In addition, for the first nine months of 2011, 2,908,900 tonnes of waste material were extracted from the Samira Main and Libiri NW pits during the pre-stripping phase during the first nine months of 2010.
Throughput for the nine-month period ended September 30, 2011 increased by 13%, compared to the same period in 2010. This is mainly due to the processing of saprolite ore from the Libiri NW pits as opposed to the processing of harder ore extracted from the Boundary and Boulon Jounga pits.
The decrease in head grade in the first nine-month period of 2011, compared to the same period last year, is due to the processing of lower grade ore sourced from the Libiri NW pits and from stockpiles in 2011, compared to the processing of higher grade ore primarily sourced from the Boulon Jounga pit during the same period in 2010.
Recovery slightly decreased over the first nine months of 2011 due to higher quantities of sulphide ore processed, compared to the same period in 2010.
The decrease in gold ounces produced in the first nine months of 2011, compared to the same period in 2010, is a direct result of the processing lower grade ore sourced from the Libiri NW pits.
The cash operating cost per tonne processed improved by 10% during the first nine months of 2011, compared to the same period last year, mainly as a result of higher throughput, reduced drilling and blasting effort as well as reduced transportation costs due to ore sourced mainly from the Libiri NW pits, as opposed to Boulon Jounga in 2010. The cash operating cost per ounce produced increased in the first nine-month period of 2011, compared to the same period in 2010, mainly as a result of lower head grade.
Management’s Discussion and Analysis
25
6. Mining Operations (continued)
Kiniero, Guinea
Three-month periodended September 30
Nine-month periodended September 30
2011 2010 Variation 2011 2010 Variation
Operating Data
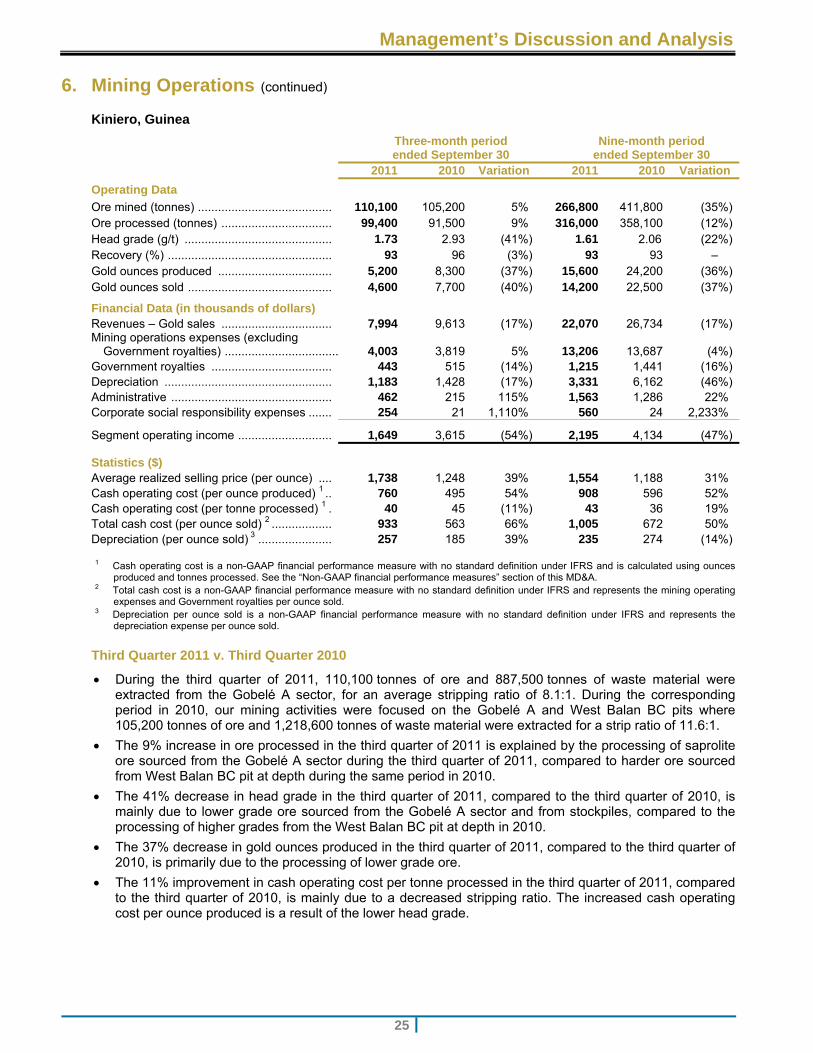
Ore mined (tonnes) ........................................ 110,100 105,200 5% 266,800 411,800 (35%) Ore processed (tonnes) ................................. 99,400 91,500 9% 316,000 358,100 (12%) Head grade (g/t) ............................................ 1.73 2.93 (41%) 1.61 2.06 (22%) Recovery (%) ................................................. 93 96 (3%) 93 93 – Gold ounces produced .................................. 5,200 8,300 (37%) 15,600 24,200 (36%) Gold ounces sold ........................................... 4,600 7,700 (40%) 14,200 22,500 (37%)
Financial Data (in thousands of dollars) Revenues – Gold sales ................................. 7,994 9,613 (17%) 22,070 26,734 (17%) Mining operations expenses (excluding
Government royalties) .................................. 4,003 3,819 5% 13,206 13,687 (4%) Government royalties .................................... 443 515 (14%) 1,215 1,441 (16%) Depreciation .................................................. 1,183 1,428 (17%) 3,331 6,162 (46%) Administrative ................................................ 462 215 115% 1,563 1,286 22% Corporate social responsibility expenses ....... 254 21 1,110% 560 24 2,233%
Segment operating income ............................ 1,649 3,615 (54%) 2,195 4,134 (47%)
Statistics ($) Average realized selling price (per ounce) .... 1,738 1,248 39% 1,554 1,188 31% Cash operating cost (per ounce produced) 1 .. 760 495 54% 908 596 52% Cash operating cost (per tonne processed) 1 . 40 45 (11%) 43 36 19% Total cash cost (per ounce sold) 2 .................. 933 563 66% 1,005 672 50% Depreciation (per ounce sold) 3 ...................... 257 185 39% 235 274 (14%)
1 Cash operating cost is a non-GAAP financial performance measure with no standard definition under IFRS and is calculated using ounces produced and tonnes processed. See the “Non-GAAP financial performance measures” section of this MD&A.
2 Total cash cost is a non-GAAP financial performance measure with no standard definition under IFRS and represents the mining operating expenses and Government royalties per ounce sold.
3 Depreciation per ounce sold is a non-GAAP financial performance measure with no standard definition under IFRS and represents the depreciation expense per ounce sold.
Third Quarter 2011 v. Third Quarter 2010
During the third quarter of 2011, 110,100 tonnes of ore and 887,500 tonnes of waste material were extracted from the Gobelé A sector, for an average stripping ratio of 8.1:1. During the corresponding period in 2010, our mining activities were focused on the Gobelé A and West Balan BC pits where 105,200 tonnes of ore and 1,218,600 tonnes of waste material were extracted for a strip ratio of 11.6:1.
The 9% increase in ore processed in the third quarter of 2011 is explained by the processing of saprolite ore sourced from the Gobelé A sector during the third quarter of 2011, compared to harder ore sourced from West Balan BC pit at depth during the same period in 2010.
The 41% decrease in head grade in the third quarter of 2011, compared to the third quarter of 2010, is mainly due to lower grade ore sourced from the Gobelé A sector and from stockpiles, compared to the processing of higher grades from the West Balan BC pit at depth in 2010.
The 37% decrease in gold ounces produced in the third quarter of 2011, compared to the third quarter of 2010, is primarily due to the processing of lower grade ore.
The 11% improvement in cash operating cost per tonne processed in the third quarter of 2011, compared to the third quarter of 2010, is mainly due to a decreased stripping ratio. The increased cash operating cost per ounce produced is a result of the lower head grade.
Management’s Discussion and Analysis
26
6. Mining Operations (continued)
Kiniero, Guinea (continued)
Third Quarter 2011 v. Third Quarter 2010 (continued)
The cash operating cost per ounce produced and per tonne processed for the third quarter of 2011 exclude fixed expenses incurred during the temporary shutdown period.
The corporate social responsibility expenses relate mainly to our support to the Government of Guinea’s project to build a hydroelectric power plant on the Cogon River.
First Nine Months of 2011 v. First Nine Months of 2010
The 35% decrease in ore mined during the first nine months of 2011, compared to the same period in 2010, is mainly the result of a higher stripping ratio, pre-stripping activities and the high level of drill and blast required.
The 22% decrease in head grade during the first nine months of 2011 is mainly due to lower grade ore sourced from the Gobelé A sector and from stockpiles, compared to the processing of higher grades from the West Balan BC pit in 2010.
The decrease in gold production during the first nine months of 2011 is mainly due to the processing of lower grade ore in 2011 compared to 2010.
The increase in cash operating cost per tonne processed during the first nine months of 2011, compared to the same period in 2010, is mainly due to a higher stripping ratio combined with higher fuel prices. The cash operating cost per ounce produced increased during the first nine months of 2011 is a result of the lower head grade and higher cash operating cost per tonne processed.
Update on Operations at the Kiniero Mine in Guinea
In September, we announced a temporary suspension of operations at our Kiniero mine in Guinea following an illegal protest by a group of local residents. Guinea’s Secretary General and Minister of Mines & Geology issued a letter to the Corporation affirming the Government’s outrage and disdain for the events. The stoppage is a precautionary measure. At the end of October, normal exploration activities resumed. However, at this time, we cannot ascertain when operations will resume. We are in discussion with the Government in order to establish a safe environment to return to normal operations.
Management’s Discussion and Analysis
27
7. Other Elements of the Statement of Income
General and Administrative Expenses
Three-month period ended September 30
Nine-month period ended September 30
(In thousands of dollars) 2011$
2010 $
2011 $
2010 $
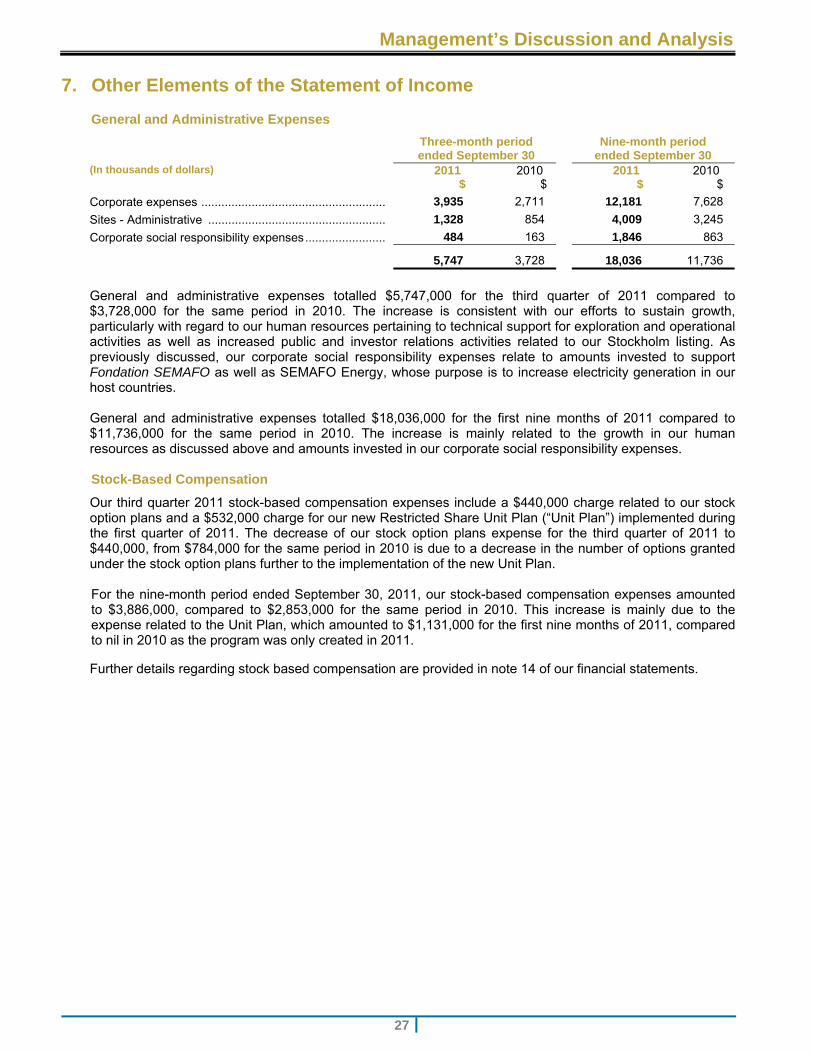
Corporate expenses ....................................................... 3,935 2,711 12,181 7,628
Sites - Administrative ..................................................... 1,328 854 4,009 3,245
Corporate social responsibility expenses ........................ 484 163 1,846 863
5,747 3,728 18,036 11,736
General and administrative expenses totalled $5,747,000 for the third quarter of 2011 compared to $3,728,000 for the same period in 2010. The increase is consistent with our efforts to sustain growth, particularly with regard to our human resources pertaining to technical support for exploration and operational activities as well as increased public and investor relations activities related to our Stockholm listing. As previously discussed, our corporate social responsibility expenses relate to amounts invested to support Fondation SEMAFO as well as SEMAFO Energy, whose purpose is to increase electricity generation in our host countries. General and administrative expenses totalled $18,036,000 for the first nine months of 2011 compared to $11,736,000 for the same period in 2010. The increase is mainly related to the growth in our human resources as discussed above and amounts invested in our corporate social responsibility expenses. Stock-Based Compensation
Our third quarter 2011 stock-based compensation expenses include a $440,000 charge related to our stock option plans and a $532,000 charge for our new Restricted Share Unit Plan (“Unit Plan”) implemented during the first quarter of 2011. The decrease of our stock option plans expense for the third quarter of 2011 to $440,000, from $784,000 for the same period in 2010 is due to a decrease in the number of options granted under the stock option plans further to the implementation of the new Unit Plan. For the nine-month period ended September 30, 2011, our stock-based compensation expenses amounted to $3,886,000, compared to $2,853,000 for the same period in 2010. This increase is mainly due to the expense related to the Unit Plan, which amounted to $1,131,000 for the first nine months of 2011, compared to nil in 2010 as the program was only created in 2011.
Further details regarding stock based compensation are provided in note 14 of our financial statements.
Management’s Discussion and Analysis
28
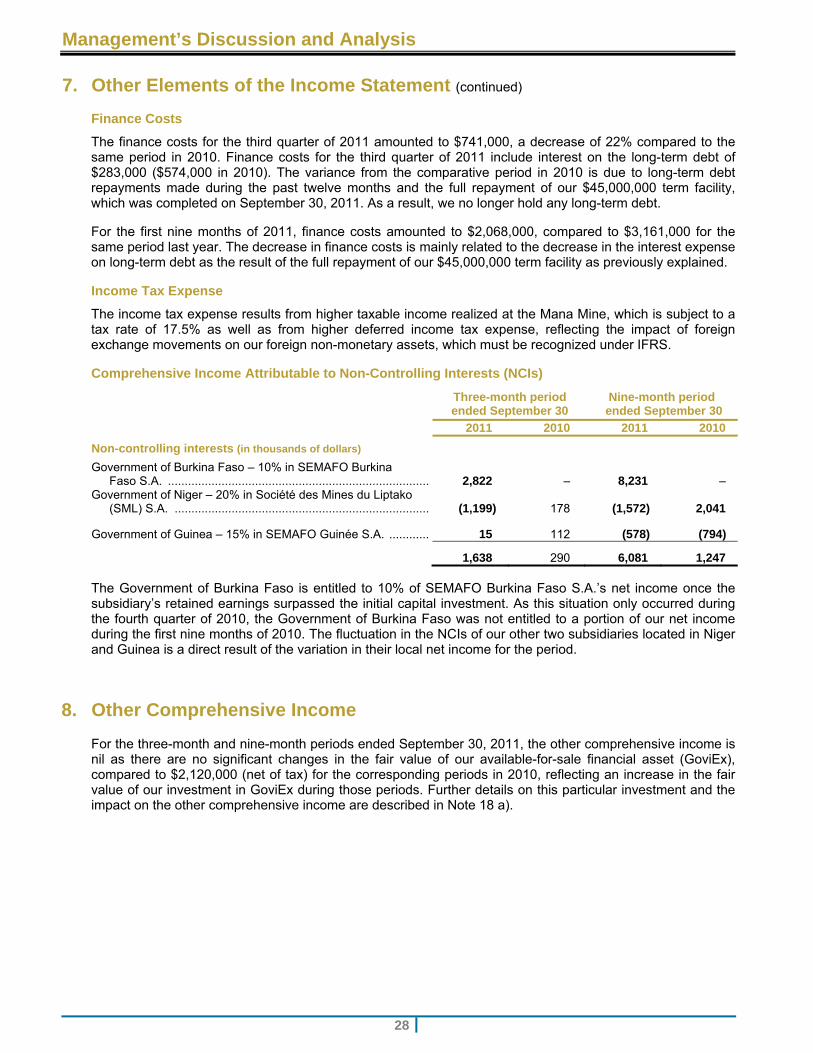
7. Other Elements of the Income Statement (continued) Finance Costs
The finance costs for the third quarter of 2011 amounted to $741,000, a decrease of 22% compared to the same period in 2010. Finance costs for the third quarter of 2011 include interest on the long-term debt of $283,000 ($574,000 in 2010). The variance from the comparative period in 2010 is due to long-term debt repayments made during the past twelve months and the full repayment of our $45,000,000 term facility, which was completed on September 30, 2011. As a result, we no longer hold any long-term debt.
For the first nine months of 2011, finance costs amounted to $2,068,000, compared to $3,161,000 for the same period last year. The decrease in finance costs is mainly related to the decrease in the interest expense on long-term debt as the result of the full repayment of our $45,000,000 term facility as previously explained.
Income Tax Expense
The income tax expense results from higher taxable income realized at the Mana Mine, which is subject to a tax rate of 17.5% as well as from higher deferred income tax expense, reflecting the impact of foreign exchange movements on our foreign non-monetary assets, which must be recognized under IFRS.
Comprehensive Income Attributable to Non-Controlling Interests (NCIs)
Three-month period ended September 30
Nine-month period ended September 30
2011 2010 2011 2010
Non-controlling interests (in thousands of dollars)
Government of Burkina Faso – 10% in SEMAFO Burkina Faso S.A. .............................................................................. 2,822 – 8,231 –
Government of Niger – 20% in Société des Mines du Liptako (SML) S.A. ............................................................................ (1,199) 178 (1,572) 2,041
Government of Guinea – 15% in SEMAFO Guinée S.A. ............ 15 112 (578) (794)
1,638 290 6,081 1,247 The Government of Burkina Faso is entitled to 10% of SEMAFO Burkina Faso S.A.’s net income once the subsidiary’s retained earnings surpassed the initial capital investment. As this situation only occurred during the fourth quarter of 2010, the Government of Burkina Faso was not entitled to a portion of our net income during the first nine months of 2010. The fluctuation in the NCIs of our other two subsidiaries located in Niger and Guinea is a direct result of the variation in their local net income for the period.
8. Other Comprehensive Income
For the three-month and nine-month periods ended September 30, 2011, the other comprehensive income is nil as there are no significant changes in the fair value of our available-for-sale financial asset (GoviEx), compared to $2,120,000 (net of tax) for the corresponding periods in 2010, reflecting an increase in the fair value of our investment in GoviEx during those periods. Further details on this particular investment and the impact on the other comprehensive income are described in Note 18 a).
Management’s Discussion and Analysis
29
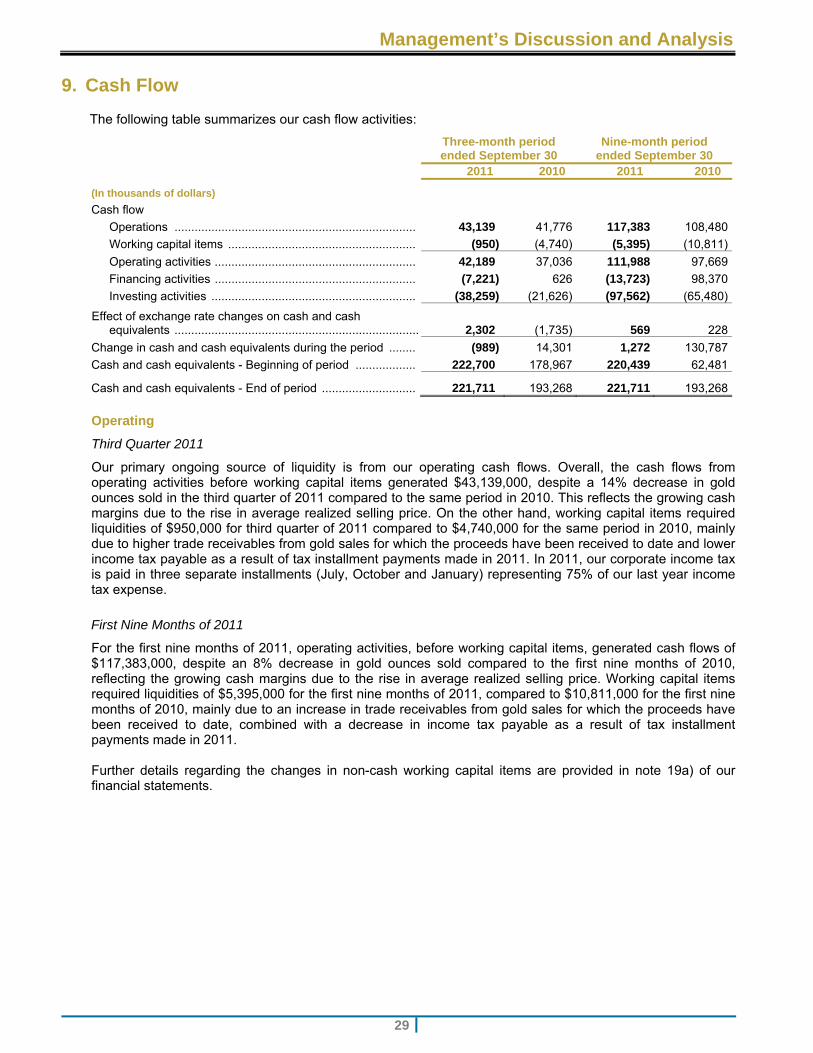
9. Cash Flow
The following table summarizes our cash flow activities:
Three-month periodended September 30
Nine-month periodended September 30
2011 2010 2011 2010
(In thousands of dollars)
Cash flow
Operations ........................................................................ 43,139 41,776 117,383 108,480
Working capital items ........................................................ (950) (4,740) (5,395) (10,811)
Operating activities ............................................................ 42,189 37,036 111,988 97,669
Financing activities ............................................................ (7,221) 626 (13,723) 98,370
Investing activities ............................................................. (38,259) (21,626) (97,562) (65,480)
Effect of exchange rate changes on cash and cash equivalents ......................................................................... 2,302 (1,735) 569 228
Change in cash and cash equivalents during the period ........ (989) 14,301 1,272 130,787
Cash and cash equivalents - Beginning of period .................. 222,700 178,967 220,439 62,481
Cash and cash equivalents - End of period ............................ 221,711 193,268 221,711 193,268
Operating
Third Quarter 2011
Our primary ongoing source of liquidity is from our operating cash flows. Overall, the cash flows from operating activities before working capital items generated $43,139,000, despite a 14% decrease in gold ounces sold in the third quarter of 2011 compared to the same period in 2010. This reflects the growing cash margins due to the rise in average realized selling price. On the other hand, working capital items required liquidities of $950,000 for third quarter of 2011 compared to $4,740,000 for the same period in 2010, mainly due to higher trade receivables from gold sales for which the proceeds have been received to date and lower income tax payable as a result of tax installment payments made in 2011. In 2011, our corporate income tax is paid in three separate installments (July, October and January) representing 75% of our last year income tax expense.
First Nine Months of 2011
For the first nine months of 2011, operating activities, before working capital items, generated cash flows of $117,383,000, despite an 8% decrease in gold ounces sold compared to the first nine months of 2010, reflecting the growing cash margins due to the rise in average realized selling price. Working capital items required liquidities of $5,395,000 for the first nine months of 2011, compared to $10,811,000 for the first nine months of 2010, mainly due to an increase in trade receivables from gold sales for which the proceeds have been received to date, combined with a decrease in income tax payable as a result of tax installment payments made in 2011. Further details regarding the changes in non-cash working capital items are provided in note 19a) of our financial statements.
Management’s Discussion and Analysis
30
9. Cash Flow (continued)
Financing
Third Quarter 2011
In the third quarter of 2011, cash flows used in the financing activities amounted to $7,221,000, compared to cash flow from financing activities of $626,000 for the same period in 2010. This is mainly explained from the fact that during the third quarter of 2011, we made a reimbursement of $7,500,000 on our long-term debt compared to $5,122,000 during the corresponding period in 2010, including the prepayment of $3,750,000, initially due on December 31, 2011, of our $45,000,000 term facility. As a result, we no longer held long-term debt. Also, during the third quarter of 2011 a total of 178,000 options were exercised under the Original Plan for a cash consideration of $279,000. In 2010, for the same period, a total of 1,034,000 options were exercised under the Original Plan for a cash consideration of $2,148,000 in addition to a total of 1,800,000 warrants that were exercised for a gross proceed of $3,600,000.
First Nine Months of 2011
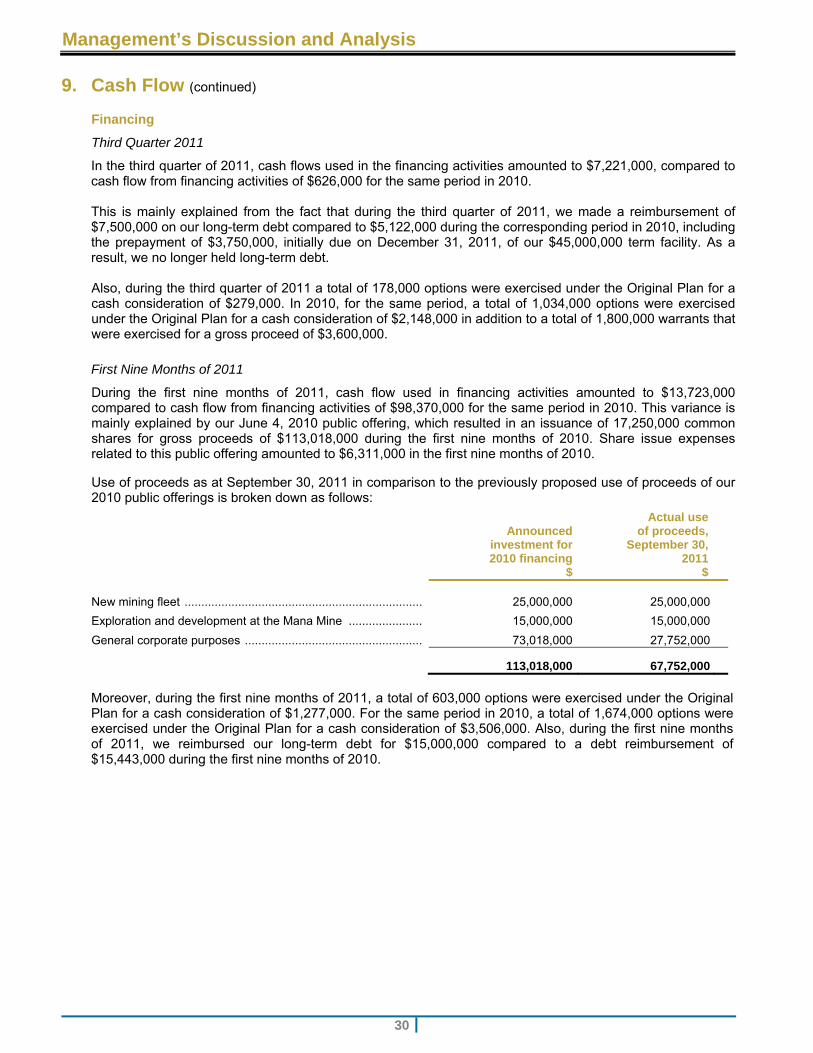
During the first nine months of 2011, cash flow used in financing activities amounted to $13,723,000 compared to cash flow from financing activities of $98,370,000 for the same period in 2010. This variance is mainly explained by our June 4, 2010 public offering, which resulted in an issuance of 17,250,000 common shares for gross proceeds of $113,018,000 during the first nine months of 2010. Share issue expenses related to this public offering amounted to $6,311,000 in the first nine months of 2010.
Use of proceeds as at September 30, 2011 in comparison to the previously proposed use of proceeds of our 2010 public offerings is broken down as follows:
Announced investment for 2010 financing
$
Actual useof proceeds,
September 30,2011
$ New mining fleet ....................................................................... 25,000,000 25,000,000
Exploration and development at the Mana Mine ...................... 15,000,000 15,000,000
General corporate purposes ..................................................... 73,018,000 27,752,000
113,018,000 67,752,000
Moreover, during the first nine months of 2011, a total of 603,000 options were exercised under the Original Plan for a cash consideration of $1,277,000. For the same period in 2010, a total of 1,674,000 options were exercised under the Original Plan for a cash consideration of $3,506,000. Also, during the first nine months of 2011, we reimbursed our long-term debt for $15,000,000 compared to a debt reimbursement of $15,443,000 during the first nine months of 2010.
Management’s Discussion and Analysis
31
9. Cash Flow (continued)
Investing
Third Quarter 2011
During the third quarter of 2011, we made investments of $42,009,000 in property, plant and equipment, compared to investments of $21,626,000 in property, plant and equipment in 2010.
The cash flow used for investments in property, plant and equipment in the third quarter of 2011 represented exploration expenditures amounting to $10,326,000, expansion costs at the Mana Mine totalling $1,169,000, the Mana underground amounting to $1,690,000, the purchase of mining equipment totalling $10,736,000, capitalized stripping costs of $8,923,000, as well as sustainable capital expenditures in the amount of $9,165,000. In 2010, liquidities of $21,626,000 were invested as follows: $6,684,000 in exploration expenditures, $2,727,000 for the expansion of the Mana Mine, $338,000 for the underground project at Mana, $5,054,000 for the mining equipment, stripping costs of $2,826,000 as well as sustainable capital expenditures in the amount of $3,997,000.
Restricted cash of $3,750,000 was used to reimburse the last payment of our $45,000,000 term facility.
First nine months of 2011
During the first nine months of 2011, we made investments of $101,007,000 in property, plant and equipment, compared to investments of $65,480,000 in property, plant and equipment for the first nine months of 2010.
Cash flow used for investments in property, plant and equipment in the first nine months of 2011 represented exploration expenditures amounting to $34,944,000, expansion costs at the Mana Mine totalling $5,386,000, the Mana underground amounting to $2,013,000, the purchase of mining equipment totalling $21,384,000, capitalized stripping costs of $16,668,000, as well as sustainable capital expenditures in the amount of $20,612,000. In 2010, liquidities of $65,480,000 were invested as follows: $13,587,000 in exploration expenditures, $15,166,000 for the expansion of the Mana Mine, $725,000 for the underground project in Mana, $18,091,000 for the mining equipment, stripping costs of $6,265,000 as well as sustainable capital expenditures in the amount of $11,646,000.
The decrease in restricted cash of $3,445,000 for the first nine months of 2011 is mainly due to the restricted cash used for the repayment of our long-term debt, compared to nil for the same period in 2010.
Financial Position
As at September 30, 2011, we maintained a strong financial position with $222,673,000 in cash, cash equivalents and restricted cash and no long-term debt. With our existing cash balances and forecast cash flow from operations, we are well positioned to fund all our cash requirements for 2011, which relate primarily to the following activities:
Requirements and ongoing projects
Exploration programs
Mana plant expansion project
Purchase of additional new mining equipment
Wona Deep development
Payment of income tax installments.
Management’s Discussion and Analysis
32
10. Financial Position
As at September 30,
2011
As atDecember 31,
2010
(In thousands of dollars)
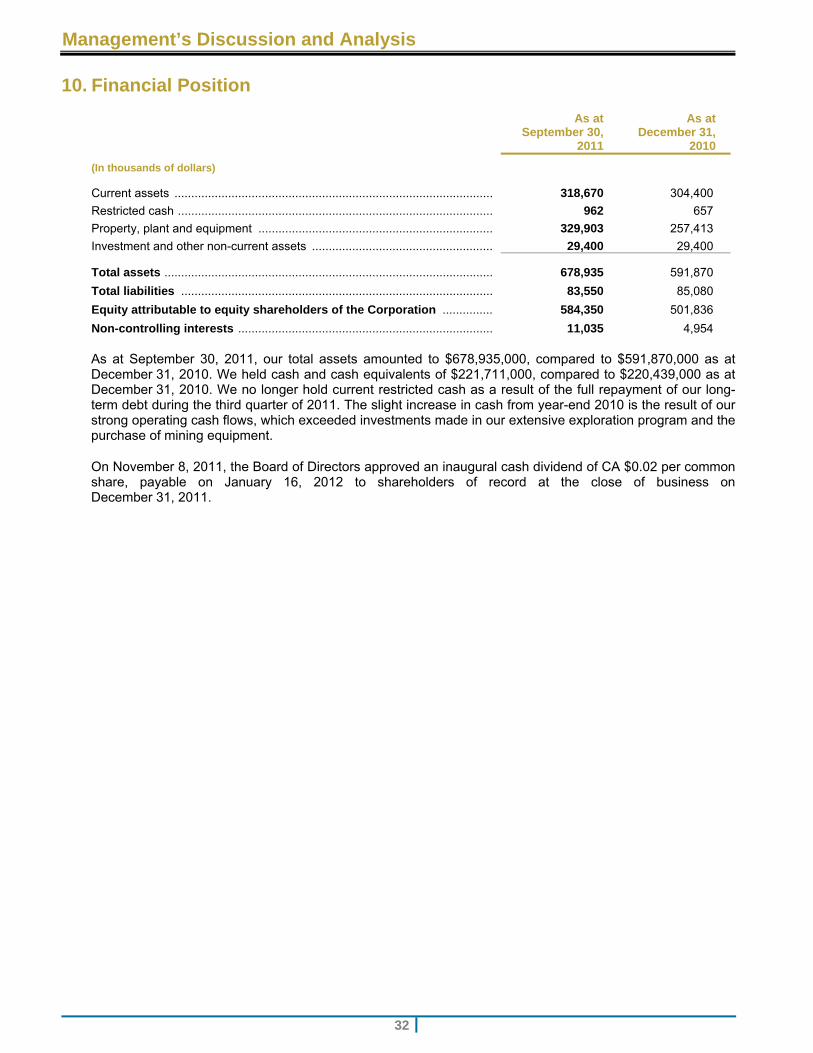
Current assets ............................................................................................... 318,670 304,400
Restricted cash .............................................................................................. 962 657
Property, plant and equipment ...................................................................... 329,903 257,413
Investment and other non-current assets ...................................................... 29,400 29,400
Total assets .................................................................................................. 678,935 591,870
Total liabilities ............................................................................................. 83,550 85,080
Equity attributable to equity shareholders of the Corporation ............... 584,350 501,836
Non-controlling interests ............................................................................ 11,035 4,954
As at September 30, 2011, our total assets amounted to $678,935,000, compared to $591,870,000 as at December 31, 2010. We held cash and cash equivalents of $221,711,000, compared to $220,439,000 as at December 31, 2010. We no longer hold current restricted cash as a result of the full repayment of our long-term debt during the third quarter of 2011. The slight increase in cash from year-end 2010 is the result of our strong operating cash flows, which exceeded investments made in our extensive exploration program and the purchase of mining equipment.
On November 8, 2011, the Board of Directors approved an inaugural cash dividend of CA $0.02 per common share, payable on January 16, 2012 to shareholders of record at the close of business on December 31, 2011.
Management’s Discussion and Analysis
33
11. Derivative Financial Instruments
Put Options In 2007, we implemented a 55,000 ounce gold price put protection program for the Mana Mine, a requirement under its $45,000,000 debt facility, which was fully repaid during the third quarter of 2011. Even though the debt was fully reimbursed, as at September 30, 2011, 11,250 ounces are still outstanding and will expire during the fourth quarter of 2011 (3,750 per month). Accordingly, the entire production is available to be sold at spot price and is fully exposed to any upward increase in the gold price.
12. Contractual Obligations
Asset Retirement Obligations Our operations are governed by mining agreements that include the protection of the environment. We conduct our operations in such manner as to protect public health and the environment. We implement progressive measures for rehabilitation work during the operation, in accordance with our mining agreements, as well as closing-down and follow-up work upon closure of a mine. The estimated undiscounted cash flow required to settle the asset retirement obligations is $10,038,000. These disbursements are expected to be made during the years 2011 to 2020. The amount accounted for as liabilities in our financial statements represents the discounted obligations from rehabilitation and closing plans. A 7% discount rate was used to evaluate the obligations.
Government Royalties and Development Taxes Pursuant to our mining agreements, we have royalty commitments that generate obligations upon gold deliveries. If our mines do not produce gold, we have no payment obligation. Each gold shipment is subject to royalty fees ranging from 3% to 5% in Burkina Faso, 5.5% in Niger and 5% in Guinea, based on the value of the shipments, evaluated at the spot price on the delivery date. In Guinea, we are also committed to invest 0.4% of gold sales in local development projects.
Net Smelter Royalty – Samira Hill Mine Further to the acquisition from Etruscan Resources Inc. of their minority interest in the subsidiary operating the Samira Hill Mine located in Niger, the Corporation is subject to a 1.5% net smelter royalty. The royalty comes into effect after the mine has produced 750,000 ounces, calculated from July 1, 2009. Since July 1, 2009, the Samira Hill Mine produced 108,700 ounces. The Corporation has been granted a right of first refusal should Etruscan decides to sell this royalty.
Payments to Maintain Mining Rights In the normal course of business, in order to obtain and maintain all the advantages of our mining permits, we must commit to invest a specific amount in exploration and development on the permits during their validity period. Moreover, we must make annual payments in order to maintain certain property titles. As at September 30, 2011, we were in compliance with all obligations related to the ownership of our permits.
Purchase Obligations As at September 30, 2011, our purchase commitments related to the Mana plant expansion, the Mana underground project and other ongoing capital expenditures totalled $6,154,000, $3,498,000 and $1,701,000 respectively. In addition, on October 1, 2011, we entered into an agreement with National Electricity Company, Sonabel in Burnika Faso according to which we will advance $9,500,000 for the construction of a 73-kilometer high voltage transmission line. This amount is reimbursable to SEMAFO by Sonabel over an eight-year period following commissioning, which is scheduled for the second half of 2013.
Management’s Discussion and Analysis
34
13. Risks and Uncertainties
As a mining company, we face the financial and operational risks inherent to the nature of our activities. These risks may affect our financial condition and results of operation. As a result, an investment in our common shares could be considered speculative. Prospective purchasers or holders of our common shares should give careful consideration to all of our risks factors.
Financial Risks
Fluctuation in Gold Prices The profitability of our operations will be significantly affected by changes in the market price of gold. Gold production from mining operations and the willingness of third parties, such as central banks, to sell or lease gold affect the gold supply. Demand for gold can be influenced by economic conditions, gold’s attractiveness as an investment vehicle and the strength of the US dollar and local investment currencies. Other factors include the level of interest rates, exchange rates, inflation and political stability. The aggregate effect of these factors is impossible to predict with accuracy. Gold prices are also affected by worldwide production levels.
In addition, the price of gold has on occasion been subject to very rapid short-term changes because of speculative activities. Fluctuations in gold prices may materially adversely affect our financial condition and results of operation.
Fluctuation in Petroleum Prices Because we use petroleum fuel to power our mining equipment and to generate electrical energy to power our mining operations, our financial condition and results of operation may be materially adversely affected by rising petroleum prices.
Exchange Rate Fluctuations Our operations in West Africa are subject to currency fluctuations that may materially adversely affect our financial condition and results of operation. Gold is currently sold in US dollars and although the majority of our costs are also in US dollars, certain costs are incurred in other currencies. The appreciation of non-US dollar currencies against the US dollar can increase the cost of exploration and production in US dollar terms, which could materially adversely affect our financial condition and results of operation.
Operational Risks
Access to Capital Markets To fund our growth, we are often dependent on securing the necessary capital through loans or permanent capital. The availability of this capital is subject to general economic conditions and lender and investor interest in our projects.
Uncertainty of Reserve and Resource Estimates Reserves and resources are estimates based on limited information acquired through drilling and other sampling methods. No assurance can be given that anticipated tonnages and grades will be achieved or that level of recovery will be realized. The ore grade actually recovered may differ from the estimated grades of the reserves and resources. Such figures have been determined based upon assumed gold prices and operating costs. Future production could differ dramatically from reserve estimates for, among others, the following reasons:
mineralization or formations could differ from those predicted by drilling, sampling and similar examinations;
increases in operating mining costs and processing costs could materially adversely affect reserves;
the grade of the reserves may vary significantly from time to time and there is no assurance that any particular level of gold may be recovered from the reserves; and
declines in the market price of gold may render the mining of some or all of the reserves uneconomic.
Management’s Discussion and Analysis
35
13. Risks and Uncertainties (continued)
Operational Risks (continued)
Uncertainty of Reserve and Resource Estimates (continued) Any of these factors may translate into increased costs or a reduction in our estimated reserves. Short-term factors, such as the need for the additional development of a deposit or the processing of new different grades, may impair our profitability. Should the market price of gold fall, we could be required to materially write down our investment in mining properties, delay or discontinue production or the development of new projects.
Production and Operating Cash Cost No assurance can be given that the intended or expected production schedules or the estimated operating cash costs will be achieved in respect of our operating gold mines. Many factors may cause delays or cost increases, including labour issues, disruptions in power, transportation or supplies, and mechanical failure. Our net income will depend, among other things, on the extent to which expected operating costs are achieved. In addition, short-term operating factors, such as the need for the orderly development of ore bodies or the processing of new or different ore grades, may cause a mining operation to be unprofitable in any particular period. Furthermore, our activities may be subject to prolonged disruptions due to weather conditions. Hazards, such as unusual or unexpected formations, rock bursts, pressures, cave-ins, flooding or other conditions may be encountered in the drilling and removal of material. Our operating cash cost to produce an ounce of gold is further dependent on a number of factors, including the grade of reserves, recovery and plant throughput. Our future performance may hence materially adversely differ from the estimated performance. As these factors are beyond our control, there can be no assurance that our cash operating cost will be similar from year to year.
Nature of Mineral Exploration and Mining Our profitability is significantly affected by our exploration and development programs. The exploration and development of mineral deposits involve significant financial risks over a significant period of time, which even a combination of careful evaluation, experience and knowledge may not eliminate. While the discovery of a gold-bearing structure may result in substantial rewards, few properties explored are ultimately developed into mines. Major expenses may be required to establish and replace reserves by drilling and to construct mining and processing facilities at a site. It is impossible to ensure that our current or proposed exploration programs will result in profitable commercial mining operations.
Whether a gold deposit will be commercially viable depends on a number of factors, some of which are the particular attributes of the deposit, such as its size and grade, proximity to infrastructure, financing costs and governmental regulations, including regulations relating to prices, taxes, royalties, infrastructure, land use, importing and exporting of gold, revenue repatriation and environmental protection. The effects of these factors cannot be accurately predicted, but the combination of these factors may preclude us from receiving an adequate return on invested capital.
Our operations are, and will continue to be, subject to all of the hazards and risks normally associated with the exploration, development and production of gold, any of which could result in damage to life or property, environmental damage and possible legal liability for any or all damage.
Depletion of our Mineral Reserves We must continually replace mining reserves depleted by production to maintain production levels over the long term. This is done by expanding known mineral reserves or by locating or acquiring new mineral deposits. There is, however, a risk that depletion of reserves will not be offset by future discoveries. Exploration for minerals is highly speculative in nature and involves many risks. Many, if not most gold projects are unsuccessful and there are no assurances that current or future exploration programs will be successful. Further, significant costs are incurred to establish mineral reserves, open new pits and construct mining and processing facilities. Development projects have no operating history upon which to base estimates of future cash flow and are subject to the successful completion of feasibility studies, obtaining necessary government permits, obtaining title or other land rights and the availability of financing. In addition, assuming discovery of an economic mine or pit, depending on the type of mining operation involved, many years may elapse before commercial operations commence. Accordingly, there can be no assurance that our current programs will result in any new commercial mining operations or yield new reserves to replace or expand current reserves.
Management’s Discussion and Analysis
36
13. Risks and Uncertainties (continued)
Operational Risks (continued)
Availability of Infrastructure and Fluctuation in the Price of Energy and other Commodities The exploration and development of mineral deposits is dependent on adequate infrastructure. Reliable roads, bridges, energy and power sources and water supply are important determinant susceptible to affect our capital and operating costs. Lack of such infrastructure or unusual or infrequent weather phenomena, sabotage, terrorism, government or other interference in the maintenance or provision of such infrastructure could adversely affect our financial condition and results of operation.
In addition, our profitability is affected by the market price and availability of commodities that are consumed or otherwise used in connection with our operations such as diesel, fuel, electricity, steel, concrete and chemical (including cyanide). Prices of such commodities are affected by factors that are beyond our control. An increase in the cost or decrease in the availability may materially adversely affect the timing and costs of our operations and projects.
Licenses and Permits We require licenses and permits from various governmental authorities. We believe that we hold all necessary licenses and permits under applicable laws and regulations in respect of our properties and that we presently comply in all material respects with the terms of such licenses and permits. Such licenses and permits, however, are subject to change in various circumstances. There can be no guarantee that we will be able to obtain or maintain all necessary licenses and permits that may be required to explore and develop our properties, commence construction or operation of mining facilities and properties under exploration or development or to maintain continued operations that economically justify the cost.
Political Risk While the governments in Burkina Faso, Niger and Guinea have historically supported the development of their natural resources by foreign companies, there is no assurance that these governments will not in the future adopt different policies or new interpretations respecting foreign ownership of mineral resources, rates of exchange, environmental protection, labour relations, repatriation of income or return of capital. Any limitation on transfer of cash or other assets between SEMAFO and our subsidiaries could restrict our ability to fund our operations or repay our debts and materially adversely affect our financial condition and results of operation.
Moreover, mining tax regimes in foreign jurisdictions are subject to differing interpretations and constant changes and may not include fiscal stability provisions. Our interpretation of taxation law as applied to our transactions and activities may not coincide with that of the tax authorities. As a result, transactions may be challenged by tax authorities and our operations may be assessed, which could result in significant addition in taxes, penalties and interest.
The possibility that a future government in any of these countries may adopt substantially different policies or interpretations, which might extend to the expropriation of assets, cannot be ruled out. Political risk also includes the possibility of civil disturbances and political instability in these countries.
Title Matters While we have no reason to believe that the existence and extent of any mining property in which we have an interest is in doubt, title to mining properties is subject to potential claims by third parties. The failure to comply with all applicable laws and regulations, including failure to pay taxes and carry out and file assessment work, may invalidate title to all or portions of the properties covered by our permits and licences.
Management’s Discussion and Analysis
37
13. Risks and Uncertainties (continued)
Operational Risks (continued)
Insufficient Insurance While we may obtain insurance against certain risks in such amounts as we consider adequate, available insurance may not cover all the potential risks associated with a mining company operations. We may also be unable to maintain insurance to cover insurable risks at economically feasible premiums and insurance coverage may not be available in the future or may not be adequate to cover any resulting loss. Moreover, insurance risks such as the validity of ownership of unpatented mining claims and mil sites and environmental pollution or other hazards as a result of exploration and production is not generally available to gold mining companies on acceptable terms. The potential costs which may be associated with any liabilities not covered by insurance or in excess of insurance coverage or compliance with applicable laws and regulations may cause substantial delays and require significant capital outlays, materially adversely affecting our financial condition and results of operation.
Outside Contractor Risk A significant portion of our operations in Niger continues to be conducted by contractors. As a result, our operations are subject to a number of risks, some of which are outside of our control, including:
negotiating agreements with contractors on acceptable terms;
the inability to replace a contractor and its operating equipment in the event that either party terminates the agreement;
reduced control over such aspects of operations that are the responsibility of the contractor;
failure of a contractor to perform under our contractual arrangement;
interruption of operations in the event that a contractor ceases its business due to insolvency or other events;
failure of a contractor to comply with applicable legal and regulatory requirements, to the extent that it is responsible for such compliance; and
problems of a contractor with managing its workforce, labour unrest or other employment issues.
In addition, we may incur liability to third parties as a result of the actions of a contractor. The occurrence of one or more of these risks could have a material adverse effect on our financial condition and results of operation.
Competition The mineral exploration and mining business is competitive in all of its phases. We compete with numerous other companies and individuals, including competitors with greater financial, technical and other resources, in the search for and the acquisition of attractive mineral properties, equipment and increasingly, human resources. There is no assurance that we will continue to be able to compete successfully with our competitors.
Qualified and Key Personnel In order to operate successfully, we must find and retain qualified employees with strong knowledge and expertise in the mining environment. SEMAFO and other companies in the mining industry compete for qualified and key personnel and if we are unable to attract and retain qualified personnel or fail to establish adequate succession planning strategies with respect to same, our operations could be materially adversely affected.
Management’s Discussion and Analysis
38
13. Risks and Uncertainties (continued)
Operational Risks (continued)
Labour and Employment Relations We are dependent on our workforce to extract and process minerals. Our relations with our employees may be impacted by changes in labour relations which may be introduced by, among others, employee groups, unions and the relevant governmental authorities. Labour disruptions at any of our properties could have a material adverse impact on our financial condition and results of operation. Some of our employees are represented by labour unions under collective labour agreements. We may not be able to satisfactorily renegotiate our collective labour agreements upon their expiration. In addition, existing labour agreements may not prevent a strike or work stoppage at our facilities in the future. Labour disruptions at any of our properties could have a material adverse impact on our financial condition and results of operation.
Surrounding Communities Relations Our properties in Burkina Faso, Niger and Guinea may be subject to the rights or asserted rights of various community stakeholders. Moreover, artisanal miners may make use of some or all of our properties which would interfere with exploration and development activities on such properties.
Environmental Risks and Hazards All phases of our operations are subject to environmental regulation in the various jurisdictions in which we operate. Environmental legislation is evolving in a manner which will require stricter standards and enforcement, increased fines and penalties for non-compliance, more stringent environmental assessments of proposed projects, and a heightened degree of responsibility for companies and their officers, directors and employees. Environmental hazards which are unknown to us at present and which have been caused by previous or existing owners or operations of the properties may exist on our properties. Failure to comply with applicable environmental laws and regulations may result in enforcement actions and may include corrective measures that require capital expenditures or remedial actions. There is no assurance that future changes in environmental laws and regulations and permits governing operations and activities of mining companies, if any, will not materially adversely affect our operations or result in substantial costs and liabilities to us in the future.
Production at our mines involves the use of sodium cyanide which is a toxic material. Should sodium cyanide leak or otherwise be discharged from the containment system, we may become subject to liability for clean-up work that may not be insured. While all steps have been taken to prevent discharges of pollutants into ground water and the environment, we may become subject to liability for hazards that may not be insured.
Litigation All industries, including the mining industry, are subject to legal claims, with and without merit. We have in the past been, currently are, and may in the future be, involved in various legal proceedings. While we believe it is unlikely that the final outcome of these legal proceedings will have an adverse effect on our financial condition and results of operation, defense costs will be incurred, even with respect to claims that have no merit. Due to the inherent uncertainty of the litigation process, there can be no assurance that the resolution of any particular legal proceeding will not have a material adverse effect on our financial condition and results of operation.
Management’s Discussion and Analysis
39
14. Summary of Quarterly Information
(Unaudited, in accordance with IFRS (Canadian GAAP for 2009))
2011
2010 2009
(In thousands of dollars, except for amounts per share) Q3 Q2 Q1 Q4 Q3 Q2 Q1 Q4
Gold sales .................................... 102,297 100,398 79,367 86,392 86,223 87,085 63,575 73,286
Operating income ........................ 40,756 40,590 25,370 32,165 37,949 36,565 18,071 17,494
Net income .................................. 31,320 32,851 20,392 28,176 32,392 30,704 11,963 10,483
Attributable to : - Equity shareholders of the
Corporation .......................... 29,682 30,631 18,169 26,647 32,102 29,916 11,794 10,483
- Non-controlling interests ........ 1,638 2,220 2,223 1,529 290 788 169 ‒
Comprehensive income ............... 31,320 32,851 20,392 28,176 34,512 30,704 11,963 10,483
Attributable to : - Equity shareholders of the
Corporation .......................... 29,682 30,631 18,169 26,647 34,222 29,916 11,794 10,483
- Non-controlling interests ........ 1,638 2,220 2,223 1,529 290 788 169 ‒
Basic net income per share .......... 0.11 0.11 0.07 0.10 0.12 0.12 0.05 0.04
Diluted net income per share ....... 0.11 0.11 0.07 0.10 0.12 0.11 0.05 0.04
Cash flow from operating activities 1 ................................ 43,139 43,191 31,220 39,128 41,776 41,314 25,989 23,902
1 Cash flow from operating activities excludes changes in non-cash working capital items.
15. Information on Outstanding Shares
As at November 8, 2011, our share capital is comprised of 272,841,185 common shares issued and outstanding.
We have two stock option plans for our employees, officers, consultants and directors and those of our subsidiaries; the Stock Option Plan (the “Original Plan”) and the 2010 Stock Option Plan (the “2010 Plan”). At the 2010 Annual General and Special Shareholders’ Meeting, our shareholders adopted the 2010 Plan. Since the adoption of the 2010 Plan by SEMAFO’s shareholders, no further options have been granted under the original plan.
The plans provide for the grant of non-transferable options for the purchase of common shares. As at November 8, 2011 stock options allowing its holders to purchase 9,439,750 common shares were outstanding.
16. Shareholders’ Rights Plan
On March 15, 2011, the Board of Directors of the Corporation approved the adoption of a Shareholder Rights Plan (“Rights Plan”) for which shareholder approval was obtained at the Corporation’s annual and special meeting of shareholders held on May 10, 2011.
The purpose of the Rights Plan is to provide the shareholders and directors of the Corporation with adequate time to consider and evaluate any unsolicited bid and to provide the directors with adequate time to identify, develop and negotiate value-enhancing alternatives, if considered appropriate, to any such unsolicited bid.
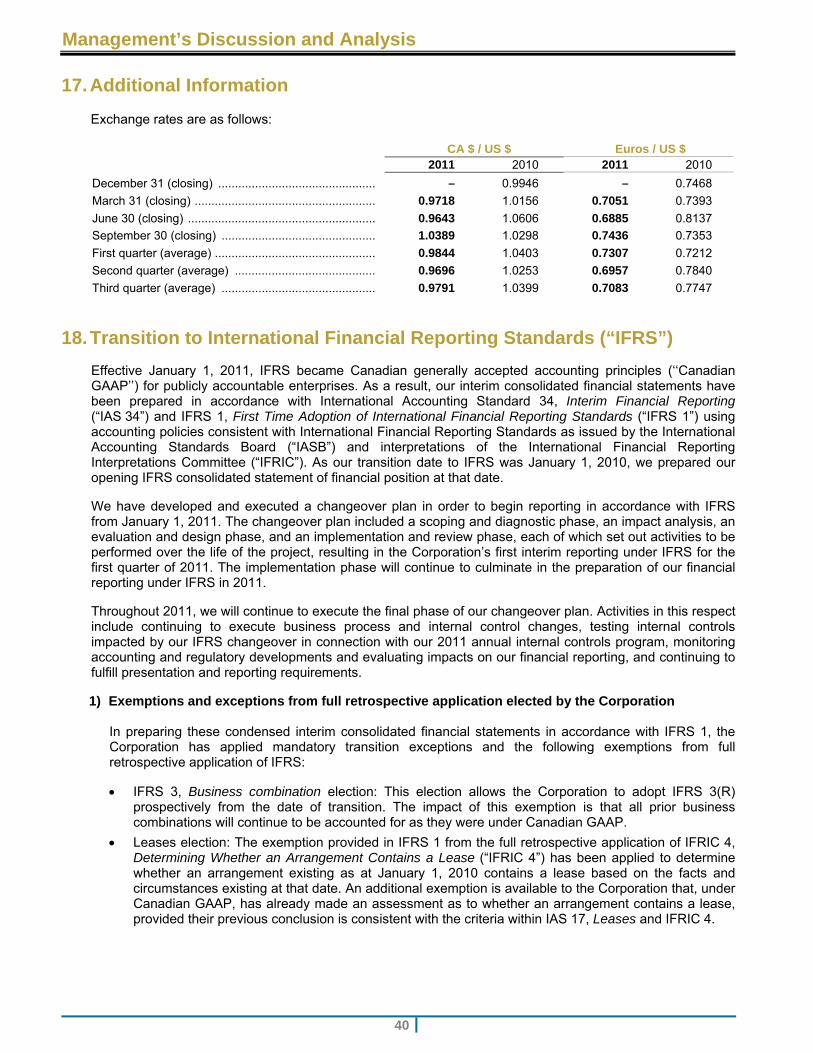
Management’s Discussion and Analysis
40
17. Additional Information
Exchange rates are as follows: CA $ / US $ Euros / US $ 2011 2010 2011 2010
December 31 (closing) ............................................... – 0.9946 – 0.7468
March 31 (closing) ...................................................... 0.9718 1.0156 0.7051 0.7393
June 30 (closing) ........................................................ 0.9643 1.0606 0.6885 0.8137
September 30 (closing) .............................................. 1.0389 1.0298 0.7436 0.7353
First quarter (average) ................................................ 0.9844 1.0403 0.7307 0.7212
Second quarter (average) .......................................... 0.9696 1.0253 0.6957 0.7840
Third quarter (average) .............................................. 0.9791 1.0399 0.7083 0.7747
18. Transition to International Financial Reporting Standards (“IFRS”)
Effective January 1, 2011, IFRS became Canadian generally accepted accounting principles (‘‘Canadian GAAP’’) for publicly accountable enterprises. As a result, our interim consolidated financial statements have been prepared in accordance with International Accounting Standard 34, Interim Financial Reporting (“IAS 34”) and IFRS 1, First Time Adoption of International Financial Reporting Standards (“IFRS 1”) using accounting policies consistent with International Financial Reporting Standards as issued by the International Accounting Standards Board (“IASB”) and interpretations of the International Financial Reporting Interpretations Committee (“IFRIC”). As our transition date to IFRS was January 1, 2010, we prepared our opening IFRS consolidated statement of financial position at that date.
We have developed and executed a changeover plan in order to begin reporting in accordance with IFRS from January 1, 2011. The changeover plan included a scoping and diagnostic phase, an impact analysis, an evaluation and design phase, and an implementation and review phase, each of which set out activities to be performed over the life of the project, resulting in the Corporation’s first interim reporting under IFRS for the first quarter of 2011. The implementation phase will continue to culminate in the preparation of our financial reporting under IFRS in 2011.
Throughout 2011, we will continue to execute the final phase of our changeover plan. Activities in this respect include continuing to execute business process and internal control changes, testing internal controls impacted by our IFRS changeover in connection with our 2011 annual internal controls program, monitoring accounting and regulatory developments and evaluating impacts on our financial reporting, and continuing to fulfill presentation and reporting requirements.
1) Exemptions and exceptions from full retrospective application elected by the Corporation In preparing these condensed interim consolidated financial statements in accordance with IFRS 1, the Corporation has applied mandatory transition exceptions and the following exemptions from full retrospective application of IFRS:
IFRS 3, Business combination election: This election allows the Corporation to adopt IFRS 3(R) prospectively from the date of transition. The impact of this exemption is that all prior business combinations will continue to be accounted for as they were under Canadian GAAP.
Leases election: The exemption provided in IFRS 1 from the full retrospective application of IFRIC 4, Determining Whether an Arrangement Contains a Lease (“IFRIC 4”) has been applied to determine whether an arrangement existing as at January 1, 2010 contains a lease based on the facts and circumstances existing at that date. An additional exemption is available to the Corporation that, under Canadian GAAP, has already made an assessment as to whether an arrangement contains a lease, provided their previous conclusion is consistent with the criteria within IAS 17, Leases and IFRIC 4.
Management’s Discussion and Analysis
41
18. Transition to International Financial Reporting Standards (continued)
1) Exemptions and exceptions from full retrospective application elected by the Corporation (continued)
We have elected to apply the exemption from full retrospective application of decommissioning provisions as allowed under IFRS 1. As such, the Corporation has re-measured the provisions as at January 1, 2010 under IAS 37, Provisions, Contingent Liabilities and Contingent Assets, and estimated the amount to be included in the cost of the related asset by discounting the liability to the date at which the liability first arose. The Corporation did this using the best estimate of the historical risk-adjusted discount rates, and recalculated the accumulated depreciation, depletion and depreciation under IFRS up to the transition date. No transitional adjustment was recorded.
We elected under IFRS 1 not to apply IFRS 2, Share-based payments (“IFRS 2”), to all equity instruments of share-based payments that had vested at the transition date. Further, we elected not to apply IFRS 2 for all cash-settled share-based payments that were settled before the transition date.
We elected to apply IAS 23, Borrowing costs prospectively from the date of transition, therefore the accounting of borrowing costs prior to the transition date was not reassessed in the opening IFRS consolidated statement of financial position.
Non-controlling interests: According to this exception we must, prospectively from the date of transition to IFRS, attributed the Corporation’s total comprehensive income to the shareholders of the Corporation as well as to the non-controlling interests even if this results in the non-controlling interests having a deficit balance.
Estimates: Hindsight is not used to create or revise estimates. The estimates previously made by the management of the Corporation under Canadian GAAP were not revised for the application of IFRS except where necessary to reflect any difference in accounting policies.
2) Reconciliation of IFRS and Canadian GAAP
IFRS employs a conceptual framework that is similar to Canadian GAAP. However, significant differences exist in certain matters of recognition, measurement and disclosure. While the adoption of IFRS has not changed the Corporation’s actual cash flows, it has resulted in changes to the Corporation’s reported financial position and statement of income. In order to allow the users of the financial statements to better understand these changes, the Corporation’s Canadian GAAP consolidated statements of operations and comprehensive income for the year ended December 31, 2010 and the three and nine-month periods ended September 30, 2010 as well as the statements of financial position as at January 1, 2010, September 30, 2010 and December 31, 2010, and the consolidated statement of cash flows for the three and nine-month periods ended September 30, 2010 and for the year ended December 31, 2010 have been reconciled to IFRS, with the resulting differences explained.
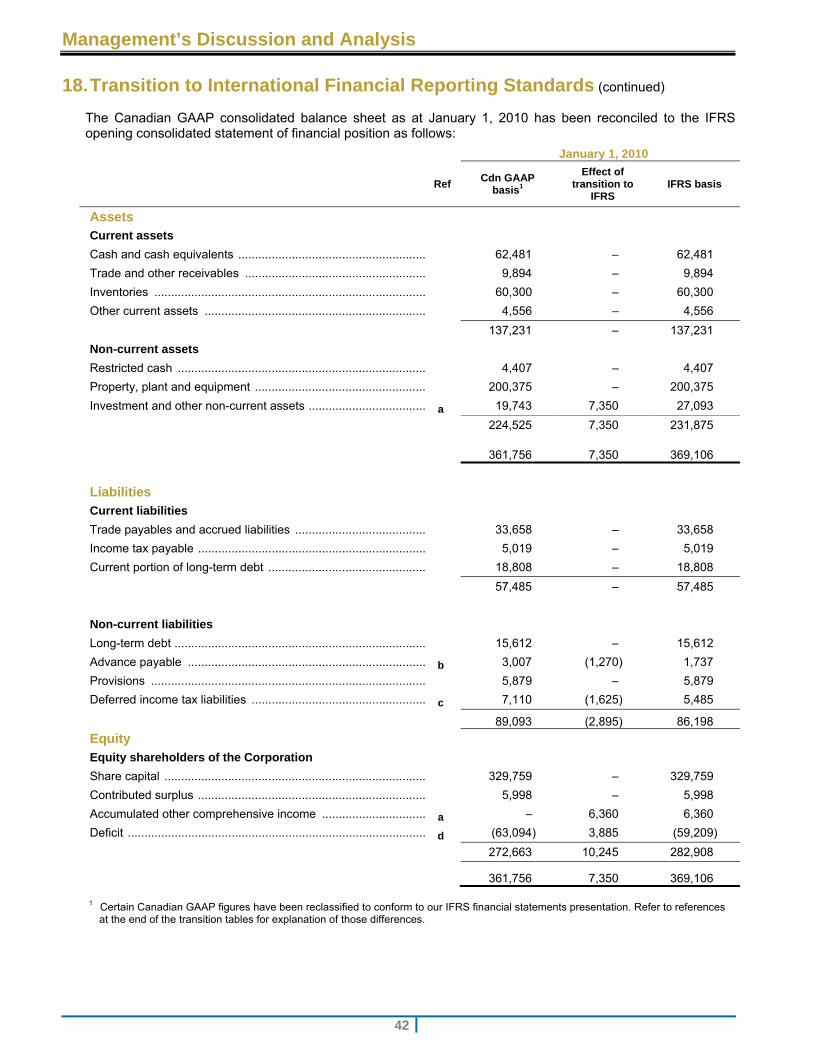
Management’s Discussion and Analysis
42
18. Transition to International Financial Reporting Standards (continued)
The Canadian GAAP consolidated balance sheet as at January 1, 2010 has been reconciled to the IFRS opening consolidated statement of financial position as follows:
January 1, 2010
Ref Cdn GAAP basis1
Effect of transition to
IFRS IFRS basis
Assets Current assets
Cash and cash equivalents ........................................................ 62,481 – 62,481
Trade and other receivables ...................................................... 9,894 – 9,894
Inventories ................................................................................. 60,300 – 60,300
Other current assets .................................................................. 4,556 – 4,556
137,231 – 137,231
Non-current assets
Restricted cash .......................................................................... 4,407 – 4,407
Property, plant and equipment ................................................... 200,375 – 200,375
Investment and other non-current assets ................................... a 19,743 7,350 27,093
224,525 7,350 231,875
361,756 7,350 369,106
Liabilities
Current liabilities
Trade payables and accrued liabilities ....................................... 33,658 – 33,658
Income tax payable .................................................................... 5,019 – 5,019
Current portion of long-term debt ............................................... 18,808 – 18,808
57,485 – 57,485
Non-current liabilities
Long-term debt ........................................................................... 15,612 – 15,612
Advance payable ....................................................................... b 3,007 (1,270) 1,737
Provisions .................................................................................. 5,879 – 5,879
Deferred income tax liabilities .................................................... c 7,110 (1,625) 5,485
89,093 (2,895) 86,198
Equity
Equity shareholders of the Corporation
Share capital .............................................................................. 329,759 – 329,759
Contributed surplus .................................................................... 5,998 – 5,998
Accumulated other comprehensive income ............................... a – 6,360 6,360
Deficit ......................................................................................... d (63,094) 3,885 (59,209)
272,663 10,245 282,908
361,756 7,350 369,106
1 Certain Canadian GAAP figures have been reclassified to conform to our IFRS financial statements presentation. Refer to references at the end of the transition tables for explanation of those differences.
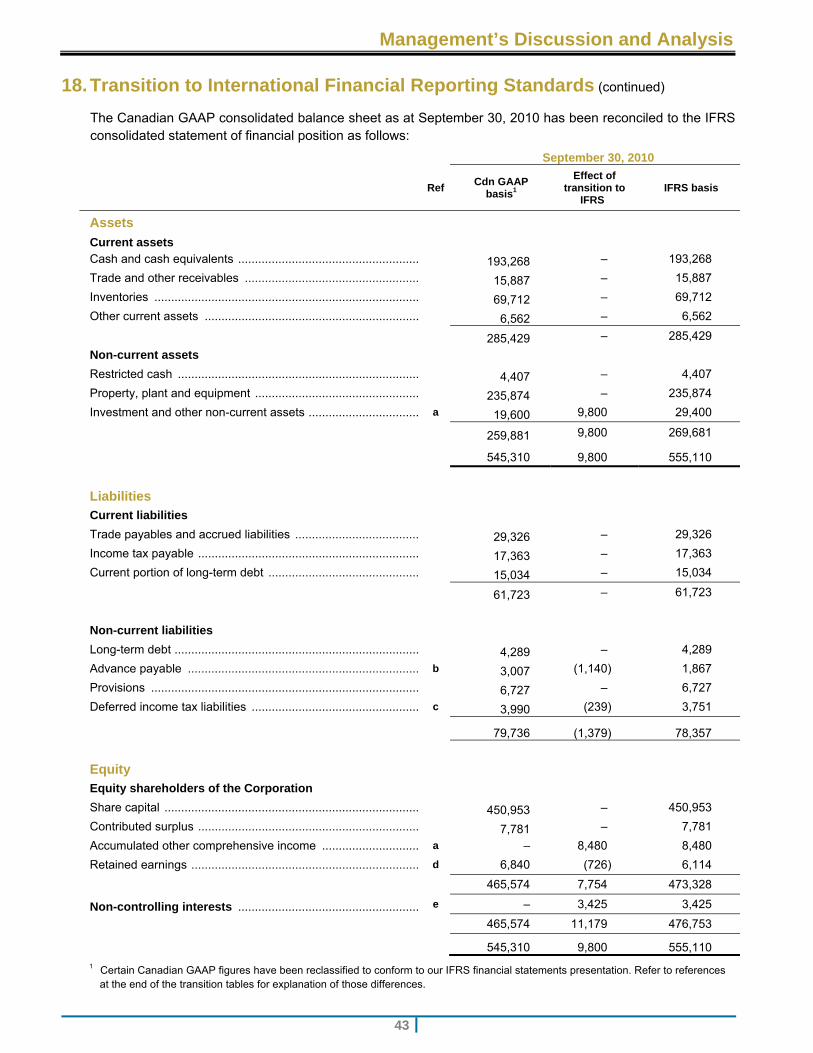
Management’s Discussion and Analysis
43
18. Transition to International Financial Reporting Standards (continued)
The Canadian GAAP consolidated balance sheet as at September 30, 2010 has been reconciled to the IFRS consolidated statement of financial position as follows:
September 30, 2010
RefCdn GAAP
basis1
Effect of transition to
IFRS IFRS basis
Assets
Current assets Cash and cash equivalents ....................................................... 193,268 ‒ 193,268
Trade and other receivables ..................................................... 15,887 ‒ 15,887
Inventories ................................................................................ 69,712 ‒ 69,712
Other current assets ................................................................. 6,562 ‒ 6,562
285,429 ‒ 285,429
Non-current assets
Restricted cash ......................................................................... 4,407 ‒ 4,407
Property, plant and equipment .................................................. 235,874 ‒ 235,874
Investment and other non-current assets .................................. a 19,600 9,800 29,400
259,881 9,800 269,681
545,310 9,800 555,110
Liabilities
Current liabilities
Trade payables and accrued liabilities ...................................... 29,326 ‒ 29,326
Income tax payable ................................................................... 17,363 ‒ 17,363
Current portion of long-term debt .............................................. 15,034 ‒ 15,034
61,723 ‒ 61,723
Non-current liabilities
Long-term debt .......................................................................... 4,289 ‒ 4,289
Advance payable ...................................................................... b 3,007 (1,140) 1,867
Provisions ................................................................................. 6,727 ‒ 6,727
Deferred income tax liabilities ................................................... c 3,990 (239) 3,751
79,736 (1,379) 78,357
Equity
Equity shareholders of the Corporation
Share capital ............................................................................. 450,953 ‒ 450,953
Contributed surplus ................................................................... 7,781 ‒ 7,781
Accumulated other comprehensive income .............................. a ‒ 8,480 8,480
Retained earnings ..................................................................... d 6,840 (726) 6,114
465,574 7,754 473,328
Non-controlling interests ....................................................... e ‒ 3,425 3,425
465,574 11,179 476,753
545,310 9,800 555,110
1 Certain Canadian GAAP figures have been reclassified to conform to our IFRS financial statements presentation. Refer to references at the end of the transition tables for explanation of those differences.
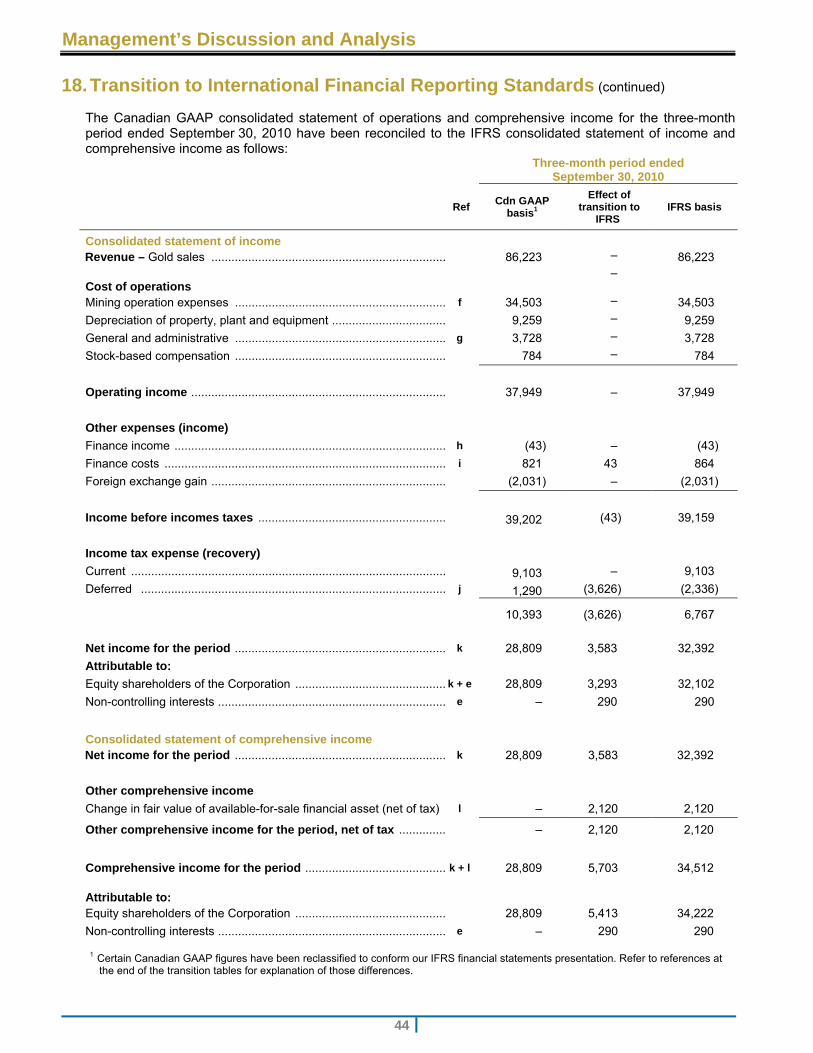
Management’s Discussion and Analysis
44
18. Transition to International Financial Reporting Standards (continued)
The Canadian GAAP consolidated statement of operations and comprehensive income for the three-month period ended September 30, 2010 have been reconciled to the IFRS consolidated statement of income and comprehensive income as follows:
Three-month period ended September 30, 2010
Ref Cdn GAAP
basis1
Effect of transition to
IFRS IFRS basis
Consolidated statement of income Revenue – Gold sales ...................................................................... 86,223 ‒ 86,223 Cost of operations
‒
Mining operation expenses ............................................................... f 34,503 ‒ 34,503
Depreciation of property, plant and equipment .................................. 9,259 ‒ 9,259
General and administrative ............................................................... g 3,728 ‒ 3,728
Stock-based compensation ............................................................... 784 ‒ 784
Operating income ............................................................................ 37,949 ‒ 37,949
Other expenses (income)
Finance income ................................................................................. h (43) ‒ (43)
Finance costs .................................................................................... i 821 43 864
Foreign exchange gain ...................................................................... (2,031) ‒ (2,031)
Income before incomes taxes ........................................................ 39,202 (43) 39,159
Income tax expense (recovery)
Current .............................................................................................. 9,103 ‒ 9,103
Deferred ........................................................................................... j 1,290 (3,626) (2,336)
10,393 (3,626) 6,767
Net income for the period ............................................................... k 28,809 3,583 32,392
Attributable to:
Equity shareholders of the Corporation ............................................. k + e 28,809 3,293 32,102
Non-controlling interests .................................................................... e ‒ 290 290
Consolidated statement of comprehensive income Net income for the period ............................................................... k 28,809 3,583 32,392
Other comprehensive income
Change in fair value of available-for-sale financial asset (net of tax) l ‒ 2,120 2,120
Other comprehensive income for the period, net of tax .............. ‒ 2,120 2,120
Comprehensive income for the period .......................................... k + l 28,809 5,703 34,512 Attributable to:
Equity shareholders of the Corporation ............................................. 28,809 5,413 34,222
Non-controlling interests .................................................................... e ‒ 290 290
1 Certain Canadian GAAP figures have been reclassified to conform our IFRS financial statements presentation. Refer to references at the end of the transition tables for explanation of those differences.
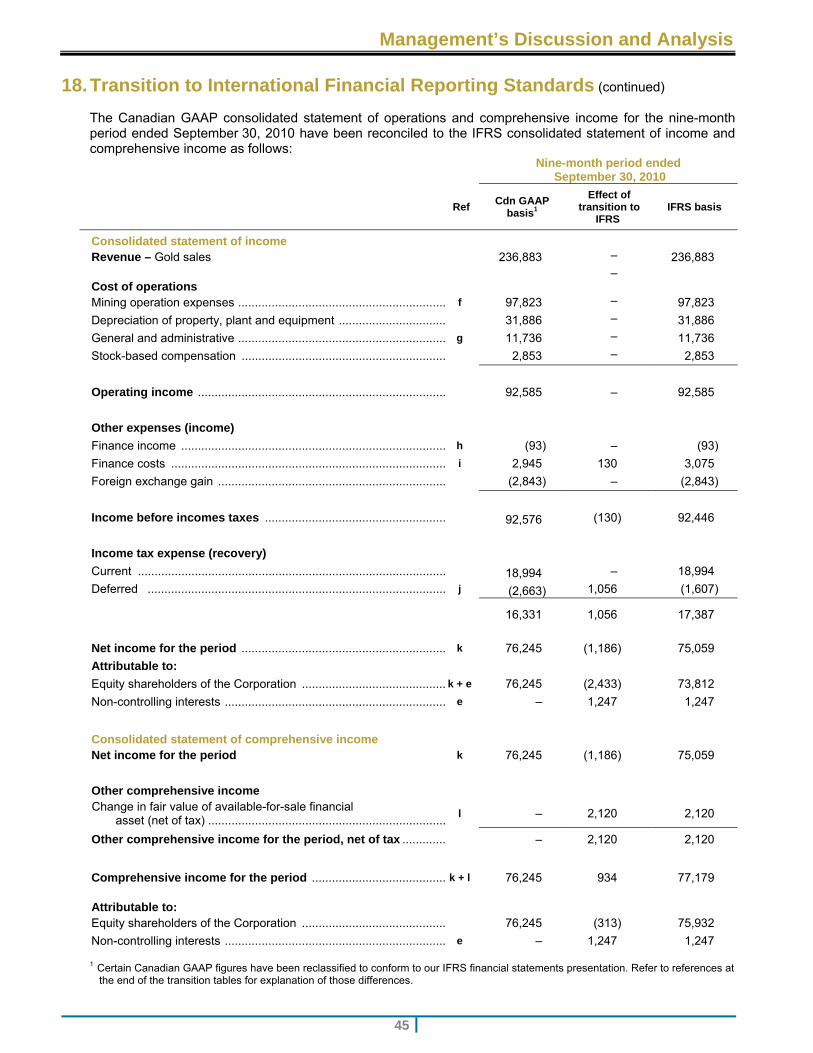
Management’s Discussion and Analysis
45
18. Transition to International Financial Reporting Standards (continued)
The Canadian GAAP consolidated statement of operations and comprehensive income for the nine-month period ended September 30, 2010 have been reconciled to the IFRS consolidated statement of income and comprehensive income as follows:
Nine-month period ended September 30, 2010
Ref Cdn GAAP
basis1
Effect of transition to
IFRS IFRS basis
Consolidated statement of income Revenue – Gold sales 236,883 ‒ 236,883 Cost of operations
‒
Mining operation expenses .............................................................. f 97,823 ‒ 97,823
Depreciation of property, plant and equipment ................................ 31,886 ‒ 31,886
General and administrative .............................................................. g 11,736 ‒ 11,736
Stock-based compensation ............................................................. 2,853 ‒ 2,853
Operating income .......................................................................... 92,585 ‒ 92,585
Other expenses (income)
Finance income ............................................................................... h (93) ‒ (93)
Finance costs .................................................................................. i 2,945 130 3,075
Foreign exchange gain .................................................................... (2,843) ‒ (2,843)
Income before incomes taxes ...................................................... 92,576 (130) 92,446
Income tax expense (recovery)
Current ............................................................................................ 18,994 ‒ 18,994
Deferred ......................................................................................... j (2,663) 1,056 (1,607)
16,331 1,056 17,387
Net income for the period ............................................................. k 76,245 (1,186) 75,059
Attributable to:
Equity shareholders of the Corporation ........................................... k + e 76,245 (2,433) 73,812
Non-controlling interests .................................................................. e ‒ 1,247 1,247
Consolidated statement of comprehensive income Net income for the period k 76,245 (1,186) 75,059
Other comprehensive income Change in fair value of available-for-sale financial
asset (net of tax) .......................................................................l ‒ 2,120 2,120
Other comprehensive income for the period, net of tax ............. ‒ 2,120 2,120
Comprehensive income for the period ........................................ k + l 76,245 934 77,179 Attributable to:
Equity shareholders of the Corporation ........................................... 76,245 (313) 75,932
Non-controlling interests .................................................................. e ‒ 1,247 1,247
1 Certain Canadian GAAP figures have been reclassified to conform to our IFRS financial statements presentation. Refer to references at the end of the transition tables for explanation of those differences.
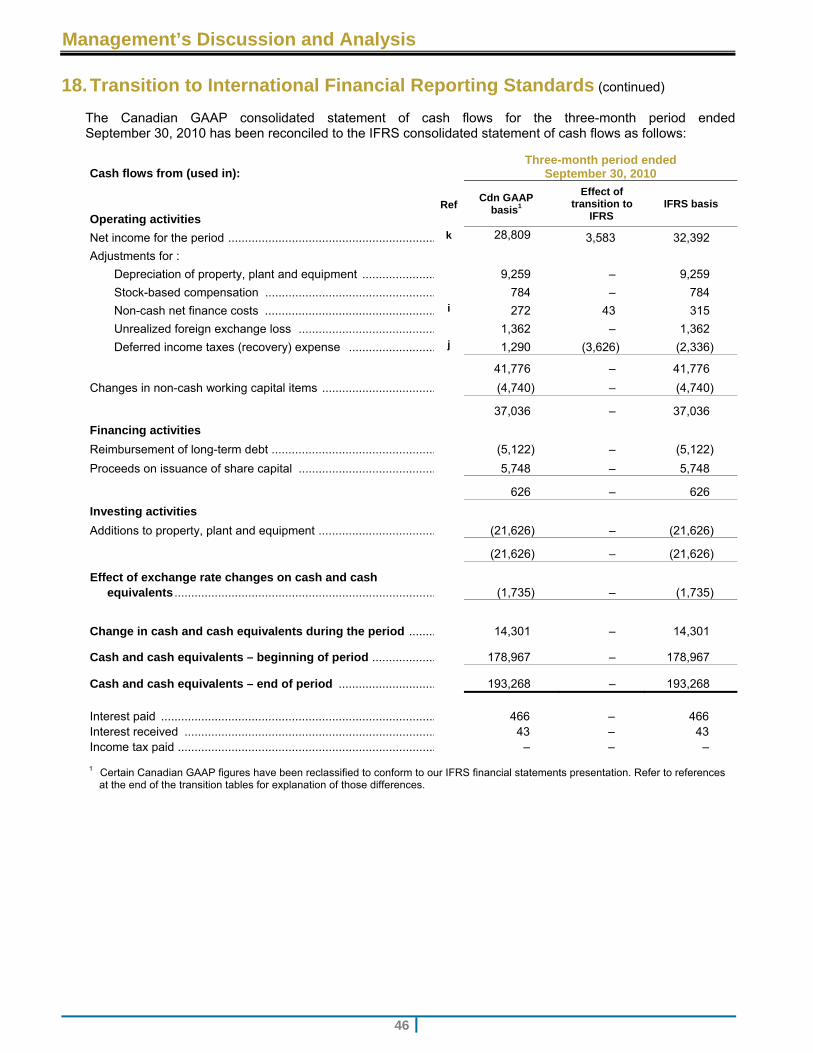
Management’s Discussion and Analysis
46
18. Transition to International Financial Reporting Standards (continued)
The Canadian GAAP consolidated statement of cash flows for the three-month period ended September 30, 2010 has been reconciled to the IFRS consolidated statement of cash flows as follows:
Cash flows from (used in): Three-month period ended
September 30, 2010
Operating activities Ref
Cdn GAAP basis1
Effect of transition to
IFRS IFRS basis
Net income for the period .............................................................. k 28,809 3,583 32,392
Adjustments for :
Depreciation of property, plant and equipment ...................... 9,259 – 9,259
Stock-based compensation ................................................... 784 – 784
Non-cash net finance costs ................................................... i 272 43 315
Unrealized foreign exchange loss ......................................... 1,362 – 1,362
Deferred income taxes (recovery) expense .......................... j 1,290 (3,626) (2,336)
41,776 – 41,776
Changes in non-cash working capital items .................................. (4,740) – (4,740)
37,036 – 37,036
Financing activities
Reimbursement of long-term debt ................................................. (5,122) – (5,122)
Proceeds on issuance of share capital ......................................... 5,748 – 5,748
626 – 626
Investing activities
Additions to property, plant and equipment ................................... (21,626) – (21,626)
(21,626) – (21,626)
Effect of exchange rate changes on cash and cash equivalents ..............................................................................
(1,735) – (1,735)
Change in cash and cash equivalents during the period ........
14,301 – 14,301
Cash and cash equivalents – beginning of period ...................
178,967 – 178,967
Cash and cash equivalents – end of period .............................
193,268 – 193,268
Interest paid .................................................................................. 466 – 466 Interest received ........................................................................... 43 – 43 Income tax paid ............................................................................. – – – 1 Certain Canadian GAAP figures have been reclassified to conform to our IFRS financial statements presentation. Refer to references
at the end of the transition tables for explanation of those differences.
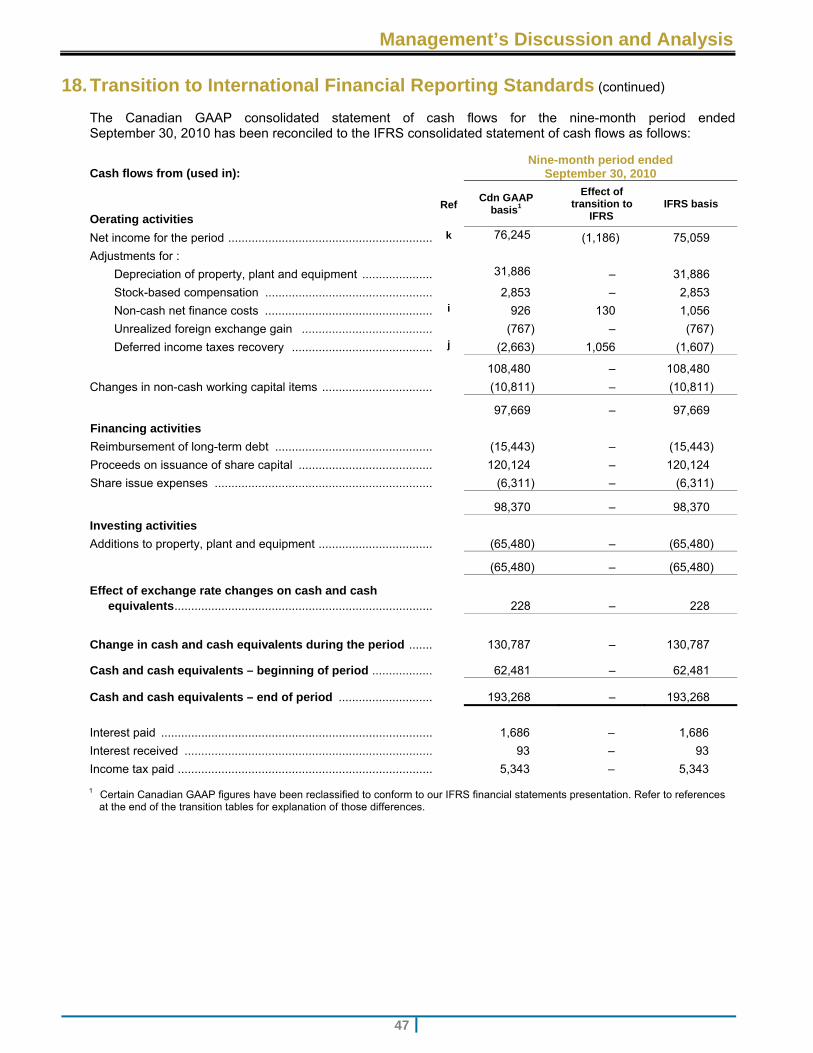
Management’s Discussion and Analysis
47
18. Transition to International Financial Reporting Standards (continued)
The Canadian GAAP consolidated statement of cash flows for the nine-month period ended September 30, 2010 has been reconciled to the IFRS consolidated statement of cash flows as follows:
Cash flows from (used in): Nine-month period ended
September 30, 2010
Oerating activities Ref
Cdn GAAP basis1
Effect of transition to
IFRS IFRS basis
Net income for the period .............................................................. k 76,245 (1,186) 75,059
Adjustments for :
Depreciation of property, plant and equipment ...................... 31,886 – 31,886
Stock-based compensation ................................................... 2,853 – 2,853
Non-cash net finance costs ................................................... i 926 130 1,056
Unrealized foreign exchange gain ........................................ (767) – (767)
Deferred income taxes recovery ........................................... j (2,663) 1,056 (1,607)
108,480 – 108,480
Changes in non-cash working capital items .................................. (10,811) – (10,811)
97,669 – 97,669
Financing activities
Reimbursement of long-term debt ................................................ (15,443) – (15,443)
Proceeds on issuance of share capital ......................................... 120,124 – 120,124
Share issue expenses .................................................................. (6,311) – (6,311)
98,370 – 98,370
Investing activities
Additions to property, plant and equipment ................................... (65,480) – (65,480)
(65,480) – (65,480)
Effect of exchange rate changes on cash and cash equivalents ..............................................................................
228 – 228
Change in cash and cash equivalents during the period ........
130,787 – 130,787
Cash and cash equivalents – beginning of period ...................
62,481 – 62,481
Cash and cash equivalents – end of period .............................
193,268 – 193,268
Interest paid .................................................................................. 1,686 – 1,686
Interest received ........................................................................... 93 – 93
Income tax paid ............................................................................. 5,343 – 5,343 1 Certain Canadian GAAP figures have been reclassified to conform to our IFRS financial statements presentation. Refer to references
at the end of the transition tables for explanation of those differences.
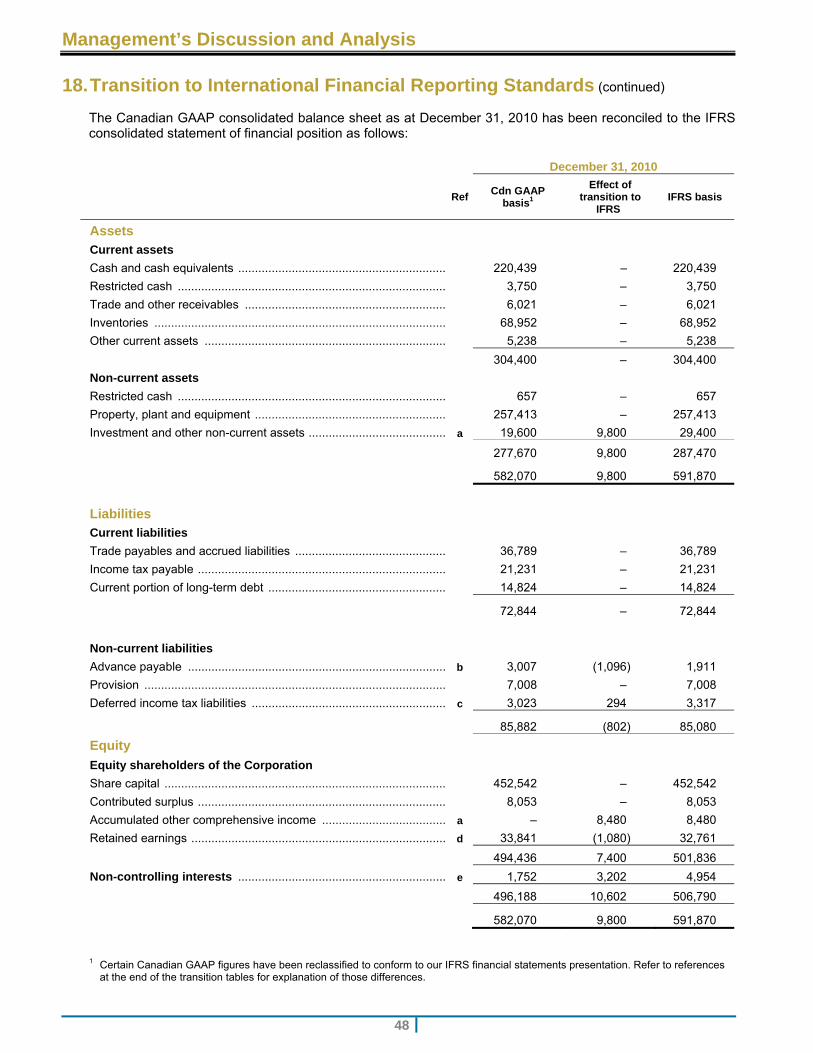
Management’s Discussion and Analysis
48
18. Transition to International Financial Reporting Standards (continued)
The Canadian GAAP consolidated balance sheet as at December 31, 2010 has been reconciled to the IFRS consolidated statement of financial position as follows:
December 31, 2010
RefCdn GAAP
basis1
Effect of transition to
IFRS IFRS basis
Assets
Current assets
Cash and cash equivalents .............................................................. 220,439 – 220,439
Restricted cash ................................................................................ 3,750 – 3,750
Trade and other receivables ............................................................ 6,021 – 6,021
Inventories ....................................................................................... 68,952 – 68,952
Other current assets ........................................................................ 5,238 – 5,238
304,400 – 304,400
Non-current assets
Restricted cash ................................................................................ 657 – 657
Property, plant and equipment ......................................................... 257,413 – 257,413
Investment and other non-current assets ......................................... a 19,600 9,800 29,400
277,670 9,800 287,470
582,070 9,800 591,870
Liabilities Current liabilities
Trade payables and accrued liabilities ............................................. 36,789 – 36,789
Income tax payable .......................................................................... 21,231 – 21,231
Current portion of long-term debt ..................................................... 14,824 – 14,824
72,844 – 72,844
Non-current liabilities
Advance payable ............................................................................. b 3,007 (1,096) 1,911
Provision .......................................................................................... 7,008 – 7,008
Deferred income tax liabilities .......................................................... c 3,023 294 3,317
85,882 (802) 85,080
Equity
Equity shareholders of the Corporation
Share capital .................................................................................... 452,542 – 452,542
Contributed surplus .......................................................................... 8,053 – 8,053
Accumulated other comprehensive income ..................................... a – 8,480 8,480
Retained earnings ............................................................................ d 33,841 (1,080) 32,761
494,436 7,400 501,836
Non-controlling interests .............................................................. e 1,752 3,202 4,954
496,188 10,602 506,790
582,070 9,800 591,870
1 Certain Canadian GAAP figures have been reclassified to conform to our IFRS financial statements presentation. Refer to references at the end of the transition tables for explanation of those differences.
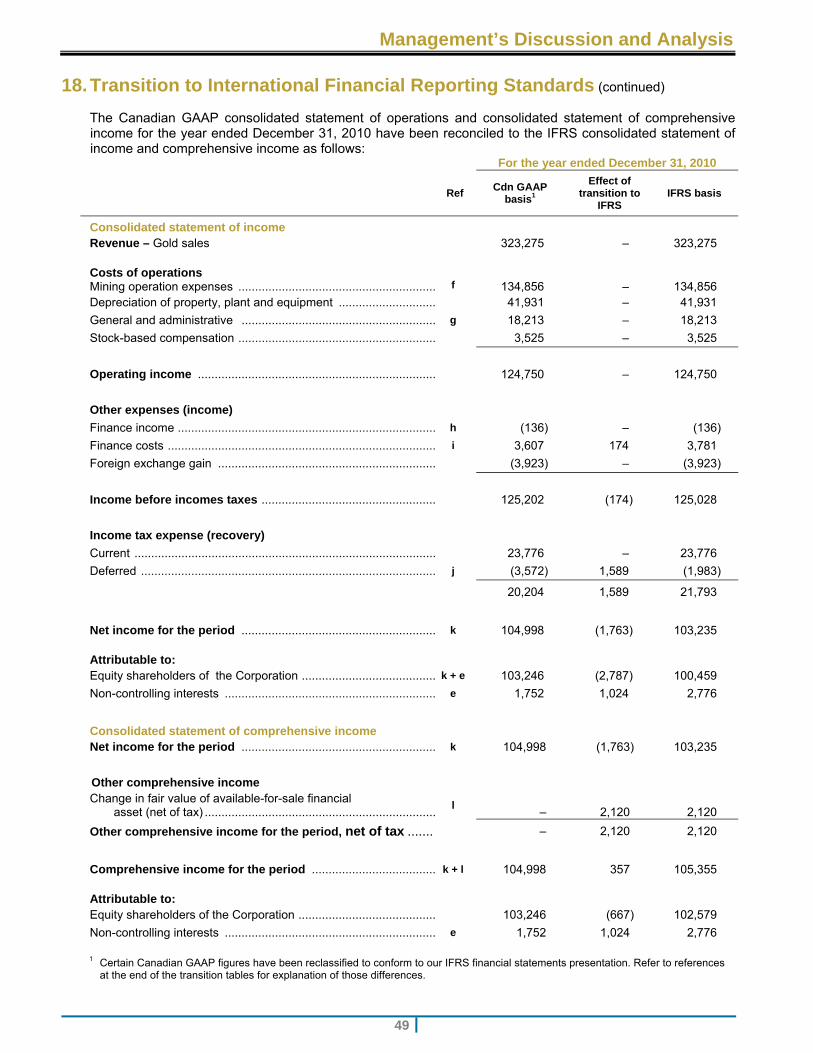
Management’s Discussion and Analysis
49
18. Transition to International Financial Reporting Standards (continued)
The Canadian GAAP consolidated statement of operations and consolidated statement of comprehensive income for the year ended December 31, 2010 have been reconciled to the IFRS consolidated statement of income and comprehensive income as follows:
For the year ended December 31, 2010
Ref Cdn GAAP
basis1
Effect of transition to
IFRS IFRS basis
Consolidated statement of income Revenue – Gold sales 323,275 ‒ 323,275 Costs of operations Mining operation expenses ...........................................................
f
134,856
‒
134,856 Depreciation of property, plant and equipment ............................. 41,931 ‒ 41,931
General and administrative .......................................................... g 18,213 ‒ 18,213
Stock-based compensation ........................................................... 3,525 ‒ 3,525
Operating income ....................................................................... 124,750 ‒ 124,750
Other expenses (income)
Finance income ............................................................................. h (136) ‒ (136)
Finance costs ................................................................................ i 3,607 174 3,781
Foreign exchange gain ................................................................. (3,923) ‒ (3,923)
Income before incomes taxes .................................................... 125,202 (174) 125,028
Income tax expense (recovery)
Current .......................................................................................... 23,776 ‒ 23,776
Deferred ........................................................................................ j (3,572) 1,589 (1,983)
20,204 1,589 21,793
Net income for the period .......................................................... k 104,998 (1,763) 103,235 Attributable to: Equity shareholders of the Corporation ........................................ k + e 103,246 (2,787) 100,459
Non-controlling interests ............................................................... e 1,752 1,024 2,776
Consolidated statement of comprehensive income
Net income for the period .......................................................... k 104,998 (1,763) 103,235
Other comprehensive income Change in fair value of available-for-sale financial
asset (net of tax) .....................................................................l
‒ 2,120 2,120
Other comprehensive income for the period, net of tax ........ ‒ 2,120 2,120
Comprehensive income for the period ..................................... k + l 104,998 357 105,355 Attributable to:
Equity shareholders of the Corporation ......................................... 103,246 (667) 102,579
Non-controlling interests ............................................................... e 1,752 1,024 2,776
1 Certain Canadian GAAP figures have been reclassified to conform to our IFRS financial statements presentation. Refer to references at the end of the transition tables for explanation of those differences.
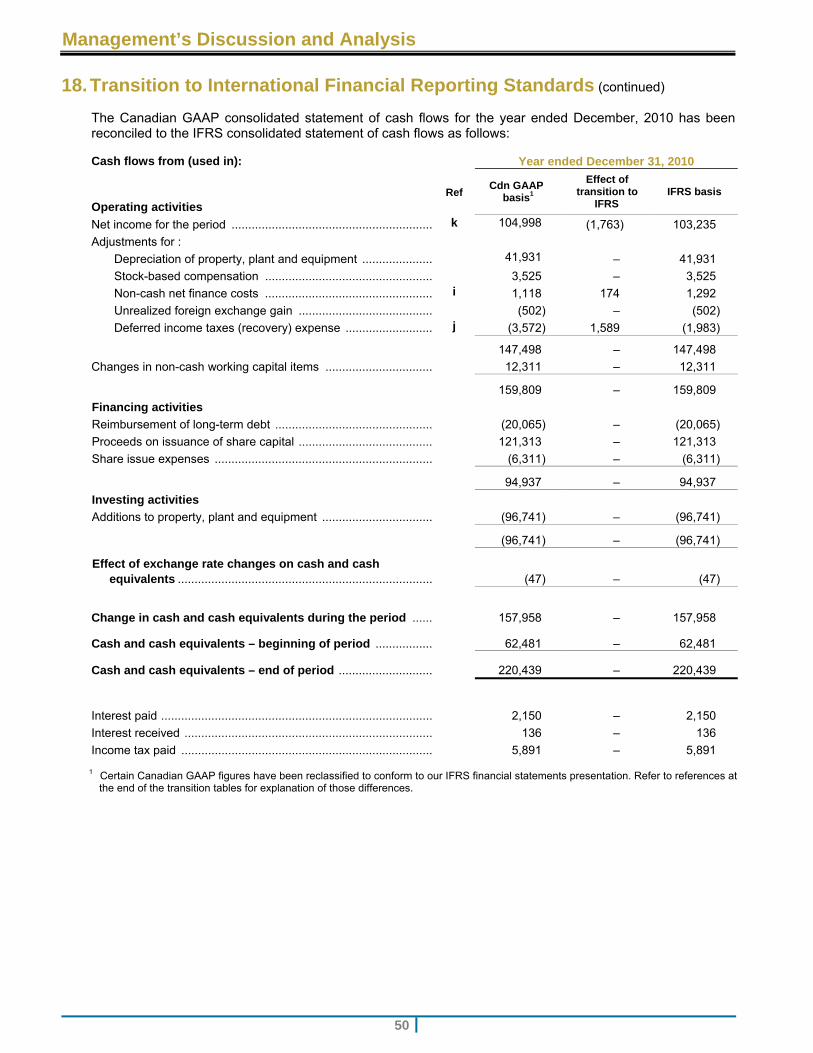
Management’s Discussion and Analysis
50
18. Transition to International Financial Reporting Standards (continued)
The Canadian GAAP consolidated statement of cash flows for the year ended December, 2010 has been reconciled to the IFRS consolidated statement of cash flows as follows:
Cash flows from (used in):
Year ended December 31, 2010
Operating activities Ref
Cdn GAAP basis1
Effect of transition to
IFRS IFRS basis
Net income for the period ............................................................. k 104,998 (1,763) 103,235
Adjustments for :
Depreciation of property, plant and equipment ...................... 41,931 – 41,931
Stock-based compensation ................................................... 3,525 – 3,525
Non-cash net finance costs ................................................... i 1,118 174 1,292
Unrealized foreign exchange gain ......................................... (502) – (502)
Deferred income taxes (recovery) expense ........................... j (3,572) 1,589 (1,983)
147,498 – 147,498
Changes in non-cash working capital items ................................. 12,311 – 12,311
159,809 – 159,809
Financing activities
Reimbursement of long-term debt ................................................ (20,065) – (20,065)
Proceeds on issuance of share capital ......................................... 121,313 – 121,313
Share issue expenses .................................................................. (6,311) – (6,311)
94,937 – 94,937
Investing activities
Additions to property, plant and equipment .................................. (96,741) – (96,741)
(96,741) – (96,741)
Effect of exchange rate changes on cash and cash equivalents .............................................................................
(47) – (47)
Change in cash and cash equivalents during the period .......
157,958 – 157,958
Cash and cash equivalents – beginning of period ..................
62,481 – 62,481
Cash and cash equivalents – end of period .............................
220,439 – 220,439
Interest paid .................................................................................. 2,150 – 2,150
Interest received ........................................................................... 136 – 136
Income tax paid ............................................................................ 5,891 – 5,891
1 Certain Canadian GAAP figures have been reclassified to conform to our IFRS financial statements presentation. Refer to references at the end of the transition tables for explanation of those differences.
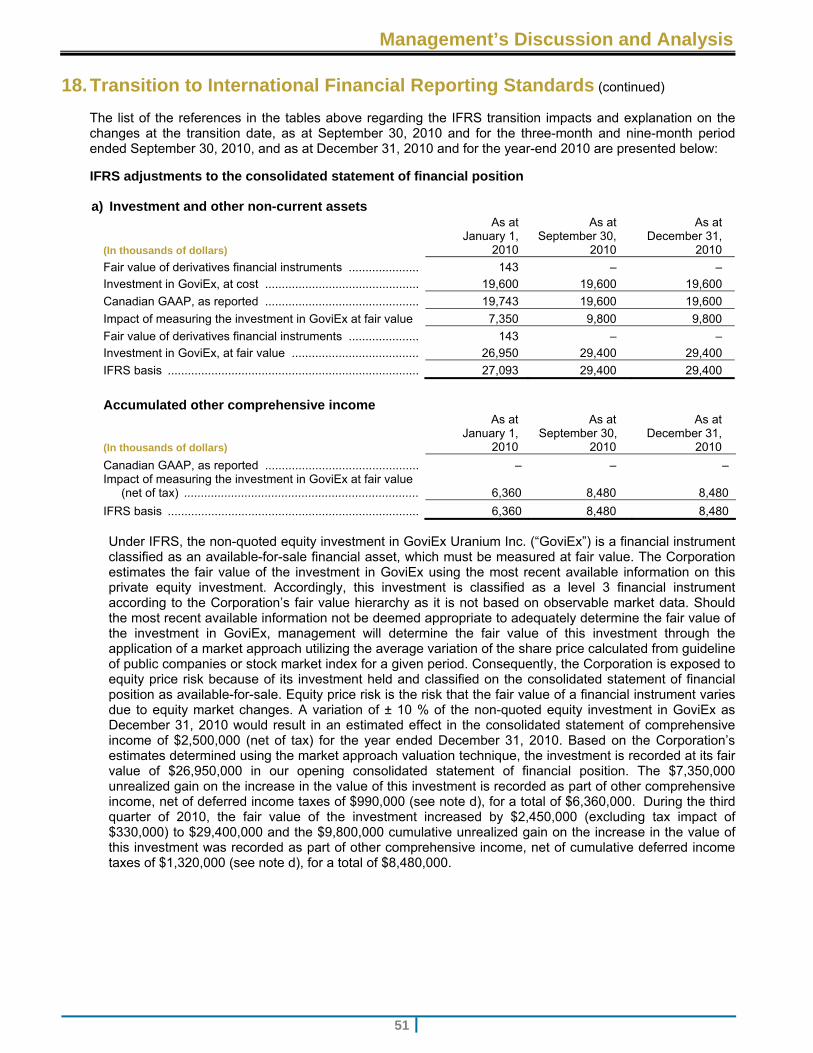
Management’s Discussion and Analysis
51
18. Transition to International Financial Reporting Standards (continued)
The list of the references in the tables above regarding the IFRS transition impacts and explanation on the changes at the transition date, as at September 30, 2010 and for the three-month and nine-month period ended September 30, 2010, and as at December 31, 2010 and for the year-end 2010 are presented below:
IFRS adjustments to the consolidated statement of financial position a) Investment and other non-current assets
(In thousands of dollars)
As at January 1,
2010
As at September 30,
2010
As at December 31,
2010
Fair value of derivatives financial instruments ..................... 143 ‒ ‒
Investment in GoviEx, at cost .............................................. 19,600 19,600 19,600
Canadian GAAP, as reported .............................................. 19,743 19,600 19,600
Impact of measuring the investment in GoviEx at fair value 7,350 9,800 9,800
Fair value of derivatives financial instruments ..................... 143 ‒ ‒
Investment in GoviEx, at fair value ...................................... 26,950 29,400 29,400
IFRS basis ........................................................................... 27,093 29,400 29,400
Accumulated other comprehensive income
(In thousands of dollars)
As at January 1,
2010
As at September 30,
2010
As at December 31,
2010
Canadian GAAP, as reported .............................................. ‒ ‒ ‒ Impact of measuring the investment in GoviEx at fair value
(net of tax) ...................................................................... 6,360 8,480 8,480
IFRS basis ........................................................................... 6,360 8,480 8,480
Under IFRS, the non-quoted equity investment in GoviEx Uranium Inc. (“GoviEx”) is a financial instrument classified as an available-for-sale financial asset, which must be measured at fair value. The Corporation estimates the fair value of the investment in GoviEx using the most recent available information on this private equity investment. Accordingly, this investment is classified as a level 3 financial instrument according to the Corporation’s fair value hierarchy as it is not based on observable market data. Should the most recent available information not be deemed appropriate to adequately determine the fair value of the investment in GoviEx, management will determine the fair value of this investment through the application of a market approach utilizing the average variation of the share price calculated from guideline of public companies or stock market index for a given period. Consequently, the Corporation is exposed to equity price risk because of its investment held and classified on the consolidated statement of financial position as available-for-sale. Equity price risk is the risk that the fair value of a financial instrument varies due to equity market changes. A variation of ± 10 % of the non-quoted equity investment in GoviEx as December 31, 2010 would result in an estimated effect in the consolidated statement of comprehensive income of $2,500,000 (net of tax) for the year ended December 31, 2010. Based on the Corporation’s estimates determined using the market approach valuation technique, the investment is recorded at its fair value of $26,950,000 in our opening consolidated statement of financial position. The $7,350,000 unrealized gain on the increase in the value of this investment is recorded as part of other comprehensive income, net of deferred income taxes of $990,000 (see note d), for a total of $6,360,000. During the third quarter of 2010, the fair value of the investment increased by $2,450,000 (excluding tax impact of $330,000) to $29,400,000 and the $9,800,000 cumulative unrealized gain on the increase in the value of this investment was recorded as part of other comprehensive income, net of cumulative deferred income taxes of $1,320,000 (see note d), for a total of $8,480,000.
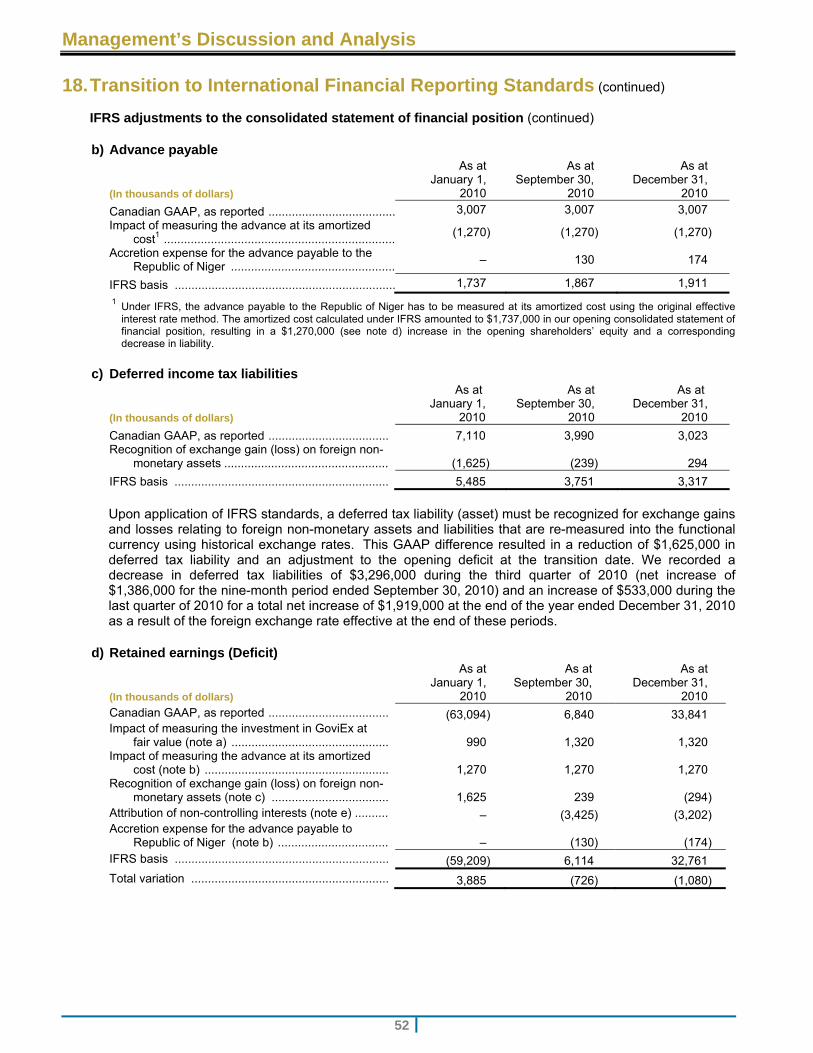
Management’s Discussion and Analysis
52
18. Transition to International Financial Reporting Standards (continued)
IFRS adjustments to the consolidated statement of financial position (continued)
b) Advance payable
(In thousands of dollars)
As at January 1,
2010
As at September 30,
2010
As at December 31,
2010
Canadian GAAP, as reported ...................................... 3,007 3,007 3,007 Impact of measuring the advance at its amortized
cost1 .....................................................................(1,270) (1,270) (1,270)
Accretion expense for the advance payable to the Republic of Niger .................................................
– 130 174
IFRS basis .................................................................. 1,737 1,867 1,911
1 Under IFRS, the advance payable to the Republic of Niger has to be measured at its amortized cost using the original effective interest rate method. The amortized cost calculated under IFRS amounted to $1,737,000 in our opening consolidated statement of financial position, resulting in a $1,270,000 (see note d) increase in the opening shareholders’ equity and a corresponding decrease in liability.
c) Deferred income tax liabilities
(In thousands of dollars)
As at January 1,
2010
As at September 30,
2010
As at December 31,
2010
Canadian GAAP, as reported .................................... 7,110 3,990 3,023 Recognition of exchange gain (loss) on foreign non-
monetary assets ................................................. (1,625) (239) 294
IFRS basis ................................................................ 5,485 3,751 3,317
Upon application of IFRS standards, a deferred tax liability (asset) must be recognized for exchange gains and losses relating to foreign non-monetary assets and liabilities that are re-measured into the functional currency using historical exchange rates. This GAAP difference resulted in a reduction of $1,625,000 in deferred tax liability and an adjustment to the opening deficit at the transition date. We recorded a decrease in deferred tax liabilities of $3,296,000 during the third quarter of 2010 (net increase of $1,386,000 for the nine-month period ended September 30, 2010) and an increase of $533,000 during the last quarter of 2010 for a total net increase of $1,919,000 at the end of the year ended December 31, 2010 as a result of the foreign exchange rate effective at the end of these periods.
d) Retained earnings (Deficit)
(In thousands of dollars)
As at January 1,
2010
As at September 30,
2010
As at December 31,
2010 Canadian GAAP, as reported .................................... (63,094) 6,840 33,841 Impact of measuring the investment in GoviEx at
fair value (note a) ............................................... 990 1,320 1,320 Impact of measuring the advance at its amortized
cost (note b) ....................................................... 1,270 1,270 1,270 Recognition of exchange gain (loss) on foreign non-
monetary assets (note c) ................................... 1,625 239 (294) Attribution of non-controlling interests (note e) .......... – (3,425) (3,202) Accretion expense for the advance payable to
Republic of Niger (note b) ................................. – (130) (174) IFRS basis ................................................................ (59,209) 6,114 32,761
Total variation ........................................................... 3,885 (726) (1,080)
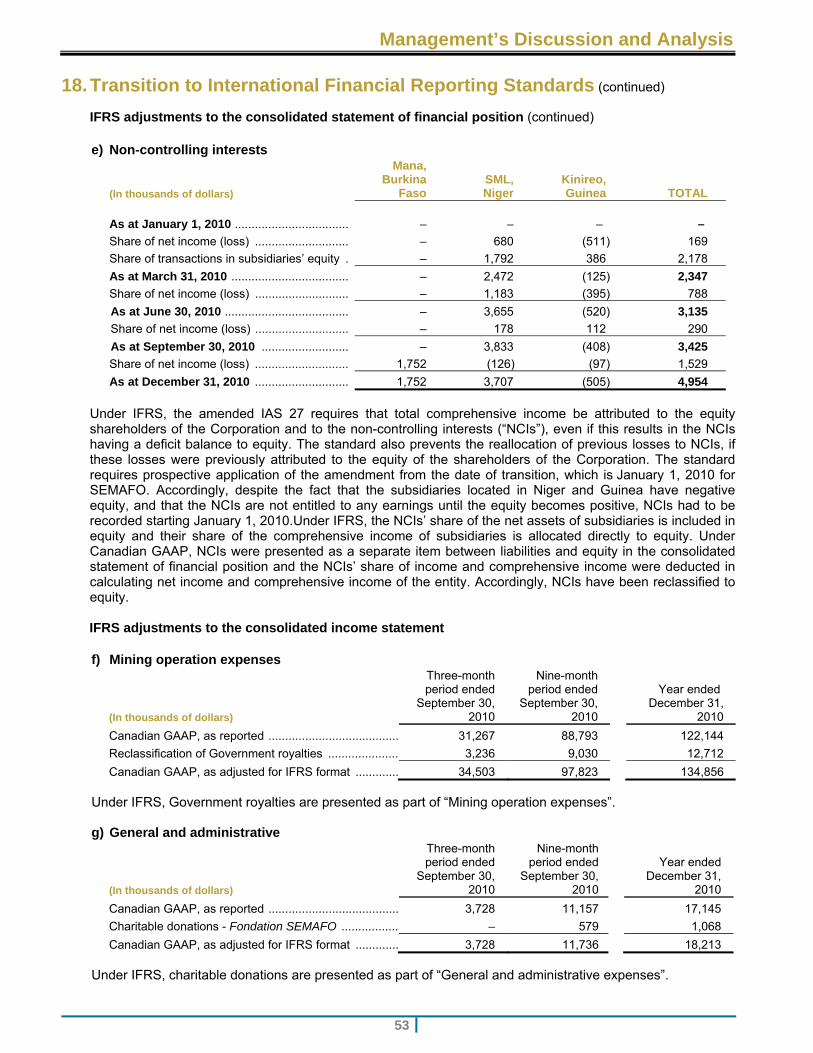
Management’s Discussion and Analysis
53
18. Transition to International Financial Reporting Standards (continued) IFRS adjustments to the consolidated statement of financial position (continued)
e) Non-controlling interests
(In thousands of dollars)
Mana, Burkina
Faso SML, Niger
Kinireo, Guinea TOTAL
As at January 1, 2010 .................................. – – – –
Share of net income (loss) ............................ – 680 (511) 169
Share of transactions in subsidiaries’ equity . – 1,792 386 2,178
As at March 31, 2010 ................................... – 2,472 (125) 2,347
Share of net income (loss) ............................ – 1,183 (395) 788
As at June 30, 2010 ..................................... – 3,655 (520) 3,135
Share of net income (loss) ............................ – 178 112 290
As at September 30, 2010 .......................... – 3,833 (408) 3,425
Share of net income (loss) ............................ 1,752 (126) (97) 1,529
As at December 31, 2010 ............................ 1,752 3,707 (505) 4,954
Under IFRS, the amended IAS 27 requires that total comprehensive income be attributed to the equity shareholders of the Corporation and to the non-controlling interests (“NCIs”), even if this results in the NCIs having a deficit balance to equity. The standard also prevents the reallocation of previous losses to NCIs, if these losses were previously attributed to the equity of the shareholders of the Corporation. The standard requires prospective application of the amendment from the date of transition, which is January 1, 2010 for SEMAFO. Accordingly, despite the fact that the subsidiaries located in Niger and Guinea have negative equity, and that the NCIs are not entitled to any earnings until the equity becomes positive, NCIs had to be recorded starting January 1, 2010.Under IFRS, the NCIs’ share of the net assets of subsidiaries is included in equity and their share of the comprehensive income of subsidiaries is allocated directly to equity. Under Canadian GAAP, NCIs were presented as a separate item between liabilities and equity in the consolidated statement of financial position and the NCIs’ share of income and comprehensive income were deducted in calculating net income and comprehensive income of the entity. Accordingly, NCIs have been reclassified to equity. IFRS adjustments to the consolidated income statement f) Mining operation expenses
(In thousands of dollars)
Three-month period ended
September 30, 2010
Nine-month period ended
September 30, 2010
Year ended December 31,
2010
Canadian GAAP, as reported ....................................... 31,267 88,793 122,144
Reclassification of Government royalties ..................... 3,236 9,030 12,712
Canadian GAAP, as adjusted for IFRS format ............. 34,503 97,823 134,856
Under IFRS, Government royalties are presented as part of “Mining operation expenses”. g) General and administrative
(In thousands of dollars)
Three-month period ended
September 30, 2010
Nine-month period ended
September 30, 2010
Year ended
December 31, 2010
Canadian GAAP, as reported ....................................... 3,728 11,157 17,145
Charitable donations - Fondation SEMAFO ................. – 579 1,068
Canadian GAAP, as adjusted for IFRS format ............. 3,728 11,736 18,213
Under IFRS, charitable donations are presented as part of “General and administrative expenses”.
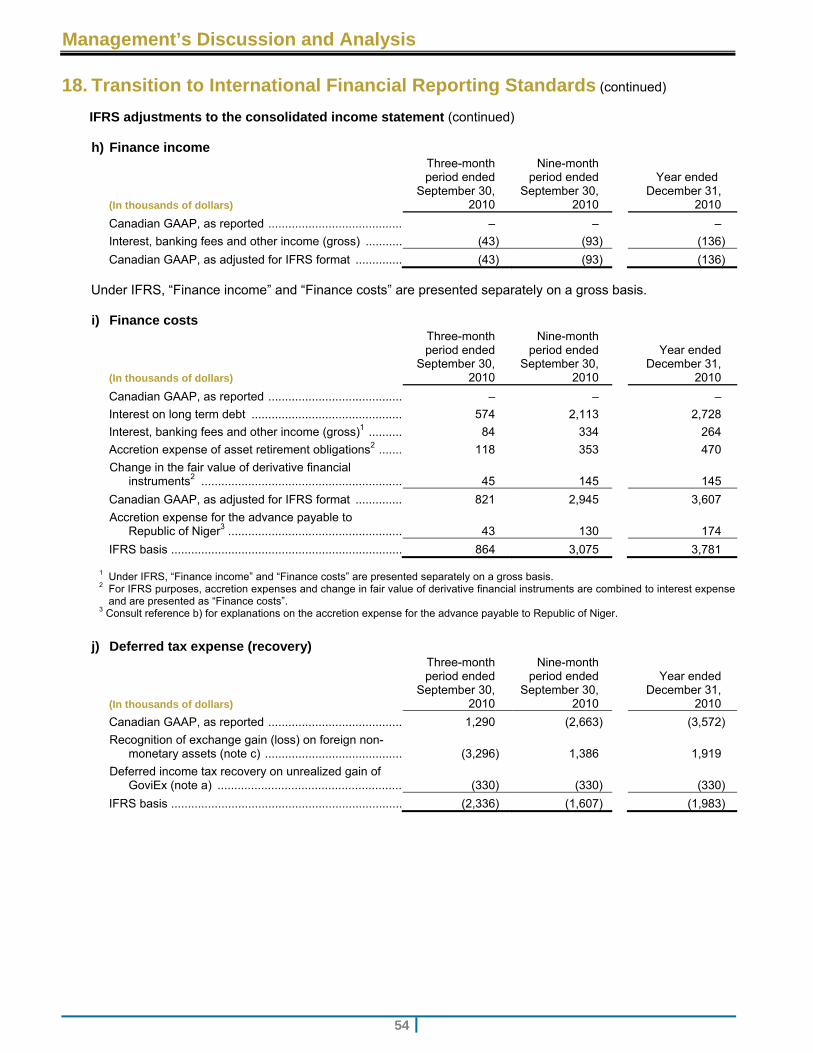
Management’s Discussion and Analysis
54
18. Transition to International Financial Reporting Standards (continued)
IFRS adjustments to the consolidated income statement (continued)
h) Finance income
(In thousands of dollars)
Three-month period ended
September 30, 2010
Nine-month period ended
September 30, 2010
Year ended December 31,
2010
Canadian GAAP, as reported ........................................ – – –
Interest, banking fees and other income (gross) ........... (43) (93) (136)
Canadian GAAP, as adjusted for IFRS format .............. (43) (93) (136)
Under IFRS, “Finance income” and “Finance costs” are presented separately on a gross basis.
i) Finance costs
(In thousands of dollars)
Three-month period ended
September 30, 2010
Nine-month period ended
September 30, 2010
Year ended December 31,
2010
Canadian GAAP, as reported ........................................ – – –
Interest on long term debt ............................................. 574 2,113 2,728
Interest, banking fees and other income (gross)1 .......... 84 334 264
Accretion expense of asset retirement obligations2 ....... 118 353 470
Change in the fair value of derivative financial instruments2 ............................................................ 45 145 145
Canadian GAAP, as adjusted for IFRS format .............. 821 2,945 3,607
Accretion expense for the advance payable to Republic of Niger3 .................................................... 43 130 174
IFRS basis ..................................................................... 864 3,075 3,781
1 Under IFRS, “Finance income” and “Finance costs” are presented separately on a gross basis. 2 For IFRS purposes, accretion expenses and change in fair value of derivative financial instruments are combined to interest expense
and are presented as “Finance costs”. 3 Consult reference b) for explanations on the accretion expense for the advance payable to Republic of Niger.
j) Deferred tax expense (recovery)
(In thousands of dollars)
Three-month period ended
September 30, 2010
Nine-month period ended
September 30, 2010
Year ended December 31,
2010
Canadian GAAP, as reported ........................................ 1,290 (2,663) (3,572)
Recognition of exchange gain (loss) on foreign non-monetary assets (note c) ......................................... (3,296) 1,386 1,919
Deferred income tax recovery on unrealized gain of GoviEx (note a) ....................................................... (330) (330) (330)
IFRS basis ..................................................................... (2,336) (1,607) (1,983)
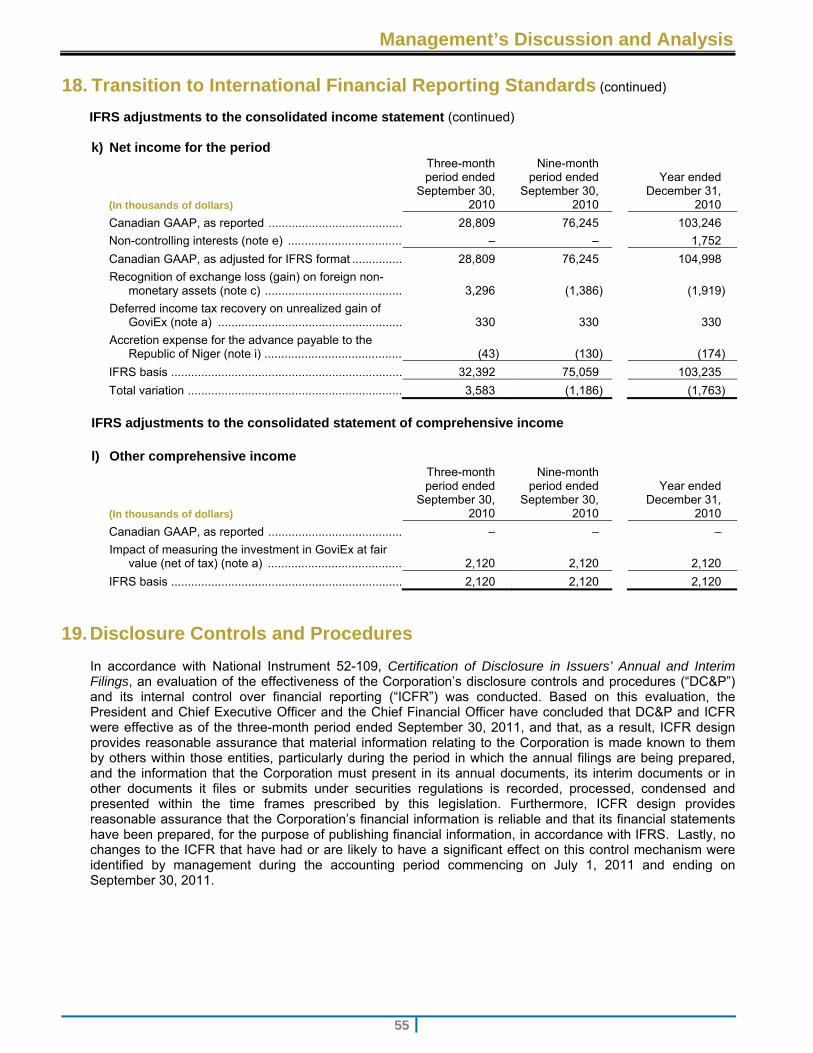
Management’s Discussion and Analysis
55
18. Transition to International Financial Reporting Standards (continued)
IFRS adjustments to the consolidated income statement (continued)
k) Net income for the period
(In thousands of dollars)
Three-month period ended
September 30, 2010
Nine-month period ended
September 30, 2010
Year ended December 31,
2010
Canadian GAAP, as reported ........................................ 28,809 76,245 103,246
Non-controlling interests (note e) .................................. – – 1,752
Canadian GAAP, as adjusted for IFRS format ............... 28,809 76,245 104,998
Recognition of exchange loss (gain) on foreign non-monetary assets (note c) ......................................... 3,296 (1,386) (1,919)
Deferred income tax recovery on unrealized gain of GoviEx (note a) ....................................................... 330 330 330
Accretion expense for the advance payable to the Republic of Niger (note i) ......................................... (43) (130) (174)
IFRS basis ..................................................................... 32,392 75,059 103,235
Total variation ................................................................ 3,583 (1,186) (1,763)
IFRS adjustments to the consolidated statement of comprehensive income
l) Other comprehensive income
(In thousands of dollars)
Three-month period ended
September 30, 2010
Nine-month period ended
September 30, 2010
Year ended December 31,
2010
Canadian GAAP, as reported ........................................ – – ‒
Impact of measuring the investment in GoviEx at fair value (net of tax) (note a) ........................................ 2,120 2,120 2,120
IFRS basis ..................................................................... 2,120 2,120 2,120
19. Disclosure Controls and Procedures
In accordance with National Instrument 52-109, Certification of Disclosure in Issuers’ Annual and Interim Filings, an evaluation of the effectiveness of the Corporation’s disclosure controls and procedures (“DC&P”) and its internal control over financial reporting (“ICFR”) was conducted. Based on this evaluation, the President and Chief Executive Officer and the Chief Financial Officer have concluded that DC&P and ICFR were effective as of the three-month period ended September 30, 2011, and that, as a result, ICFR design provides reasonable assurance that material information relating to the Corporation is made known to them by others within those entities, particularly during the period in which the annual filings are being prepared, and the information that the Corporation must present in its annual documents, its interim documents or in other documents it files or submits under securities regulations is recorded, processed, condensed and presented within the time frames prescribed by this legislation. Furthermore, ICFR design provides reasonable assurance that the Corporation’s financial information is reliable and that its financial statements have been prepared, for the purpose of publishing financial information, in accordance with IFRS. Lastly, no changes to the ICFR that have had or are likely to have a significant effect on this control mechanism were identified by management during the accounting period commencing on July 1, 2011 and ending on September 30, 2011.
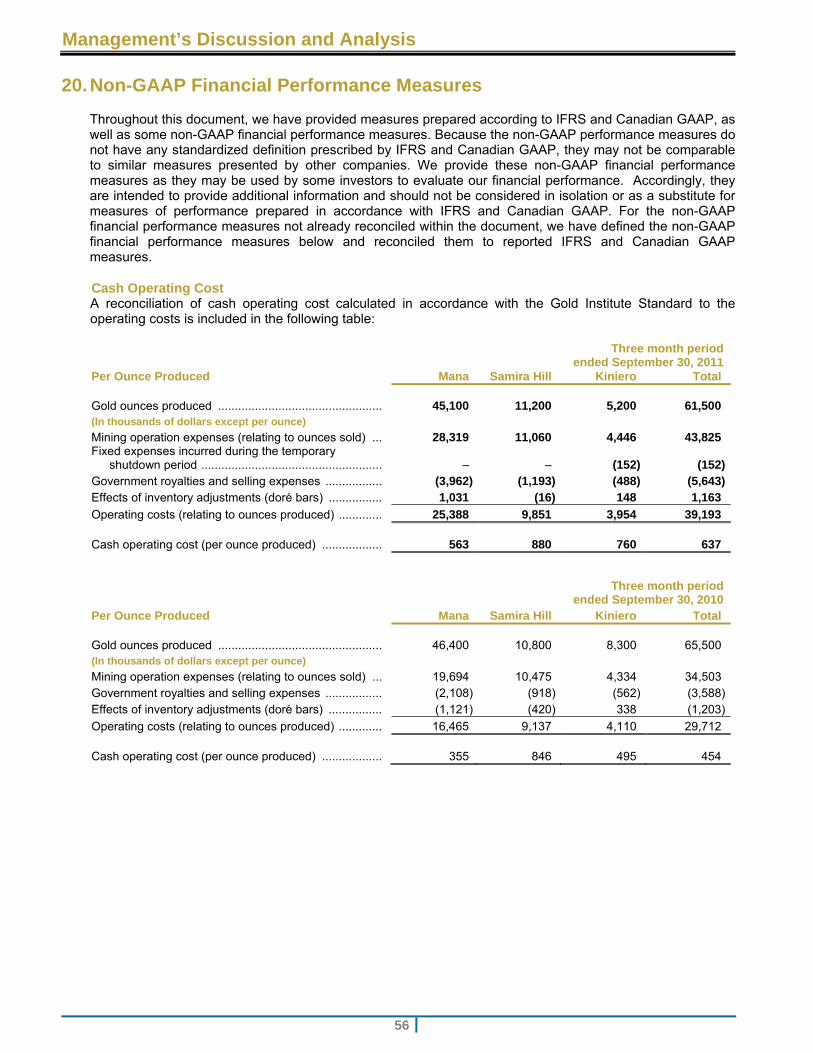
Management’s Discussion and Analysis
56
20. Non-GAAP Financial Performance Measures
Throughout this document, we have provided measures prepared according to IFRS and Canadian GAAP, as well as some non-GAAP financial performance measures. Because the non-GAAP performance measures do not have any standardized definition prescribed by IFRS and Canadian GAAP, they may not be comparable to similar measures presented by other companies. We provide these non-GAAP financial performance measures as they may be used by some investors to evaluate our financial performance. Accordingly, they are intended to provide additional information and should not be considered in isolation or as a substitute for measures of performance prepared in accordance with IFRS and Canadian GAAP. For the non-GAAP financial performance measures not already reconciled within the document, we have defined the non-GAAP financial performance measures below and reconciled them to reported IFRS and Canadian GAAP measures.
Cash Operating Cost A reconciliation of cash operating cost calculated in accordance with the Gold Institute Standard to the operating costs is included in the following table:
Three month periodended September 30, 2011
Per Ounce Produced Mana Samira Hill Kiniero Total
Gold ounces produced ................................................. 45,100 11,200 5,200 61,500 (In thousands of dollars except per ounce) Mining operation expenses (relating to ounces sold) ... 28,319 11,060 4,446 43,825 Fixed expenses incurred during the temporary
shutdown period ...................................................... – – (152) (152)Government royalties and selling expenses ................. (3,962) (1,193) (488) (5,643)Effects of inventory adjustments (doré bars) ................ 1,031 (16) 148 1,163
Operating costs (relating to ounces produced) ............. 25,388 9,851 3,954 39,193
Cash operating cost (per ounce produced) .................. 563 880 760 637
Three month period
ended September 30, 2010 Per Ounce Produced Mana Samira Hill Kiniero Total
Gold ounces produced ................................................. 46,400 10,800 8,300 65,500 (In thousands of dollars except per ounce) Mining operation expenses (relating to ounces sold) ... 19,694 10,475 4,334 34,503 Government royalties and selling expenses ................. (2,108) (918) (562) (3,588)Effects of inventory adjustments (doré bars) ................ (1,121) (420) 338 (1,203)
Operating costs (relating to ounces produced) ............. 16,465 9,137 4,110 29,712
Cash operating cost (per ounce produced) .................. 355 846 495 454
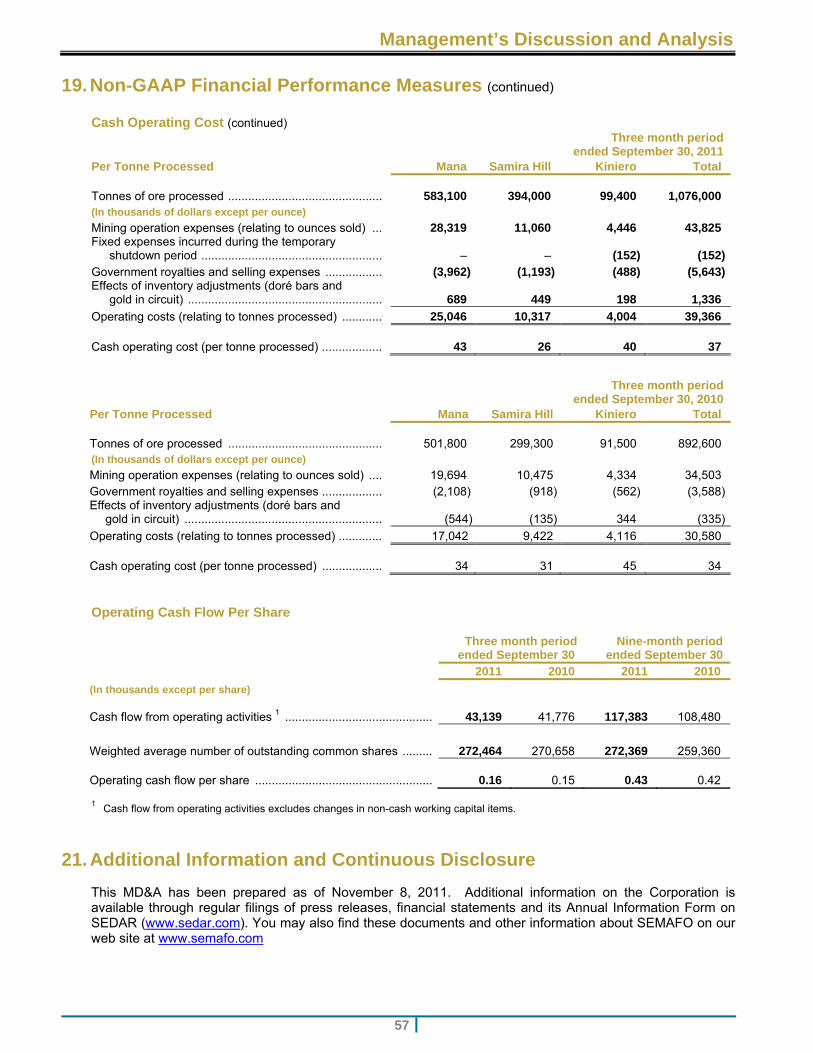
Management’s Discussion and Analysis
57
19. Non-GAAP Financial Performance Measures (continued)
Cash Operating Cost (continued) Three month period
ended September 30, 2011 Per Tonne Processed Mana Samira Hill Kiniero Total
Tonnes of ore processed .............................................. 583,100 394,000 99,400 1,076,000 (In thousands of dollars except per ounce) Mining operation expenses (relating to ounces sold) ... 28,319 11,060 4,446 43,825 Fixed expenses incurred during the temporary
shutdown period ...................................................... – – (152) (152)Government royalties and selling expenses ................. (3,962) (1,193) (488) (5,643)Effects of inventory adjustments (doré bars and gold in circuit) .......................................................... 689 449 198 1,336
Operating costs (relating to tonnes processed) ............ 25,046 10,317 4,004 39,366
Cash operating cost (per tonne processed) .................. 43 26 40 37
Three month period
ended September 30, 2010 Per Tonne Processed Mana Samira Hill Kiniero Total
Tonnes of ore processed .............................................. 501,800 299,300 91,500 892,600 (In thousands of dollars except per ounce) Mining operation expenses (relating to ounces sold) .... 19,694 10,475 4,334 34,503 Government royalties and selling expenses .................. (2,108) (918) (562) (3,588)Effects of inventory adjustments (doré bars and gold in circuit) ........................................................... (544) (135) 344 (335)
Operating costs (relating to tonnes processed) ............. 17,042 9,422 4,116 30,580
Cash operating cost (per tonne processed) .................. 34 31 45 34
Operating Cash Flow Per Share
Three month period
ended September 30 Nine-month period
ended September 30 2011 2010 2011 2010
(In thousands except per share)
Cash flow from operating activities 1 ............................................ 43,139 41,776 117,383 108,480
Weighted average number of outstanding common shares ......... 272,464 270,658 272,369 259,360
Operating cash flow per share ..................................................... 0.16
0.15 0.43 0.42
1 Cash flow from operating activities excludes changes in non-cash working capital items.
21. Additional Information and Continuous Disclosure
This MD&A has been prepared as of November 8, 2011. Additional information on the Corporation is available through regular filings of press releases, financial statements and its Annual Information Form on SEDAR (Hwww.sedar.comH). You may also find these documents and other information about SEMAFO on our web site at Hwww.semafo.comH.
Management’s Discussion and Analysis
58
22. Forward-Looking Statements
This MD&A contains forward-looking statements. These forward-looking statements include, but are not limited to, statements regarding expectations of the Corporation as to the market price of gold, strategic plans, future commercial production, production targets, timetables, mining operating expenses, capital expenditures, and mineral reserve and resource estimates. Forward-looking statements involve known and unknown risks and uncertainties and accordingly, actual results and future events could differ materially from those anticipated in such statements. Forward-looking statements include words or expressions such as “committed”, “evolve”, “become”, “pursuing”, “growth”, “opportunities”, “further”, “increase”, “accelerate”, “objectives”, “guidance”, “anticipate”, “estimated”, “payback” and other similar expressions. Factors that could cause future results or events to differ materially from current expectations expressed or implied by the forward-looking statements include, but are not limited to, fluctuations in the market price of precious metals, mining industry risks, uncertainty as to calculation of mineral reserves and resources, risks of delays in construction, requirements of additional financing, increase in tax or royalty rates or adoption of new interpretations related thereto, the ability to deliver on our strategic focus and other risks described in this MD&A and in the Corporation’s other documents filed from time to time with Canadian securities regulatory authorities. Although the Corporation is of the opinion that these forward-looking statements are based on reasonable assumptions, those assumptions may prove to be incorrect. Accordingly, readers should not place undue reliance on forward-looking statements. Readers can find further information with respect to risks in the Annual Information Form of the Corporation and other filings of the Corporation with Canadian securities regulatory authorities available at Hwww.sedar.comH. The Corporation disclaims any obligation to update or revise these forward-looking statements, except as required by applicable law.
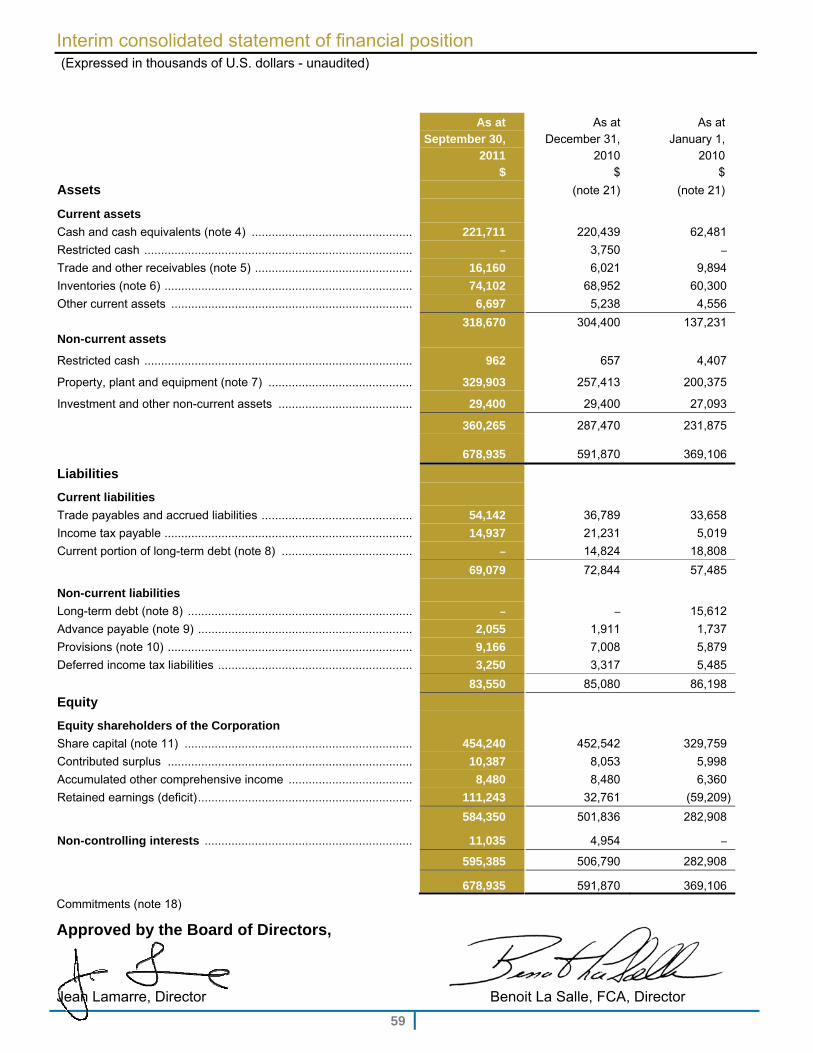
Interim consolidated statement of financial position (Expressed in thousands of U.S. dollars - unaudited)
59
As at September 30,
2011 $
As at December 31,
2010 $
As at January 1,
2010 $
Assets (note 21) (note 21)
Current assets
Cash and cash equivalents (note 4) ................................................ 221,711 220,439 62,481
Restricted cash ................................................................................ – 3,750 –
Trade and other receivables (note 5) ............................................... 16,160 6,021 9,894
Inventories (note 6) .......................................................................... 74,102 68,952 60,300
Other current assets ........................................................................ 6,697 5,238 4,556
Non-current assets
318,670 304,400
137,231
Restricted cash ................................................................................ 962 657 4,407
Property, plant and equipment (note 7) ........................................... 329,903 257,413 200,375
Investment and other non-current assets ........................................ 29,400 29,400 27,093
360,265 287,470 231,875
678,935 591,870 369,106
Liabilities
Current liabilities
Trade payables and accrued liabilities ............................................. 54,142 36,789 33,658
Income tax payable .......................................................................... 14,937 21,231 5,019
Current portion of long-term debt (note 8) ....................................... – 14,824 18,808
69,079 72,844 57,485
Non-current liabilities
Long-term debt (note 8) ................................................................... – – 15,612
Advance payable (note 9) ................................................................ 2,055 1,911 1,737
Provisions (note 10) ......................................................................... 9,166 7,008 5,879
Deferred income tax liabilities .......................................................... 3,250 3,317 5,485
83,550 85,080 86,198
Equity
Equity shareholders of the Corporation
Share capital (note 11) .................................................................... 454,240 452,542 329,759
Contributed surplus ......................................................................... 10,387 8,053 5,998
Accumulated other comprehensive income ..................................... 8,480 8,480 6,360
Retained earnings (deficit) ................................................................ 111,243 32,761 (59,209)
584,350 501,836 282,908
Non-controlling interests .............................................................. 11,035 4,954 –
595,385 506,790 282,908
678,935 591,870 369,106
Commitments (note 18)
Approved by the Board of Directors, Jean Lamarre, Director Benoit La Salle, FCA, Director
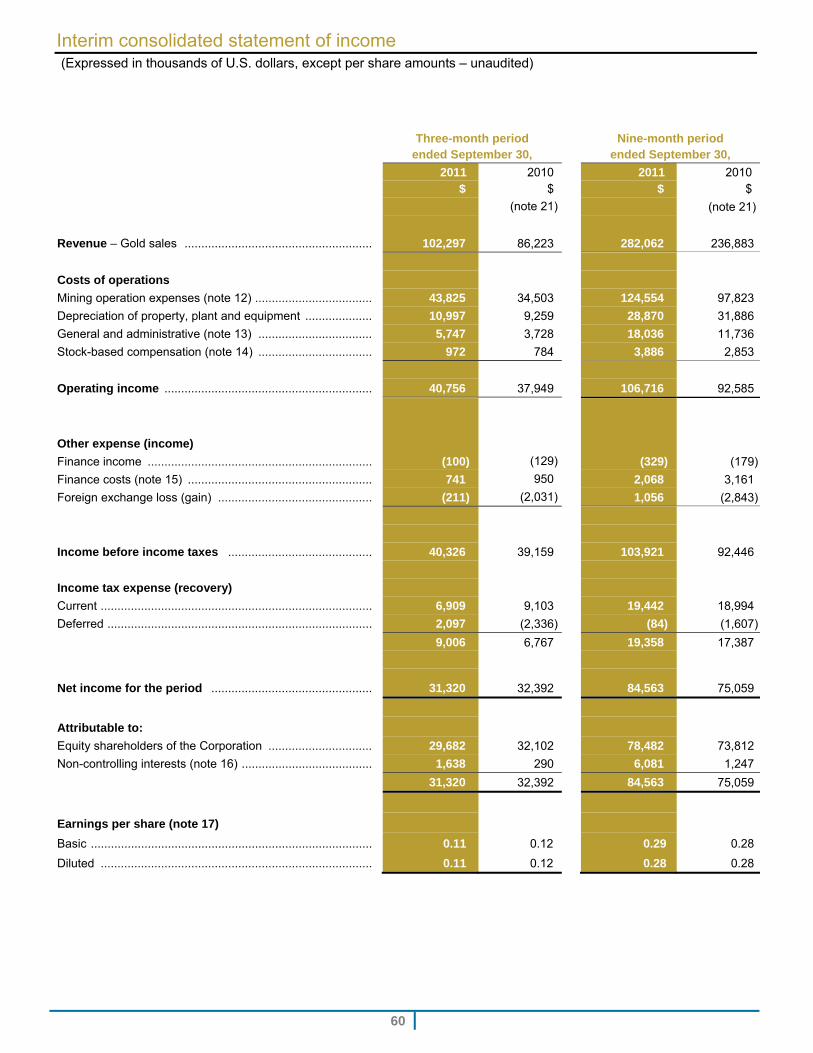
Interim consolidated statement of income (Expressed in thousands of U.S. dollars, except per share amounts – unaudited)
60
Three-month period
ended September 30, Nine-month period
ended September 30,
2011
$ 2010
$ 2011
$ 2010
$
(note 21) (note 21)
Revenue – Gold sales ........................................................ 102,297 86,223 282,062 236,883
Costs of operations
Mining operation expenses (note 12) ................................... 43,825 34,503 124,554 97,823
Depreciation of property, plant and equipment .................... 10,997 9,259 28,870 31,886
General and administrative (note 13) .................................. 5,747 3,728 18,036 11,736
Stock-based compensation (note 14) .................................. 972 784 2 3,886 2,853
Operating income .............................................................. 40,756 37,949 106,716 92,585
Other expense (income)
Finance income ................................................................... (100) (129) (329) (179)
Finance costs (note 15) ....................................................... 741 950 2,068 3,161
Foreign exchange loss (gain) .............................................. (211) (2,031) 1,056 (2,843)
Income before income taxes ........................................... 40,326 39,159 103,921 92,446
Income tax expense (recovery)
Current ................................................................................. 6,909 9,103 19,442 18,994
Deferred ............................................................................... 2,097 (2,336) (84) (1,607)
9,006 6,767 19,358 17,387
Net income for the period ................................................ 31,320 32,392 84,563 75,059
Attributable to:
Equity shareholders of the Corporation ............................... 29,682 32,102 78,482 73,812
Non-controlling interests (note 16) ....................................... 1,638 290 6,081 1,247
31,320 32,392 84,563 75,059
Earnings per share (note 17)
Basic .................................................................................... 0.11 0.12 0.29 0.28
Diluted ................................................................................. 0.11 0.12 0.28 0.28
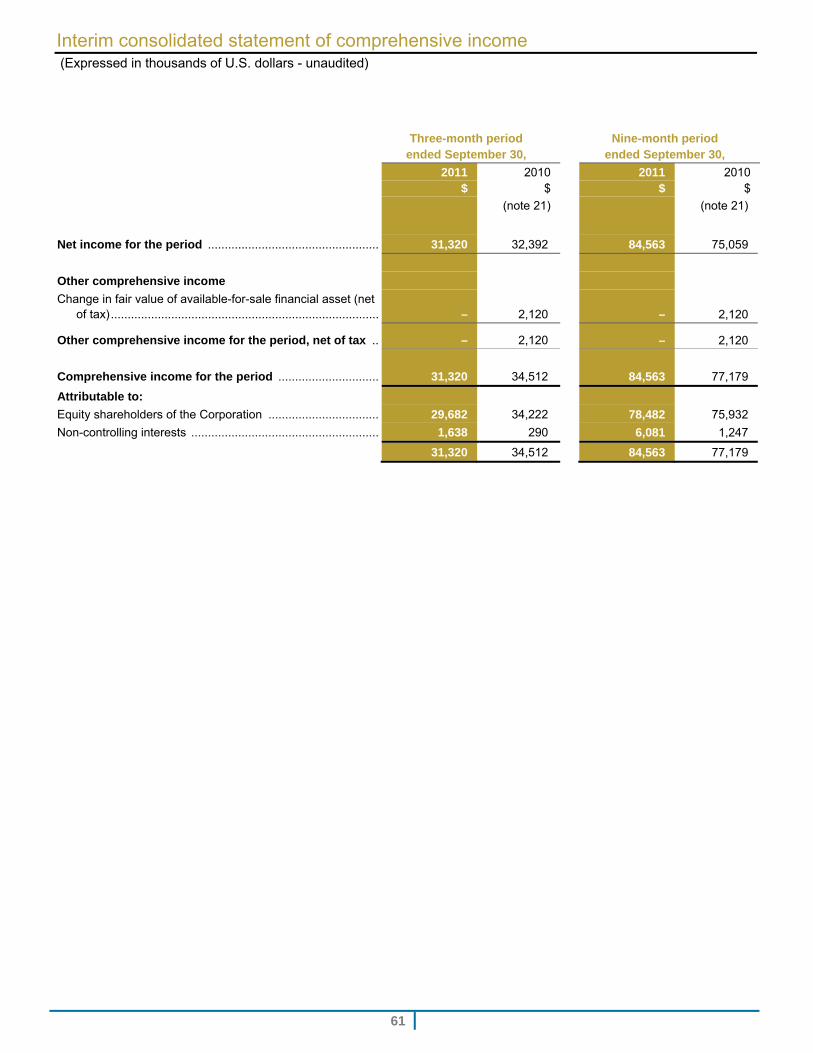
Interim consolidated statement of comprehensive income (Expressed in thousands of U.S. dollars - unaudited)
61
Three-month period
ended September 30, Nine-month period
ended September 30,
2011 $
2010 $
2011 $
2010 $
(note 21) (note 21)
Net income for the period ................................................... 31,320 32,392 84,563 75,059
Other comprehensive income
Change in fair value of available-for-sale financial asset (net of tax) ................................................................................ – 2,120
– 2,120
Other comprehensive income for the period, net of tax .. – 2,120
– 2,120
Comprehensive income for the period .............................. 31,320 34,512 84,563 77,179
Attributable to:
Equity shareholders of the Corporation ................................. 29,682 34,222 78,482 75,932
Non-controlling interests ........................................................ 1,638 290 6,081 1,247
31,320 34,512 84,563 77,179
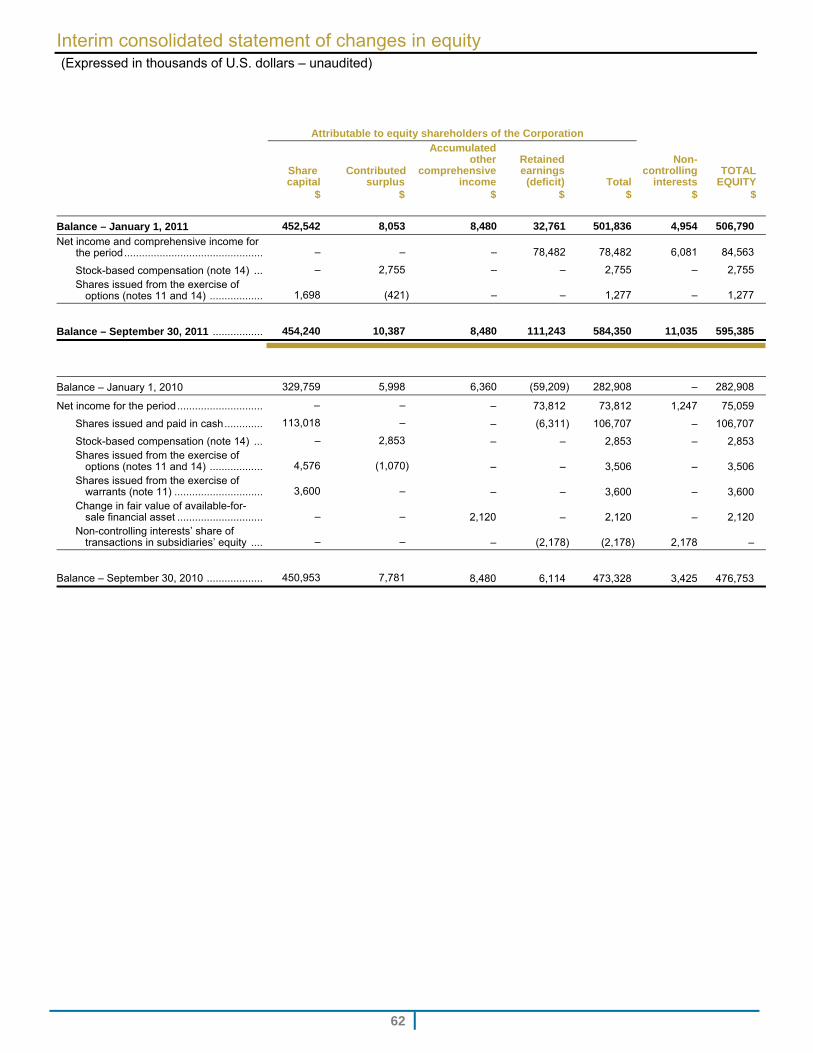
Interim consolidated statement of changes in equity (Expressed in thousands of U.S. dollars – unaudited)
62
Attributable to equity shareholders of the Corporation
Share capital
$
Contributedsurplus
$
Accumulated other
comprehensive income
$
Retainedearnings
(deficit) $
Total $
Non-controlling
interests $
TOTALEQUITY
$
Balance – January 1, 2011 452,542 8,053 8,480 32,761 501,836 4,954 506,790
Net income and comprehensive income for the period ............................................... – – – 78,482 78,482 6,081 84,563
Stock-based compensation (note 14) ... – 2,755 – – 2,755 – 2,755 Shares issued from the exercise of
options (notes 11 and 14) .................. 1,698 (421) – – 1,277 – 1,277
Balance – September 30, 2011 ................. 454,240 10,387 8,480 111,243 584,350 11,035 595,385
Balance – January 1, 2010 329,759 5,998 6,360 (59,209) 282,908 – 282,908
Net income for the period ............................. – – – 73,812 73,812 1,247 75,059
Shares issued and paid in cash ............. 113,018 – – (6,311) 106,707 – 106,707
Stock-based compensation (note 14) ... – 2,853 – – 2,853 – 2,853 Shares issued from the exercise of
options (notes 11 and 14) .................. 4,576 (1,070) – – 3,506 – 3,506 Shares issued from the exercise of
warrants (note 11) .............................. 3,600 – – – 3,600 – 3,600 Change in fair value of available-for-
sale financial asset ............................. – – 2,120 – 2,120 – 2,120 Non-controlling interests’ share of
transactions in subsidiaries’ equity .... – – – (2,178) (2,178) 2,178 –
Balance – September 30, 2010 ................... 450,953 7,781 8,480 6,114 473,328 3,425 476,753
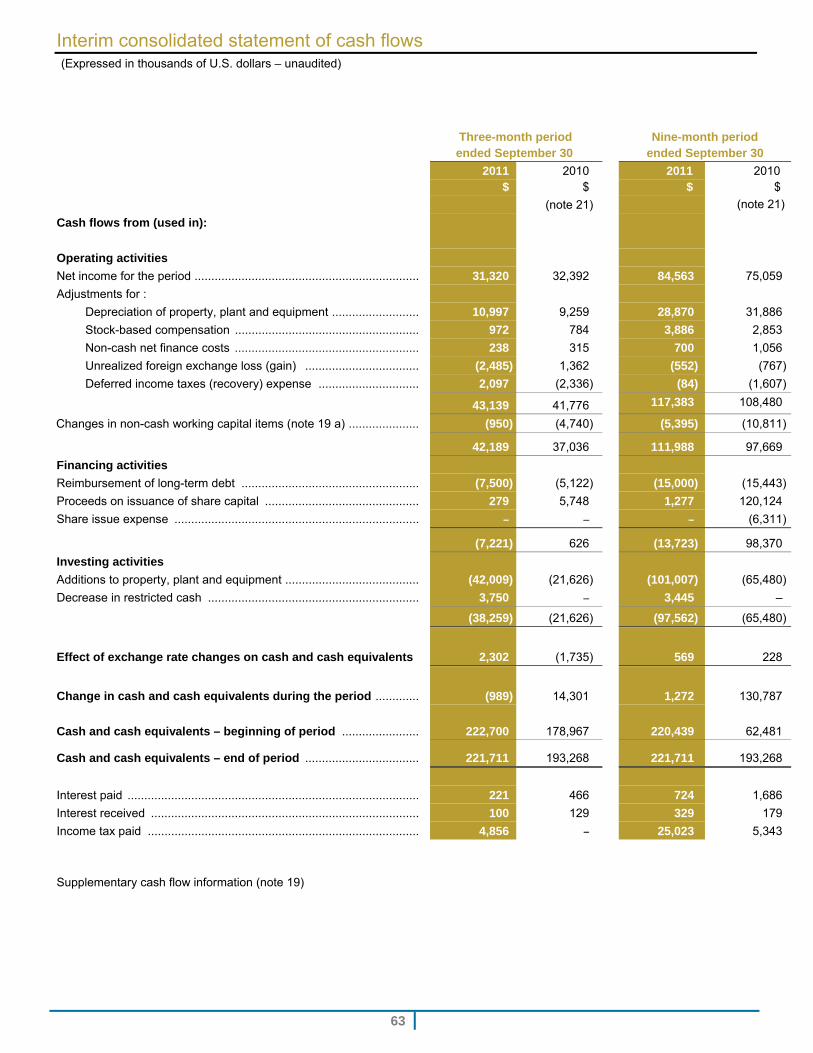
Interim consolidated statement of cash flows (Expressed in thousands of U.S. dollars – unaudited)
63
Three-month period ended September 30
Nine-month period ended September 30
2011
$ 2010
$ 2011
$ 2010
$
(note 21) (note 21)
Cash flows from (used in):
Operating activities
Net income for the period ................................................................... 31,320 32,392 84,563 75,059
Adjustments for :
Depreciation of property, plant and equipment .......................... 10,997 9,259 28,870 31,886
Stock-based compensation ....................................................... 972 784 3,886 2,853
Non-cash net finance costs ....................................................... 238 315 700 1,056
Unrealized foreign exchange loss (gain) .................................. (2,485) 1,362 (552) (767)
Deferred income taxes (recovery) expense .............................. 2,097 (2,336) (84) (1,607)
43,139 41,776 117,383 108,480
Changes in non-cash working capital items (note 19 a) ..................... (950) (4,740) (5,395) (10,811)
42,189 37,036 111,988 97,669
Financing activities
Reimbursement of long-term debt ..................................................... (7,500) (5,122) (15,000) (15,443)
Proceeds on issuance of share capital .............................................. 279 5,748 1,277 120,124
Share issue expense ......................................................................... – – – (6,311)
(7,221) 626 (13,723) 98,370
Investing activities
Additions to property, plant and equipment ........................................ (42,009) (21,626) (101,007) (65,480)
Decrease in restricted cash ............................................................... 3,750 – 3,445 –
(38,259) (21,626) (97,562) (65,480)
Effect of exchange rate changes on cash and cash equivalents 2,302 (1,735) 569 228
Change in cash and cash equivalents during the period ............. (989) 14,301 1,272 130,787
Cash and cash equivalents – beginning of period ....................... 222,700 178,967
220,439 62,481
Cash and cash equivalents – end of period .................................. 221,711 193,268
221,711 193,268
Interest paid ....................................................................................... 221 466 724 1,686
Interest received ................................................................................ 100 129 329 179
Income tax paid ................................................................................. 4,856 – 25,023 5,343
Supplementary cash flow information (note 19)
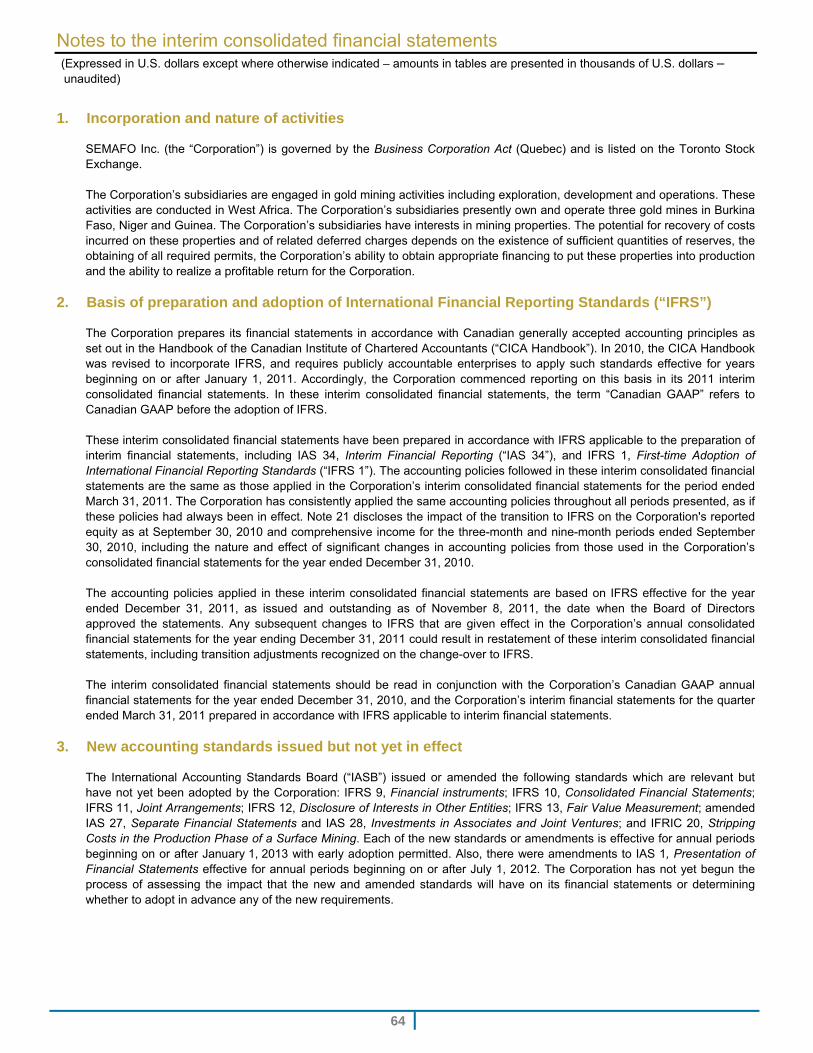
Notes to the interim consolidated financial statements (Expressed in U.S. dollars except where otherwise indicated – amounts in tables are presented in thousands of U.S. dollars –
unaudited)
64
1. Incorporation and nature of activities
SEMAFO Inc. (the “Corporation”) is governed by the Business Corporation Act (Quebec) and is listed on the Toronto Stock Exchange. The Corporation’s subsidiaries are engaged in gold mining activities including exploration, development and operations. These activities are conducted in West Africa. The Corporation’s subsidiaries presently own and operate three gold mines in Burkina Faso, Niger and Guinea. The Corporation’s subsidiaries have interests in mining properties. The potential for recovery of costs incurred on these properties and of related deferred charges depends on the existence of sufficient quantities of reserves, the obtaining of all required permits, the Corporation’s ability to obtain appropriate financing to put these properties into production and the ability to realize a profitable return for the Corporation.
2. Basis of preparation and adoption of International Financial Reporting Standards (“IFRS”)
The Corporation prepares its financial statements in accordance with Canadian generally accepted accounting principles as set out in the Handbook of the Canadian Institute of Chartered Accountants (“CICA Handbook”). In 2010, the CICA Handbook was revised to incorporate IFRS, and requires publicly accountable enterprises to apply such standards effective for years beginning on or after January 1, 2011. Accordingly, the Corporation commenced reporting on this basis in its 2011 interim consolidated financial statements. In these interim consolidated financial statements, the term “Canadian GAAP” refers to Canadian GAAP before the adoption of IFRS. These interim consolidated financial statements have been prepared in accordance with IFRS applicable to the preparation of interim financial statements, including IAS 34, Interim Financial Reporting (“IAS 34”), and IFRS 1, First-time Adoption of International Financial Reporting Standards (“IFRS 1”). The accounting policies followed in these interim consolidated financial statements are the same as those applied in the Corporation’s interim consolidated financial statements for the period ended March 31, 2011. The Corporation has consistently applied the same accounting policies throughout all periods presented, as if these policies had always been in effect. Note 21 discloses the impact of the transition to IFRS on the Corporation's reported equity as at September 30, 2010 and comprehensive income for the three-month and nine-month periods ended September 30, 2010, including the nature and effect of significant changes in accounting policies from those used in the Corporation’s consolidated financial statements for the year ended December 31, 2010. The accounting policies applied in these interim consolidated financial statements are based on IFRS effective for the year ended December 31, 2011, as issued and outstanding as of November 8, 2011, the date when the Board of Directors approved the statements. Any subsequent changes to IFRS that are given effect in the Corporation’s annual consolidated financial statements for the year ending December 31, 2011 could result in restatement of these interim consolidated financial statements, including transition adjustments recognized on the change-over to IFRS. The interim consolidated financial statements should be read in conjunction with the Corporation’s Canadian GAAP annual financial statements for the year ended December 31, 2010, and the Corporation’s interim financial statements for the quarter ended March 31, 2011 prepared in accordance with IFRS applicable to interim financial statements.
3. New accounting standards issued but not yet in effect
The International Accounting Standards Board (“IASB”) issued or amended the following standards which are relevant but have not yet been adopted by the Corporation: IFRS 9, Financial instruments; IFRS 10, Consolidated Financial Statements; IFRS 11, Joint Arrangements; IFRS 12, Disclosure of Interests in Other Entities; IFRS 13, Fair Value Measurement; amended IAS 27, Separate Financial Statements and IAS 28, Investments in Associates and Joint Ventures; and IFRIC 20, Stripping Costs in the Production Phase of a Surface Mining. Each of the new standards or amendments is effective for annual periods beginning on or after January 1, 2013 with early adoption permitted. Also, there were amendments to IAS 1, Presentation of Financial Statements effective for annual periods beginning on or after July 1, 2012. The Corporation has not yet begun the process of assessing the impact that the new and amended standards will have on its financial statements or determining whether to adopt in advance any of the new requirements.
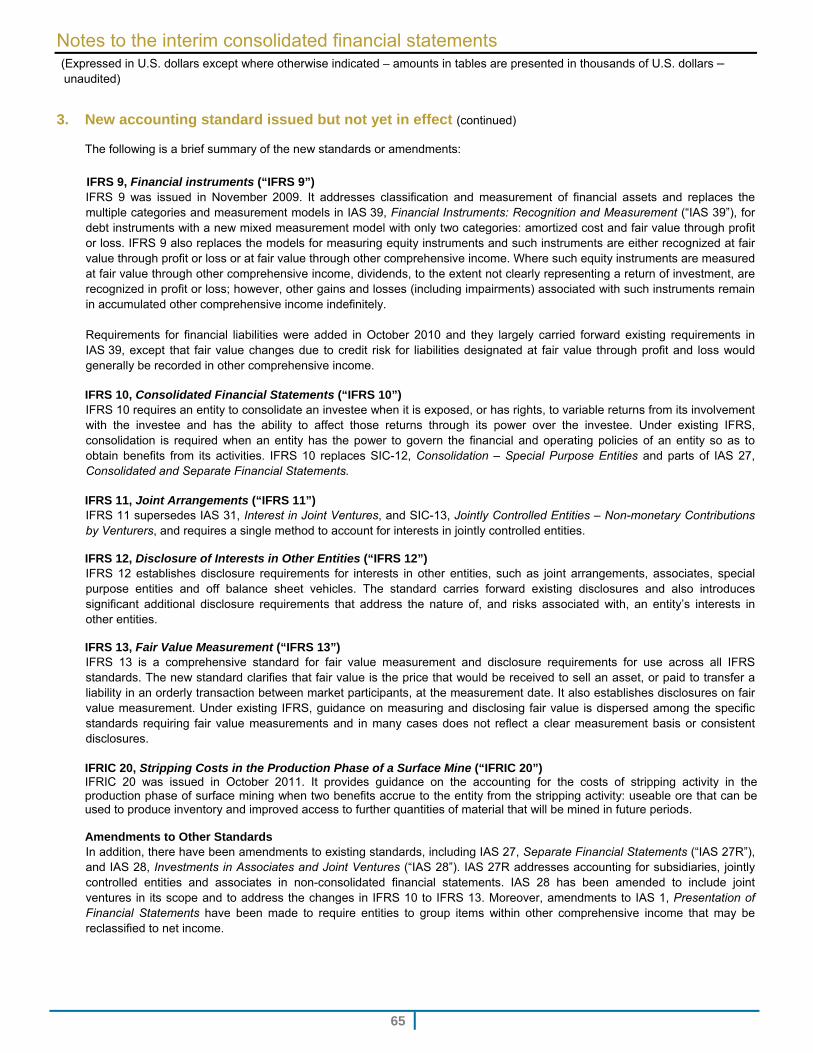
Notes to the interim consolidated financial statements (Expressed in U.S. dollars except where otherwise indicated – amounts in tables are presented in thousands of U.S. dollars –
unaudited)
65
3. New accounting standard issued but not yet in effect (continued)
The following is a brief summary of the new standards or amendments: IFRS 9, Financial instruments (“IFRS 9”) IFRS 9 was issued in November 2009. It addresses classification and measurement of financial assets and replaces the multiple categories and measurement models in IAS 39, Financial Instruments: Recognition and Measurement (“IAS 39”), for debt instruments with a new mixed measurement model with only two categories: amortized cost and fair value through profit or loss. IFRS 9 also replaces the models for measuring equity instruments and such instruments are either recognized at fair value through profit or loss or at fair value through other comprehensive income. Where such equity instruments are measured at fair value through other comprehensive income, dividends, to the extent not clearly representing a return of investment, are recognized in profit or loss; however, other gains and losses (including impairments) associated with such instruments remain in accumulated other comprehensive income indefinitely. Requirements for financial liabilities were added in October 2010 and they largely carried forward existing requirements in IAS 39, except that fair value changes due to credit risk for liabilities designated at fair value through profit and loss would generally be recorded in other comprehensive income. IFRS 10, Consolidated Financial Statements (“IFRS 10”) IFRS 10 requires an entity to consolidate an investee when it is exposed, or has rights, to variable returns from its involvement with the investee and has the ability to affect those returns through its power over the investee. Under existing IFRS, consolidation is required when an entity has the power to govern the financial and operating policies of an entity so as to obtain benefits from its activities. IFRS 10 replaces SIC-12, Consolidation ‒ Special Purpose Entities and parts of IAS 27, Consolidated and Separate Financial Statements. IFRS 11, Joint Arrangements (“IFRS 11”) IFRS 11 supersedes IAS 31, Interest in Joint Ventures, and SIC-13, Jointly Controlled Entities – Non-monetary Contributions by Venturers, and requires a single method to account for interests in jointly controlled entities. IFRS 12, Disclosure of Interests in Other Entities (“IFRS 12”) IFRS 12 establishes disclosure requirements for interests in other entities, such as joint arrangements, associates, special purpose entities and off balance sheet vehicles. The standard carries forward existing disclosures and also introduces significant additional disclosure requirements that address the nature of, and risks associated with, an entity’s interests in other entities. IFRS 13, Fair Value Measurement (“IFRS 13”) IFRS 13 is a comprehensive standard for fair value measurement and disclosure requirements for use across all IFRS standards. The new standard clarifies that fair value is the price that would be received to sell an asset, or paid to transfer a liability in an orderly transaction between market participants, at the measurement date. It also establishes disclosures on fair value measurement. Under existing IFRS, guidance on measuring and disclosing fair value is dispersed among the specific standards requiring fair value measurements and in many cases does not reflect a clear measurement basis or consistent disclosures.
IFRIC 20, Stripping Costs in the Production Phase of a Surface Mine (“IFRIC 20”) IFRIC 20 was issued in October 2011. It provides guidance on the accounting for the costs of stripping activity in the production phase of surface mining when two benefits accrue to the entity from the stripping activity: useable ore that can be used to produce inventory and improved access to further quantities of material that will be mined in future periods. Amendments to Other Standards In addition, there have been amendments to existing standards, including IAS 27, Separate Financial Statements (“IAS 27R”), and IAS 28, Investments in Associates and Joint Ventures (“IAS 28”). IAS 27R addresses accounting for subsidiaries, jointly controlled entities and associates in non-consolidated financial statements. IAS 28 has been amended to include joint ventures in its scope and to address the changes in IFRS 10 to IFRS 13. Moreover, amendments to IAS 1, Presentation of Financial Statements have been made to require entities to group items within other comprehensive income that may be reclassified to net income.
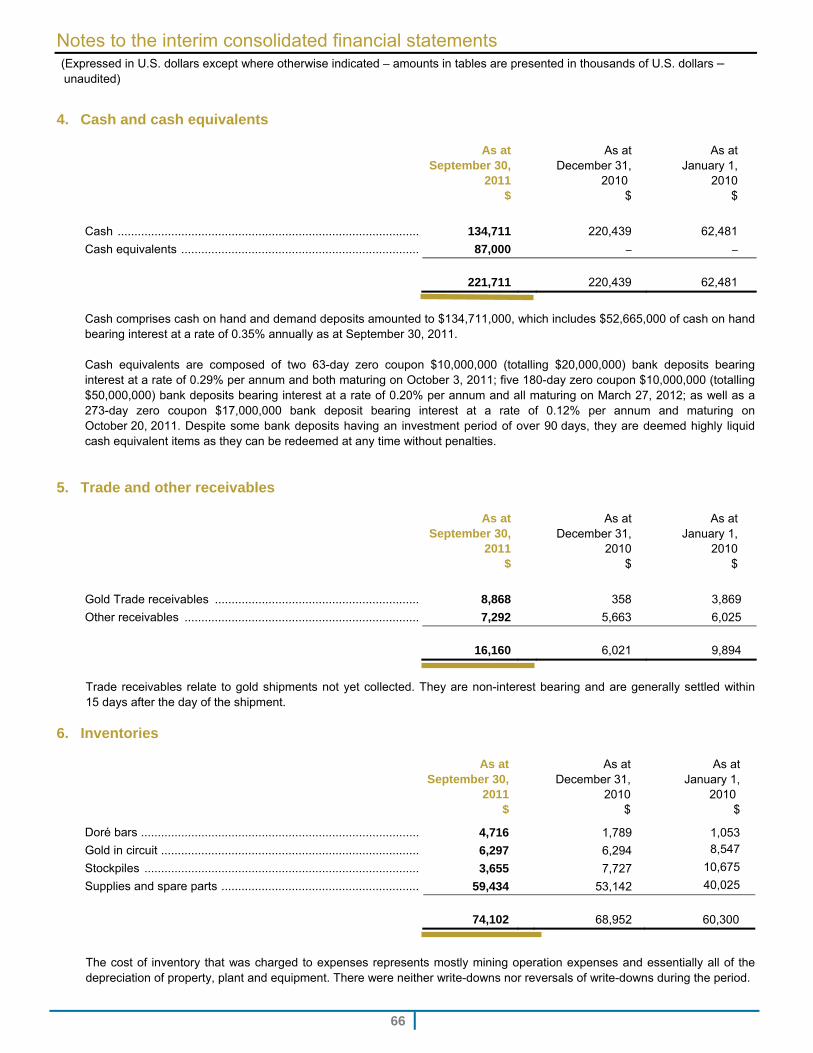
Notes to the interim consolidated financial statements (Expressed in U.S. dollars except where otherwise indicated – amounts in tables are presented in thousands of U.S. dollars –
unaudited)
66
4. Cash and cash equivalents
As at September 30,
2011 $
As at December 31,
2010 $
As at January 1,
2010 $
Cash .......................................................................................... 134,711 220,439 62,481
Cash equivalents ....................................................................... 87,000 – –
221,711 220,439 62,481
Cash comprises cash on hand and demand deposits amounted to $134,711,000, which includes $52,665,000 of cash on hand bearing interest at a rate of 0.35% annually as at September 30, 2011. Cash equivalents are composed of two 63-day zero coupon $10,000,000 (totalling $20,000,000) bank deposits bearing interest at a rate of 0.29% per annum and both maturing on October 3, 2011; five 180-day zero coupon $10,000,000 (totalling $50,000,000) bank deposits bearing interest at a rate of 0.20% per annum and all maturing on March 27, 2012; as well as a 273-day zero coupon $17,000,000 bank deposit bearing interest at a rate of 0.12% per annum and maturing on October 20, 2011. Despite some bank deposits having an investment period of over 90 days, they are deemed highly liquid cash equivalent items as they can be redeemed at any time without penalties.
5. Trade and other receivables
As at September 30,
2011 $
As at December 31,
2010 $
As at January 1,
2010 $
Gold Trade receivables ............................................................. 8,868 358 3,869
Other receivables ...................................................................... 7,292 5,663 6,025
16,160 6,021 9,894
Trade receivables relate to gold shipments not yet collected. They are non-interest bearing and are generally settled within 15 days after the day of the shipment.
6. Inventories
As at September 30,
2011 $
As at December 31,
2010 $
As at January 1,
2010 $
Doré bars ................................................................................... 4,716 1,789 1,053
Gold in circuit ............................................................................. 6,297 6,294 8,547
Stockpiles .................................................................................. 3,655 7,727 10,675
Supplies and spare parts ........................................................... 59,434 53,142 40,025
74,102 68,952 60,300
The cost of inventory that was charged to expenses represents mostly mining operation expenses and essentially all of the depreciation of property, plant and equipment. There were neither write-downs nor reversals of write-downs during the period.
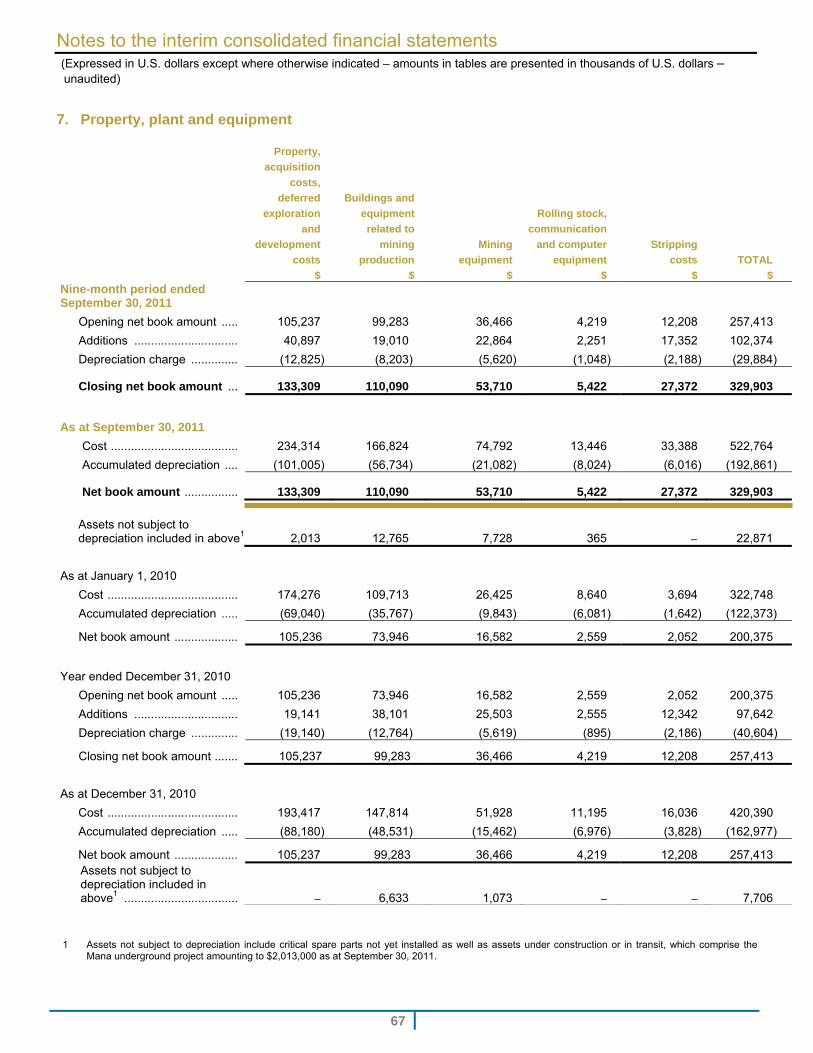
Notes to the interim consolidated financial statements (Expressed in U.S. dollars except where otherwise indicated – amounts in tables are presented in thousands of U.S. dollars –
unaudited)
67
7. Property, plant and equipment
Property,
acquisition
costs,
deferred Buildings and
exploration equipment Rolling stock,
and related to communication
development mining Mining and computer Stripping
costs production equipment equipment costs TOTAL
$ $ $ $ $ $ Nine-month period ended September 30, 2011
Opening net book amount ..... 105,237 99,283 36,466 4,219 12,208 257,413
Additions ............................... 40,897 19,010 22,864 2,251 17,352 102,374
Depreciation charge .............. (12,825) (8,203) (5,620) (1,048) (2,188) (29,884)
Closing net book amount ... 133,309 110,090 53,710 5,422 27,372 329,903
As at September 30, 2011
Cost ...................................... 234,314 166,824 74,792 13,446 33,388 522,764
Accumulated depreciation .... (101,005) (56,734) (21,082) (8,024) (6,016) (192,861)
Net book amount ................ 133,309 110,090 53,710 5,422 27,372 329,903
Assets not subject to depreciation included in above1 2,013 12,765 7,728 365 – 22,871
As at January 1, 2010
Cost ....................................... 174,276 109,713 26,425 8,640 3,694 322,748
Accumulated depreciation ..... (69,040) (35,767) (9,843) (6,081) (1,642) (122,373)
Net book amount ................... 105,236 73,946 16,582 2,559 2,052 200,375
Year ended December 31, 2010
Opening net book amount ..... 105,236 73,946 16,582 2,559 2,052 200,375
Additions ............................... 19,141 38,101 25,503 2,555 12,342 97,642
Depreciation charge .............. (19,140) (12,764) (5,619) (895) (2,186) (40,604)
Closing net book amount ....... 105,237 99,283 36,466 4,219 12,208 257,413
As at December 31, 2010
Cost ....................................... 193,417 147,814 51,928 11,195 16,036 420,390
Accumulated depreciation ..... (88,180) (48,531) (15,462) (6,976) (3,828) (162,977)
Net book amount ................... 105,237 99,283 36,466 4,219 12,208 257,413 Assets not subject to depreciation included in above1 .................................. – 6,633 1,073 – – 7,706
1 Assets not subject to depreciation include critical spare parts not yet installed as well as assets under construction or in transit, which comprise the Mana underground project amounting to $2,013,000 as at September 30, 2011.
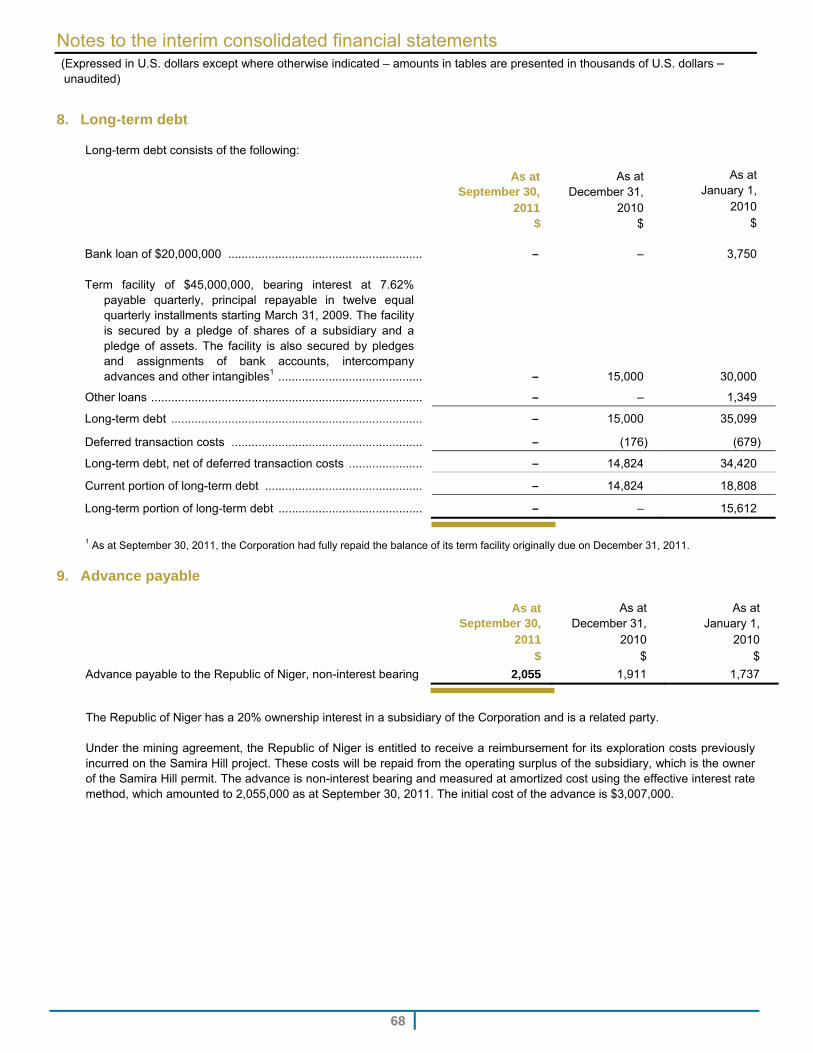
Notes to the interim consolidated financial statements (Expressed in U.S. dollars except where otherwise indicated – amounts in tables are presented in thousands of U.S. dollars –
unaudited)
68
8. Long-term debt
Long-term debt consists of the following:
As at September 30,
2011 $
As at December 31,
2010 $
As at January 1,
2010 $
Bank loan of $20,000,000 .......................................................... – – 3,750
Term facility of $45,000,000, bearing interest at 7.62% payable quarterly, principal repayable in twelve equal quarterly installments starting March 31, 2009. The facility is secured by a pledge of shares of a subsidiary and a pledge of assets. The facility is also secured by pledges and assignments of bank accounts, intercompany advances and other intangibles1 ........................................... – 15,000 30,000
Other loans ................................................................................. – – 1,349
Long-term debt ........................................................................... – 15,000 35,099
Deferred transaction costs ......................................................... – (176) (679)
Long-term debt, net of deferred transaction costs ...................... – 14,824 34,420
Current portion of long-term debt ............................................... – 14,824 18,808
Long-term portion of long-term debt ........................................... – – 15,612
1 As at September 30, 2011, the Corporation had fully repaid the balance of its term facility originally due on December 31, 2011.
9. Advance payable
As at September 30,
2011 $
As at December 31,
2010 $
As at January 1,
2010 $
Advance payable to the Republic of Niger, non-interest bearing 2,055 1,911 1,737
The Republic of Niger has a 20% ownership interest in a subsidiary of the Corporation and is a related party. Under the mining agreement, the Republic of Niger is entitled to receive a reimbursement for its exploration costs previously incurred on the Samira Hill project. These costs will be repaid from the operating surplus of the subsidiary, which is the owner of the Samira Hill permit. The advance is non-interest bearing and measured at amortized cost using the effective interest rate method, which amounted to 2,055,000 as at September 30, 2011. The initial cost of the advance is $3,007,000.
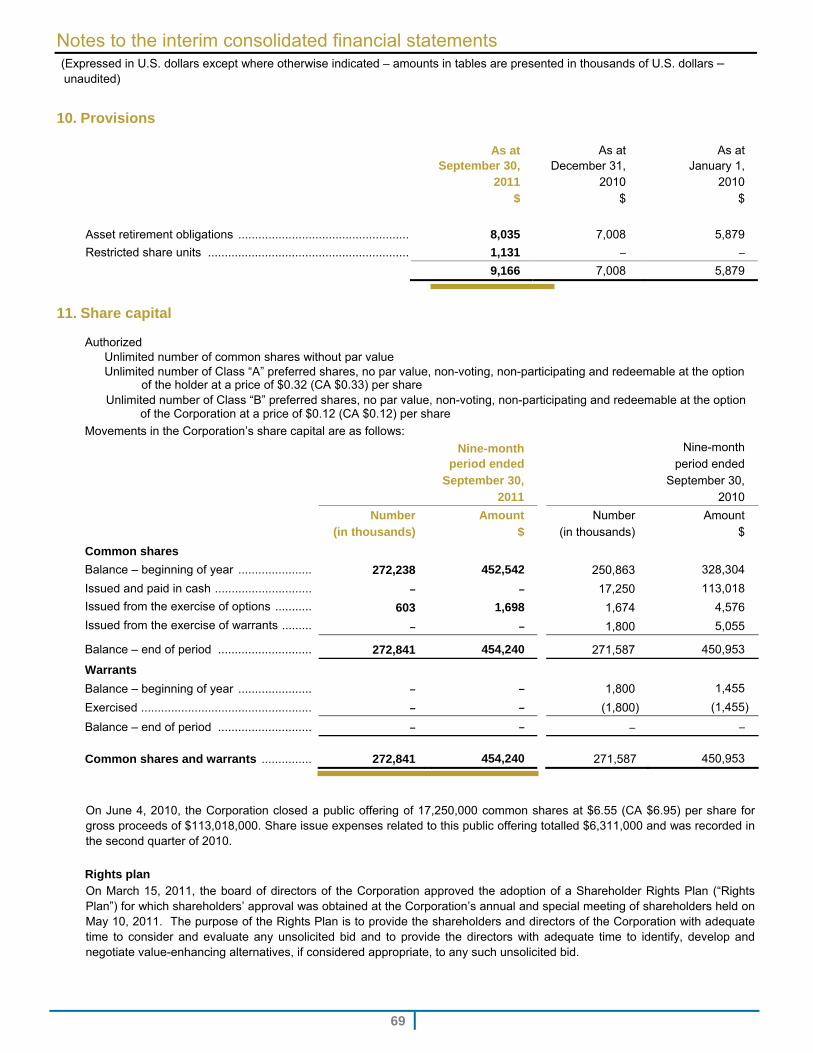
Notes to the interim consolidated financial statements (Expressed in U.S. dollars except where otherwise indicated – amounts in tables are presented in thousands of U.S. dollars –
unaudited)
69
10. Provisions
As at September 30,
2011 $
As at December 31,
2010 $
As at January 1,
2010 $
Asset retirement obligations ................................................... 8,035 7,008 5,879
Restricted share units ............................................................ 1,131 – –
9,166 7,008 5,879
11. Share capital
Authorized Unlimited number of common shares without par value Unlimited number of Class “A” preferred shares, no par value, non-voting, non-participating and redeemable at the option
of the holder at a price of $0.32 (CA $0.33) per share Unlimited number of Class “B” preferred shares, no par value, non-voting, non-participating and redeemable at the option
of the Corporation at a price of $0.12 (CA $0.12) per share
Movements in the Corporation’s share capital are as follows:
Nine-month period ended
September 30, 2011
Nine-month period ended
September 30, 2010
Number (in thousands)
Amount $
Number (in thousands)
Amount $
Common shares
Balance – beginning of year ...................... 272,238 452,542 250,863 328,304
Issued and paid in cash ............................. – – 17,250 113,018
Issued from the exercise of options ........... 603 1,698 1,674 4,576
Issued from the exercise of warrants ......... – – 1,800 5,055
Balance – end of period ............................ 272,841 454,240 271,587 450,953
Warrants
Balance – beginning of year ...................... – – 1,800 1,455
Exercised ................................................... – – (1,800) (1,455)
Balance – end of period ............................ – – – –
Common shares and warrants ............... 272,841 454,240 271,587 450,953
On June 4, 2010, the Corporation closed a public offering of 17,250,000 common shares at $6.55 (CA $6.95) per share for gross proceeds of $113,018,000. Share issue expenses related to this public offering totalled $6,311,000 and was recorded in the second quarter of 2010. Rights plan On March 15, 2011, the board of directors of the Corporation approved the adoption of a Shareholder Rights Plan (“Rights Plan”) for which shareholders’ approval was obtained at the Corporation’s annual and special meeting of shareholders held on May 10, 2011. The purpose of the Rights Plan is to provide the shareholders and directors of the Corporation with adequate time to consider and evaluate any unsolicited bid and to provide the directors with adequate time to identify, develop and negotiate value-enhancing alternatives, if considered appropriate, to any such unsolicited bid.
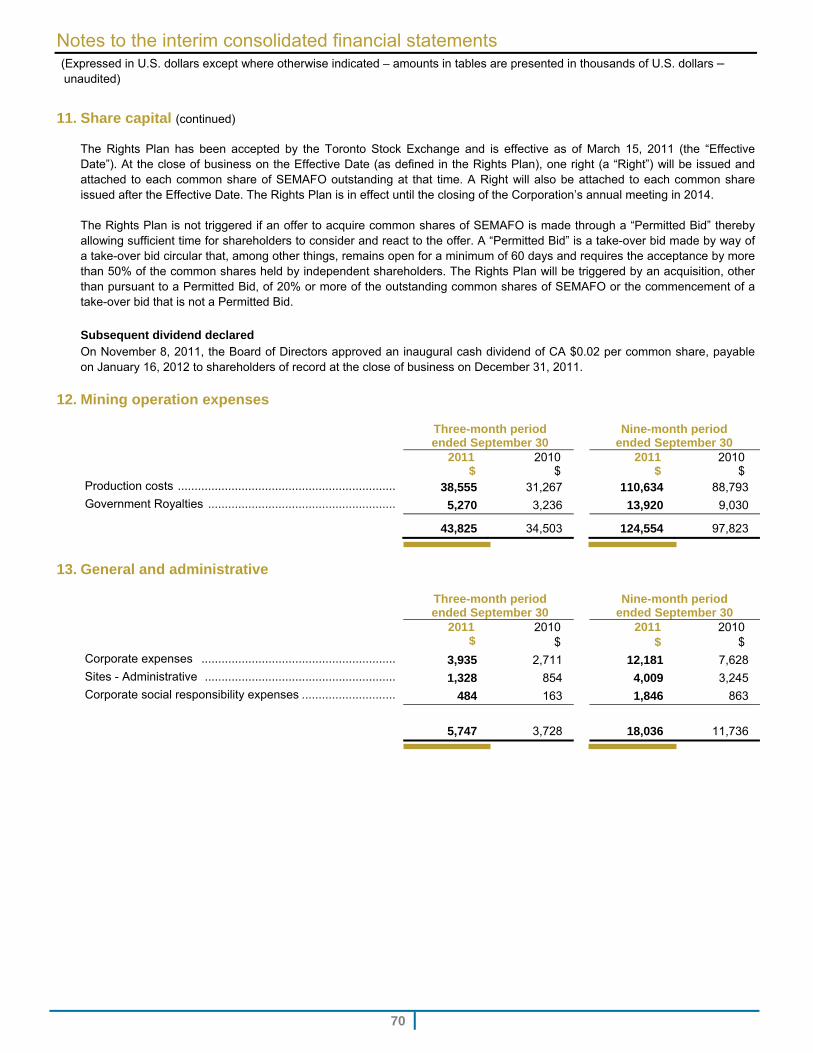
Notes to the interim consolidated financial statements (Expressed in U.S. dollars except where otherwise indicated – amounts in tables are presented in thousands of U.S. dollars –
unaudited)
70
11. Share capital (continued)
The Rights Plan has been accepted by the Toronto Stock Exchange and is effective as of March 15, 2011 (the “Effective Date”). At the close of business on the Effective Date (as defined in the Rights Plan), one right (a “Right”) will be issued and attached to each common share of SEMAFO outstanding at that time. A Right will also be attached to each common share issued after the Effective Date. The Rights Plan is in effect until the closing of the Corporation’s annual meeting in 2014. The Rights Plan is not triggered if an offer to acquire common shares of SEMAFO is made through a “Permitted Bid” thereby allowing sufficient time for shareholders to consider and react to the offer. A “Permitted Bid” is a take-over bid made by way of a take-over bid circular that, among other things, remains open for a minimum of 60 days and requires the acceptance by more than 50% of the common shares held by independent shareholders. The Rights Plan will be triggered by an acquisition, other than pursuant to a Permitted Bid, of 20% or more of the outstanding common shares of SEMAFO or the commencement of a take-over bid that is not a Permitted Bid. Subsequent dividend declared On November 8, 2011, the Board of Directors approved an inaugural cash dividend of CA $0.02 per common share, payable on January 16, 2012 to shareholders of record at the close of business on December 31, 2011.
12. Mining operation expenses
Three-month period ended September 30
Nine-month period ended September 30
2011$
2010 $
2011$
2010 $
Production costs ................................................................. 38,555 31,267 110,634 88,793 Government Royalties ........................................................ 5,270 3,236 13,920 9,030
43,825 34,503 124,554 97,823
13. General and administrative
Three-month period ended September 30
Nine-month period ended September 30
2011$
2010 $
2011$
2010 $
Corporate expenses .......................................................... 3,935 2,711 12,181 7,628 Sites - Administrative ......................................................... 1,328 854 4,009 3,245 Corporate social responsibility expenses ............................ 484 163 1,846 863
5,747
3,728 18,036 11,736
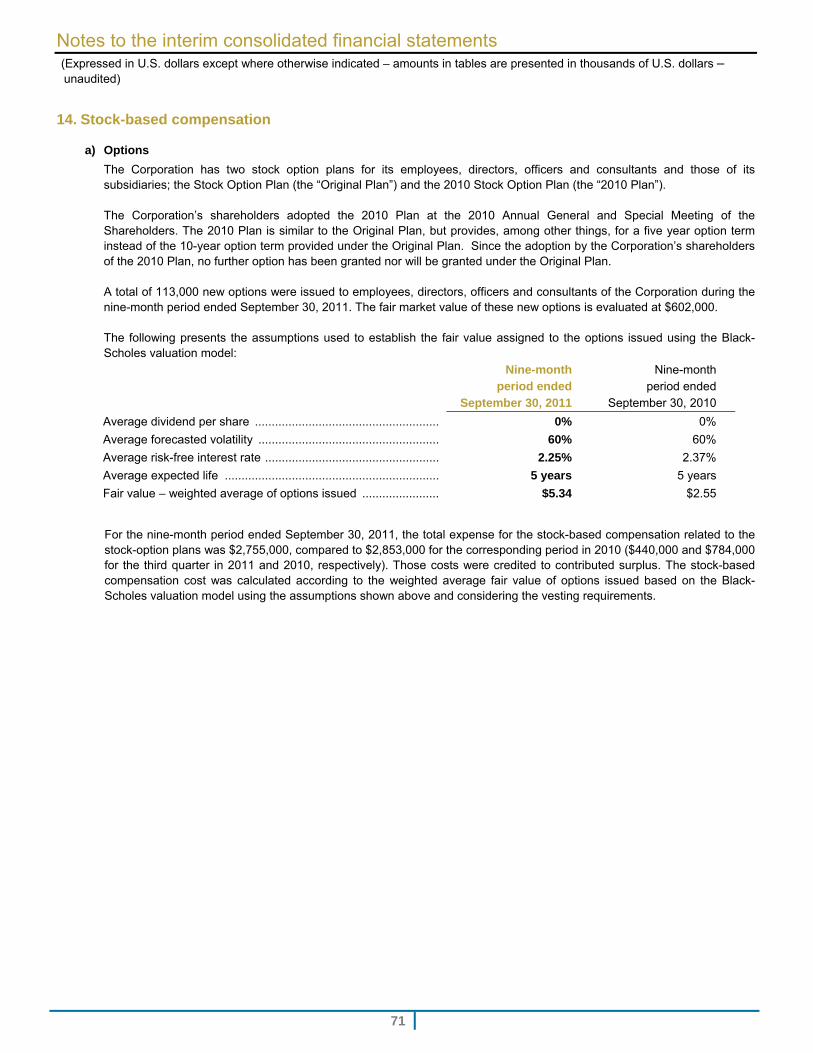
Notes to the interim consolidated financial statements (Expressed in U.S. dollars except where otherwise indicated – amounts in tables are presented in thousands of U.S. dollars –
unaudited)
71
14. Stock-based compensation
a) Options
The Corporation has two stock option plans for its employees, directors, officers and consultants and those of its subsidiaries; the Stock Option Plan (the “Original Plan”) and the 2010 Stock Option Plan (the “2010 Plan”). The Corporation’s shareholders adopted the 2010 Plan at the 2010 Annual General and Special Meeting of the Shareholders. The 2010 Plan is similar to the Original Plan, but provides, among other things, for a five year option term instead of the 10-year option term provided under the Original Plan. Since the adoption by the Corporation’s shareholders of the 2010 Plan, no further option has been granted nor will be granted under the Original Plan. A total of 113,000 new options were issued to employees, directors, officers and consultants of the Corporation during the nine-month period ended September 30, 2011. The fair market value of these new options is evaluated at $602,000. The following presents the assumptions used to establish the fair value assigned to the options issued using the Black-Scholes valuation model:
Nine-month period ended
September 30, 2011
Nine-month period ended
September 30, 2010
Average dividend per share ....................................................... 0% 0%
Average forecasted volatility ...................................................... 60% 60%
Average risk-free interest rate .................................................... 2.25% 2.37%
Average expected life ................................................................ 5 years 5 years
Fair value – weighted average of options issued ....................... $5.34 $2.55
For the nine-month period ended September 30, 2011, the total expense for the stock-based compensation related to the stock-option plans was $2,755,000, compared to $2,853,000 for the corresponding period in 2010 ($440,000 and $784,000 for the third quarter in 2011 and 2010, respectively). Those costs were credited to contributed surplus. The stock-based compensation cost was calculated according to the weighted average fair value of options issued based on the Black-Scholes valuation model using the assumptions shown above and considering the vesting requirements.
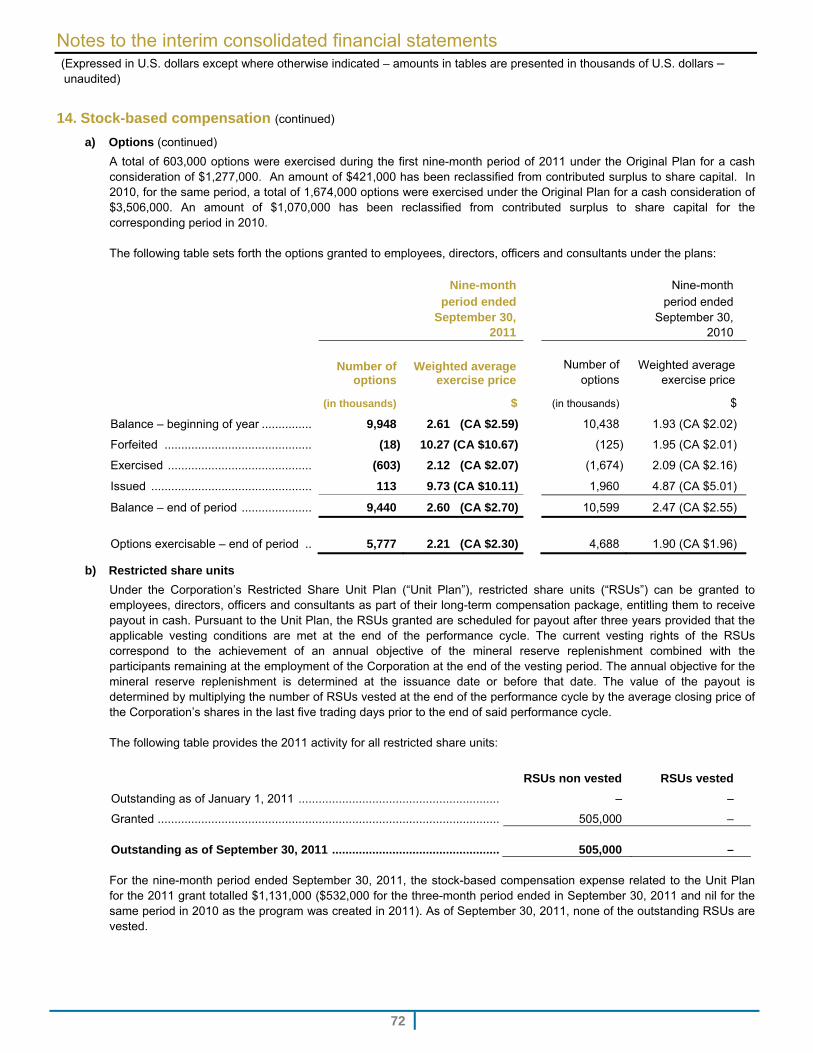
Notes to the interim consolidated financial statements (Expressed in U.S. dollars except where otherwise indicated – amounts in tables are presented in thousands of U.S. dollars –
unaudited)
72
14. Stock-based compensation (continued)
a) Options (continued)
A total of 603,000 options were exercised during the first nine-month period of 2011 under the Original Plan for a cash consideration of $1,277,000. An amount of $421,000 has been reclassified from contributed surplus to share capital. In 2010, for the same period, a total of 1,674,000 options were exercised under the Original Plan for a cash consideration of $3,506,000. An amount of $1,070,000 has been reclassified from contributed surplus to share capital for the corresponding period in 2010. The following table sets forth the options granted to employees, directors, officers and consultants under the plans:
Nine-month period ended
September 30, 2011
Nine-month period ended
September 30, 2010
Number of
options Weighted average
exercise price Number of
options Weighted average
exercise price
(in thousands) $ (in thousands) $
Balance – beginning of year ............... 9,948 2.61 (CA $2.59) 10,438 1.93 (CA $2.02)
Forfeited ............................................ (18) 10.27 (CA $10.67) (125) 1.95 (CA $2.01)
Exercised ........................................... (603) 2.12 (CA $2.07) (1,674) 2.09 (CA $2.16)
Issued ................................................ 113 9.73 (CA $10.11) 1,960 4.87 (CA $5.01)
Balance – end of period ..................... 9,440 2.60 (CA $2.70) 10,599 2.47 (CA $2.55)
Options exercisable – end of period .. 5,777 2.21 (CA $2.30) 4,688 1.90 (CA $1.96)
b) Restricted share units
Under the Corporation’s Restricted Share Unit Plan (“Unit Plan”), restricted share units (“RSUs”) can be granted to employees, directors, officers and consultants as part of their long-term compensation package, entitling them to receive payout in cash. Pursuant to the Unit Plan, the RSUs granted are scheduled for payout after three years provided that the applicable vesting conditions are met at the end of the performance cycle. The current vesting rights of the RSUs correspond to the achievement of an annual objective of the mineral reserve replenishment combined with the participants remaining at the employment of the Corporation at the end of the vesting period. The annual objective for the mineral reserve replenishment is determined at the issuance date or before that date. The value of the payout is determined by multiplying the number of RSUs vested at the end of the performance cycle by the average closing price of the Corporation’s shares in the last five trading days prior to the end of said performance cycle. The following table provides the 2011 activity for all restricted share units:
RSUs non vested RSUs vested
Outstanding as of January 1, 2011 ............................................................ – –
Granted ...................................................................................................... 505,000 – Outstanding as of September 30, 2011 ..................................................
505,000 –
For the nine-month period ended September 30, 2011, the stock-based compensation expense related to the Unit Plan for the 2011 grant totalled $1,131,000 ($532,000 for the three-month period ended in September 30, 2011 and nil for the same period in 2010 as the program was created in 2011). As of September 30, 2011, none of the outstanding RSUs are vested.
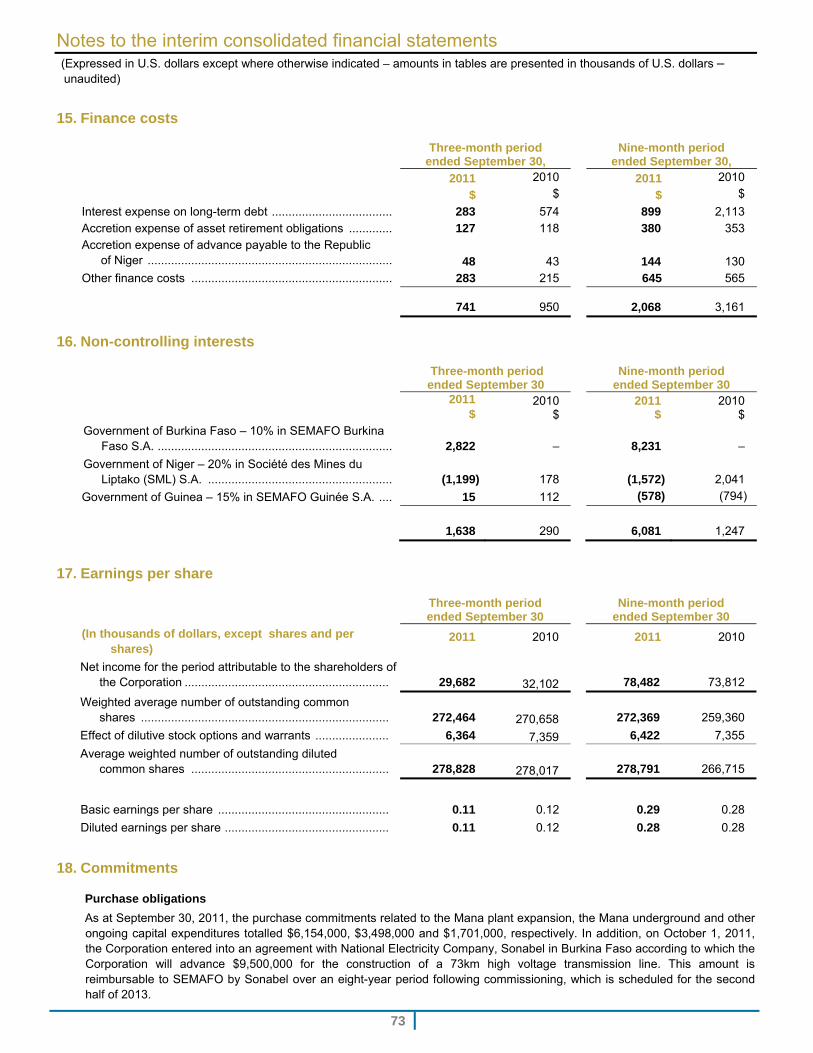
Notes to the interim consolidated financial statements (Expressed in U.S. dollars except where otherwise indicated – amounts in tables are presented in thousands of U.S. dollars –
unaudited)
73
15. Finance costs
Three-month period ended September 30,
Nine-month period ended September 30,
2011 $
2010 $
2011 $
2010 $
Interest expense on long-term debt .................................... 283 574 899 2,113 Accretion expense of asset retirement obligations ............. 127 118 380 353 Accretion expense of advance payable to the Republic
of Niger .........................................................................
48
43
144
130 Other finance costs ............................................................ 283 215 645 565
741 950 2,068 3,161
16. Non-controlling interests
Three-month periodended September 30
Nine-month period ended September 30
2011$
2010 $
2011 $
2010 $
Government of Burkina Faso – 10% in SEMAFO Burkina Faso S.A. ...................................................................... 2,822 –
8,231
–
Government of Niger – 20% in Société des Mines du Liptako (SML) S.A. ....................................................... (1,199) 178
(1,572)
2,041
Government of Guinea – 15% in SEMAFO Guinée S.A. .... 15 112 (578) (794)
1,638 290 6,081
1,247
17. Earnings per share
Three-month period ended September 30
Nine-month period ended September 30
(In thousands of dollars, except shares and per shares)
2011
2010
2011
2010
Net income for the period attributable to the shareholders of the Corporation ............................................................. 29,682 32,102 78,482 73,812
Weighted average number of outstanding common shares .......................................................................... 272,464 270,658 272,369 259,360
Effect of dilutive stock options and warrants ...................... 6,364 7,359 6,422 7,355
Average weighted number of outstanding diluted common shares ........................................................... 278,828 278,017 278,791 266,715
Basic earnings per share ................................................... 0.11 0.12 0.29 0.28
Diluted earnings per share ................................................. 0.11 0.12 0.28 0.28
18. Commitments
Purchase obligations
As at September 30, 2011, the purchase commitments related to the Mana plant expansion, the Mana underground and other ongoing capital expenditures totalled $6,154,000, $3,498,000 and $1,701,000, respectively. In addition, on October 1, 2011, the Corporation entered into an agreement with National Electricity Company, Sonabel in Burkina Faso according to which the Corporation will advance $9,500,000 for the construction of a 73km high voltage transmission line. This amount is reimbursable to SEMAFO by Sonabel over an eight-year period following commissioning, which is scheduled for the second half of 2013.
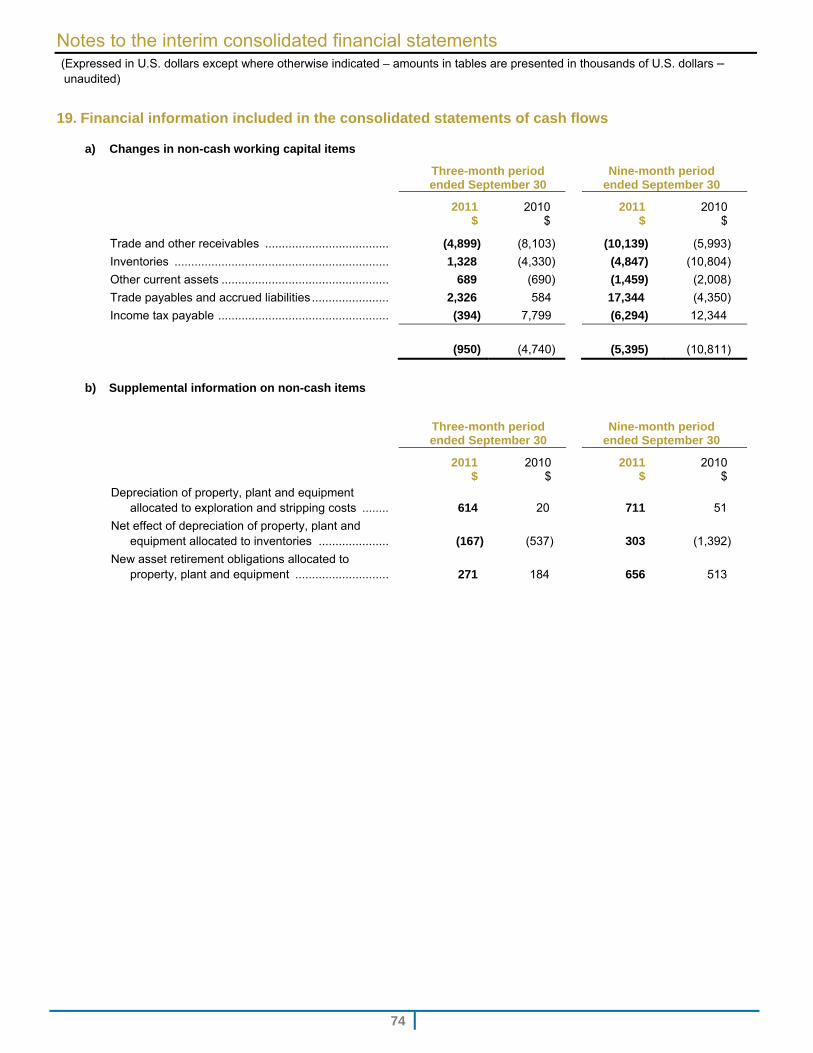
Notes to the interim consolidated financial statements (Expressed in U.S. dollars except where otherwise indicated – amounts in tables are presented in thousands of U.S. dollars –
unaudited)
74
19. Financial information included in the consolidated statements of cash flows
a) Changes in non-cash working capital items
Three-month periodended September 30
Nine-month periodended September 30
2011
$ 2010
$ 2011
$ 2010
$
Trade and other receivables ..................................... (4,899) (8,103) (10,139) (5,993)
Inventories ................................................................ 1,328 (4,330) (4,847) (10,804)
Other current assets .................................................. 689 (690) (1,459) (2,008)
Trade payables and accrued liabilities ....................... 2,326 584 17,344 (4,350)
Income tax payable ................................................... (394) 7,799 (6,294) 12,344
(950) (4,740) (5,395) (10,811)
b) Supplemental information on non-cash items
Three-month periodended September 30
Nine-month periodended September 30
2011
$ 2010
$ 2011
$ 2010
$ Depreciation of property, plant and equipment
allocated to exploration and stripping costs ........ 614 20 711 51
Net effect of depreciation of property, plant and equipment allocated to inventories ..................... (167) (537) 303 (1,392)
New asset retirement obligations allocated to property, plant and equipment ............................ 271 184 656 513
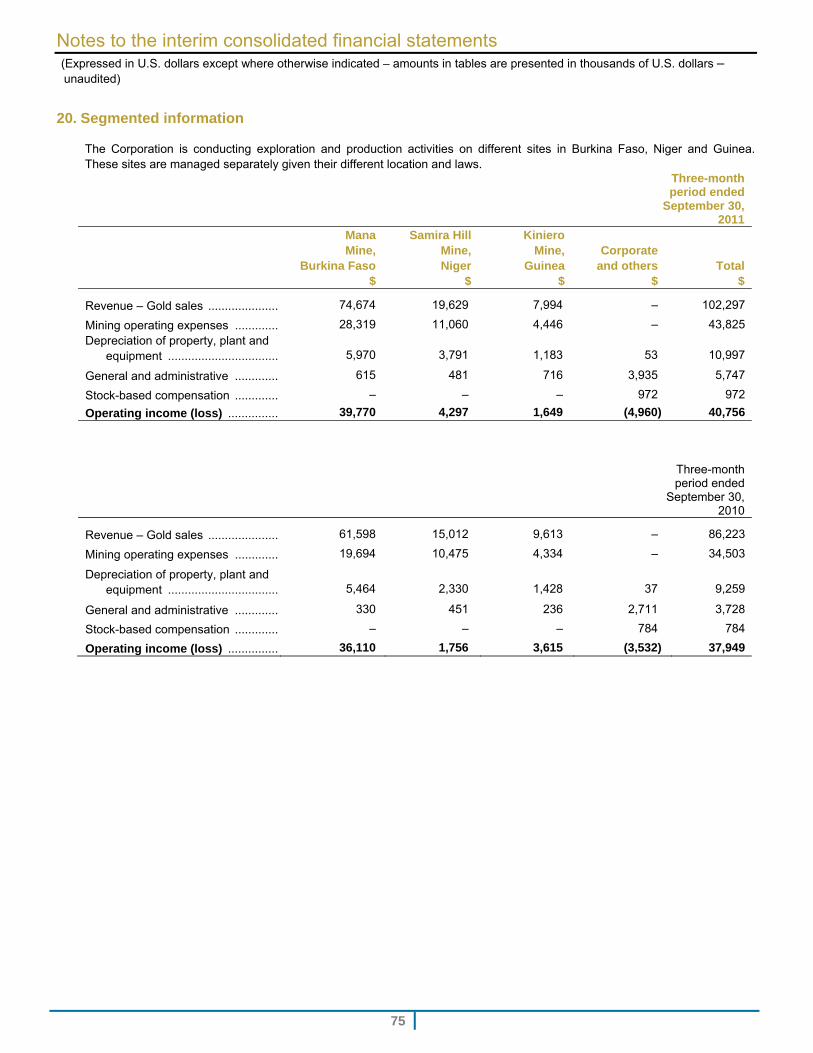
Notes to the interim consolidated financial statements (Expressed in U.S. dollars except where otherwise indicated – amounts in tables are presented in thousands of U.S. dollars –
unaudited)
75
20. Segmented information
The Corporation is conducting exploration and production activities on different sites in Burkina Faso, Niger and Guinea. These sites are managed separately given their different location and laws.
Three-monthperiod ended
September 30, 2011
Mana Mine,
Burkina Faso $
Samira Hill Mine, Niger
$
Kiniero Mine,
Guinea $
Corporate and others
$ Total
$
Revenue – Gold sales ..................... 74,674 19,629 7,994 ‒ 102,297
Mining operating expenses ............. 28,319 11,060 4,446 ‒ 43,825Depreciation of property, plant and
equipment ................................. 5,970 3,791 1,183 53 10,997
General and administrative ............. 615 481 716 3,935 5,747
Stock-based compensation ............. ‒ ‒ ‒ 972 972
Operating income (loss) ............... 39,770 4,297 1,649 (4,960) 40,756
Three-month period ended
September 30, 2010
Revenue – Gold sales ..................... 61,598 15,012 9,613 ‒ 86,223
Mining operating expenses ............. 19,694 10,475 4,334 ‒ 34,503
Depreciation of property, plant and equipment ................................. 5,464 2,330 1,428 37 9,259
General and administrative ............. 330 451 236 2,711 3,728
Stock-based compensation ............. ‒ ‒ ‒ 784 784
Operating income (loss) ............... 36,110 1,756 3,615 (3,532) 37,949
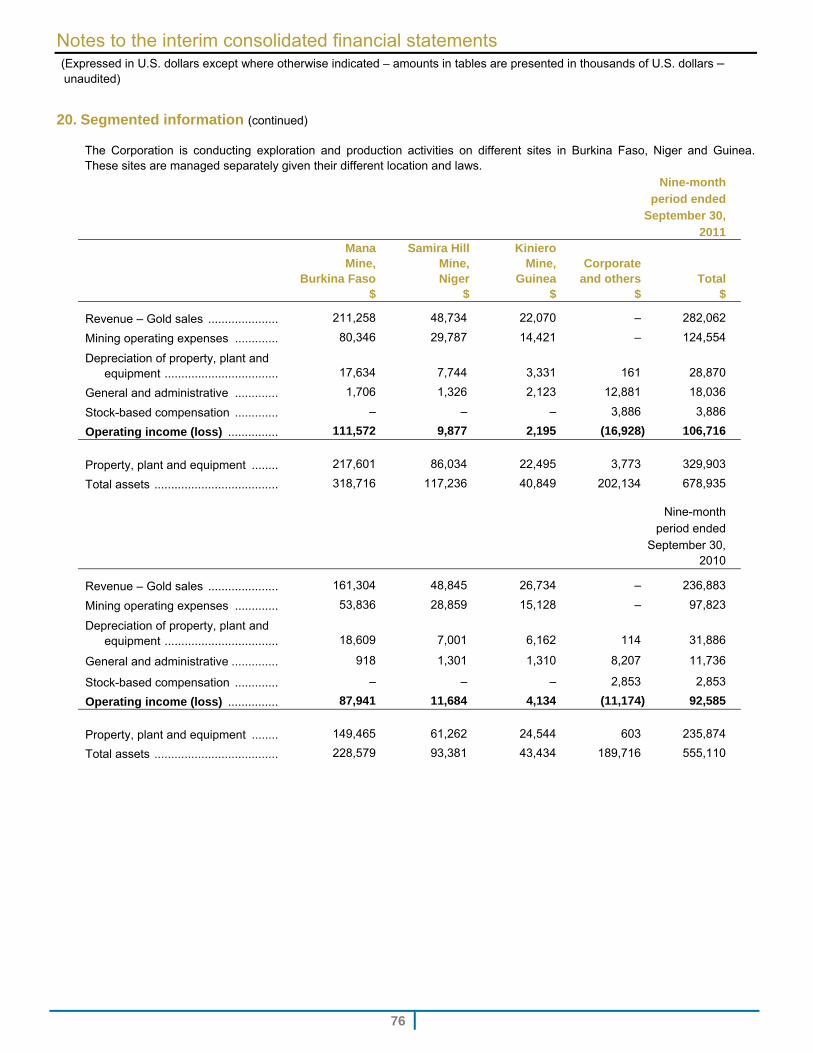
Notes to the interim consolidated financial statements (Expressed in U.S. dollars except where otherwise indicated – amounts in tables are presented in thousands of U.S. dollars –
unaudited)
76
20. Segmented information (continued)
The Corporation is conducting exploration and production activities on different sites in Burkina Faso, Niger and Guinea. These sites are managed separately given their different location and laws.
Nine-month period ended
September 30, 2011
Mana Mine,
Burkina Faso $
Samira Hill Mine, Niger
$
Kiniero Mine,
Guinea $
Corporate and others
$ Total
$
Revenue – Gold sales ..................... 211,258 48,734 22,070 ‒ 282,062
Mining operating expenses ............. 80,346 29,787 14,421 ‒ 124,554
Depreciation of property, plant and equipment .................................. 17,634 7,744 3,331 161 28,870
General and administrative ............. 1,706 1,326 2,123 12,881 18,036
Stock-based compensation ............. ‒ ‒ ‒ 3,886 3,886
Operating income (loss) ............... 111,572 9,877 2,195 (16,928) 106,716
Property, plant and equipment ........ 217,601 86,034 22,495 3,773 329,903
Total assets ..................................... 318,716 117,236 40,849 202,134 678,935
Nine-month period ended
September 30, 2010
Revenue – Gold sales ..................... 161,304 48,845 26,734 ‒ 236,883
Mining operating expenses ............. 53,836 28,859 15,128 ‒ 97,823
Depreciation of property, plant and equipment .................................. 18,609 7,001 6,162 114 31,886
General and administrative .............. 918 1,301 1,310 8,207 11,736
Stock-based compensation ............. ‒ ‒ ‒ 2,853 2,853
Operating income (loss) ............... 87,941 11,684 4,134 (11,174) 92,585
Property, plant and equipment ........ 149,465 61,262 24,544 603 235,874
Total assets ..................................... 228,579 93,381 43,434 189,716 555,110
Notes to the interim consolidated financial statements (Expressed in U.S. dollars except where otherwise indicated – amounts in tables are presented in thousands of U.S. dollars –
unaudited)
77
21. Transition to IFRS
The Corporation’s transition date to IFRS was January 1, 2010. The Corporation prepared its opening IFRS consolidated statement of financial position at that date.
1) Exemptions and exceptions from full retrospective application elected by the Corporation In preparing these interim consolidated financial statements in accordance with IFRS 1, First-time Adoption of International Financial Reporting Standards (“IFRS 1”), the Corporation has applied mandatory transition exceptions and the following exemptions from full retrospective application of IFRS:
IFRS 3, Business Combination election: This election allows the Corporation to adopt IFRS 3 (R) prospectively from
the date of transition. The impact of this exemption is that all prior business combinations will continue to be accounted for as they were under Canadian GAAP.
Leases election: The exemption provided in IFRS 1 from the full retrospective application of IFRIC 4, Determining Whether an Arrangement Contains a Lease (“IFRIC 4”) has been applied to determine whether an arrangement existing as at January 1, 2010 contains a lease based on the facts and circumstances existing at that date. An additional exemption is available to the Corporation that, under Canadian GAAP, has already made an assessment as to whether an arrangement contains a lease, provided their previous conclusion is consistent with the criteria within IAS 17, Leases and IFRIC 4.
The Corporation has elected to apply the exemption from full retrospective application of decommissioning provisions as allowed under IFRS 1. As such, the Corporation has re-measured the provisions as at January 1, 2010 under IAS 37, Provisions, Contingent Liabilities and Contingent Assets, and estimated the amount to be included in the cost of the related asset by discounting the liability to the date at which the liability first arose. The Corporation did this using the best estimate of the historical risk-adjusted discount rates, and recalculated the accumulated depreciation, depletion and depreciation under IFRS up to the transition date. No transitional adjustment was recorded.
The Corporation elected under IFRS 1 not to apply IFRS 2, Share-based Payments (“IFRS 2”), to all equity
instruments of share-based payments that had vested at the transition date. Further, the Corporation elected not to apply IFRS 2 for all cash-settled share-based payments that were settled before the transition date.
The Corporation elected to apply IAS 23, Borrowing Costs prospectively from the date of transition, therefore the accounting of borrowing costs prior to the transition date was not reassessed in the opening IFRS consolidated statement of financial position.
Non-controlling interests: According to this exception the Corporation must, prospectively from the date of transition
to IFRS, attribute the Corporation’s total comprehensive income to the shareholders of the Corporation as well as to the non-controlling interests even if this results in the non-controlling interests having a deficit balance.
Estimates: Hindsight is not used to create or revise estimates. The estimates previously made by the management of
the Corporation under Canadian GAAP were not revised for the application of IFRS except where necessary to reflect any difference in accounting policies.
2) Reconciliation of IFRS and Canadian GAAP
IFRS employs a conceptual framework that is similar to Canadian GAAP. However, significant differences exist in certain matters of recognition, measurement and disclosure. While the adoption of IFRS has not changed the Corporation’s actual cash flows, it has resulted in changes to the Corporation’s reported financial position and statement of income. In order to allow the users of the financial statements to better understand these changes, the Corporation’s Canadian GAAP consolidated statements of operations and comprehensive income for the year ended December 31, 2010 and the three and nine-month periods ended September 30, 2010 as well as the statements of financial position as at January 1, 2010, September 30, 2010 and December 31, 2010, and the consolidated statement of cash flows for the three and nine-month periods ended September 30, 2010 and for the year-ended December 31, 2010 have been reconciled to IFRS, with the resulting differences explained.
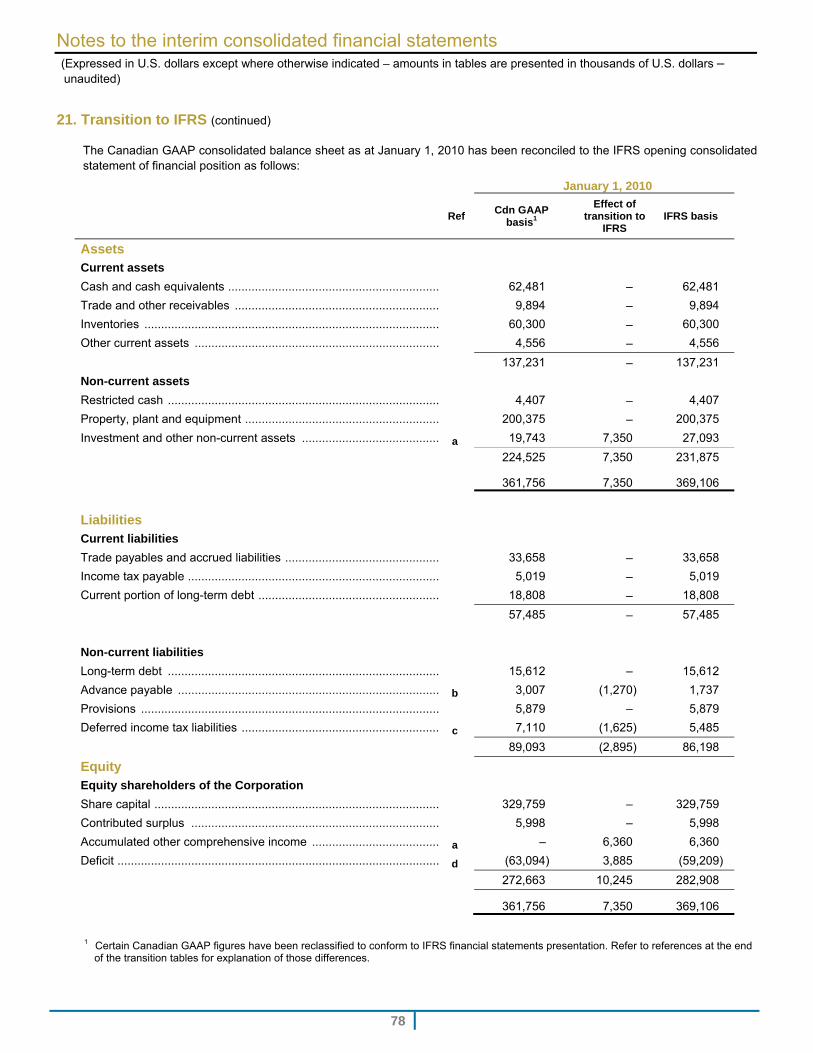
Notes to the interim consolidated financial statements (Expressed in U.S. dollars except where otherwise indicated – amounts in tables are presented in thousands of U.S. dollars –
unaudited)
78
21. Transition to IFRS (continued)
The Canadian GAAP consolidated balance sheet as at January 1, 2010 has been reconciled to the IFRS opening consolidated statement of financial position as follows:
January 1, 2010
Ref Cdn GAAP basis1
Effect of transition to
IFRS IFRS basis
Assets Current assets
Cash and cash equivalents ................................................................ 62,481 – 62,481
Trade and other receivables .............................................................. 9,894 – 9,894
Inventories ......................................................................................... 60,300 – 60,300
Other current assets .......................................................................... 4,556 – 4,556
137,231 – 137,231
Non-current assets
Restricted cash .................................................................................. 4,407 – 4,407
Property, plant and equipment ........................................................... 200,375 – 200,375
Investment and other non-current assets .......................................... a 19,743 7,350 27,093
224,525 7,350 231,875
361,756 7,350 369,106
Liabilities Current liabilities
Trade payables and accrued liabilities ............................................... 33,658 – 33,658
Income tax payable ............................................................................ 5,019 – 5,019
Current portion of long-term debt ....................................................... 18,808 – 18,808
57,485 – 57,485
Non-current liabilities
Long-term debt .................................................................................. 15,612 – 15,612
Advance payable ............................................................................... b 3,007 (1,270) 1,737
Provisions .......................................................................................... 5,879 – 5,879
Deferred income tax liabilities ............................................................ c 7,110 (1,625) 5,485
89,093 (2,895) 86,198
Equity Equity shareholders of the Corporation
Share capital ...................................................................................... 329,759 – 329,759
Contributed surplus ........................................................................... 5,998 – 5,998
Accumulated other comprehensive income ....................................... a – 6,360 6,360
Deficit ................................................................................................. d (63,094) 3,885 (59,209)
272,663 10,245 282,908
361,756 7,350 369,106
1 Certain Canadian GAAP figures have been reclassified to conform to IFRS financial statements presentation. Refer to references at the end of the transition tables for explanation of those differences.
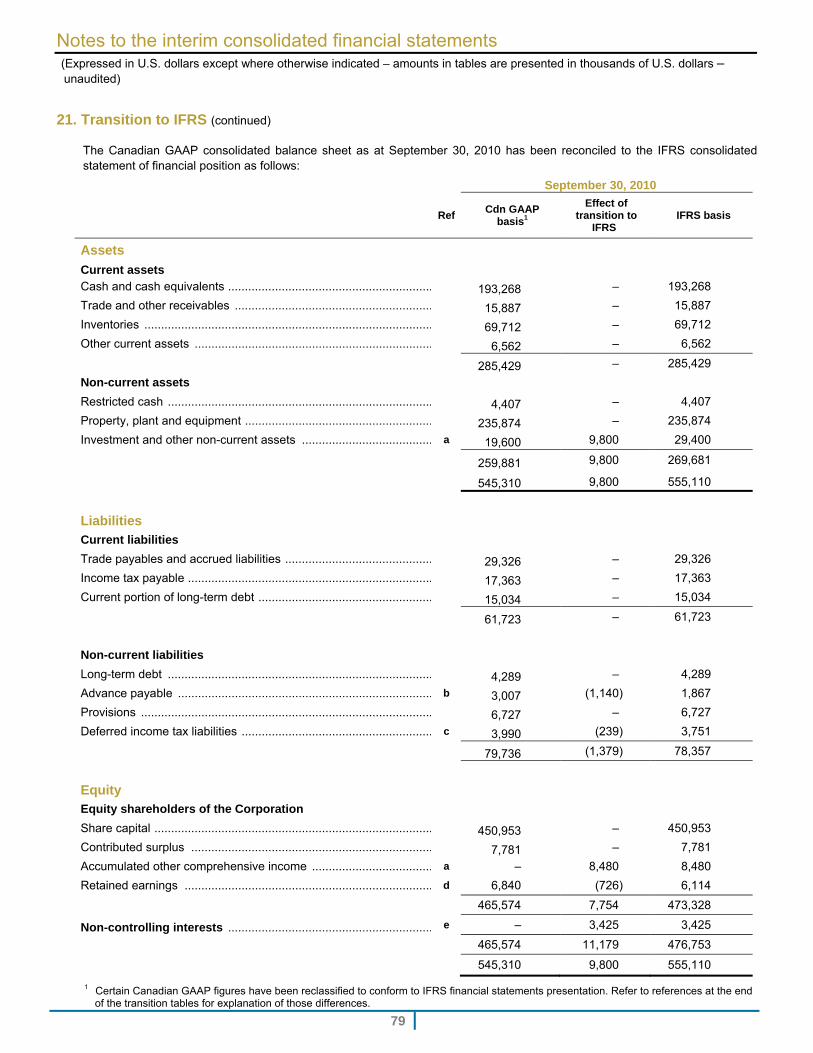
Notes to the interim consolidated financial statements (Expressed in U.S. dollars except where otherwise indicated – amounts in tables are presented in thousands of U.S. dollars –
unaudited)
79
21. Transition to IFRS (continued)
The Canadian GAAP consolidated balance sheet as at September 30, 2010 has been reconciled to the IFRS consolidated statement of financial position as follows:
September 30, 2010
RefCdn GAAP
basis1
Effect of transition to
IFRS IFRS basis
Assets
Current assets Cash and cash equivalents ............................................................. 193,268 ‒ 193,268
Trade and other receivables ........................................................... 15,887 ‒ 15,887
Inventories ...................................................................................... 69,712 ‒ 69,712
Other current assets ....................................................................... 6,562 ‒ 6,562
285,429 ‒ 285,429
Non-current assets
Restricted cash ............................................................................... 4,407 ‒ 4,407
Property, plant and equipment ........................................................ 235,874 ‒ 235,874
Investment and other non-current assets ....................................... a 19,600 9,800 29,400
259,881 9,800 269,681
545,310 9,800 555,110
Liabilities
Current liabilities
Trade payables and accrued liabilities ............................................ 29,326 ‒ 29,326
Income tax payable ......................................................................... 17,363 ‒ 17,363
Current portion of long-term debt .................................................... 15,034 ‒ 15,034
61,723 ‒ 61,723
Non-current liabilities
Long-term debt ............................................................................... 4,289 ‒ 4,289
Advance payable ............................................................................ b 3,007 (1,140) 1,867
Provisions ....................................................................................... 6,727 ‒ 6,727
Deferred income tax liabilities ......................................................... c 3,990 (239) 3,751
79,736 (1,379) 78,357
Equity
Equity shareholders of the Corporation
Share capital ................................................................................... 450,953 ‒ 450,953
Contributed surplus ........................................................................ 7,781 ‒ 7,781
Accumulated other comprehensive income .................................... a ‒ 8,480 8,480
Retained earnings .......................................................................... d 6,840 (726) 6,114
465,574 7,754 473,328
Non-controlling interests ............................................................. e ‒ 3,425 3,425
465,574 11,179 476,753
545,310 9,800 555,110
1 Certain Canadian GAAP figures have been reclassified to conform to IFRS financial statements presentation. Refer to references at the end of the transition tables for explanation of those differences.
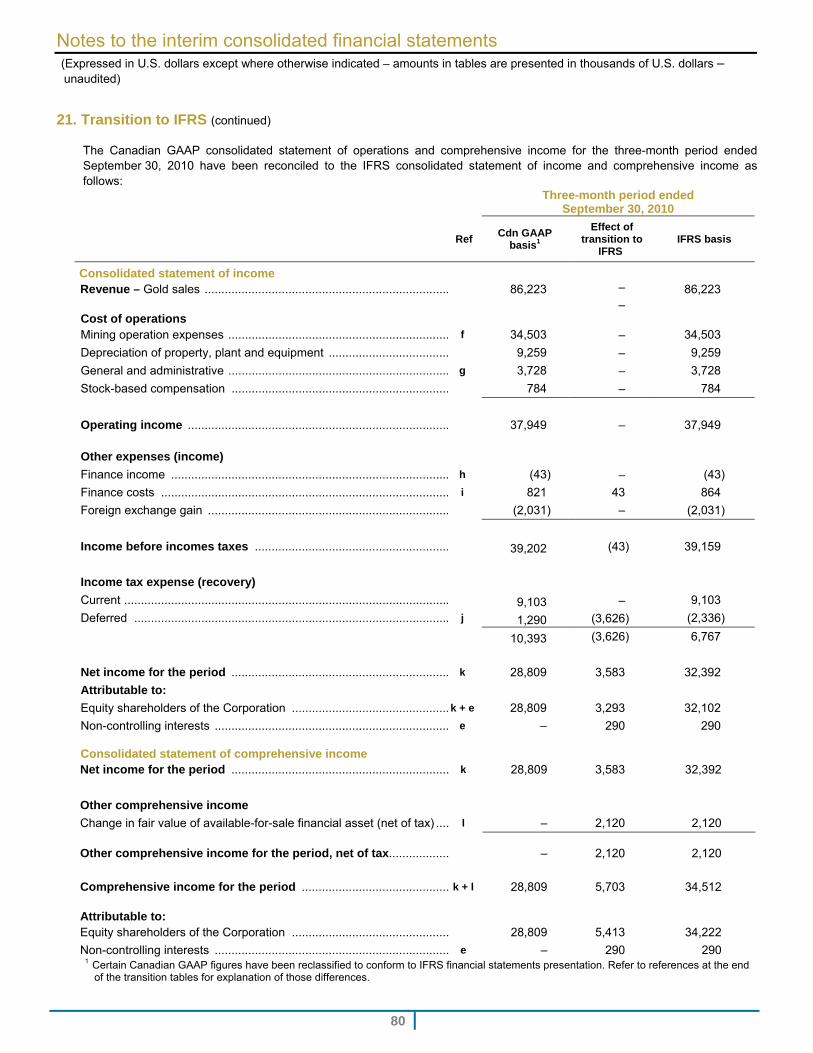
Notes to the interim consolidated financial statements (Expressed in U.S. dollars except where otherwise indicated – amounts in tables are presented in thousands of U.S. dollars –
unaudited)
80
21. Transition to IFRS (continued)
The Canadian GAAP consolidated statement of operations and comprehensive income for the three-month period ended September 30, 2010 have been reconciled to the IFRS consolidated statement of income and comprehensive income as follows:
Three-month period ended September 30, 2010
Ref Cdn GAAP
basis1
Effect of transition to
IFRS IFRS basis
Consolidated statement of income Revenue – Gold sales ......................................................................... 86,223 ‒ 86,223 Cost of operations
‒
Mining operation expenses .................................................................. f 34,503 ‒ 34,503
Depreciation of property, plant and equipment .................................... 9,259 ‒ 9,259
General and administrative .................................................................. g 3,728 ‒ 3,728
Stock-based compensation ................................................................. 784 ‒ 784
Operating income .............................................................................. 37,949 ‒ 37,949
Other expenses (income)
Finance income ................................................................................... h (43) ‒ (43)
Finance costs ...................................................................................... i 821 43 864
Foreign exchange gain ........................................................................ (2,031) ‒ (2,031)
Income before incomes taxes .......................................................... 39,202 (43) 39,159
Income tax expense (recovery)
Current ................................................................................................. 9,103 ‒ 9,103
Deferred .............................................................................................. j 1,290 (3,626) (2,336)
10,393 (3,626) 6,767
Net income for the period ................................................................. k 28,809 3,583 32,392
Attributable to:
Equity shareholders of the Corporation ...............................................k + e 28,809 3,293 32,102
Non-controlling interests ...................................................................... e ‒ 290 290
Consolidated statement of comprehensive income
Net income for the period ................................................................. k 28,809 3,583 32,392
Other comprehensive income
Change in fair value of available-for-sale financial asset (net of tax) .... l ‒ 2,120 2,120
Other comprehensive income for the period, net of tax.................. ‒
2,120
2,120
Comprehensive income for the period ............................................ k + l 28,809 5,703 34,512 Attributable to: Equity shareholders of the Corporation ............................................... 28,809 5,413 34,222
Non-controlling interests ...................................................................... e ‒ 290 290 1 Certain Canadian GAAP figures have been reclassified to conform to IFRS financial statements presentation. Refer to references at the end
of the transition tables for explanation of those differences.
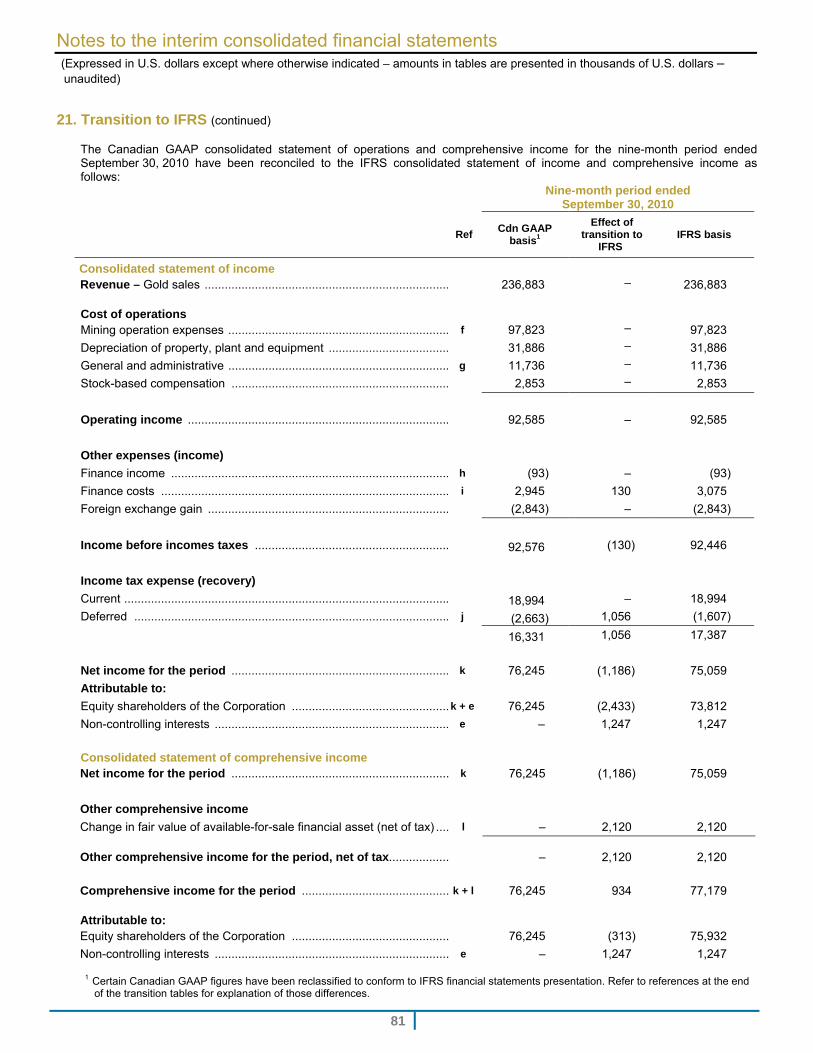
Notes to the interim consolidated financial statements (Expressed in U.S. dollars except where otherwise indicated – amounts in tables are presented in thousands of U.S. dollars –
unaudited)
81
21. Transition to IFRS (continued)
The Canadian GAAP consolidated statement of operations and comprehensive income for the nine-month period ended September 30, 2010 have been reconciled to the IFRS consolidated statement of income and comprehensive income as follows:
Nine-month period ended September 30, 2010
Ref Cdn GAAP
basis1
Effect of transition to
IFRS IFRS basis
Consolidated statement of income Revenue – Gold sales ......................................................................... 236,883 ‒ 236,883 Cost of operations
Mining operation expenses .................................................................. f 97,823 ‒ 97,823
Depreciation of property, plant and equipment .................................... 31,886 ‒ 31,886
General and administrative .................................................................. g 11,736 ‒ 11,736
Stock-based compensation ................................................................. 2,853 ‒ 2,853
Operating income .............................................................................. 92,585 ‒ 92,585
Other expenses (income)
Finance income ................................................................................... h (93) ‒ (93)
Finance costs ...................................................................................... i 2,945 130 3,075
Foreign exchange gain ........................................................................ (2,843) ‒ (2,843)
Income before incomes taxes .......................................................... 92,576 (130) 92,446
Income tax expense (recovery)
Current ................................................................................................. 18,994 ‒ 18,994
Deferred .............................................................................................. j (2,663) 1,056 (1,607)
16,331 1,056 17,387
Net income for the period ................................................................. k 76,245 (1,186) 75,059
Attributable to:
Equity shareholders of the Corporation ...............................................k + e 76,245 (2,433) 73,812
Non-controlling interests ...................................................................... e ‒ 1,247 1,247
Consolidated statement of comprehensive income
Net income for the period ................................................................. k 76,245 (1,186) 75,059
Other comprehensive income
Change in fair value of available-for-sale financial asset (net of tax) .... l ‒ 2,120 2,120
Other comprehensive income for the period, net of tax.................. ‒
2,120
2,120
Comprehensive income for the period ............................................ k + l 76,245 934 77,179 Attributable to: Equity shareholders of the Corporation ............................................... 76,245 (313) 75,932
Non-controlling interests ...................................................................... e ‒ 1,247 1,247
1 Certain Canadian GAAP figures have been reclassified to conform to IFRS financial statements presentation. Refer to references at the end of the transition tables for explanation of those differences.
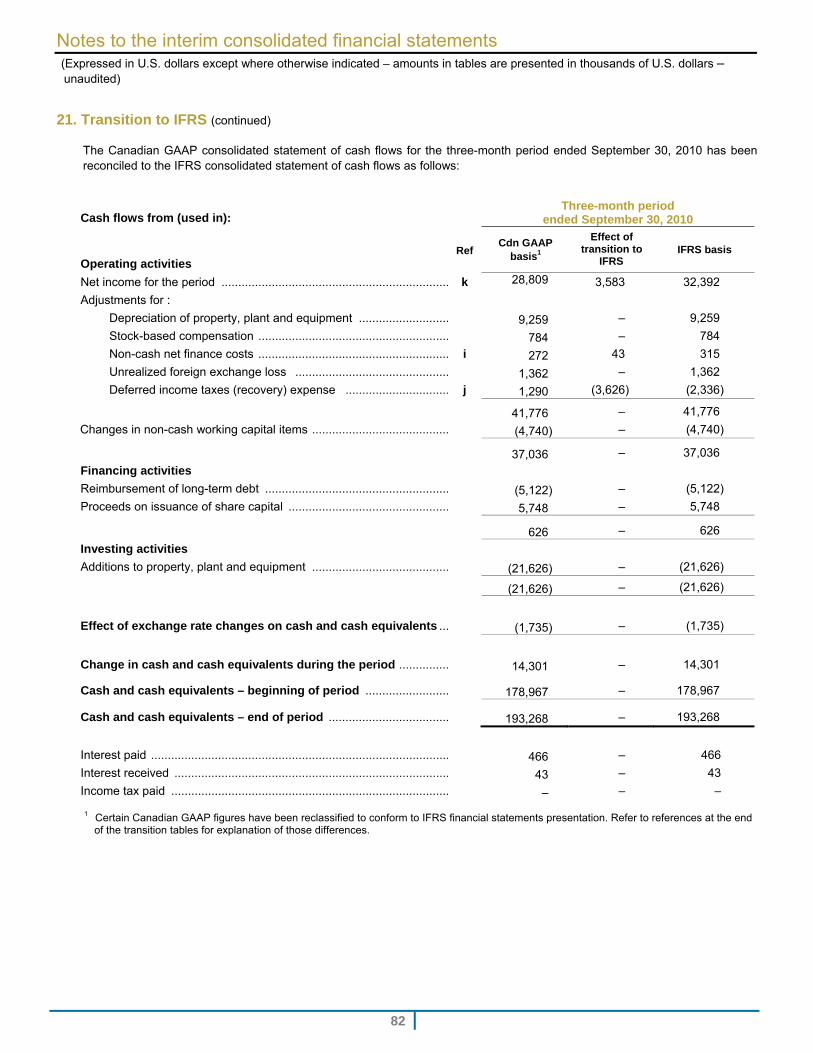
Notes to the interim consolidated financial statements (Expressed in U.S. dollars except where otherwise indicated – amounts in tables are presented in thousands of U.S. dollars –
unaudited)
82
21. Transition to IFRS (continued)
The Canadian GAAP consolidated statement of cash flows for the three-month period ended September 30, 2010 has been reconciled to the IFRS consolidated statement of cash flows as follows:
Cash flows from (used in):
Three-month period
ended September 30, 2010
Operating activities Ref
Cdn GAAP basis1
Effect of transition to
IFRS IFRS basis
Net income for the period .................................................................... k 28,809 3,583 32,392
Adjustments for :
Depreciation of property, plant and equipment ........................... 9,259 – 9,259
Stock-based compensation ......................................................... 784 – 784
Non-cash net finance costs ......................................................... i 272 43 315
Unrealized foreign exchange loss .............................................. 1,362 – 1,362
Deferred income taxes (recovery) expense ............................... j 1,290 (3,626) (2,336)
41,776 – 41,776
Changes in non-cash working capital items ......................................... (4,740) – (4,740)
37,036 – 37,036
Financing activities
Reimbursement of long-term debt ....................................................... (5,122) – (5,122)
Proceeds on issuance of share capital ................................................ 5,748 – 5,748
626 – 626
Investing activities
Additions to property, plant and equipment ......................................... (21,626) – (21,626)
(21,626) – (21,626)
Effect of exchange rate changes on cash and cash equivalents ...
(1,735) – (1,735)
Change in cash and cash equivalents during the period ...............
14,301 – 14,301
Cash and cash equivalents – beginning of period .........................
178,967 – 178,967
Cash and cash equivalents – end of period ....................................
193,268 – 193,268
Interest paid ......................................................................................... 466 – 466
Interest received .................................................................................. 43 – 43
Income tax paid ................................................................................... – – – 1 Certain Canadian GAAP figures have been reclassified to conform to IFRS financial statements presentation. Refer to references at the end
of the transition tables for explanation of those differences.
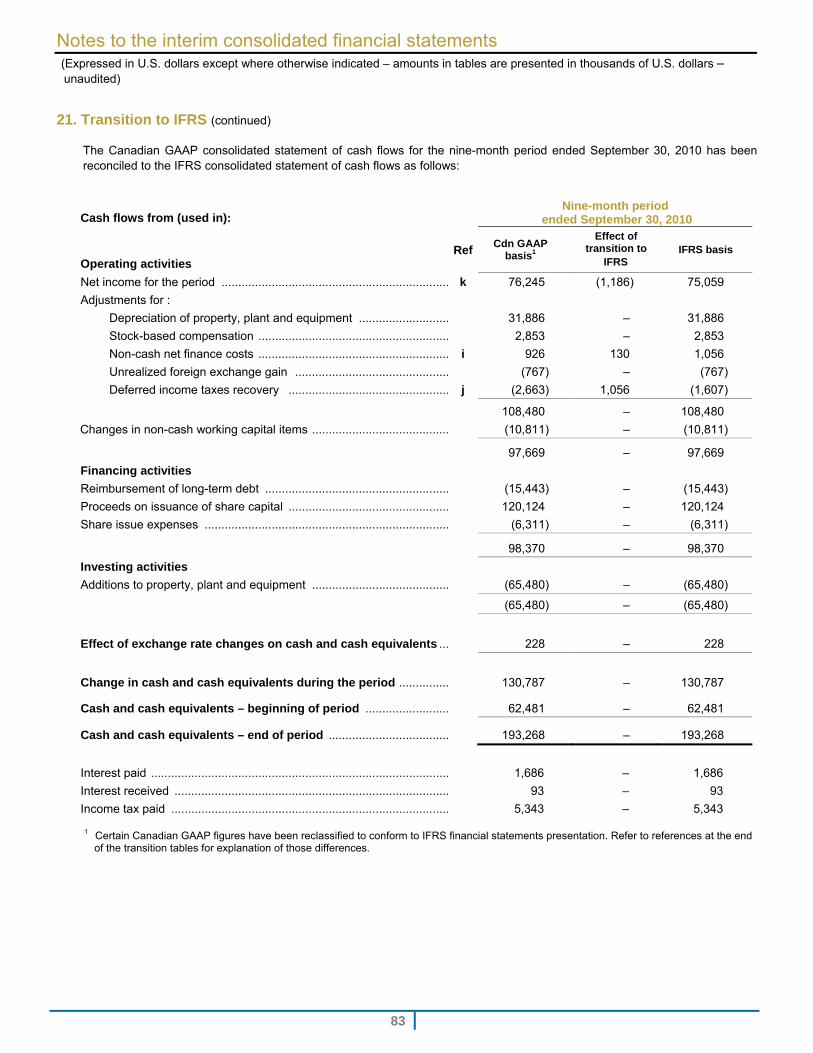
Notes to the interim consolidated financial statements (Expressed in U.S. dollars except where otherwise indicated – amounts in tables are presented in thousands of U.S. dollars –
unaudited)
83
21. Transition to IFRS (continued)
The Canadian GAAP consolidated statement of cash flows for the nine-month period ended September 30, 2010 has been reconciled to the IFRS consolidated statement of cash flows as follows:
Cash flows from (used in):
Nine-month period
ended September 30, 2010
Operating activities Ref
Cdn GAAP basis1
Effect of transition to
IFRS IFRS basis
Net income for the period .................................................................... k 76,245 (1,186) 75,059
Adjustments for :
Depreciation of property, plant and equipment ........................... 31,886 – 31,886
Stock-based compensation ......................................................... 2,853 – 2,853
Non-cash net finance costs ......................................................... i 926 130 1,056
Unrealized foreign exchange gain .............................................. (767) – (767)
Deferred income taxes recovery ................................................ j (2,663) 1,056 (1,607)
108,480 – 108,480
Changes in non-cash working capital items ......................................... (10,811) – (10,811)
97,669 – 97,669
Financing activities
Reimbursement of long-term debt ....................................................... (15,443) – (15,443)
Proceeds on issuance of share capital ................................................ 120,124 – 120,124
Share issue expenses ......................................................................... (6,311) – (6,311)
98,370 – 98,370
Investing activities
Additions to property, plant and equipment ......................................... (65,480) – (65,480)
(65,480) – (65,480)
Effect of exchange rate changes on cash and cash equivalents ...
228 – 228
Change in cash and cash equivalents during the period ...............
130,787 – 130,787
Cash and cash equivalents – beginning of period .........................
62,481 – 62,481
Cash and cash equivalents – end of period ....................................
193,268 – 193,268
Interest paid ......................................................................................... 1,686 – 1,686
Interest received .................................................................................. 93 – 93
Income tax paid ................................................................................... 5,343 – 5,343 1 Certain Canadian GAAP figures have been reclassified to conform to IFRS financial statements presentation. Refer to references at the end
of the transition tables for explanation of those differences.
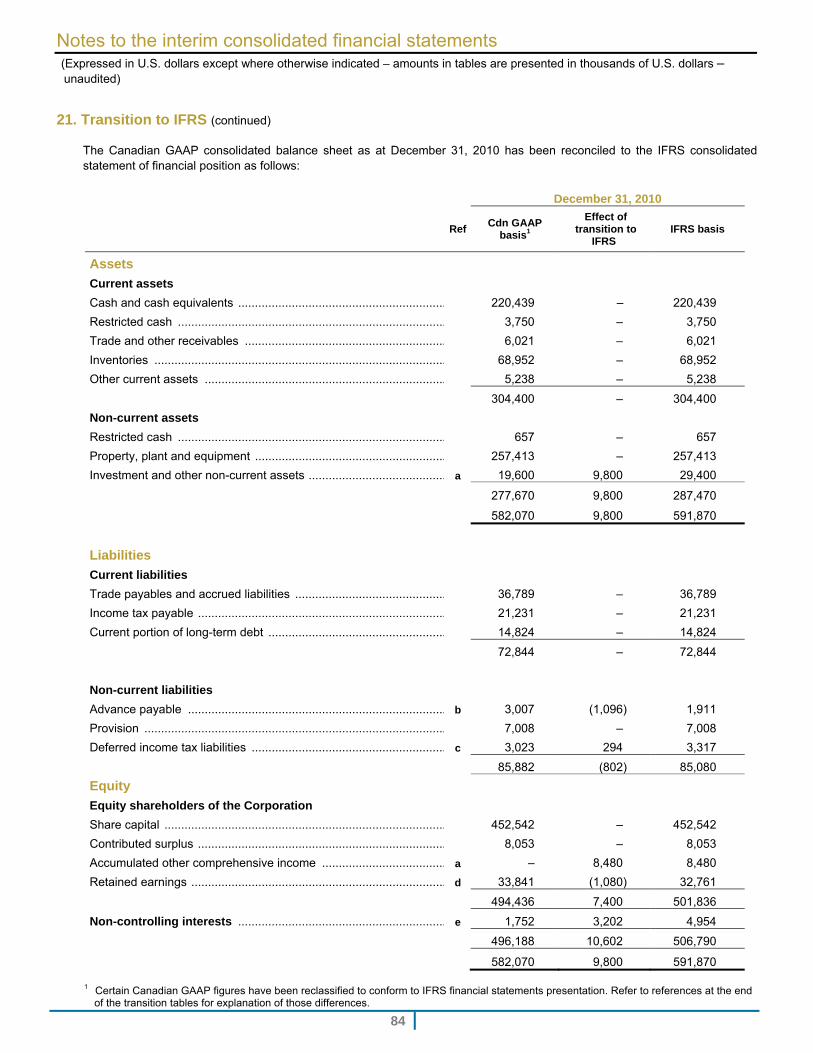
Notes to the interim consolidated financial statements (Expressed in U.S. dollars except where otherwise indicated – amounts in tables are presented in thousands of U.S. dollars –
unaudited)
84
21. Transition to IFRS (continued)
The Canadian GAAP consolidated balance sheet as at December 31, 2010 has been reconciled to the IFRS consolidated statement of financial position as follows:
December 31, 2010
RefCdn GAAP
basis1
Effect of transition to
IFRS IFRS basis
Assets
Current assets
Cash and cash equivalents .............................................................. 220,439 – 220,439
Restricted cash ................................................................................ 3,750 – 3,750
Trade and other receivables ............................................................ 6,021 – 6,021
Inventories ....................................................................................... 68,952 – 68,952
Other current assets ........................................................................ 5,238 – 5,238
304,400 – 304,400
Non-current assets
Restricted cash ................................................................................ 657 – 657
Property, plant and equipment ......................................................... 257,413 – 257,413
Investment and other non-current assets ......................................... a 19,600 9,800 29,400
277,670 9,800 287,470
582,070 9,800 591,870
Liabilities
Current liabilities
Trade payables and accrued liabilities ............................................. 36,789 – 36,789
Income tax payable .......................................................................... 21,231 – 21,231
Current portion of long-term debt ..................................................... 14,824 – 14,824
72,844 – 72,844
Non-current liabilities
Advance payable ............................................................................. b 3,007 (1,096) 1,911
Provision .......................................................................................... 7,008 – 7,008
Deferred income tax liabilities .......................................................... c 3,023 294 3,317
85,882 (802) 85,080
Equity
Equity shareholders of the Corporation
Share capital .................................................................................... 452,542 – 452,542
Contributed surplus .......................................................................... 8,053 – 8,053
Accumulated other comprehensive income ..................................... a – 8,480 8,480
Retained earnings ............................................................................ d 33,841 (1,080) 32,761
494,436 7,400 501,836
Non-controlling interests .............................................................. e 1,752 3,202 4,954
496,188 10,602 506,790
582,070 9,800 591,870
1 Certain Canadian GAAP figures have been reclassified to conform to IFRS financial statements presentation. Refer to references at the end of the transition tables for explanation of those differences.
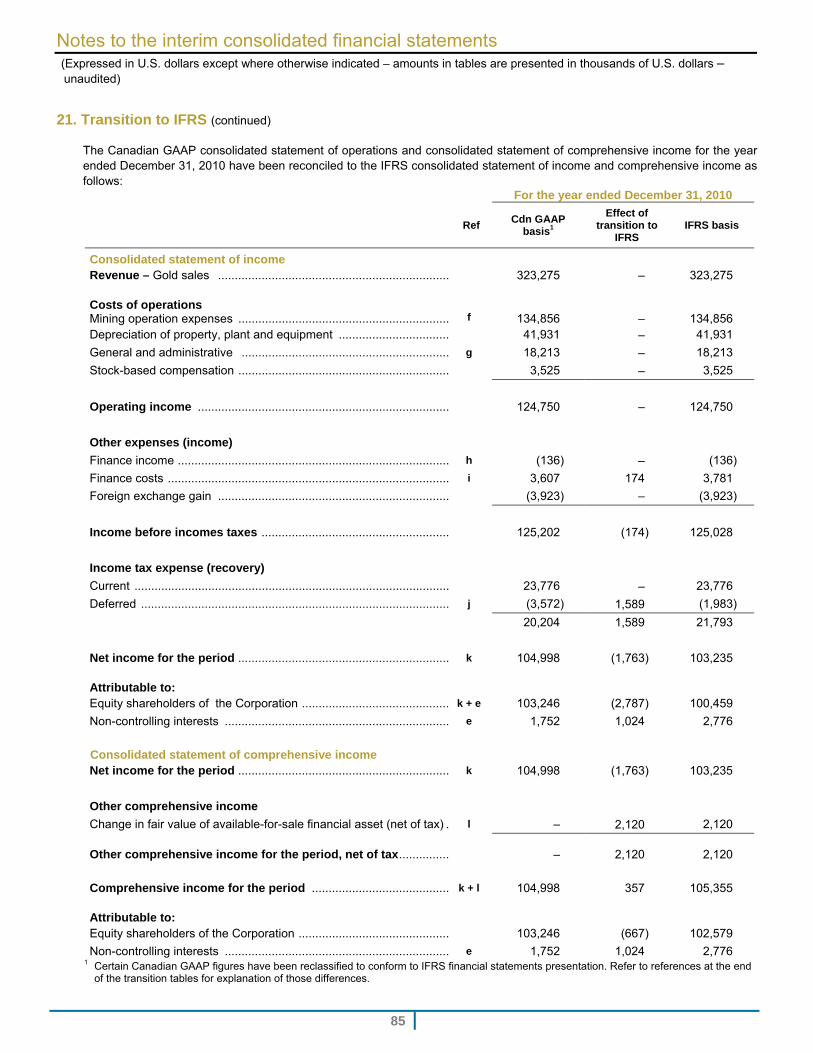
Notes to the interim consolidated financial statements (Expressed in U.S. dollars except where otherwise indicated – amounts in tables are presented in thousands of U.S. dollars –
unaudited)
85
21. Transition to IFRS (continued)
The Canadian GAAP consolidated statement of operations and consolidated statement of comprehensive income for the year ended December 31, 2010 have been reconciled to the IFRS consolidated statement of income and comprehensive income as follows:
For the year ended December 31, 2010
Ref Cdn GAAP basis1
Effect of transition to
IFRS IFRS basis
Consolidated statement of income Revenue – Gold sales ...................................................................... 323,275 ‒ 323,275 Costs of operations Mining operation expenses ................................................................
f
134,856
‒
134,856 Depreciation of property, plant and equipment .................................. 41,931 ‒ 41,931
General and administrative ............................................................... g 18,213 ‒ 18,213
Stock-based compensation ................................................................ 3,525 ‒ 3,525
Operating income ............................................................................ 124,750 ‒ 124,750
Other expenses (income)
Finance income .................................................................................. h (136) ‒ (136)
Finance costs ..................................................................................... i 3,607 174 3,781
Foreign exchange gain ...................................................................... (3,923) ‒ (3,923)
Income before incomes taxes ......................................................... 125,202 (174) 125,028
Income tax expense (recovery)
Current ............................................................................................... 23,776 ‒ 23,776
Deferred ............................................................................................. j (3,572) 1,589 (1,983)
20,204 1,589 21,793
Net income for the period ................................................................ k 104,998 (1,763) 103,235 Attributable to: Equity shareholders of the Corporation ............................................. k + e 103,246 (2,787) 100,459
Non-controlling interests .................................................................... e 1,752 1,024 2,776
Consolidated statement of comprehensive income
Net income for the period ................................................................ k 104,998 (1,763) 103,235
Other comprehensive income
Change in fair value of available-for-sale financial asset (net of tax) .. l ‒ 2,120 2,120
Other comprehensive income for the period, net of tax ................ ‒
2,120
2,120
Comprehensive income for the period .......................................... k + l 104,998 357 105,355 Attributable to: Equity shareholders of the Corporation .............................................. 103,246 (667) 102,579
Non-controlling interests .................................................................... e 1,752 1,024 2,776 1 Certain Canadian GAAP figures have been reclassified to conform to IFRS financial statements presentation. Refer to references at the end
of the transition tables for explanation of those differences.
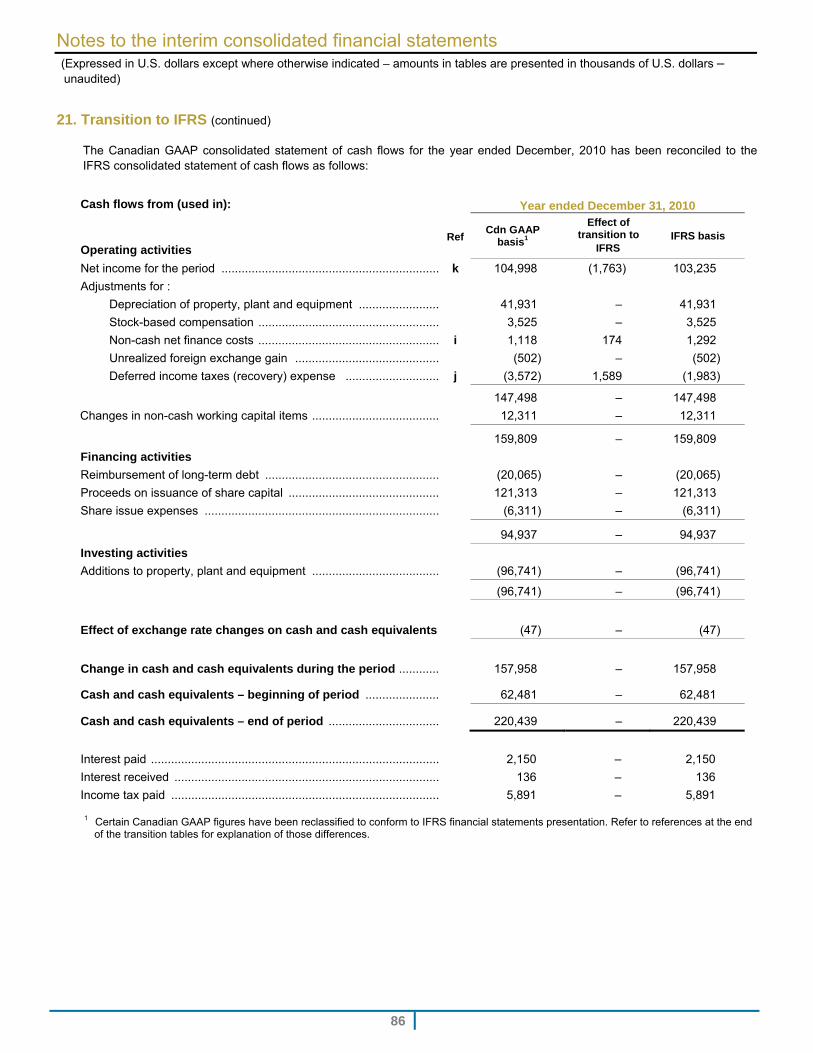
Notes to the interim consolidated financial statements (Expressed in U.S. dollars except where otherwise indicated – amounts in tables are presented in thousands of U.S. dollars –
unaudited)
86
21. Transition to IFRS (continued)
The Canadian GAAP consolidated statement of cash flows for the year ended December, 2010 has been reconciled to the IFRS consolidated statement of cash flows as follows:
Cash flows from (used in):
Year ended December 31, 2010
Operating activities Ref
Cdn GAAP basis1
Effect of transition to
IFRS IFRS basis
Net income for the period .................................................................. k 104,998 (1,763) 103,235
Adjustments for :
Depreciation of property, plant and equipment ......................... 41,931 – 41,931
Stock-based compensation ....................................................... 3,525 – 3,525
Non-cash net finance costs ....................................................... i 1,118 174 1,292
Unrealized foreign exchange gain ............................................ (502) – (502)
Deferred income taxes (recovery) expense ............................. j (3,572) 1,589 (1,983)
147,498 – 147,498
Changes in non-cash working capital items ....................................... 12,311 – 12,311
159,809 – 159,809
Financing activities
Reimbursement of long-term debt ..................................................... (20,065) – (20,065)
Proceeds on issuance of share capital .............................................. 121,313 – 121,313
Share issue expenses ....................................................................... (6,311) – (6,311)
94,937 – 94,937
Investing activities
Additions to property, plant and equipment ....................................... (96,741) – (96,741)
(96,741) – (96,741)
Effect of exchange rate changes on cash and cash equivalents .
(47) – (47)
Change in cash and cash equivalents during the period .............
157,958 – 157,958
Cash and cash equivalents – beginning of period .......................
62,481 – 62,481
Cash and cash equivalents – end of period ..................................
220,439 – 220,439
Interest paid ....................................................................................... 2,150 – 2,150
Interest received ................................................................................ 136 – 136
Income tax paid ................................................................................. 5,891 – 5,891 1 Certain Canadian GAAP figures have been reclassified to conform to IFRS financial statements presentation. Refer to references at the end
of the transition tables for explanation of those differences.
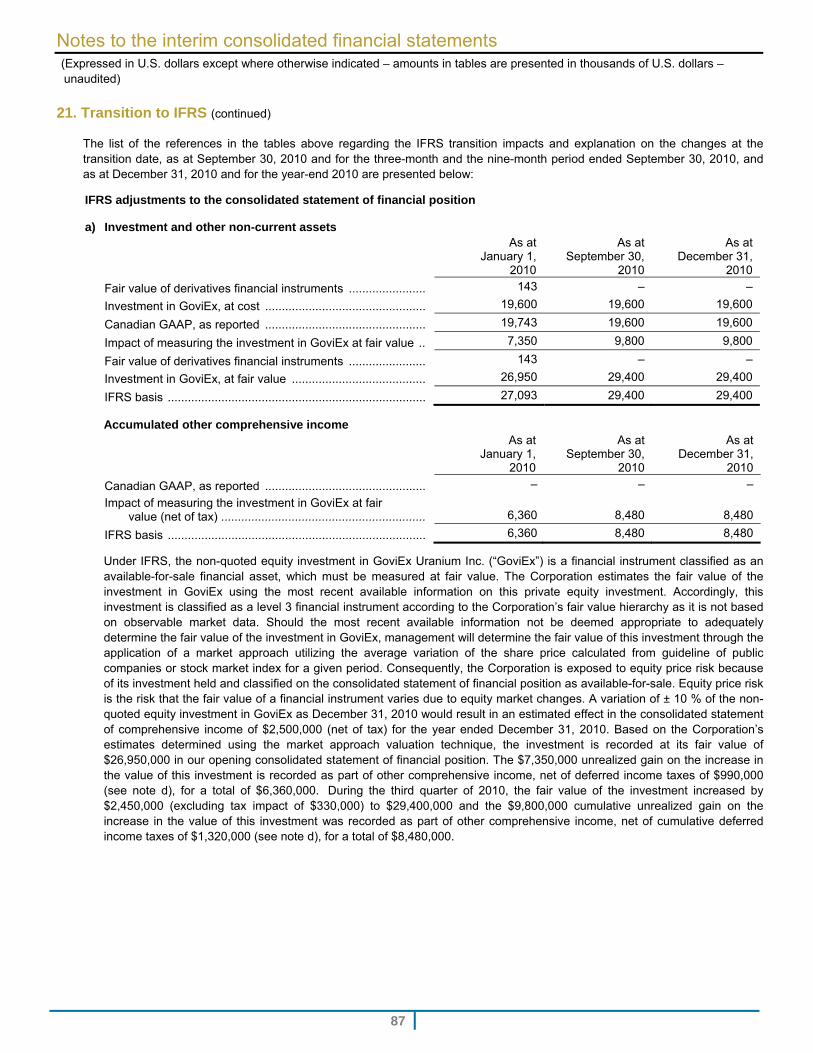
Notes to the interim consolidated financial statements (Expressed in U.S. dollars except where otherwise indicated – amounts in tables are presented in thousands of U.S. dollars –
unaudited)
87
21. Transition to IFRS (continued)
The list of the references in the tables above regarding the IFRS transition impacts and explanation on the changes at the transition date, as at September 30, 2010 and for the three-month and the nine-month period ended September 30, 2010, and as at December 31, 2010 and for the year-end 2010 are presented below:
IFRS adjustments to the consolidated statement of financial position
a) Investment and other non-current assets As at
January 1, 2010
As at September 30,
2010
As at December 31,
2010
Fair value of derivatives financial instruments ....................... 143 ‒ ‒
Investment in GoviEx, at cost ................................................ 19,600 19,600 19,600
Canadian GAAP, as reported ................................................ 19,743 19,600 19,600
Impact of measuring the investment in GoviEx at fair value .. 7,350 9,800 9,800
Fair value of derivatives financial instruments ....................... 143 ‒ ‒
Investment in GoviEx, at fair value ........................................ 26,950 29,400 29,400
IFRS basis ............................................................................. 27,093 29,400 29,400
Accumulated other comprehensive income As at
January 1, 2010
As at September 30,
2010
As at December 31,
2010
Canadian GAAP, as reported ................................................ ‒ ‒ ‒
Impact of measuring the investment in GoviEx at fair value (net of tax) ............................................................. 6,360
8,480
8,480
IFRS basis ............................................................................. 6,360 8,480 8,480
Under IFRS, the non-quoted equity investment in GoviEx Uranium Inc. (“GoviEx”) is a financial instrument classified as an available-for-sale financial asset, which must be measured at fair value. The Corporation estimates the fair value of the investment in GoviEx using the most recent available information on this private equity investment. Accordingly, this investment is classified as a level 3 financial instrument according to the Corporation’s fair value hierarchy as it is not based on observable market data. Should the most recent available information not be deemed appropriate to adequately determine the fair value of the investment in GoviEx, management will determine the fair value of this investment through the application of a market approach utilizing the average variation of the share price calculated from guideline of public companies or stock market index for a given period. Consequently, the Corporation is exposed to equity price risk because of its investment held and classified on the consolidated statement of financial position as available-for-sale. Equity price risk is the risk that the fair value of a financial instrument varies due to equity market changes. A variation of ± 10 % of the non-quoted equity investment in GoviEx as December 31, 2010 would result in an estimated effect in the consolidated statement of comprehensive income of $2,500,000 (net of tax) for the year ended December 31, 2010. Based on the Corporation’s estimates determined using the market approach valuation technique, the investment is recorded at its fair value of $26,950,000 in our opening consolidated statement of financial position. The $7,350,000 unrealized gain on the increase in the value of this investment is recorded as part of other comprehensive income, net of deferred income taxes of $990,000 (see note d), for a total of $6,360,000. During the third quarter of 2010, the fair value of the investment increased by $2,450,000 (excluding tax impact of $330,000) to $29,400,000 and the $9,800,000 cumulative unrealized gain on the increase in the value of this investment was recorded as part of other comprehensive income, net of cumulative deferred income taxes of $1,320,000 (see note d), for a total of $8,480,000.
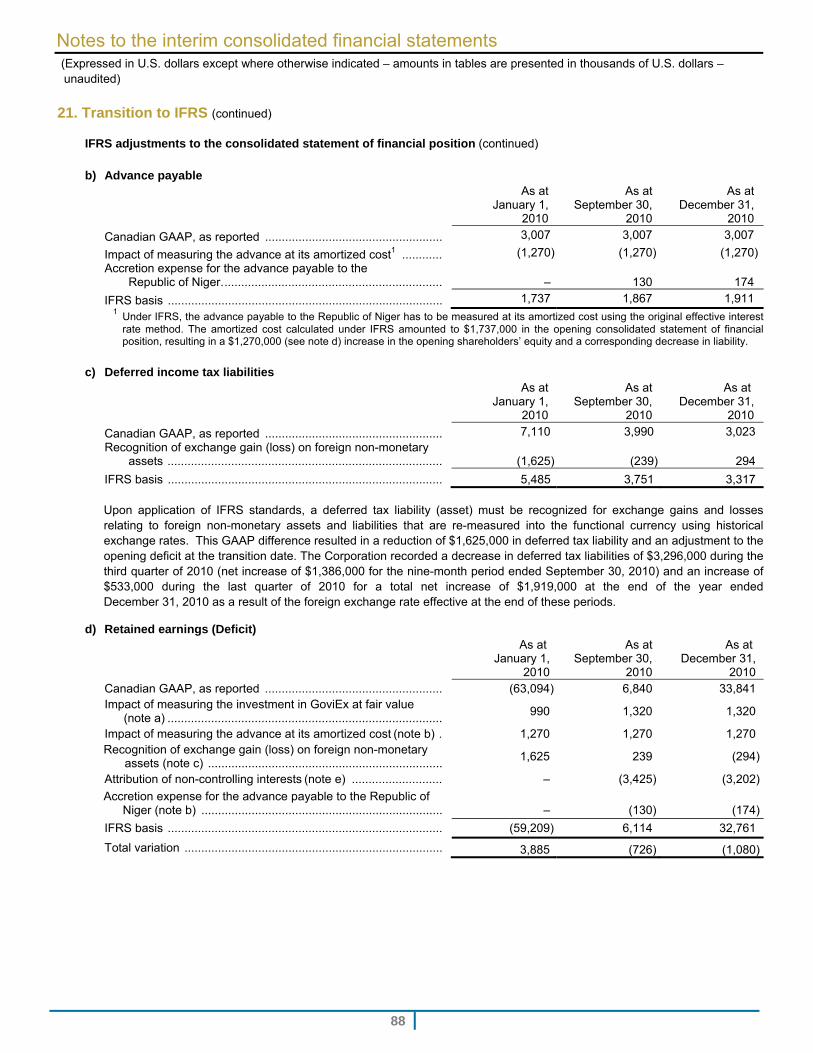
Notes to the interim consolidated financial statements (Expressed in U.S. dollars except where otherwise indicated – amounts in tables are presented in thousands of U.S. dollars –
unaudited)
88
21. Transition to IFRS (continued)
IFRS adjustments to the consolidated statement of financial position (continued)
b) Advance payable As at
January 1, 2010
As at September 30,
2010
As at December 31,
2010
Canadian GAAP, as reported ..................................................... 3,007 3,007 3,007
Impact of measuring the advance at its amortized cost1 ............ (1,270) (1,270) (1,270)Accretion expense for the advance payable to the
Republic of Niger. ................................................................. –
130
174
IFRS basis .................................................................................. 1,737 1,867 1,911 1
Under IFRS, the advance payable to the Republic of Niger has to be measured at its amortized cost using the original effective interest rate method. The amortized cost calculated under IFRS amounted to $1,737,000 in the opening consolidated statement of financial position, resulting in a $1,270,000 (see note d) increase in the opening shareholders’ equity and a corresponding decrease in liability.
c) Deferred income tax liabilities
As at January 1,
2010
As at September 30,
2010
As at December 31,
2010
Canadian GAAP, as reported ..................................................... 7,110 3,990 3,023 Recognition of exchange gain (loss) on foreign non-monetary
assets .................................................................................. (1,625) (239)
294
IFRS basis .................................................................................. 5,485 3,751 3,317 Upon application of IFRS standards, a deferred tax liability (asset) must be recognized for exchange gains and losses relating to foreign non-monetary assets and liabilities that are re-measured into the functional currency using historical exchange rates. This GAAP difference resulted in a reduction of $1,625,000 in deferred tax liability and an adjustment to the opening deficit at the transition date. The Corporation recorded a decrease in deferred tax liabilities of $3,296,000 during the third quarter of 2010 (net increase of $1,386,000 for the nine-month period ended September 30, 2010) and an increase of $533,000 during the last quarter of 2010 for a total net increase of $1,919,000 at the end of the year ended December 31, 2010 as a result of the foreign exchange rate effective at the end of these periods.
d) Retained earnings (Deficit) As at
January 1, 2010
As at September 30,
2010
As at December 31,
2010Canadian GAAP, as reported ..................................................... (63,094) 6,840 33,841 Impact of measuring the investment in GoviEx at fair value
(note a) .................................................................................. 990 1,320 1,320
Impact of measuring the advance at its amortized cost (note b) . 1,270 1,270 1,270 Recognition of exchange gain (loss) on foreign non-monetary
assets (note c) ...................................................................... 1,625 239 (294)
Attribution of non-controlling interests (note e) ........................... – (3,425) (3,202)
Accretion expense for the advance payable to the Republic of Niger (note b) ........................................................................ –
(130)
(174)
IFRS basis .................................................................................. (59,209) 6,114 32,761
Total variation ............................................................................. 3,885 (726) (1,080)
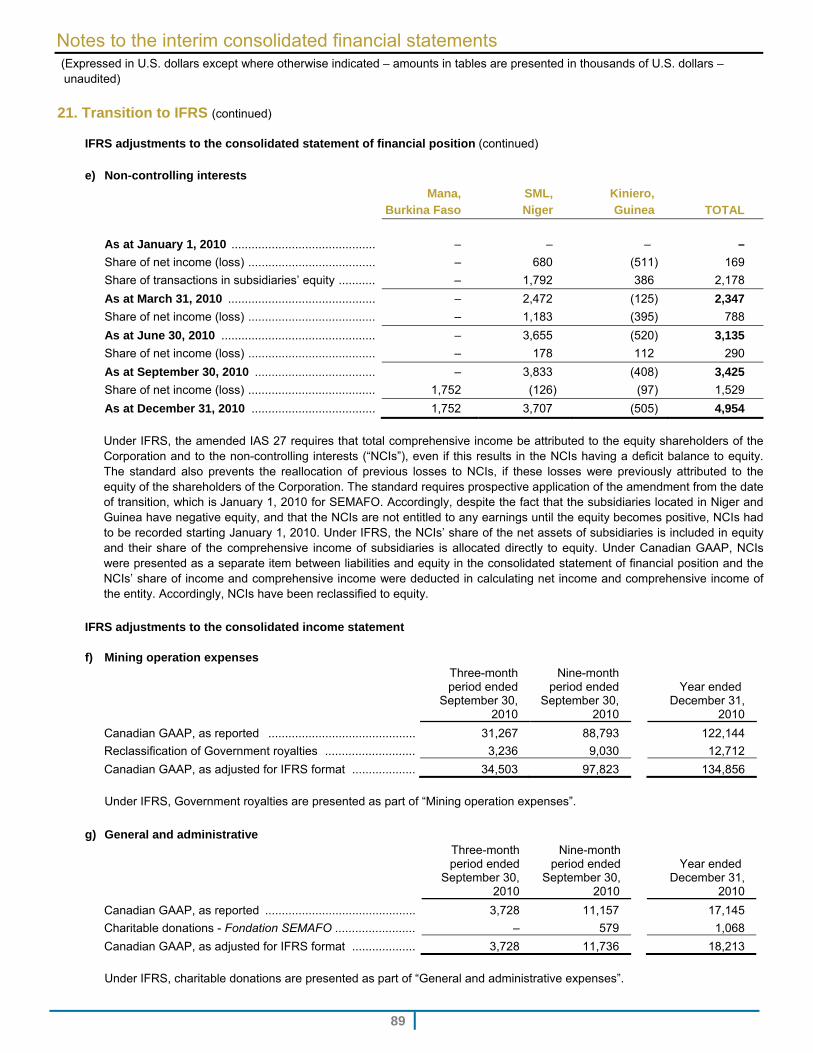
Notes to the interim consolidated financial statements (Expressed in U.S. dollars except where otherwise indicated – amounts in tables are presented in thousands of U.S. dollars –
unaudited)
89
21. Transition to IFRS (continued)
IFRS adjustments to the consolidated statement of financial position (continued)
e) Non-controlling interests
Mana, Burkina Faso
SML, Niger
Kiniero, Guinea TOTAL
As at January 1, 2010 ........................................... – – – –
Share of net income (loss) ...................................... – 680 (511) 169
Share of transactions in subsidiaries’ equity ........... – 1,792 386 2,178
As at March 31, 2010 ............................................ – 2,472 (125) 2,347
Share of net income (loss) ...................................... – 1,183 (395) 788
As at June 30, 2010 .............................................. – 3,655 (520) 3,135
Share of net income (loss) ...................................... – 178 112 290
As at September 30, 2010 .................................... – 3,833 (408) 3,425
Share of net income (loss) ...................................... 1,752 (126) (97) 1,529
As at December 31, 2010 ..................................... 1,752 3,707 (505) 4,954
Under IFRS, the amended IAS 27 requires that total comprehensive income be attributed to the equity shareholders of the Corporation and to the non-controlling interests (“NCIs”), even if this results in the NCIs having a deficit balance to equity. The standard also prevents the reallocation of previous losses to NCIs, if these losses were previously attributed to the equity of the shareholders of the Corporation. The standard requires prospective application of the amendment from the date of transition, which is January 1, 2010 for SEMAFO. Accordingly, despite the fact that the subsidiaries located in Niger and Guinea have negative equity, and that the NCIs are not entitled to any earnings until the equity becomes positive, NCIs had to be recorded starting January 1, 2010. Under IFRS, the NCIs’ share of the net assets of subsidiaries is included in equity and their share of the comprehensive income of subsidiaries is allocated directly to equity. Under Canadian GAAP, NCIs were presented as a separate item between liabilities and equity in the consolidated statement of financial position and the NCIs’ share of income and comprehensive income were deducted in calculating net income and comprehensive income of the entity. Accordingly, NCIs have been reclassified to equity.
IFRS adjustments to the consolidated income statement f) Mining operation expenses
Three-month period ended
September 30, 2010
Nine-month period ended
September 30, 2010
Year ended December 31,
2010
Canadian GAAP, as reported ............................................ 31,267 88,793 122,144
Reclassification of Government royalties ........................... 3,236 9,030 12,712
Canadian GAAP, as adjusted for IFRS format ................... 34,503 97,823 134,856
Under IFRS, Government royalties are presented as part of “Mining operation expenses”.
g) General and administrative Three-month period ended
September 30, 2010
Nine-month period ended
September 30, 2010
Year ended
December 31, 2010
Canadian GAAP, as reported ............................................. 3,728 11,157 17,145
Charitable donations - Fondation SEMAFO ........................ – 579 1,068
Canadian GAAP, as adjusted for IFRS format ................... 3,728 11,736 18,213
Under IFRS, charitable donations are presented as part of “General and administrative expenses”.
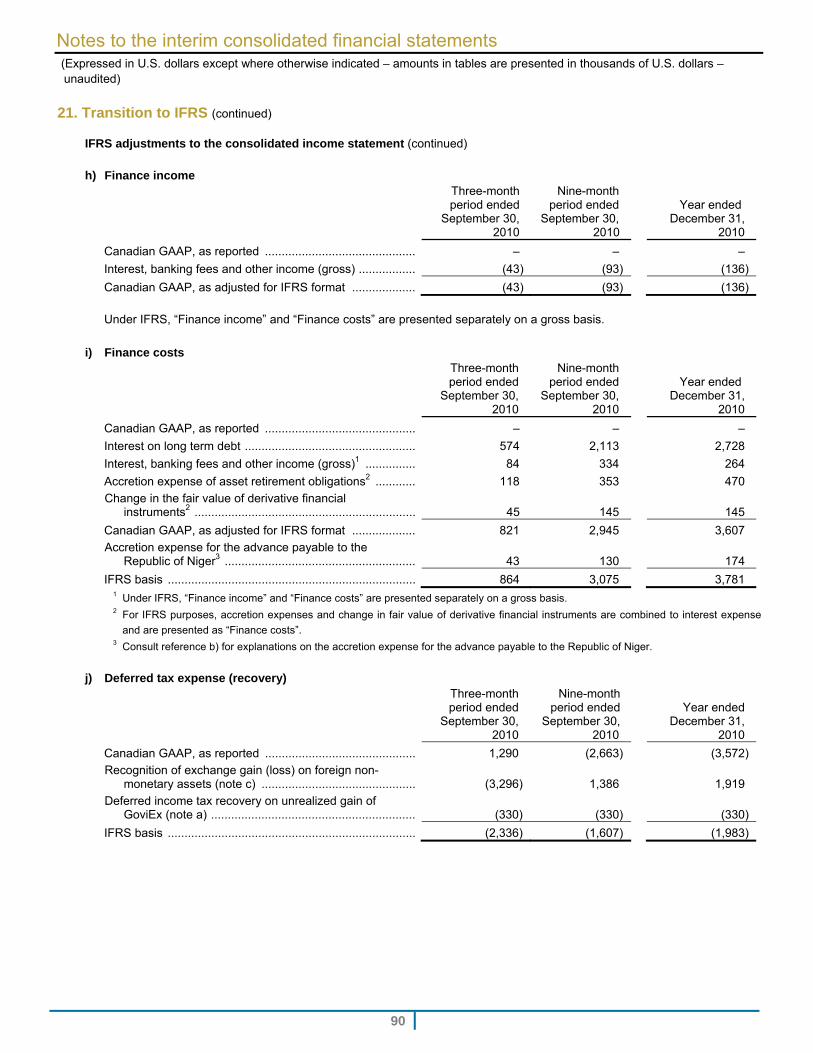
Notes to the interim consolidated financial statements (Expressed in U.S. dollars except where otherwise indicated – amounts in tables are presented in thousands of U.S. dollars –
unaudited)
90
21. Transition to IFRS (continued)
IFRS adjustments to the consolidated income statement (continued)
h) Finance income Three-month period ended
September 30, 2010
Nine-month period ended
September 30, 2010
Year ended December 31,
2010
Canadian GAAP, as reported ............................................. – – –
Interest, banking fees and other income (gross) ................. (43) (93) (136)
Canadian GAAP, as adjusted for IFRS format ................... (43) (93) (136)
Under IFRS, “Finance income” and “Finance costs” are presented separately on a gross basis.
i) Finance costs Three-month period ended
September 30, 2010
Nine-month period ended
September 30, 2010
Year ended December 31,
2010
Canadian GAAP, as reported ............................................. – – –
Interest on long term debt ................................................... 574 2,113 2,728
Interest, banking fees and other income (gross)1 ............... 84 334 264
Accretion expense of asset retirement obligations2 ............ 118 353 470
Change in the fair value of derivative financial instruments2 .................................................................. 45 145 145
Canadian GAAP, as adjusted for IFRS format ................... 821 2,945 3,607
Accretion expense for the advance payable to the Republic of Niger3 ......................................................... 43 130 174
IFRS basis .......................................................................... 864 3,075 3,781 1 Under IFRS, “Finance income” and “Finance costs” are presented separately on a gross basis. 2 For IFRS purposes, accretion expenses and change in fair value of derivative financial instruments are combined to interest expense
and are presented as “Finance costs”. 3 Consult reference b) for explanations on the accretion expense for the advance payable to the Republic of Niger.
j) Deferred tax expense (recovery)
Three-month period ended
September 30, 2010
Nine-month period ended
September 30, 2010
Year ended December 31,
2010
Canadian GAAP, as reported ............................................. 1,290 (2,663) (3,572)
Recognition of exchange gain (loss) on foreign non-monetary assets (note c) .............................................. (3,296) 1,386 1,919
Deferred income tax recovery on unrealized gain of GoviEx (note a) ............................................................. (330) (330) (330)
IFRS basis .......................................................................... (2,336) (1,607) (1,983)
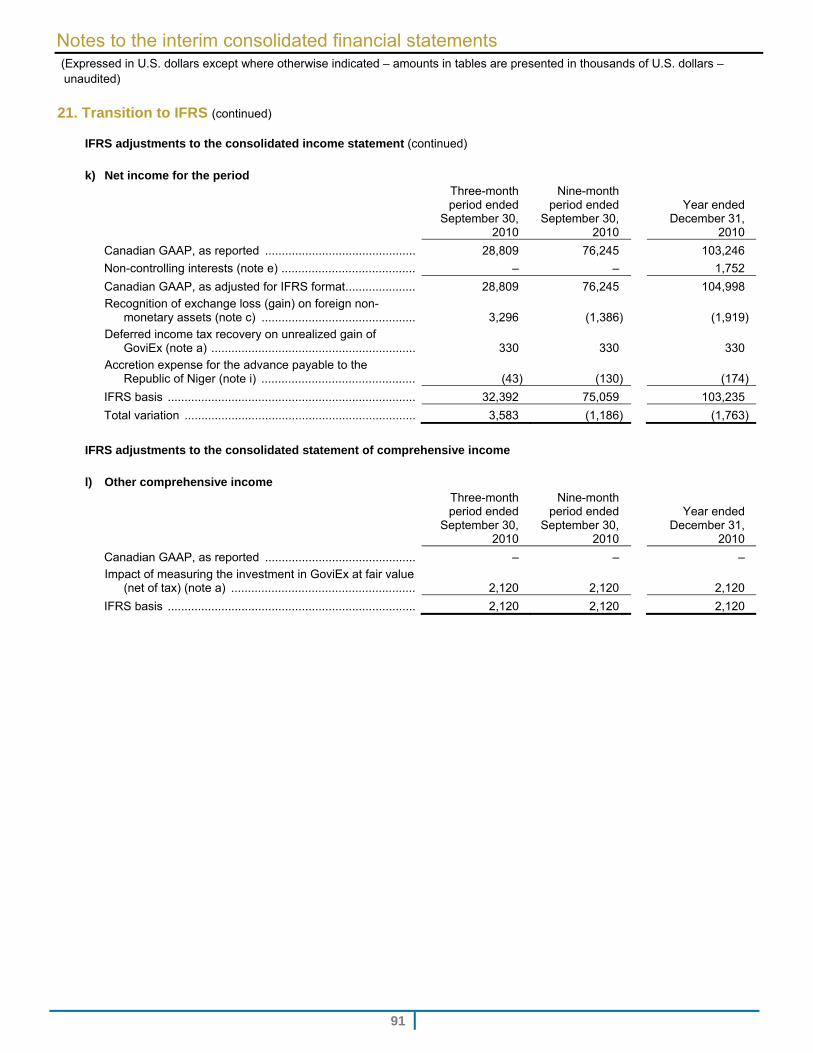
Notes to the interim consolidated financial statements (Expressed in U.S. dollars except where otherwise indicated – amounts in tables are presented in thousands of U.S. dollars –
unaudited)
91
21. Transition to IFRS (continued)
IFRS adjustments to the consolidated income statement (continued)
k) Net income for the period Three-month period ended
September 30, 2010
Nine-month period ended
September 30, 2010
Year ended December 31,
2010
Canadian GAAP, as reported ............................................. 28,809 76,245 103,246
Non-controlling interests (note e) ........................................ – – 1,752
Canadian GAAP, as adjusted for IFRS format ..................... 28,809 76,245 104,998
Recognition of exchange loss (gain) on foreign non-monetary assets (note c) .............................................. 3,296 (1,386) (1,919)
Deferred income tax recovery on unrealized gain of GoviEx (note a) ............................................................. 330 330 330
Accretion expense for the advance payable to the Republic of Niger (note i) .............................................. (43) (130) (174)
IFRS basis .......................................................................... 32,392 75,059 103,235
Total variation ..................................................................... 3,583 (1,186) (1,763)
IFRS adjustments to the consolidated statement of comprehensive income
l) Other comprehensive income
Three-month period ended
September 30, 2010
Nine-month period ended
September 30, 2010
Year ended December 31,
2010
Canadian GAAP, as reported ............................................. – – ‒
Impact of measuring the investment in GoviEx at fair value (net of tax) (note a) ....................................................... 2,120 2,120 2,120
IFRS basis .......................................................................... 2,120 2,120 2,120