Embed Size (px)
Citation preview
MCCULLOUGH RESEARCH
ROBERT F. MCCULLOUGH, JR.
PRINCIPAL
6123 REED COLLEGE PLACE ● PORTLAND ● OREGON ● 97202 ● 503-777-4616 ● [email protected]
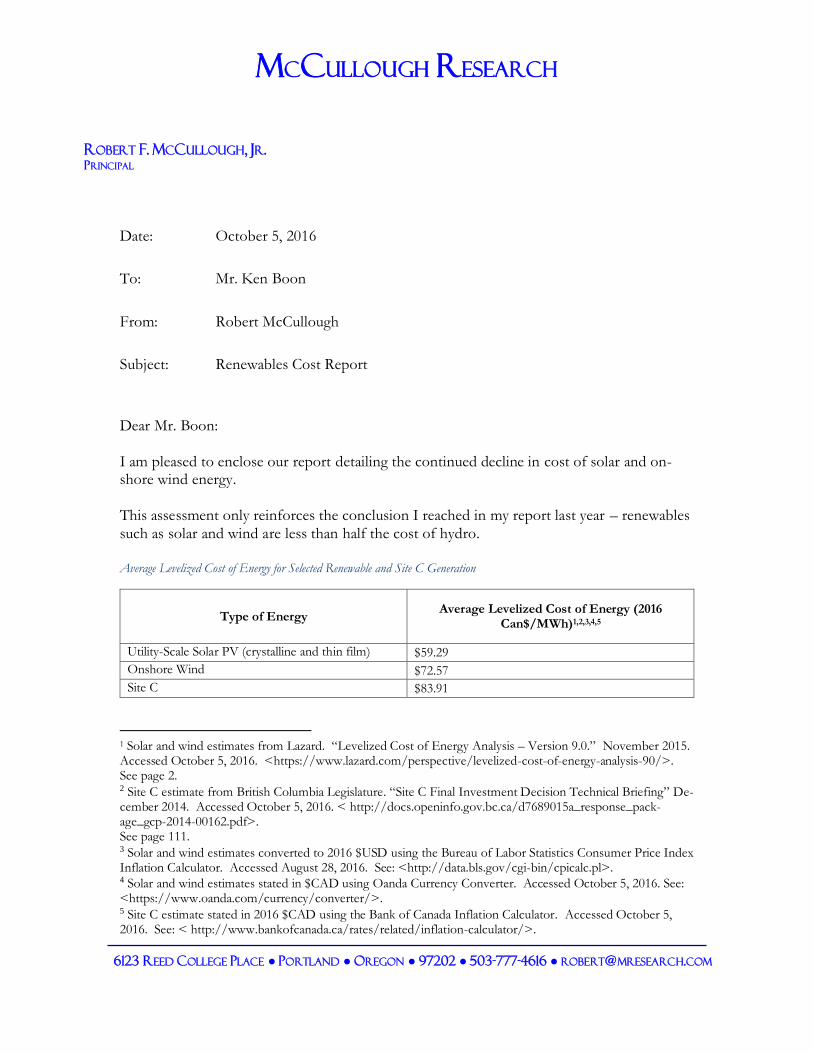
Date: October 5, 2016
To: Mr. Ken Boon
From: Robert McCullough
Subject: Renewables Cost Report
Dear Mr. Boon:
I am pleased to enclose our report detailing the continued decline in cost of solar and on-shore wind energy.
This assessment only reinforces the conclusion I reached in my report last year – renewables
such as solar and wind are less than half the cost of hydro. Average Levelized Cost of Energy for Selected Renewable and Site C Generation
Type of Energy Average Levelized Cost of Energy (2016
Can$/MWh)1,2,3,4,5
Utility-Scale Solar PV (crystalline and thin film) $59.29
Onshore Wind $72.57
Site C $83.91
1 Solar and wind estimates from Lazard. “Levelized Cost of Energy Analysis – Version 9.0.” November 2015. Accessed October 5, 2016. <https://www.lazard.com/perspective/levelized-cost-of-energy-analysis-90/>. See page 2. 2 Site C estimate from British Columbia Legislature. “Site C Final Investment Decision Technical Briefing” De-cember 2014. Accessed October 5, 2016. < http://docs.openinfo.gov.bc.ca/d7689015a_response_pack-age_gcp-2014-00162.pdf>. See page 111. 3 Solar and wind estimates converted to 2016 $USD using the Bureau of Labor Statistics Consumer Price Index Inflation Calculator. Accessed August 28, 2016. See: <http://data.bls.gov/cgi-bin/cpicalc.pl>. 4 Solar and wind estimates stated in $CAD using Oanda Currency Converter. Accessed October 5, 2016. See: <https://www.oanda.com/currency/converter/>. 5 Site C estimate stated in 2016 $CAD using the Bank of Canada Inflation Calculator. Accessed October 5, 2016. See: < http://www.bankofcanada.ca/rates/related/inflation-calculator/>.
MCCULLOUGH RESEARCH
Renewables Cost Report October 5, 2016
Page 2 ________________
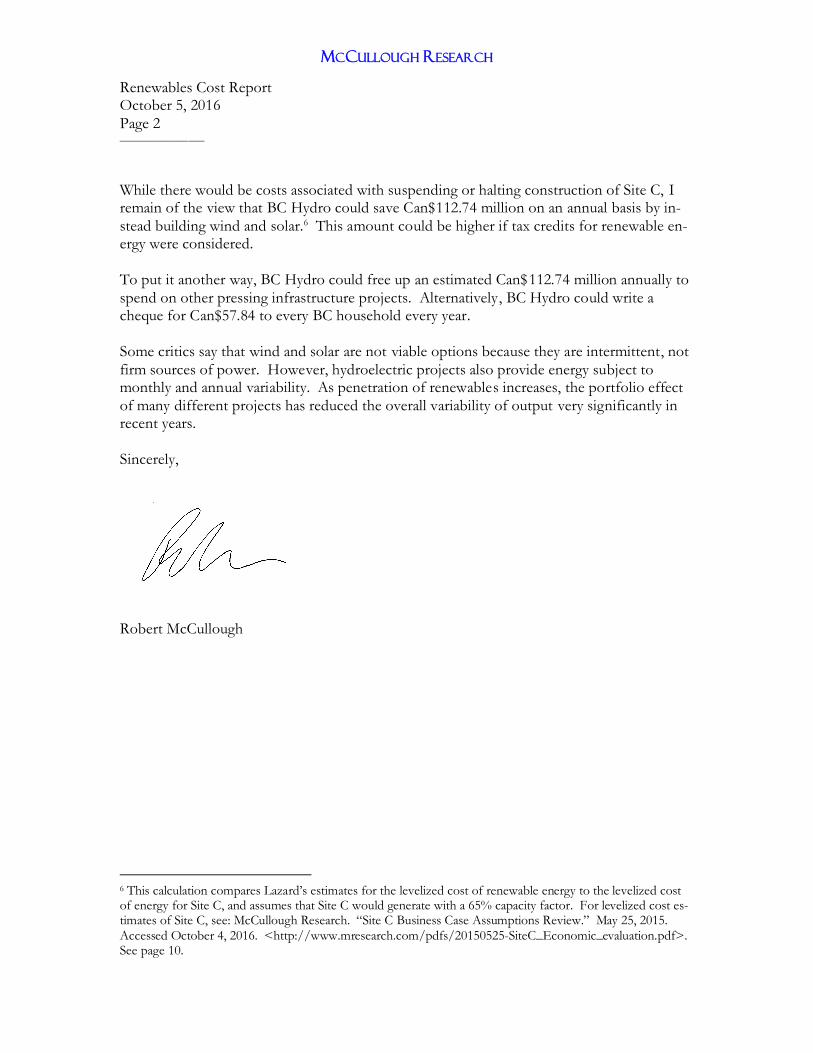
While there would be costs associated with suspending or halting construction of Site C, I remain of the view that BC Hydro could save Can$112.74 million on an annual basis by in-
stead building wind and solar.6 This amount could be higher if tax credits for renewable en-ergy were considered.
To put it another way, BC Hydro could free up an estimated Can$112.74 million annually to
spend on other pressing infrastructure projects. Alternatively, BC Hydro could write a cheque for Can$57.84 to every BC household every year.
Some critics say that wind and solar are not viable options because they are intermittent, not
firm sources of power. However, hydroelectric projects also provide energy subject to monthly and annual variability. As penetration of renewables increases, the portfolio effect
of many different projects has reduced the overall variability of output very significantly in recent years.
Sincerely,
Robert McCullough
6 This calculation compares Lazard’s estimates for the levelized cost of renewable energy to the levelized cost of energy for Site C, and assumes that Site C would generate with a 65% capacity factor. For levelized cost es-timates of Site C, see: McCullough Research. “Site C Business Case Assumptions Review.” May 25, 2015. Accessed October 4, 2016. <http://www.mresearch.com/pdfs/20150525-SiteC_Economic_evaluation.pdf>. See page 10.
MCCULLOUGH RESEARCH
ROBERT F. MCCULLOUGH, JR.
MANAGING PARTNER
6123 REED COLLEGE PLACE ● PORTLAND ● OREGON ● 97202 ● 503-777-4616 ● [email protected]
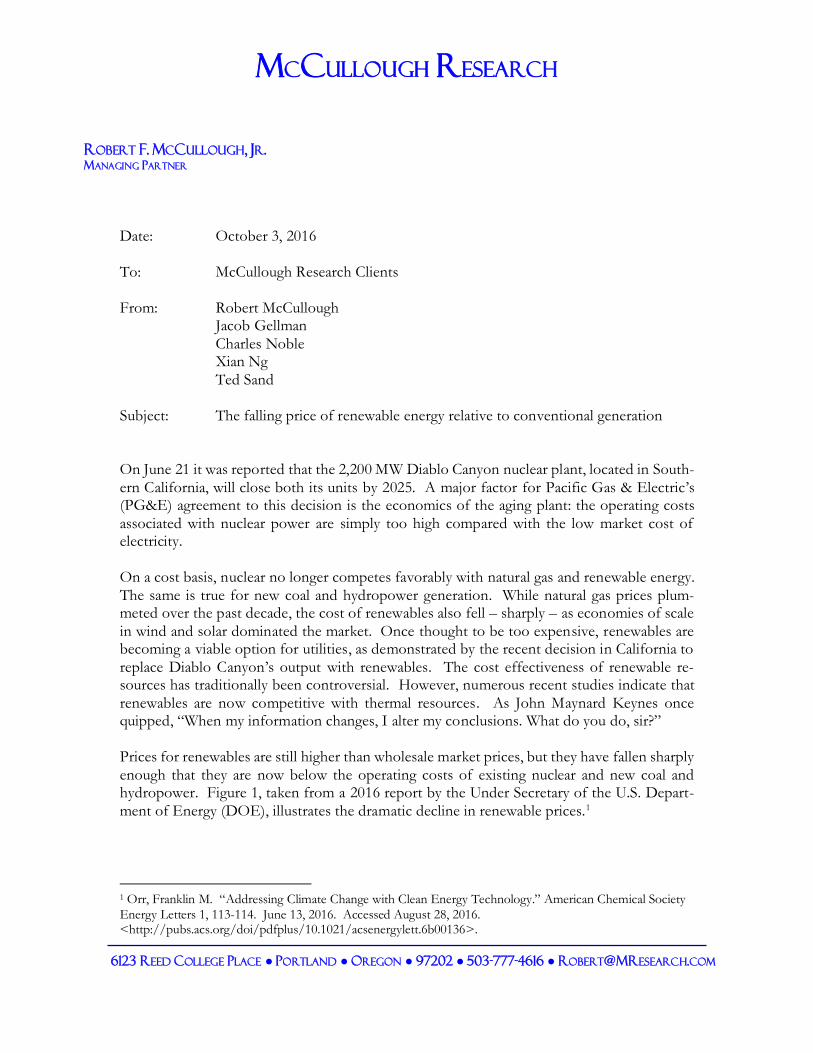
Date: October 3, 2016
To: McCullough Research Clients
From: Robert McCullough Jacob Gellman
Charles Noble Xian Ng
Ted Sand
Subject: The falling price of renewable energy relative to conventional generation
On June 21 it was reported that the 2,200 MW Diablo Canyon nuclear plant, located in South-
ern California, will close both its units by 2025. A major factor for Pacific Gas & Electric’s (PG&E) agreement to this decision is the economics of the aging plant: the operating costs
associated with nuclear power are simply too high compared with the low market cost of electricity.
On a cost basis, nuclear no longer competes favorably with natural gas and renewable energy.
The same is true for new coal and hydropower generation. While natural gas prices plum-meted over the past decade, the cost of renewables also fell – sharply – as economies of scale
in wind and solar dominated the market. Once thought to be too expensive, renewables are becoming a viable option for utilities, as demonstrated by the recent decision in California to
replace Diablo Canyon’s output with renewables. The cost effectiveness of renewable re-sources has traditionally been controversial. However, numerous recent studies indicate that
renewables are now competitive with thermal resources. As John Maynard Keynes once quipped, “When my information changes, I alter my conclusions. What do you do, sir?”
Prices for renewables are still higher than wholesale market prices, but they have fallen sharply
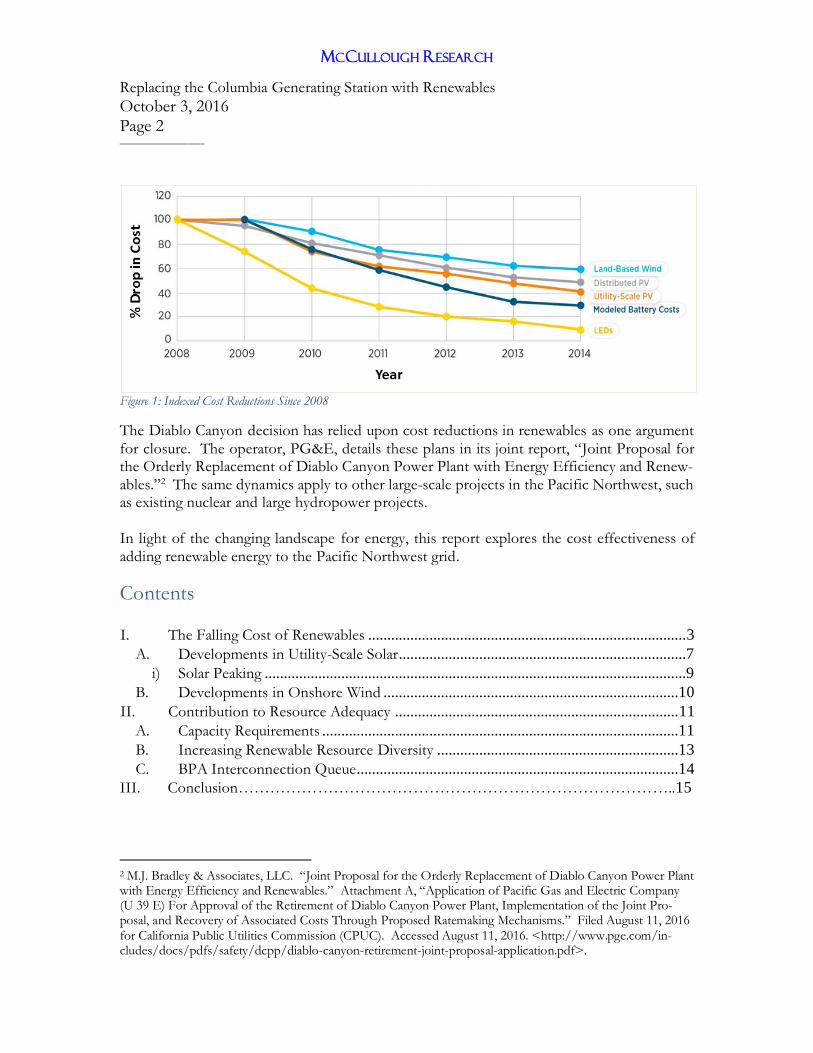
enough that they are now below the operating costs of existing nuclear and new coal and hydropower. Figure 1, taken from a 2016 report by the Under Secretary of the U.S. Depart-
ment of Energy (DOE), illustrates the dramatic decline in renewable prices.1
1 Orr, Franklin M. “Addressing Climate Change with Clean Energy Technology.” American Chemical Society Energy Letters 1, 113-114. June 13, 2016. Accessed August 28, 2016. <http://pubs.acs.org/doi/pdfplus/10.1021/acsenergylett.6b00136>.
MCCULLOUGH RESEARCH
Replacing the Columbia Generating Station with Renewables October 3, 2016 Page 2 ________________
Figure 1: Indexed Cost Reductions Since 2008
The Diablo Canyon decision has relied upon cost reductions in renewables as one argument
for closure. The operator, PG&E, details these plans in its joint report, “Joint Proposal for the Orderly Replacement of Diablo Canyon Power Plant with Energy Efficiency and Renew-
ables.”2 The same dynamics apply to other large-scale projects in the Pacific Northwest, such as existing nuclear and large hydropower projects.
In light of the changing landscape for energy, this report explores the cost effectiveness of
adding renewable energy to the Pacific Northwest grid.
Contents
I. The Falling Cost of Renewables ................................................................................... 3
A. Developments in Utility-Scale Solar ...........................................................................7
i) Solar Peaking ..............................................................................................................9
B. Developments in Onshore Wind .............................................................................10
II. Contribution to Resource Adequacy .......................................................................... 11
A. Capacity Requirements .............................................................................................11
B. Increasing Renewable Resource Diversity ...............................................................13
C. BPA Interconnection Queue....................................................................................14
III. Conclusion………………………………………………………………………..15
2 M.J. Bradley & Associates, LLC. “Joint Proposal for the Orderly Replacement of Diablo Canyon Power Plant with Energy Efficiency and Renewables.” Attachment A, “Application of Pacific Gas and Electric Company (U 39 E) For Approval of the Retirement of Diablo Canyon Power Plant, Implementation of the Joint Pro-posal, and Recovery of Associated Costs Through Proposed Ratemaking Mechanisms.” Filed August 11, 2016 for California Public Utilities Commission (CPUC). Accessed August 11, 2016. <http://www.pge.com/in-cludes/docs/pdfs/safety/dcpp/diablo-canyon-retirement-joint-proposal-application.pdf>.
MCCULLOUGH RESEARCH
Replacing the Columbia Generating Station with Renewables October 3, 2016 Page 3 ________________
Figures
Figure 1: Indexed Cost Reductions Since 2008 .........................................................................2
Figure 2: Levelized Cost of Energy for Solar (Lazard Historical Estimates) ............................9
Figure 3: Levelized Cost of Energy for Wind (Lazard Historical Estimates) .........................10
Figure 4: Milligan presentation on WECC rule of thumb for renewable capacity value ........12
Figure 5: NERC forecast on NWPP peak season demand, resources, and reserve margins ..13 Figure 6: WECC Renewable Generation: Nameplate Capacity and Standard Deviation of
Energy Generation ..................................................................................................................14
Figure 7: BPA Transmission Service Requests by Technology...............................................15
Tables Table 1: National Levelized Cost of Energy for Selected Renewable and Conventional
Generation .................................................................................................................................4 Table 2: National Overnight Capital Cost for Installation of Conventional and Renewable
Energy Sources ..........................................................................................................................6
I. The Falling Cost of Renewables
Significant expansion of renewable generation, especially for solar photovoltaics (PV) and on-shore wind, is both plausible and economically sound. Economies of scale, technological in-
novation, “learning by doing” effects, and fuel price movements for conventional generation have brought significant reductions in the relative cost of solar PV and wind installations, and
have made them economically competitive with conventional fossil fuel generations, even without subsidies.
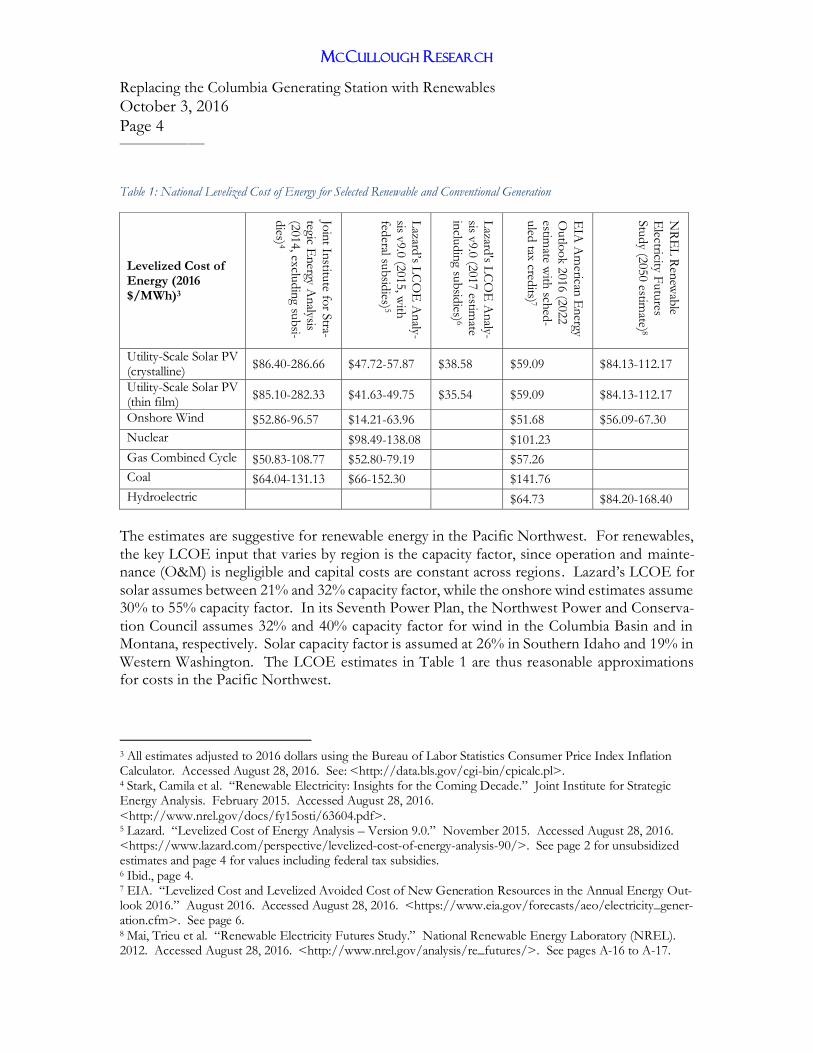
Table 1 presents the levelized cost of energy (LCOE), in 2016 dollars, for various forms of
newly built generation. A LCOE compares the cost of new generating resources over the financial and technological lifetime of the project, averaged on a per MWh basis.
MCCULLOUGH RESEARCH
Replacing the Columbia Generating Station with Renewables October 3, 2016 Page 4 ________________
Table 1: National Levelized Cost of Energy for Selected Renewable and Conventional Generation
Levelized Cost of Energy (2016 $/MWh)3
Join
t Institu
te for S
tra-
tegic E
nergy A
nalysis
(2014, ex
cludin
g su
bsi-
dies) 4
Lazard
’s LC
OE
An
aly-sis v
9.0
(2015, w
ith
federal su
bsid
ies)5
Lazard
's LC
OE
Analy-
sis v9.0
(2017 estim
ate in
cludin
g su
bsid
ies) 6
EIA
Am
erican E
nergy
Outlo
ok 2
016 (2
022
estimate w
ith sch
ed-
uled
tax cred
its) 7
NR
EL
Ren
ewab
le
Electricity F
utu
res Stu
dy (2
050 estim
ate) 8
Utility-Scale Solar PV (crystalline)
$86.40-286.66 $47.72-57.87 $38.58 $59.09 $84.13-112.17
Utility-Scale Solar PV (thin film)
$85.10-282.33 $41.63-49.75 $35.54 $59.09 $84.13-112.17
Onshore Wind $52.86-96.57 $14.21-63.96 $51.68 $56.09-67.30
Nuclear $98.49-138.08 $101.23
Gas Combined Cycle $50.83-108.77 $52.80-79.19 $57.26
Coal $64.04-131.13 $66-152.30 $141.76
Hydroelectric $64.73 $84.20-168.40
The estimates are suggestive for renewable energy in the Pacific Northwest. For renewables,
the key LCOE input that varies by region is the capacity factor, since operation and mainte-nance (O&M) is negligible and capital costs are constant across regions . Lazard’s LCOE for
solar assumes between 21% and 32% capacity factor, while the onshore wind estimates assume 30% to 55% capacity factor. In its Seventh Power Plan, the Northwest Power and Conserva-
tion Council assumes 32% and 40% capacity factor for wind in the Columbia Basin and in Montana, respectively. Solar capacity factor is assumed at 26% in Southern Idaho and 19% in
Western Washington. The LCOE estimates in Table 1 are thus reasonable approximations for costs in the Pacific Northwest.
3 All estimates adjusted to 2016 dollars using the Bureau of Labor Statistics Consumer Price Index Inflation Calculator. Accessed August 28, 2016. See: <http://data.bls.gov/cgi-bin/cpicalc.pl>. 4 Stark, Camila et al. “Renewable Electricity: Insights for the Coming Decade.” Joint Institute for Strategic Energy Analysis. February 2015. Accessed August 28, 2016. <http://www.nrel.gov/docs/fy15osti/63604.pdf>. 5 Lazard. “Levelized Cost of Energy Analysis – Version 9.0.” November 2015. Accessed August 28, 2016. <https://www.lazard.com/perspective/levelized-cost-of-energy-analysis-90/>. See page 2 for unsubsidized estimates and page 4 for values including federal tax subsidies. 6 Ibid., page 4. 7 EIA. “Levelized Cost and Levelized Avoided Cost of New Generation Resources in the Annual Energy Out-look 2016.” August 2016. Accessed August 28, 2016. <https://www.eia.gov/forecasts/aeo/electricity_gener-ation.cfm>. See page 6. 8 Mai, Trieu et al. “Renewable Electricity Futures Study.” National Renewable Energy Laboratory (NREL). 2012. Accessed August 28, 2016. <http://www.nrel.gov/analysis/re_futures/>. See pages A-16 to A-17.
MCCULLOUGH RESEARCH
Replacing the Columbia Generating Station with Renewables October 3, 2016 Page 5 ________________
The drop in renewables costs has largely been due to the falling capital costs for installation. The Joint Institute for Strategic Energy Analysis, a partnership between the U.S. DOE and
several academic institutions, comments that renewable generation technologies “have zero fuel costs and relatively small variable operation and maintenance costs, so their LCOEs are
roughly proportionate to estimated capital costs and the cost of financing.”9
The capital costs for solar PV and wind installation are already lower than those for new coal or nuclear generation, and are approaching or have already matched those of natural gas. Ta-
ble 2 presents estimates of the overnight capital cost of installing a number of renewable and conventional generation types from various sources.
9 Stark, Camila et al. “Renewable Electricity: Insights for the Coming Decade.” Joint Institute for Strategic Energy Analysis. February 2015. Accessed August 28, 2016. <http://www.nrel.gov/docs/fy15osti/63604.pdf>.
MCCULLOUGH RESEARCH
Replacing the Columbia Generating Station with Renewables October 3, 2016 Page 6 ________________
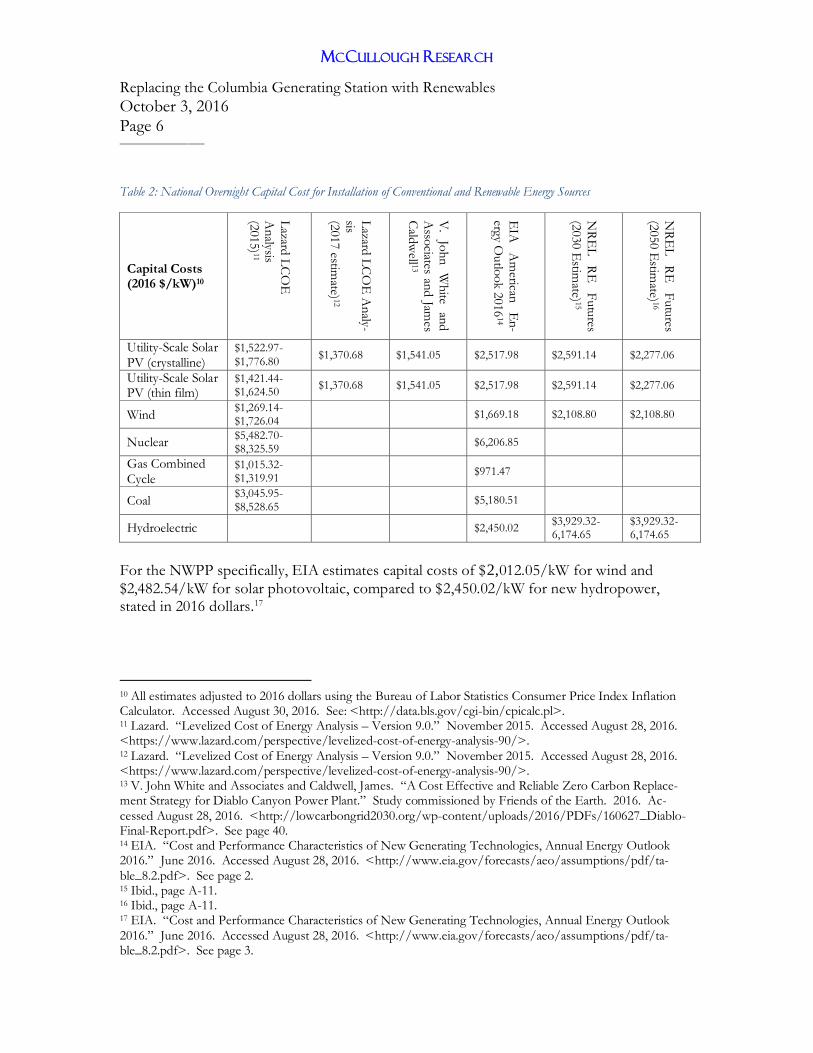
Table 2: National Overnight Capital Cost for Installation of Conventional and Renewable Energy Sources
Capital Costs (2016 $/kW)10
Lazard
LC
OE
An
alysis (2
015) 11
Lazard
LC
OE
An
aly-
sis (2
017 estim
ate) 12
V.
John
White
and
A
ssociates an
d Jam
es C
aldw
ell 13
EIA
A
merican
E
n-
ergy O
utlo
ok 2
016
14
NR
EL
R
E
Futu
res (2
030 E
stimate) 15
NR
EL
R
E
Futu
res (2
050 E
stimate) 16
Utility-Scale Solar PV (crystalline)
$1,522.97-
$1,776.80 $1,370.68 $1,541.05 $2,517.98 $2,591.14 $2,277.06
Utility-Scale Solar PV (thin film)
$1,421.44-$1,624.50
$1,370.68 $1,541.05 $2,517.98 $2,591.14 $2,277.06
Wind $1,269.14-$1,726.04
$1,669.18 $2,108.80 $2,108.80
Nuclear $5,482.70-$8,325.59
$6,206.85
Gas Combined Cycle
$1,015.32-$1,319.91
$971.47
Coal $3,045.95-$8,528.65
$5,180.51
Hydroelectric $2,450.02 $3,929.32- 6,174.65
$3,929.32- 6,174.65
For the NWPP specifically, EIA estimates capital costs of $2,012.05/kW for wind and
$2,482.54/kW for solar photovoltaic, compared to $2,450.02/kW for new hydropower, stated in 2016 dollars.17
10 All estimates adjusted to 2016 dollars using the Bureau of Labor Statistics Consumer Price Index Inflation Calculator. Accessed August 30, 2016. See: <http://data.bls.gov/cgi-bin/cpicalc.pl>. 11 Lazard. “Levelized Cost of Energy Analysis – Version 9.0.” November 2015. Accessed August 28, 2016. <https://www.lazard.com/perspective/levelized-cost-of-energy-analysis-90/>. 12 Lazard. “Levelized Cost of Energy Analysis – Version 9.0.” November 2015. Accessed August 28, 2016. <https://www.lazard.com/perspective/levelized-cost-of-energy-analysis-90/>. 13 V. John White and Associates and Caldwell, James. “A Cost Effective and Reliable Zero Carbon Replace-ment Strategy for Diablo Canyon Power Plant.” Study commissioned by Friends of the Earth. 2016. Ac-cessed August 28, 2016. <http://lowcarbongrid2030.org/wp-content/uploads/2016/PDFs/160627_Diablo-Final-Report.pdf>. See page 40. 14 EIA. “Cost and Performance Characteristics of New Generating Technologies, Annual Energy Outlook 2016.” June 2016. Accessed August 28, 2016. <http://www.eia.gov/forecasts/aeo/assumptions/pdf/ta-ble_8.2.pdf>. See page 2. 15 Ibid., page A-11. 16 Ibid., page A-11. 17 EIA. “Cost and Performance Characteristics of New Generating Technologies, Annual Energy Outlook 2016.” June 2016. Accessed August 28, 2016. <http://www.eia.gov/forecasts/aeo/assumptions/pdf/ta-ble_8.2.pdf>. See page 3.
MCCULLOUGH RESEARCH
Replacing the Columbia Generating Station with Renewables October 3, 2016 Page 7 ________________
A. Developments in Utility-Scale Solar
The majority of growth in solar PV generation in recent years has been at a utility-scale. Na-tionally, utility-scale generation grew from only 157 GWh in 2009 to 23,232 GWh in 2015,
representing two-thirds of all solar PV generation in 2015.18
In Oregon, Washington, Idaho, and Montana, solar PV had a total installed capacity of 18.4 MW in 2009, but grew to 109.2 MW in 2015.19 The BPA Interconnection Queue is a strong
indicator of the market’s readiness to transition to renewable electricity. Of the transmission service requests processed since 2011, there are 2,940 MW of solar resources in queue.20 See
Figure 17.
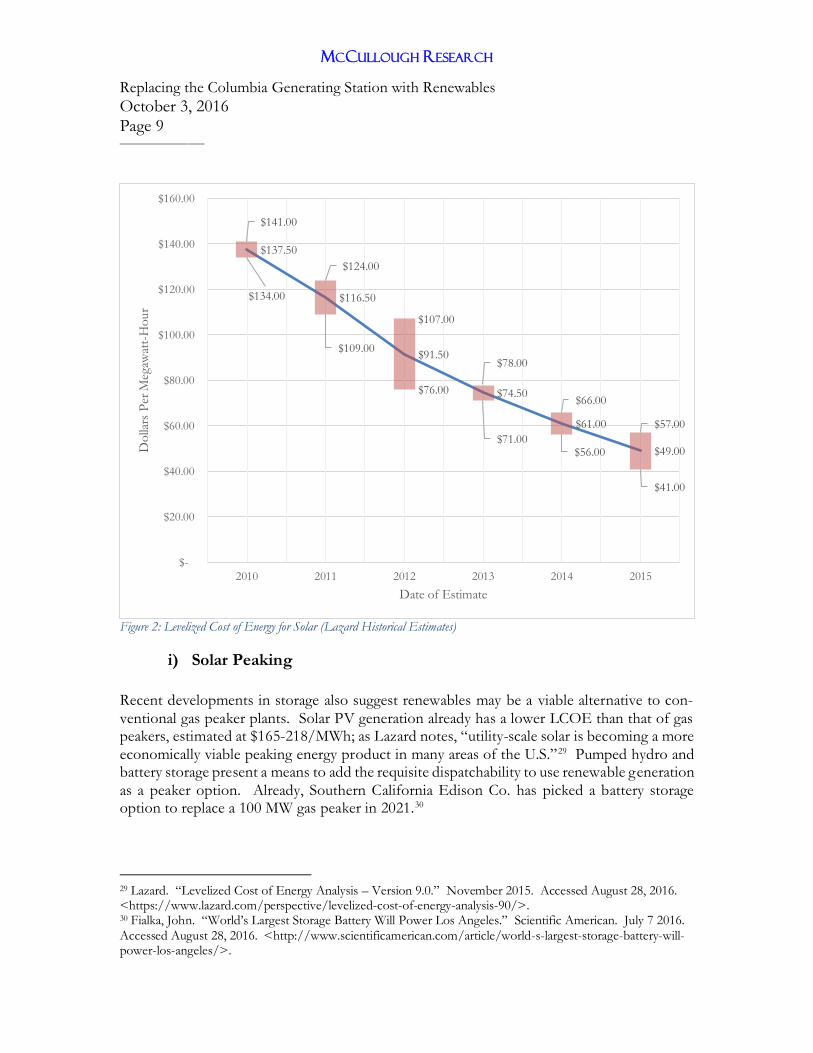
The cost of solar generation fell dramatically in the 2009-2015 period. The reduction in LCOE for solar PV over this period is estimated to be 82%, according to the annual analysis con-
ducted by the financial advisory firm Lazard. 21 Lazard estimates the LCOE for solar PV in 2016 to be between $41 and $57/MWh based on current tax policy, and forecasts further cost
declines to bring the LCOE to below $40/MWh in 2017.22
Lazard’s estimates are based on existing regulation and standard assumptions on financing, and focus primarily on the upfront costs of installation. As such, they do not take into account
the potential costs related to transmission, storage, or back-up generation, nor do they account for the relative savings due to future regulation such as the Environmental Protection Agency
(EPA) Clean Power Plan, or regulated carbon pricing.
Other estimates of the cost of solar generation broadly reflect the same resu lt: utility-scale solar PV has become dramatically cheaper. It is close to or already competitive with conven-
tional generation, such as combined-cycle natural gas, even when unsubsidized. Research from the Lawrence Berkeley National Laboratory finds that recently signed Power Purchase
Agreements (PPAs) for solar PV at $50/MWh are economically sound, even when unsubsi-dized.23
18 EIA. “Electric Power Monthly with Data for June 2016.” August 24, 2016. Accessed August 28, 2016. <http://www.eia.gov/electricity/monthly/>. 19 Renewable Northwest Project. “Renewable Energy Projects.” Accessed September 26, 2016. <http://www.rnp.org/project_map>. 20 BPA. “Interconnection Request Queue.” Accessed August 28, 2016. <https://www.bpa.gov/transmis-sion/doing%20business/interconnection/pages/default.aspx>. 21 Lazard. “Levelized Cost of Energy Analysis – Version 9.0.” November 2015. Accessed August 28, 2016. <https://www.lazard.com/perspective/levelized-cost-of-energy-analysis-90/>. 22 Ibid., page 4. Figures stated in 2015 dollars. 23 Bolinger, Mark et al. “Is $50/MWh Solar for Real? Falling Project Prices and Rising Capacity Factors Drive Utility-Scale PV Toward Economic Competitiveness.” Ernest Orlando Lawrence Berkeley National Labora-tory. May 2015. Accessed August 28, 2016. <https://emp.lbl.gov/sites/all/files/lbnl-183129_0.pdf>.
MCCULLOUGH RESEARCH
Replacing the Columbia Generating Station with Renewables October 3, 2016 Page 8 ________________
Various estimates of the LCOE for new solar PV installations are displayed in Table 1. Given current tax policy, solar PV represents an economically viable substitute for fossil fuel gener-
ation on a LCOE basis.
The Lawrence Berkeley National Laboratory recently published its annual review of solar tech-nology.24 The report cites a substantial reduction in utility-scale solar installations for power
purchase agreements (PPA):
“PPA Prices: Driven by lower installed project prices and improving capacity factors, levelized PPA prices for utility-scale PV have fallen dramatically over
time, by $20-$30/MWh per year on average from 2006 through 2013, with a smaller price decline of ~$10/MWh per year evident in the 2014 and 2015
samples. Most PPAs in the 2015 sample—including many outside of California and the Southwest—are priced at or below $50/MWh levelized (in real 2015
dollars), with a few priced as aggressively as ~$30/MWh. Even at these low price levels, PV may still find it difficult to compete with existing gas-fired
generation, given how low natural gas prices (and gas price expectations) have fallen over the past year. When stacked up against new gas-fired generation
(i.e., including the recovery of up-front capital costs), PV looks more attrac-tive—and in either case can also provide a hedge against possible future in-
creases in fossil fuel costs.”25
The technology for utility-scale solar is based on two major approaches: crystalline silicon (“c-SI”) and thin film (“CdTE”). There are numerous reasons why the efficiency and cost effec-
tiveness of solar has improved in recent years. Bolinger and Seel, the report writers, cite tech-nological improvement, especially the rapid increase in tracking – 70% of capacity added in
2015 used tracking technology.26 Solar equipment costs have also declined in price due to improvements in manufacturing costs.27
There is a continuing efficiency competition between the two major solar technologies. Again,
Bolinger and Seel report that the efficiencies of the two approaches are currently comparable. 28
Figure 3 shows changes in Lazard’s cost estimates since 2010.
24 Bolinger, Mark and Seel, Joachim. “Utility-Scale Solar 2015: An Empirical Analysis of Project Cost, Perfor-mance, and Pricing Trends in the United States.” Lawrence Berkeley National Laboratory, U.S. Department of Energy. August 2016. Accessed August 28, 2016. <https://emp.lbl.gov/sites/all/files/lbnl-1006037_re-port.pdf>. 25 Ibid., page ii. 26 Ibid., page 5, page ii. 27 Chung, Donald et al. “U.S. Photovoltaic Prices and Cost Breakdowns: Q1 2015 Benchmarks for Residential, Commercial, and Utility-Scale Systems.” NREL. 2015. Accessed September 1, 2016. <http://www.nrel.gov/docs/fy15osti/64746.pdf>. See pages iv and 2. 28 Ibid., page 5.
MCCULLOUGH RESEARCH
Replacing the Columbia Generating Station with Renewables October 3, 2016 Page 9 ________________
Figure 2: Levelized Cost of Energy for Solar (Lazard Historical Estimates)
i) Solar Peaking
Recent developments in storage also suggest renewables may be a viable alternative to con-
ventional gas peaker plants. Solar PV generation already has a lower LCOE than that of gas peakers, estimated at $165-218/MWh; as Lazard notes, “utility-scale solar is becoming a more
economically viable peaking energy product in many areas of the U.S.”29 Pumped hydro and battery storage present a means to add the requisite dispatchability to use renewable generation
as a peaker option. Already, Southern California Edison Co. has picked a battery storage option to replace a 100 MW gas peaker in 2021.30
29 Lazard. “Levelized Cost of Energy Analysis – Version 9.0.” November 2015. Accessed August 28, 2016. <https://www.lazard.com/perspective/levelized-cost-of-energy-analysis-90/>. 30 Fialka, John. “World’s Largest Storage Battery Will Power Los Angeles.” Scientific American. July 7 2016. Accessed August 28, 2016. <http://www.scientificamerican.com/article/world-s-largest-storage-battery-will-power-los-angeles/>.
$141.00
$124.00
$107.00
$78.00
$66.00
$57.00
$134.00
$109.00
$76.00
$71.00 $56.00
$41.00
$137.50
$116.50
$91.50
$74.50
$61.00
$49.00
$-
$20.00
$40.00
$60.00
$80.00
$100.00
$120.00
$140.00
$160.00
2010 2011 2012 2013 2014 2015
Do
llars
Per
Meg
awat
t-H
our
Date of Estimate
MCCULLOUGH RESEARCH
Replacing the Columbia Generating Station with Renewables October 3, 2016 Page 10 ________________
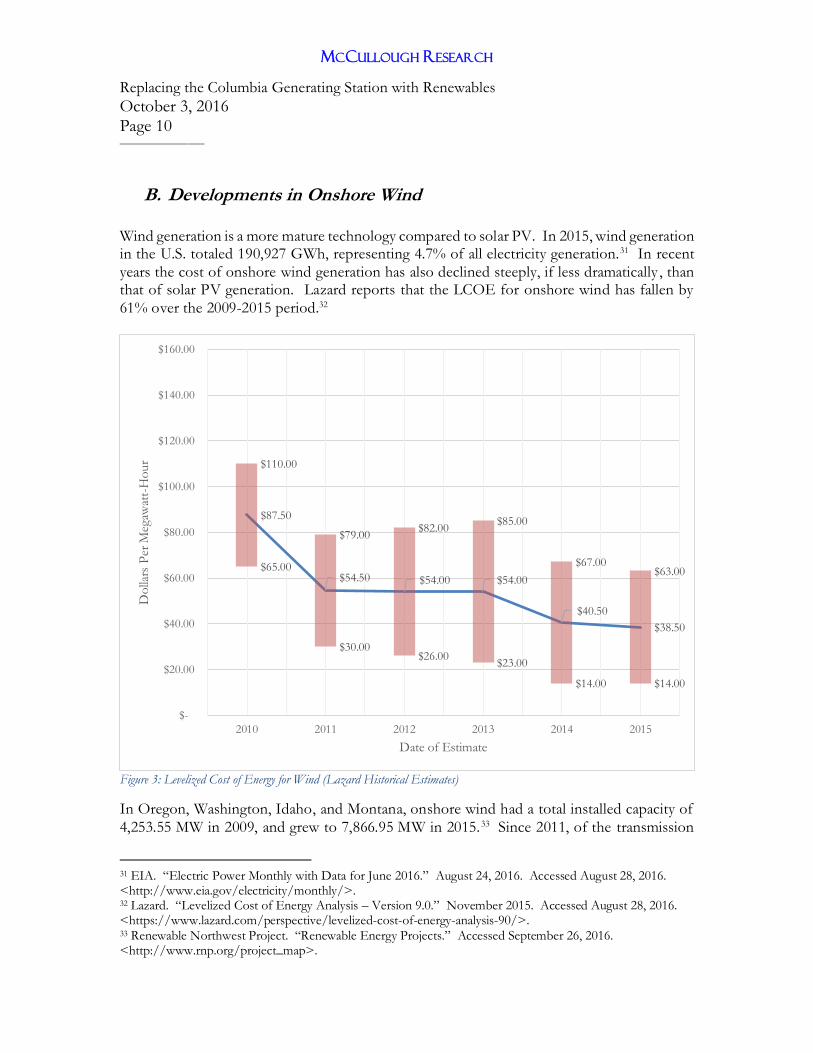
B. Developments in Onshore Wind
Wind generation is a more mature technology compared to solar PV. In 2015, wind generation in the U.S. totaled 190,927 GWh, representing 4.7% of all electricity generation.31 In recent
years the cost of onshore wind generation has also declined steeply, if less dramatically , than that of solar PV generation. Lazard reports that the LCOE for onshore wind has fallen by
61% over the 2009-2015 period.32
Figure 3: Levelized Cost of Energy for Wind (Lazard Historical Estimates)
In Oregon, Washington, Idaho, and Montana, onshore wind had a total installed capacity of
4,253.55 MW in 2009, and grew to 7,866.95 MW in 2015.33 Since 2011, of the transmission
31 EIA. “Electric Power Monthly with Data for June 2016.” August 24, 2016. Accessed August 28, 2016. <http://www.eia.gov/electricity/monthly/>. 32 Lazard. “Levelized Cost of Energy Analysis – Version 9.0.” November 2015. Accessed August 28, 2016. <https://www.lazard.com/perspective/levelized-cost-of-energy-analysis-90/>. 33 Renewable Northwest Project. “Renewable Energy Projects.” Accessed September 26, 2016. <http://www.rnp.org/project_map>.
$110.00
$79.00 $82.00
$85.00
$67.00 $63.00 $65.00
$30.00 $26.00
$23.00
$14.00 $14.00
$87.50
$54.50 $54.00 $54.00
$40.50
$38.50
$-
$20.00
$40.00
$60.00
$80.00
$100.00
$120.00
$140.00
$160.00
2010 2011 2012 2013 2014 2015
Do
llars
Per
Meg
awat
t-H
our
Date of Estimate
MCCULLOUGH RESEARCH
Replacing the Columbia Generating Station with Renewables October 3, 2016 Page 11 ________________
service requests in BPA’s Interconnection Queue, there are 2,361 MW of wind resources in queue.34 See Figure 17.
Table 1 compares LCOE estimates for renewable and conventional generation technologies.
Adjusted to 2016 dollars, wind generation had a LCOE $14.21 to $63.96/MWh when account-ing for subsidies. This competes favorably with nuclear, which was estimated at $98.49 to
$138.08/MWh in 2016 dollars. Table 2 presents the overnight capital costs to install various forms of generating technology. Onshore wind is competitive with conventional fossil fuel
generation technologies, with an LCOE comparable to or even lower than that of combined cycle natural gas generation. Capital costs for wind installation have fallen significantly in
recent years and are also comparable to, or lower than, conventional generation technologies.
Wind generation has many of the same advantages and drawbacks of solar PV. Wind gener-ation enjoys no fuel price risk, but is not dispatchable. Both technologies are resource-de-
pendent. Expansion of storage technology, namely from battery and pumped hydroelectric storage, are potential future solutions to the problem of dispatchability. In the future, trans-
mission infrastructure may connect uncorrelated or negatively correlated loads across large geographic distances.35 Going forward, we expect investments in storage and transmission to
reduce the salience of dispatchability issues, even as the total share of renewable generation continues to grow.
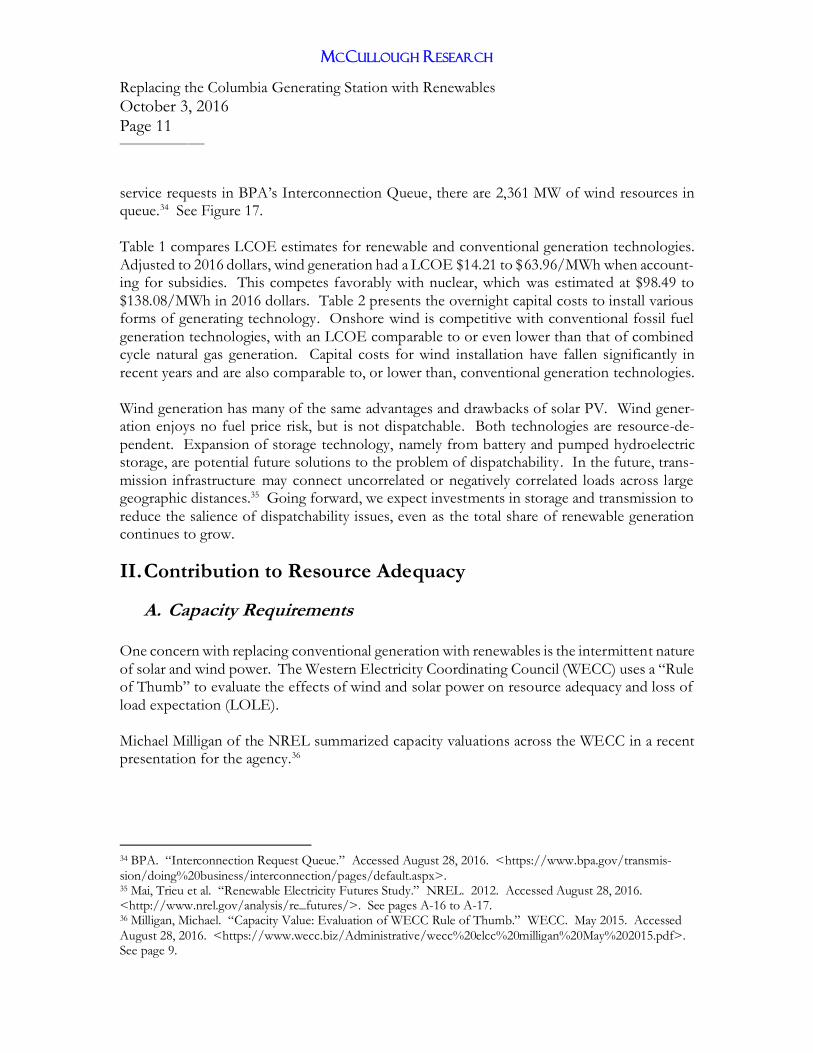
II. Contribution to Resource Adequacy
A. Capacity Requirements One concern with replacing conventional generation with renewables is the intermittent nature
of solar and wind power. The Western Electricity Coordinating Council (WECC) uses a “Rule of Thumb” to evaluate the effects of wind and solar power on resource adequacy and loss of
load expectation (LOLE).
Michael Milligan of the NREL summarized capacity valuations across the WECC in a recent presentation for the agency.36
34 BPA. “Interconnection Request Queue.” Accessed August 28, 2016. <https://www.bpa.gov/transmis-sion/doing%20business/interconnection/pages/default.aspx>. 35 Mai, Trieu et al. “Renewable Electricity Futures Study.” NREL. 2012. Accessed August 28, 2016. <http://www.nrel.gov/analysis/re_futures/>. See pages A-16 to A-17. 36 Milligan, Michael. “Capacity Value: Evaluation of WECC Rule of Thumb.” WECC. May 2015. Accessed August 28, 2016. <https://www.wecc.biz/Administrative/wecc%20elcc%20milligan%20May%202015.pdf>. See page 9.
MCCULLOUGH RESEARCH
Replacing the Columbia Generating Station with Renewables October 3, 2016 Page 12 ________________
Figure 4: Milligan presentation on WECC rule of thumb for renewable capacity value
In the NWPP only 5% of wind capacity and 60% of solar PV capacity are used to meet the
reserve margin criteria. For nuclear, 100% is counted; for hydropower, 70% is counted.
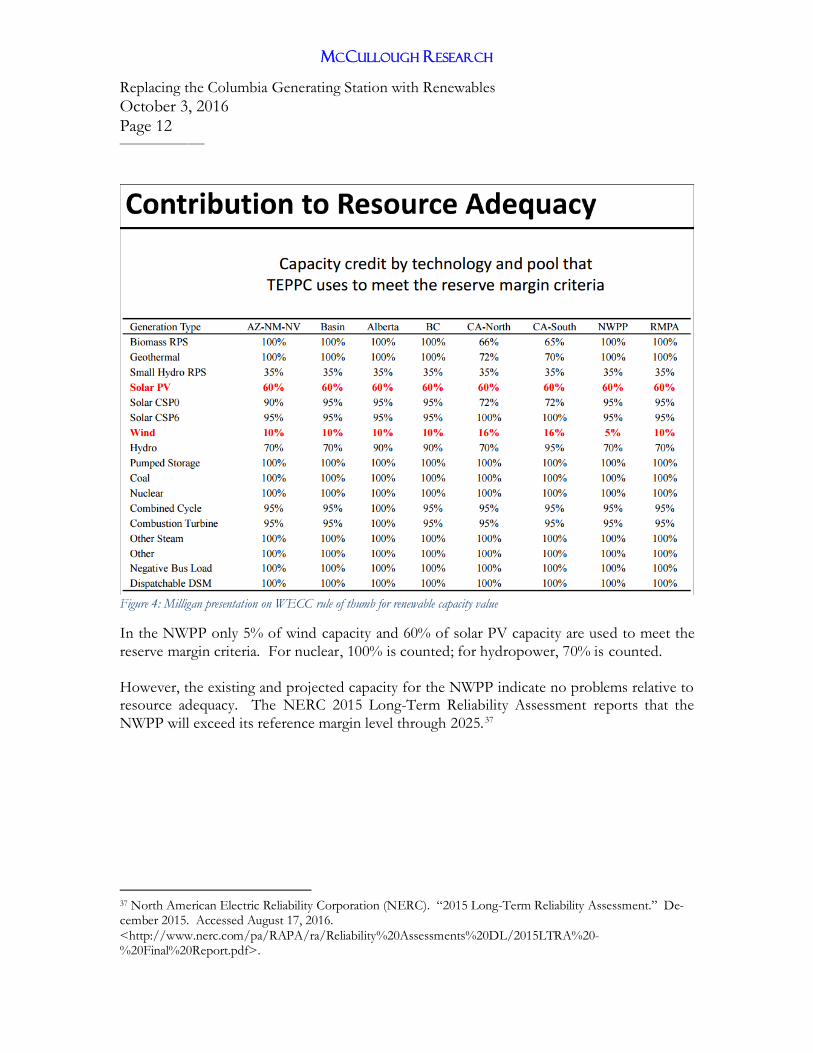
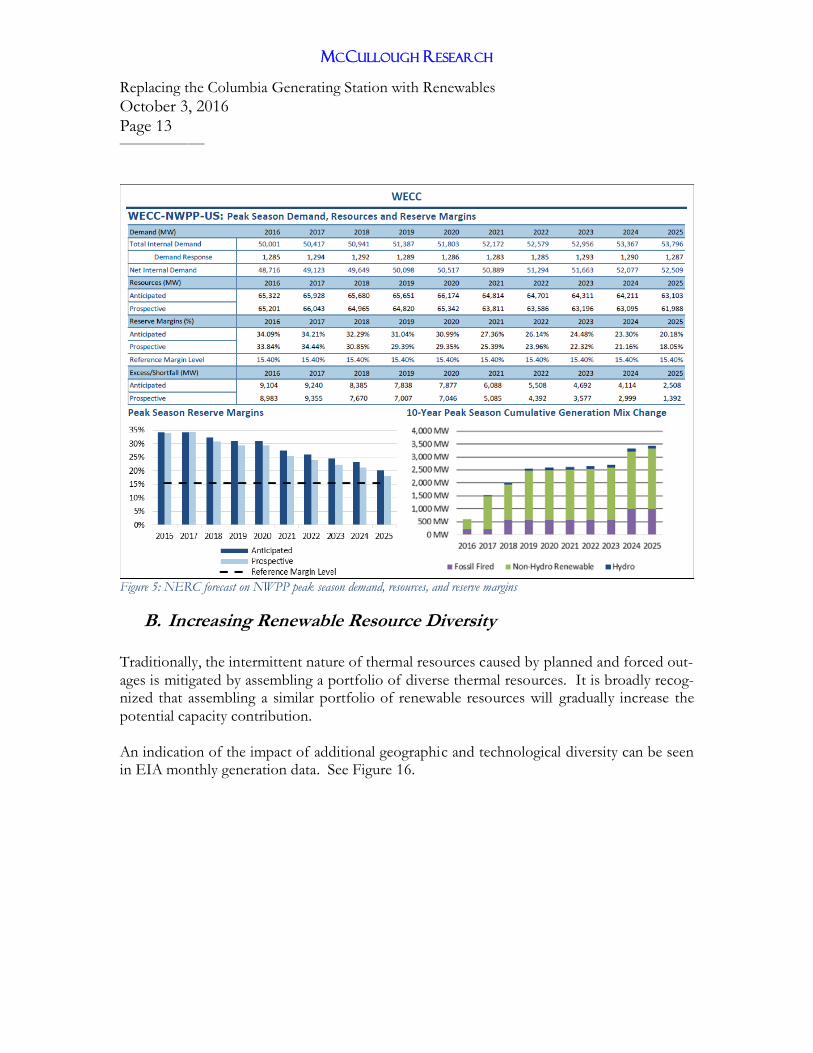
However, the existing and projected capacity for the NWPP indicate no problems relative to resource adequacy. The NERC 2015 Long-Term Reliability Assessment reports that the
NWPP will exceed its reference margin level through 2025.37
37 North American Electric Reliability Corporation (NERC). “2015 Long-Term Reliability Assessment.” De-cember 2015. Accessed August 17, 2016. <http://www.nerc.com/pa/RAPA/ra/Reliability%20Assessments%20DL/2015LTRA%20-%20Final%20Report.pdf>.
MCCULLOUGH RESEARCH
Replacing the Columbia Generating Station with Renewables October 3, 2016 Page 13 ________________
Figure 5: NERC forecast on NWPP peak season demand, resources, and reserve margins
B. Increasing Renewable Resource Diversity Traditionally, the intermittent nature of thermal resources caused by planned and forced out-
ages is mitigated by assembling a portfolio of diverse thermal resources. It is broadly recog-nized that assembling a similar portfolio of renewable resources will gradually increase the
potential capacity contribution.
An indication of the impact of additional geographic and technological diversity can be seen in EIA monthly generation data. See Figure 16.
MCCULLOUGH RESEARCH
Replacing the Columbia Generating Station with Renewables October 3, 2016 Page 14 ________________
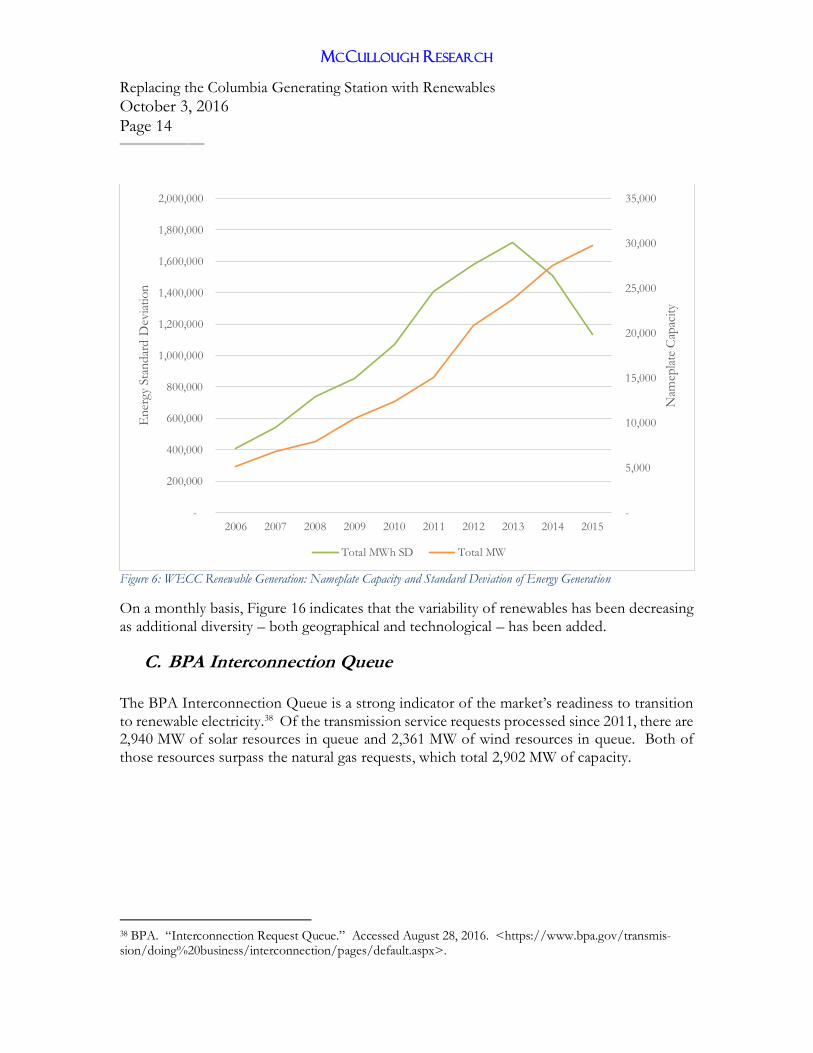
Figure 6: WECC Renewable Generation: Nameplate Capacity and Standard Deviation of Energy Generation
On a monthly basis, Figure 16 indicates that the variability of renewables has been decreasing
as additional diversity – both geographical and technological – has been added.
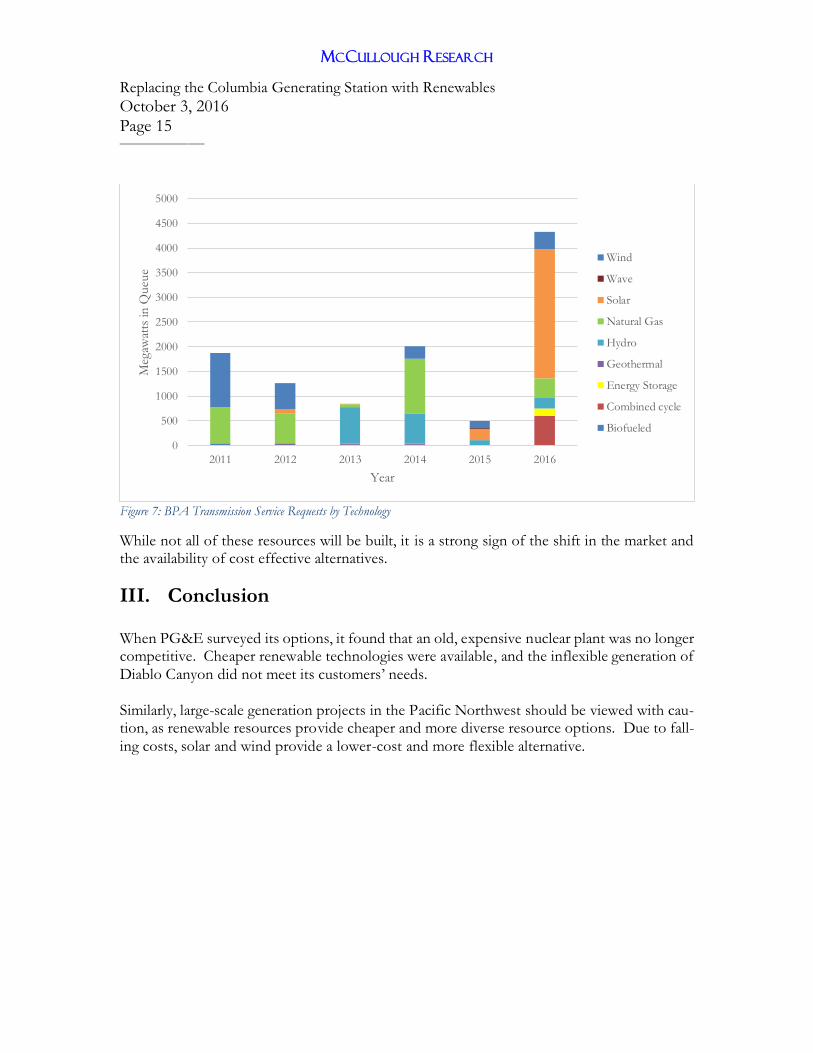
C. BPA Interconnection Queue The BPA Interconnection Queue is a strong indicator of the market’s readiness to transition
to renewable electricity.38 Of the transmission service requests processed since 2011, there are 2,940 MW of solar resources in queue and 2,361 MW of wind resources in queue. Both of
those resources surpass the natural gas requests, which total 2,902 MW of capacity.
38 BPA. “Interconnection Request Queue.” Accessed August 28, 2016. <https://www.bpa.gov/transmis-sion/doing%20business/interconnection/pages/default.aspx>.
-
5,000
10,000
15,000
20,000
25,000
30,000
35,000
-
200,000
400,000
600,000
800,000
1,000,000
1,200,000
1,400,000
1,600,000
1,800,000
2,000,000
2006 2007 2008 2009 2010 2011 2012 2013 2014 2015
Nam
epla
te C
apac
ity
En
ergy
Sta
ndar
d D
evia
tio
n
Total MWh SD Total MW
MCCULLOUGH RESEARCH
Replacing the Columbia Generating Station with Renewables October 3, 2016 Page 15 ________________
Figure 7: BPA Transmission Service Requests by Technology
While not all of these resources will be built, it is a strong sign of the shift in the market and the availability of cost effective alternatives.
III. Conclusion
When PG&E surveyed its options, it found that an old, expensive nuclear plant was no longer competitive. Cheaper renewable technologies were available, and the inflexible generation of
Diablo Canyon did not meet its customers’ needs.
Similarly, large-scale generation projects in the Pacific Northwest should be viewed with cau-tion, as renewable resources provide cheaper and more diverse resource options. Due to fall-
ing costs, solar and wind provide a lower-cost and more flexible alternative.
0
500
1000
1500
2000
2500
3000
3500
4000
4500
5000
2011 2012 2013 2014 2015 2016
Meg
awat
ts in Q
ueu
e
Year
Wind
Wave
Solar
Natural Gas
Hydro
Geothermal
Energy Storage
Combined cycle
Biofueled