Embed Size (px)
Citation preview
MCN Health Monitor
The finger on the pulse of your critical systems
David Tayler – Service Engineer, OSISoft
MCN Health Monitor
• Today’s presentation– Introduction– Description– Interfaces– Tag Builders– Client tools– Benefits

MCN Health Monitor - Description
• What is it?– Manufacturing Control Network Health
Monitor• Interfaces
– Ping, TCP Response, Perfmon & SNMP• Client Tools
– IT Organizer, Tag Builders & IT Overview (ProcessBook Display Builder)
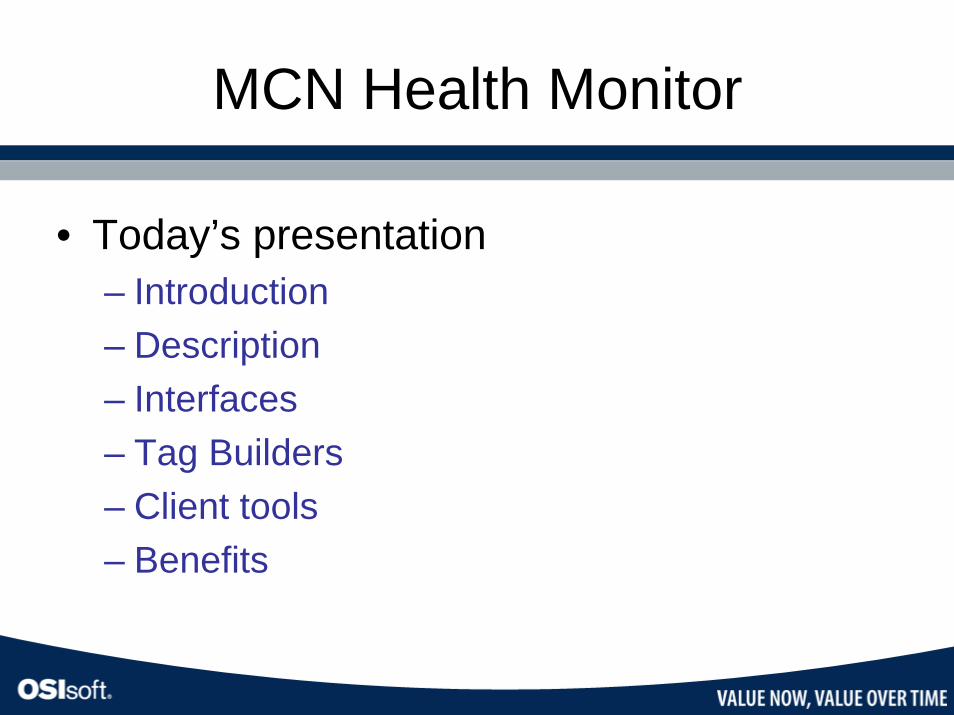
MCN Health Monitor and PI
• MCN Health Monitor includes a set of four interfaces designed specifically to monitor your IT & T infrastructure
• This includes your PI system!
PI
360+ Interfaces
DCS PLC SCADA
MCN Health Monitor Interfaces
Servers Apps NetworkDifference

MCN Health Monitor and PI
• Where does it fit in with your PI system?
Com3
Client Stations- ProcessBook- DataLink
Intranet/Internet - ActiveView- RtWebParts
API Node -Runs Interfaces-Buffers Data
PI Server -Data Historian-Analytics
Data Sources- Printer- Switch- Server- Router etc…
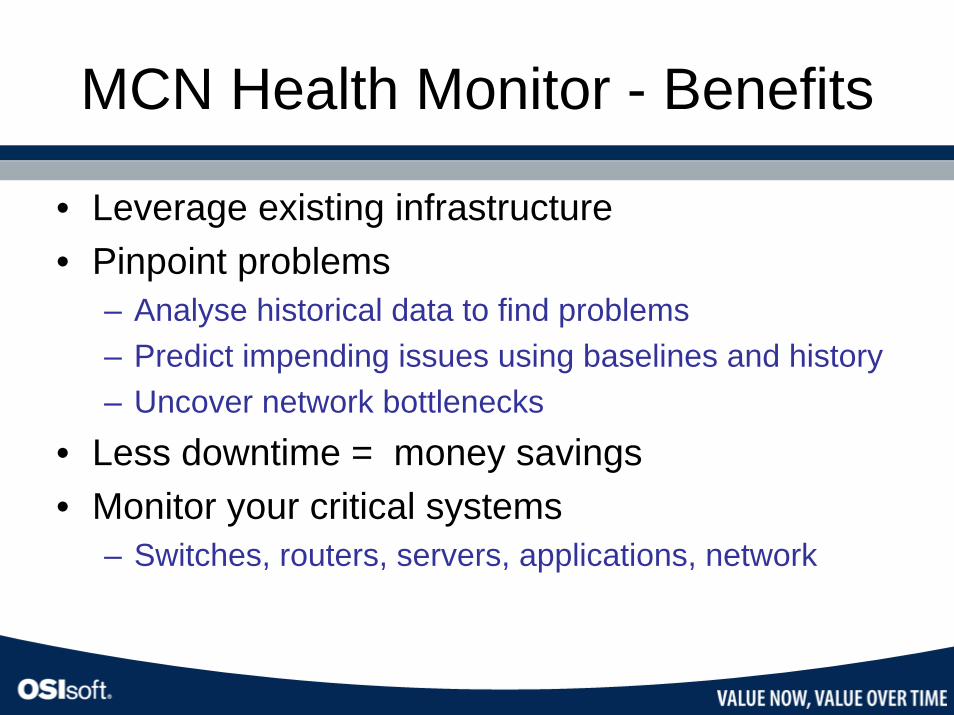
MCN Health Monitor - Benefits
• Leverage existing infrastructure• Pinpoint problems
– Analyse historical data to find problems– Predict impending issues using baselines and history– Uncover network bottlenecks
• Less downtime = money savings• Monitor your critical systems
– Switches, routers, servers, applications, network

MCN Health Monitor - Pre Requisite Knowledge
• If you already use a PI system then you will be familiar with it’s use!
• MCN Health monitor leverages existing PI infrastructure
• Client tools are intuitive and make light work of setting up monitoring
• RtWebParts can be utilized for viewing displays created with the Display builder

MCN Health Monitor - Uses
• Monitor your PI system– PI server software– PI server hardware– Network connections– Switching devices
• Monitor critical IT systems– Servers– Switches– Routers– Applications
• Monitor other devices like network printers and many more!
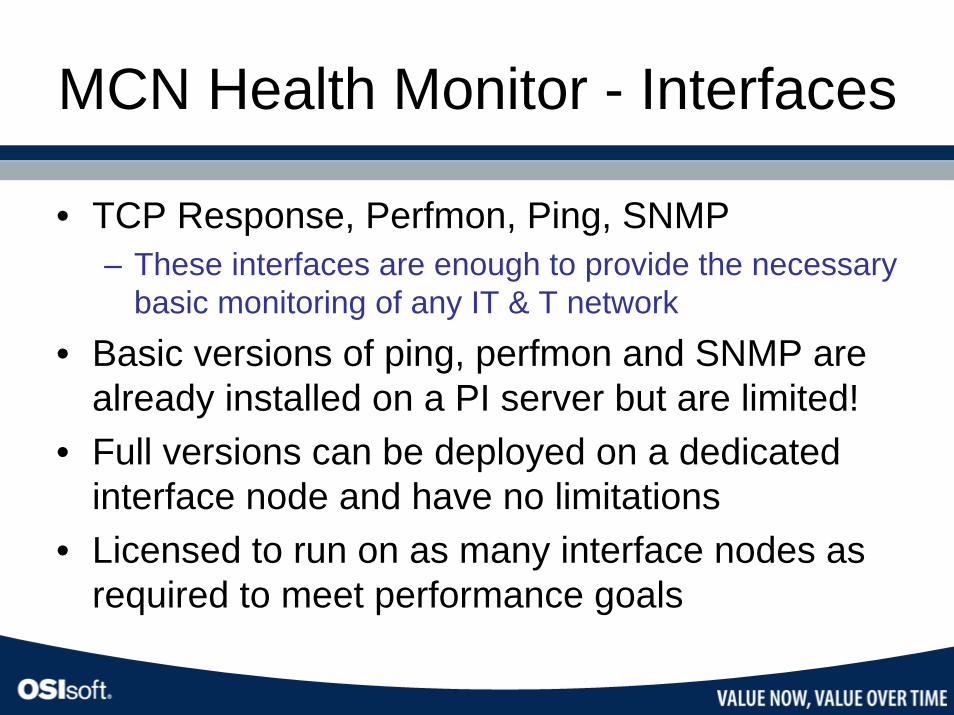
MCN Health Monitor - Interfaces
• TCP Response, Perfmon, Ping, SNMP– These interfaces are enough to provide the necessary
basic monitoring of any IT & T network• Basic versions of ping, perfmon and SNMP are
already installed on a PI server but are limited!• Full versions can be deployed on a dedicated
interface node and have no limitations• Licensed to run on as many interface nodes as
required to meet performance goals
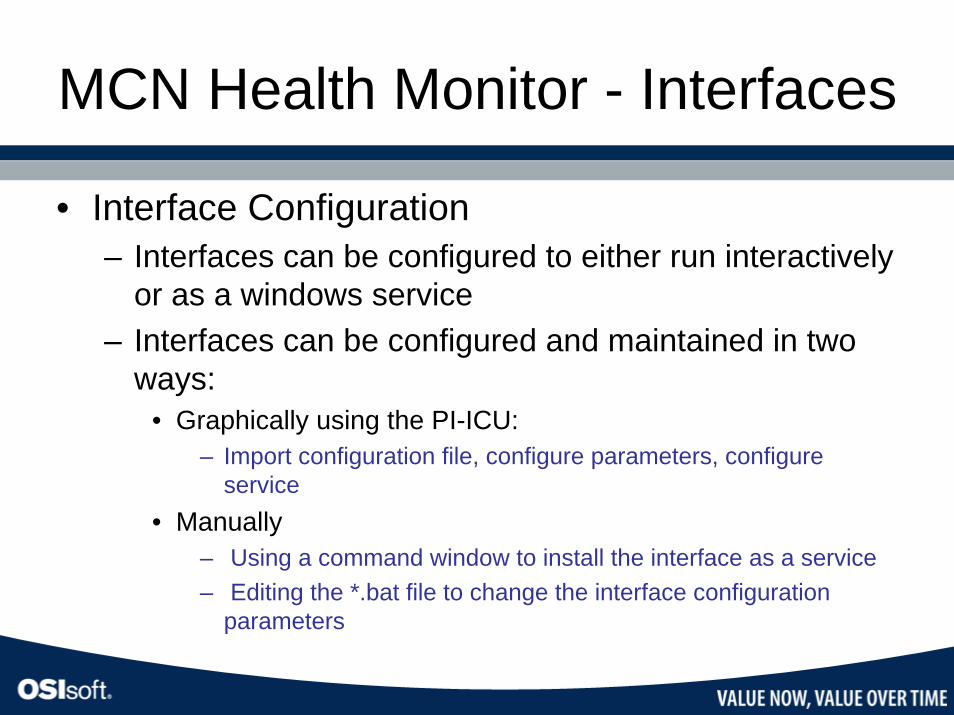
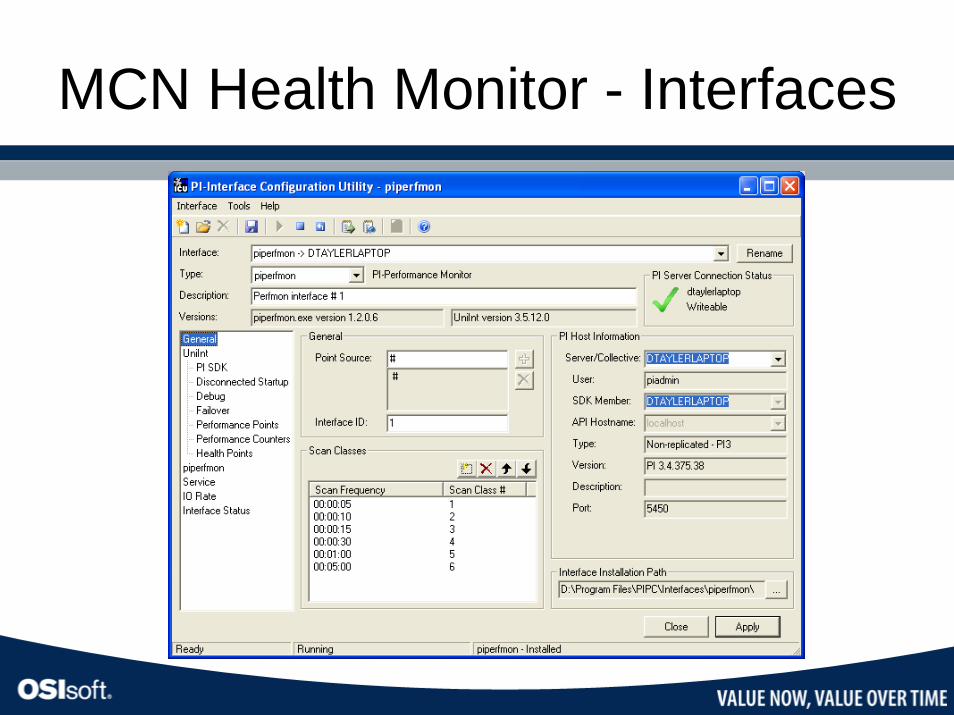
MCN Health Monitor - Interfaces
• Interface Configuration– Interfaces can be configured to either run interactively
or as a windows service– Interfaces can be configured and maintained in two
ways:• Graphically using the PI-ICU:
– Import configuration file, configure parameters, configure service
• Manually– Using a command window to install the interface as a service– Editing the *.bat file to change the interface configuration
parameters
MCN Health Monitor - Interfaces
MCN Health Monitor – PING Interface
• Measures the latency of network connections
• Use this interface to record a history of ping response times for a device– Use this information to see network response
times and troubleshoot slow / broken connections
– Check whether a certain machine is responsive
MCN Health Monitor – PING Interface
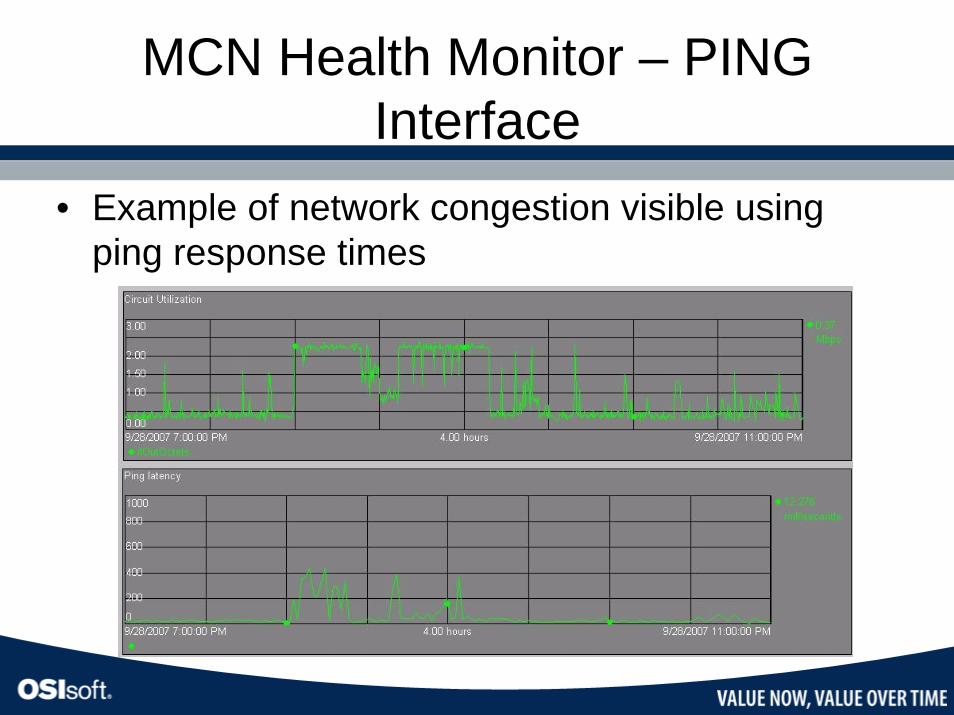
• Example of network congestion visible using ping response times
MCN Health Monitor – PING Interface
• OSIsoft recommends you to configure a PI Ping tag for each:– Data Acquisition Node– Major network equipment (Switches,
routers,…)– Internal application server (mail server, ERP
server, RDBMS,…)– External (Mail destination addresses, Internet
sites, Remote offices,…)
MCN Health Monitor – TCP Response Interface
• Use this to measure and archive the response times of certain services and applications on a TCP/IP network– Services: FTP, Web, Mail etc…– Ports: 161 for SNMP, 23 for Telnet
• Similar to ping but it connects to a particular TCP port on the target machine– Sends a connection request to a particular port– Waits for an appropriate response from the service

MCN Health Monitor – TCP Response Interface
• PI TCPResponse allows you to determine the response times of– HTTP (Web) servers;– SMTP, POP3, and IMAP (mail) servers;– FTP servers;– DNS servers;– Microsoft Windows Terminal Servers;– OSIsoft’s PI Servers;– Any TCP application that exclusively uses a specific
port number.
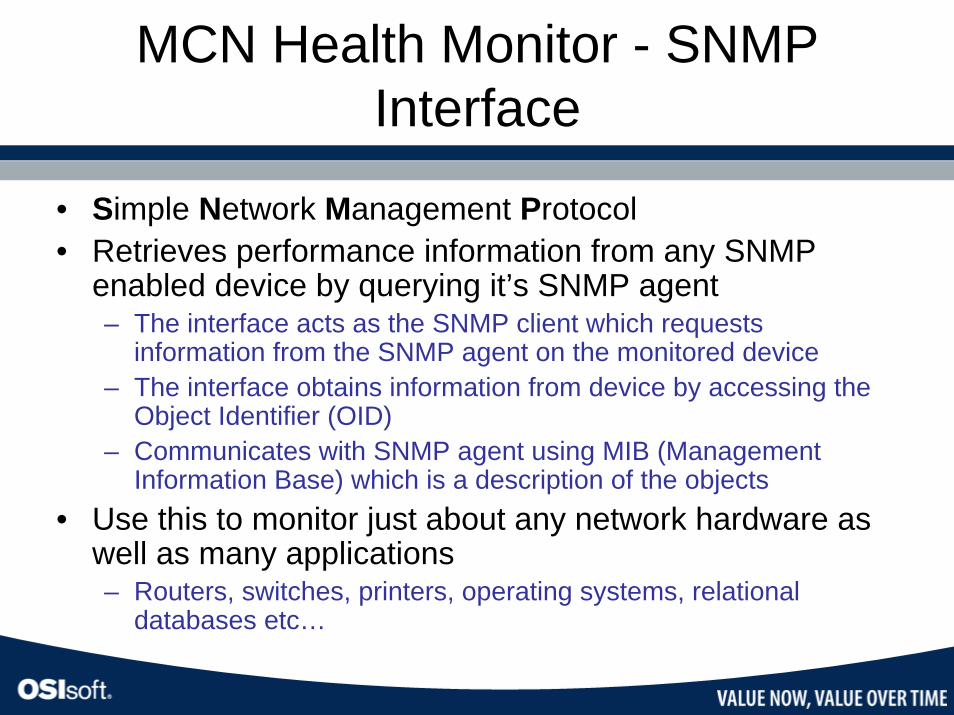
MCN Health Monitor - SNMP Interface
• Simple Network Management Protocol• Retrieves performance information from any SNMP
enabled device by querying it’s SNMP agent– The interface acts as the SNMP client which requests
information from the SNMP agent on the monitored device– The interface obtains information from device by accessing the
Object Identifier (OID)– Communicates with SNMP agent using MIB (Management
Information Base) which is a description of the objects• Use this to monitor just about any network hardware as
well as many applications– Routers, switches, printers, operating systems, relational
databases etc…
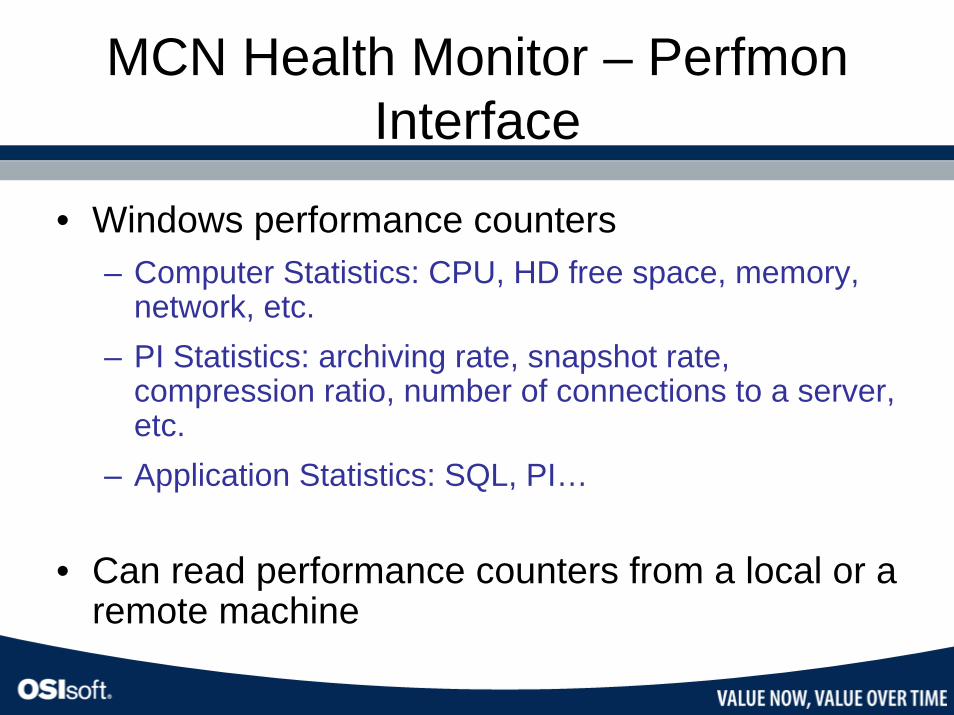
MCN Health Monitor – Perfmon Interface
• Windows performance counters– Computer Statistics: CPU, HD free space, memory,
network, etc.– PI Statistics: archiving rate, snapshot rate,
compression ratio, number of connections to a server, etc.
– Application Statistics: SQL, PI…
• Can read performance counters from a local or a remote machine
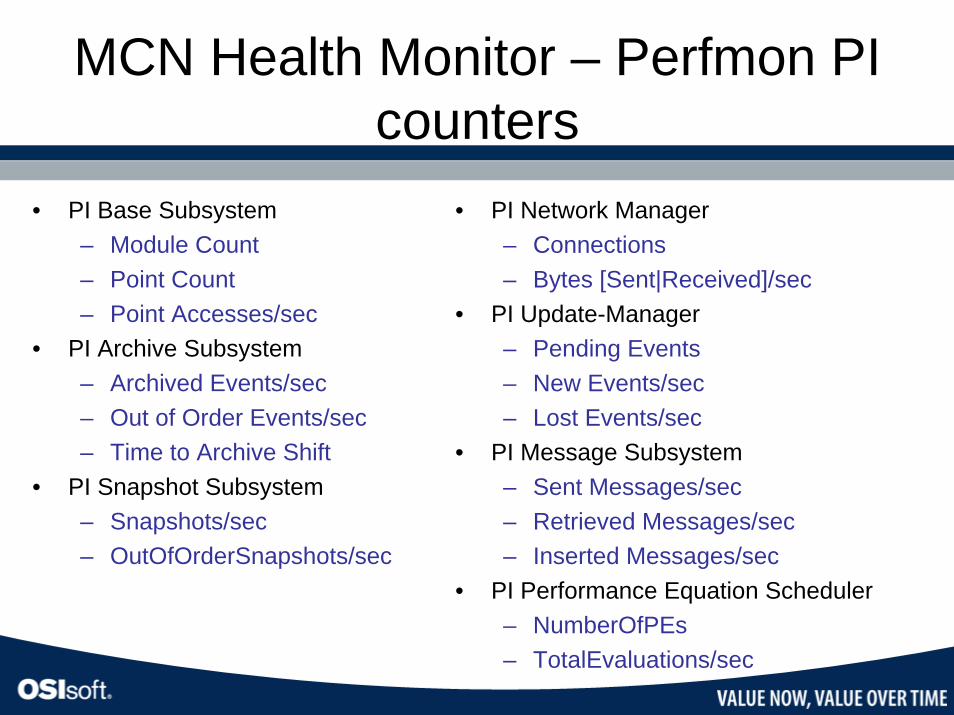
MCN Health Monitor – Perfmon PI counters
• PI Network Manager– Connections– Bytes [Sent|Received]/sec
• PI Update-Manager– Pending Events– New Events/sec– Lost Events/sec
• PI Message Subsystem– Sent Messages/sec– Retrieved Messages/sec– Inserted Messages/sec
• PI Performance Equation Scheduler– NumberOfPEs– TotalEvaluations/sec
• PI Base Subsystem– Module Count– Point Count– Point Accesses/sec
• PI Archive Subsystem– Archived Events/sec– Out of Order Events/sec– Time to Archive Shift
• PI Snapshot Subsystem– Snapshots/sec– OutOfOrderSnapshots/sec
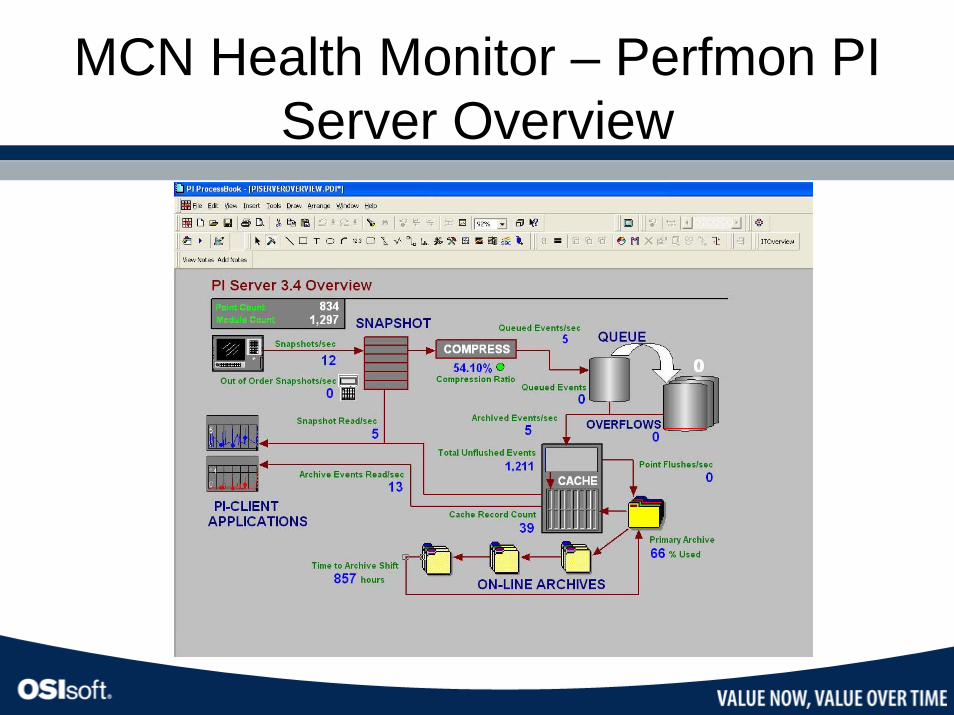
MCN Health Monitor – Perfmon PI Server Overview
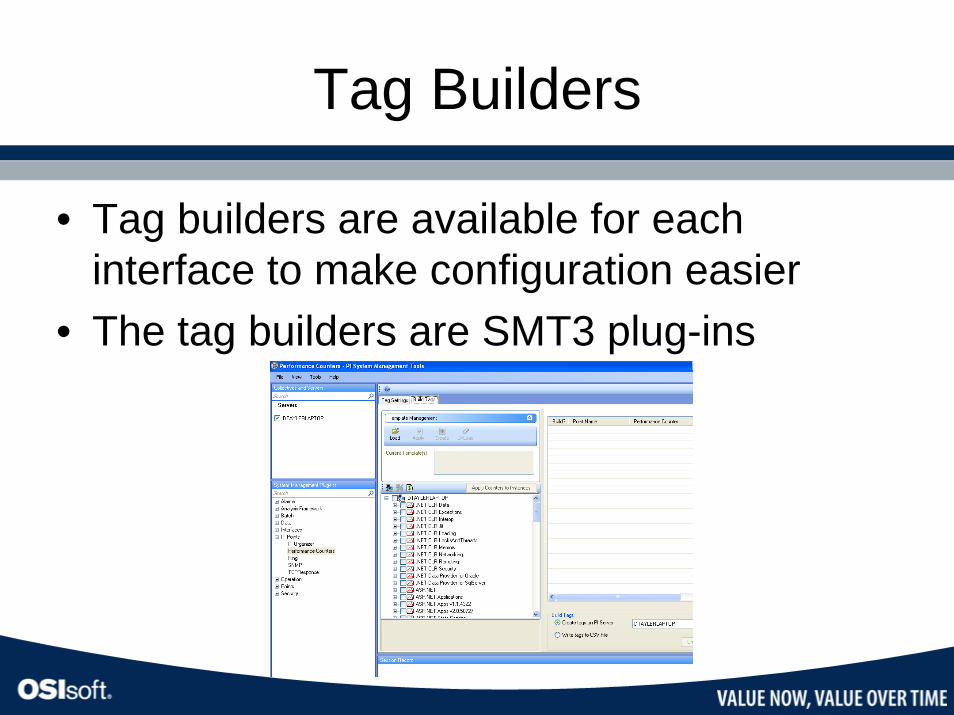
Tag Builders
• Tag builders are available for each interface to make configuration easier
• The tag builders are SMT3 plug-ins
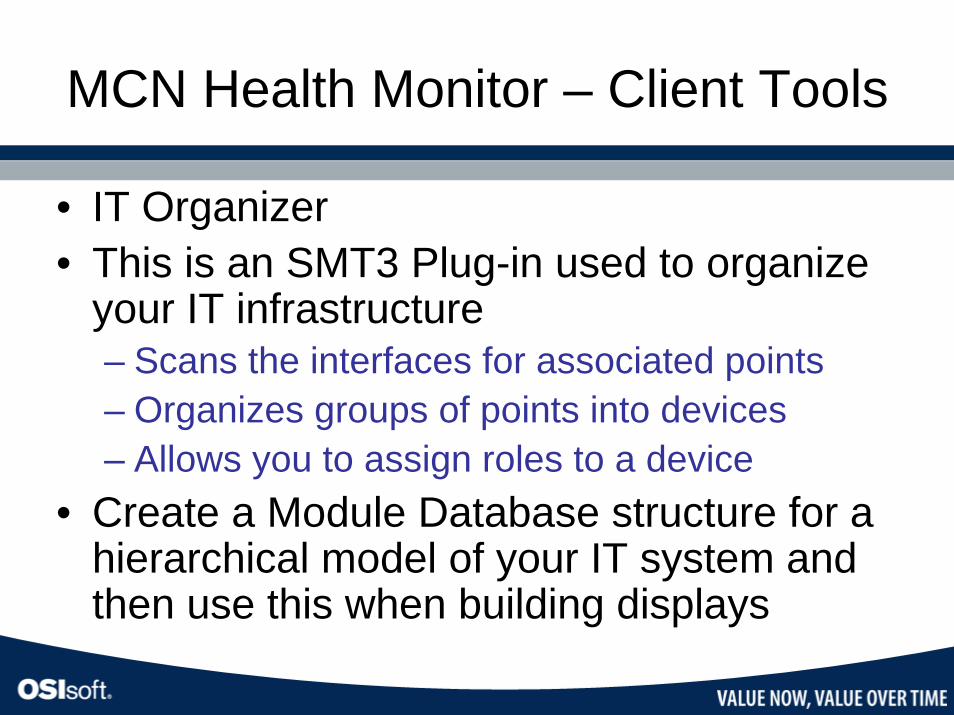
MCN Health Monitor – Client Tools
• IT Organizer• This is an SMT3 Plug-in used to organize
your IT infrastructure– Scans the interfaces for associated points– Organizes groups of points into devices– Allows you to assign roles to a device
• Create a Module Database structure for a hierarchical model of your IT system and then use this when building displays
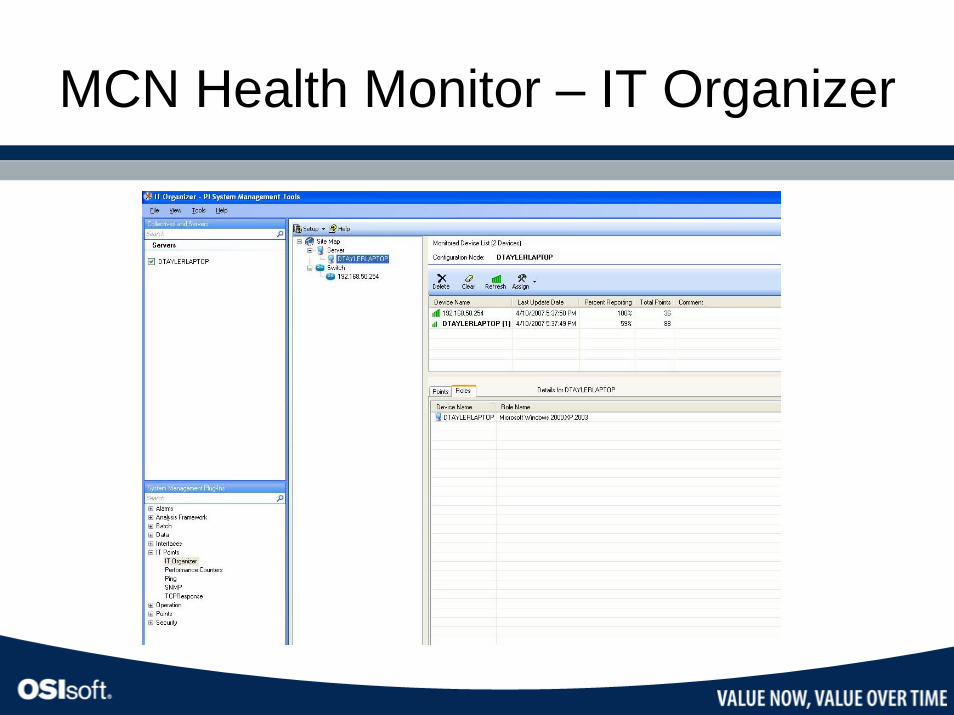
MCN Health Monitor – IT Organizer
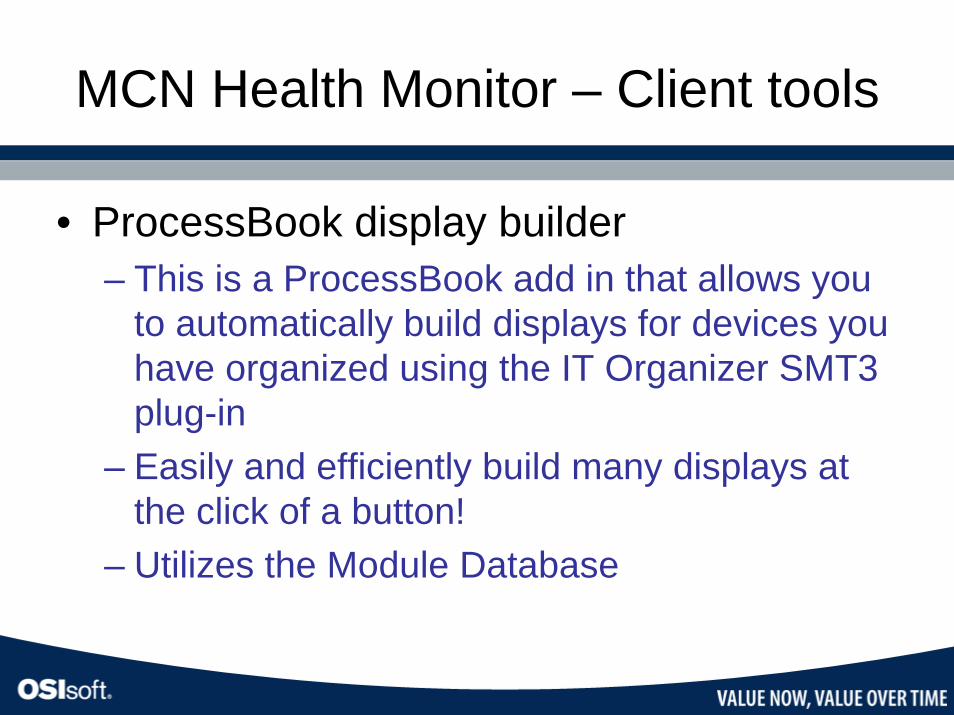
MCN Health Monitor – Client tools
• ProcessBook display builder– This is a ProcessBook add in that allows you
to automatically build displays for devices you have organized using the IT Organizer SMT3 plug-in
– Easily and efficiently build many displays at the click of a button!
– Utilizes the Module Database
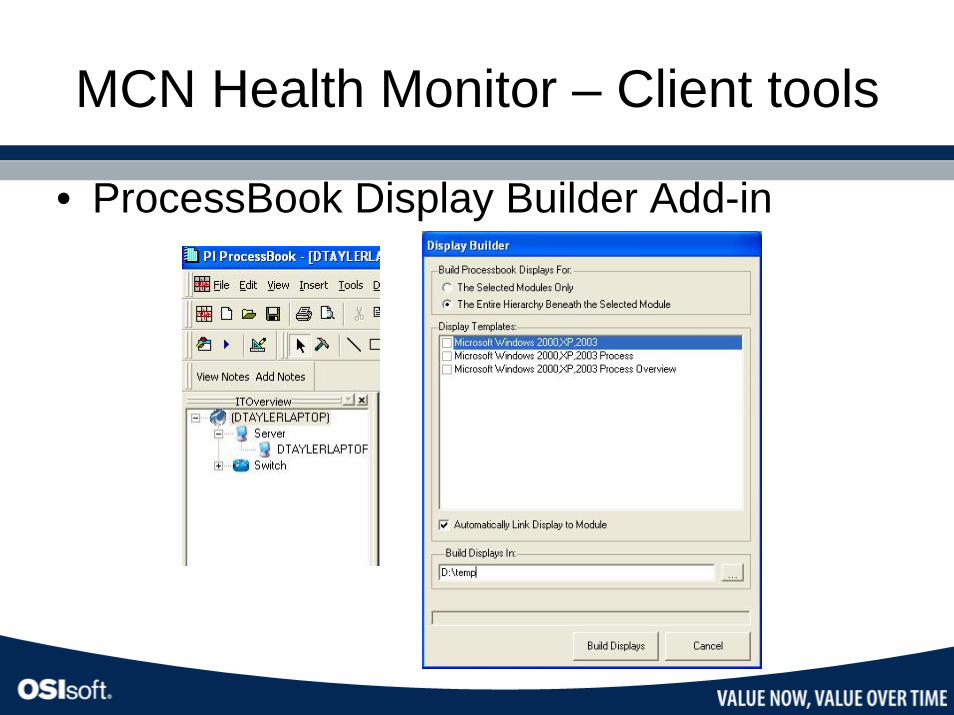
MCN Health Monitor – Client tools
• ProcessBook Display Builder Add-in
MCN Health Monitor – Client tools
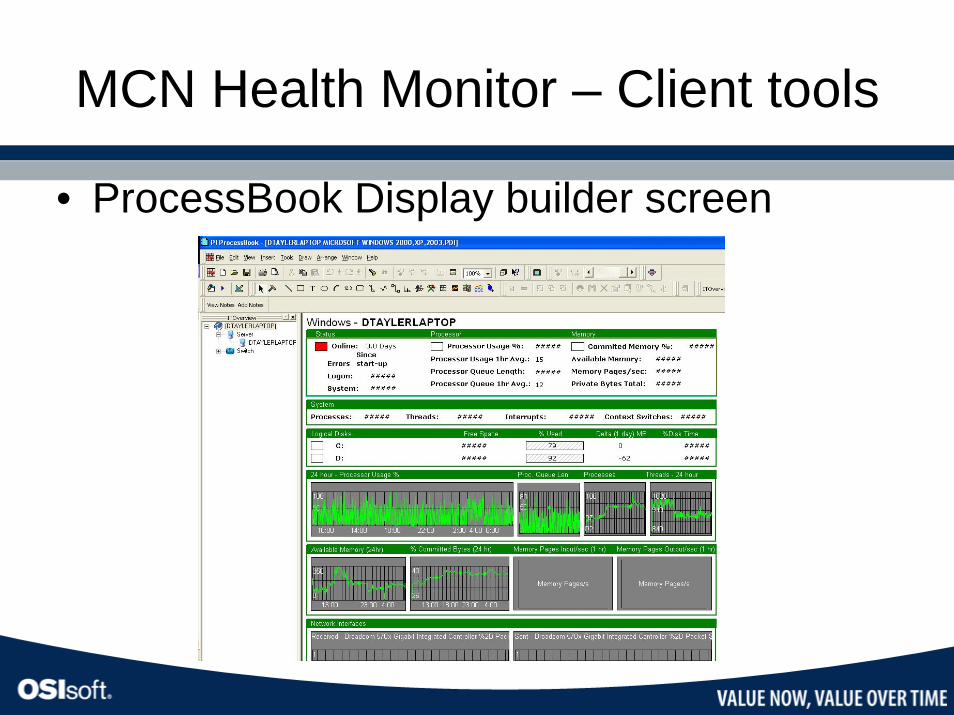
• ProcessBook Display builder screen
MCN Health Monitor – Steps to configure monitoring
• Example: Configuring monitoring for a new windows server machine– Interface configuration– Tag building– IT Organizer – Assign role to device– ProcessBook Display Builder– Upload SVG to SharePoint if required
MCN Health Monitor - Benefits
• Easy to use if you’re already familiar with PI• A great way to leverage existing infrastructure &
investment• Further extend the benefits of your current PI
system• Manage IT resources effectively• Historical and real time problem analysis• Less downtime

MCN Health Monitor
• More information…– http://techsupport.osisoft.com– http://training.osisoft.com
MCN Health Monitor
Thank You!