Embed Size (px)
Citation preview

7/26/2019 McKinsey Report NewIT Oct2012
http://slidepdf.com/reader/full/mckinsey-report-newit-oct2012 1/30
CIO Summit
November, 2012
CONFIDENTIAL AND PROPRIETARY Any use of this material without specific permission
of McKinsey & Company is strictly prohibited
William Forrest

7/26/2019 McKinsey Report NewIT Oct2012
http://slidepdf.com/reader/full/mckinsey-report-newit-oct2012 2/30
McKinsey & Company
L a s t M o d i f i e d
1 1 / 2 1 / 2 0 1 2 1 2 : 3 1 P M C en t r al S t an d ar d T i m e P r i n t e d
3 1 / 1 0 / 2 0 1 2 2 0 : 5 8 R om an c e S t an d ar d T i m e
|
What I will talk about today
1
!
“Current IT” as we know it is no longer a game-changer
! We already see significant disruption in many
business models
! “New IT” is rising to fill the place of “Current IT”
! How to take advantage of “New IT”

7/26/2019 McKinsey Report NewIT Oct2012
http://slidepdf.com/reader/full/mckinsey-report-newit-oct2012 3/30
McKinsey & Company
L a s t M o d i f i e d
1 1 / 2 1 / 2 0 1 2 1 2 : 3 1 P M C en t r al S t an d ar d T i m e P r i n t e d
3 1 / 1 0 / 2 0 1 2 2 0 : 5 8 R om an c e S t an d ar d T i m e
| 2
IT spend by industr
y
0
1
2
3
4
5
6
7
8
9
0 3 6 9 12 15 18 21 24 27 30
IT spending as % of revenue
Operating marginPercent
Construction, materialsand natural resources
Food and beverageprocessing
Chemicals
Retail and wholesale
Media andentertainmentTransportation
Industrial electronicsand electrical equipment
Healthcareproviders
Software publishingand internet services
Banking andfinancial services
Professionalservices
Education
Telecomm-unicationsInsurance
Industrialmanufacturing
Utilities
Pharmaceuticals,life sciences andmedical products
Consumer products
Energy
Current IT has become table stakes - spending on IT is not a differentiator
R2 = 0.0726
Note: Banking specific data points are sourced from actual benchmarkedMcKinsey clients, and have been adjusted to include an industry standard of~30% capex, which is included in the Gartner IT spend by industry data
SOURCE: Gartner “IT Metrics: IT Spending and Staffing Report”, 2012;McKinsey Business Support Function (BSF) proprietary database
0
2
4
6
8
403020100
R2 = -0.3958
Confirms belief that IT spend does notcorrelate with business success
7/26/2019 McKinsey Report NewIT Oct2012
http://slidepdf.com/reader/full/mckinsey-report-newit-oct2012 4/30
McKinsey & Company
L a s t M o d i f i e d
1 1 / 2 1 / 2 0 1 2 1 2 : 3 1 P M C en t r al S t an d ar d T i m e P r i n t e d
3 1 / 1 0 / 2 0 1 2 2 0 : 5 8 R om an c e S t an d ar d T i m e
| 3
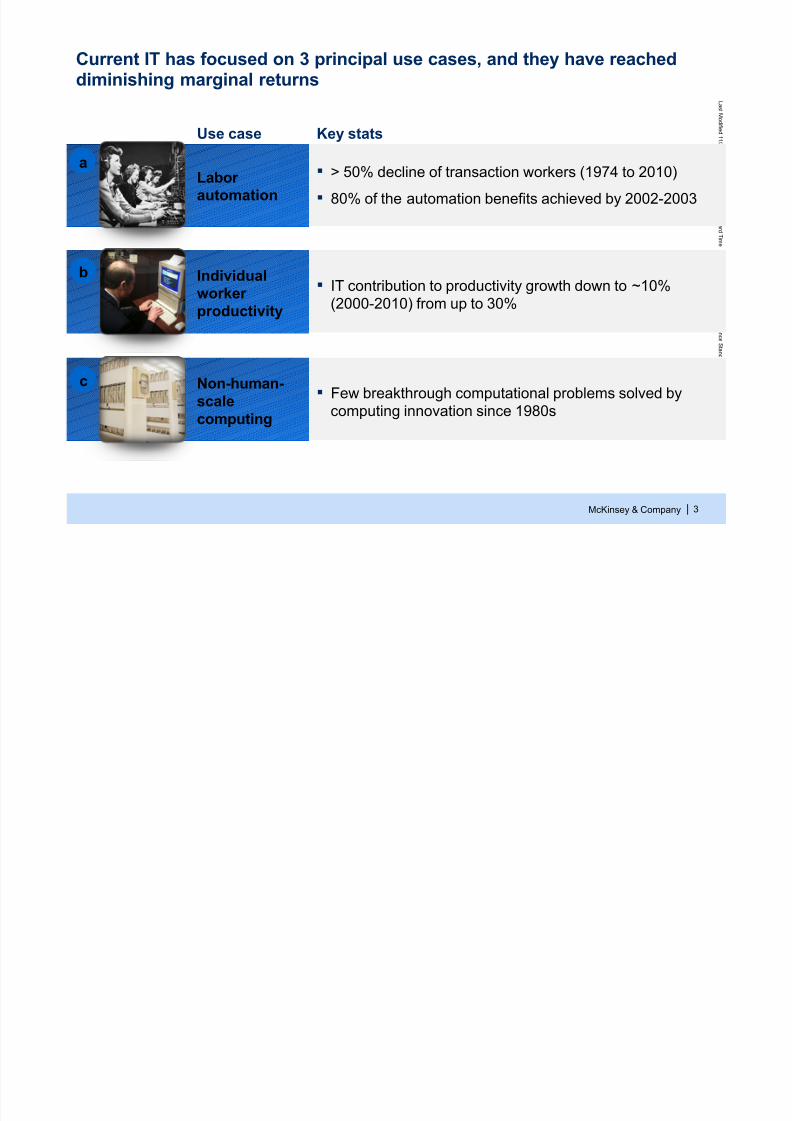
Current IT has focused on 3 principal use cases, and they have reacheddiminishing marginal returns
!
IT contribution to productivity growth down to ~10%(2000-2010) from up to 30%
Individualworkerproductivity
! Few breakthrough computational problems solved by
computing innovation since 1980s
Non-human-scale
computing
Key statsUse case
! > 50% decline of transaction workers (1974 to 2010)
! 80% of the automation benefits achieved by 2002-2003
Laborautomation
a
b
c

7/26/2019 McKinsey Report NewIT Oct2012
http://slidepdf.com/reader/full/mckinsey-report-newit-oct2012 5/30

7/26/2019 McKinsey Report NewIT Oct2012
http://slidepdf.com/reader/full/mckinsey-report-newit-oct2012 6/30
McKinsey & Company
L a s t M o d i f i e d
1 1 / 2 1 / 2 0 1 2 1 2 : 3 1 P M C en t r al S t an d ar d T i m e P r i n t e d
3 1 / 1 0 / 2 0 1 2 2 0 : 5 8 R om an c e S t an d ar d T i m e
|
Share of total workforce Percent
! despite increasin
g share of
knowledge workers
5
IT-driven productivity growth is actually shrinking, despite growth inknowledge workers
0
10
20
30
40
50
Time period
200520001990198019720
0.5
1.0
1.5
2.0
2.5
3.0
3.5
Time period
2005200019901972
Productivity growthattributable to IT
Average laborproductivity growth
INDIVIDUAL WORKER PRODUCTIVITY
1 Information technology includes computer hardware, software, and communications equipment. Share Attributed to Information Technology is the average contributionof information technology capital deepening plus the average contribution of information technology total factor productivity divided by average labor productivity foreach period.
2 Job types involving complex problem solving, special knowledge, experience, context (e.g., doctors, salespeople, project teams)Notes: Data are for the U.S. private economy. All figures are average annual growth rates. A contribution of an input reflects the share weighted growth rate.
SOURCE: Bureau of Labor Statistics, Bureau of Economic Analysis, 1970-2010, Jorgenson, Ho, Stiroh, “A Retrospective Look at theU.S. Productivity Growth Resurgence”, Federal Reserve Bank of New York Staff Reports, February 2007
b
Productivity growth Percent
IT1 contribution to productivity growth
is decreasing!
Knowledgeworkers2

7/26/2019 McKinsey Report NewIT Oct2012
http://slidepdf.com/reader/full/mckinsey-report-newit-oct2012 7/30
McKinsey & Company
L a s t M o d i f i e d
1 1 / 2 1 / 2 0 1 2 1 2 : 3 1 P M C en t r al S t an d ar d T i m e P r i n t e d
3 1 / 1 0 / 2 0 1 2 2 0 : 5 8 R om an c e S t an d ar d T i m e
| 6
Few breakthrough computational problems have been solved bycomputing innovation since the emergence of the microprocessor
NON-HUMAN-SCALE COMPUTING
1971 1975 1978 2011
MicroprocessorsMainframes
Businesscomputationalproblems solved
! A broader base
of departmentalusage
! Completinganalytics faster
! None! Back-end for
bankingtransactionprocessing
! Financial analytics
and risk modeling! Pricing changes
! Foreign currencyexchanges
Airline industryexample
! Computerizedreservation andticketing e.g.
SABRE for AA
! ComputerizedReservationSystems (CRS)
!
Yield management
! Demandforecasting
! Customer
profitabilityanalysis, leadingto frequent flyerprograms
! Network,luggage,and crew
planningandoptimization
SOURCE: McKinsey; Maurer, “Internet for the Retail Travel Industry”, 2003; team analysis
c
Mini computers

7/26/2019 McKinsey Report NewIT Oct2012
http://slidepdf.com/reader/full/mckinsey-report-newit-oct2012 8/30
McKinsey & Company
L a s t M o d i f i e d
1 1 / 2 1 / 2 0 1 2 1 2 : 3 1 P M C en t r al S t an d ar d T i m e P r i n t e d 3 1 / 1 0 / 2 0 1 2 2 0 : 5 8 R om an c e S t an d ar d T i m e
|
Thought leaders in the technology world are advocatingfor a rethink of enterprise and corporate IT
SOURCE: Press search
"[Technology is] shifting more of the power in the tech industry awayfrom those who deploy and support apps to those who build them.
– Jason Hiner, Editor in Chief of TechRepublic
The success of companies like Google, Facebook, Amazon, andNetflix, not to mention Wall Street firms and industries frommanufacturing to retail and healthcare, is increasingly driven bybetter tools for extracting meaning from very large quantities ofdata.
– Tim O'Reilly, Industry Thought Leader
The status quo [of Corporate IT] is unacceptable and this rethinkneeds to take place – it should have taken place a long time ago.
– John Thorp, author of The Information Paradox
Enterprise software companies sell bad software for huge amounts of
money. They get away with it for a variety of reasons that link together toform a sort of protective wall. But the software world is changing.
– Paul Graham, Co-founder of Ycombinator

7/26/2019 McKinsey Report NewIT Oct2012
http://slidepdf.com/reader/full/mckinsey-report-newit-oct2012 9/30
McKinsey & Company
L a s t M o d i f i e d
1 1 / 2 1 / 2 0 1 2 1 2 : 3 1 P M C en t r al S t an d ar d T i m e P r i n t e d 3 1 / 1 0 / 2 0 1 2 2 0 : 5 8 R om an c e S t an d ar d T i m e
|
The highest IT priority for most companies should be to move IT spend toindustry average
4.5%
1.5%
1.5%
2%
IT spending as % of revenue – range by industry%, 2012
0 1 2 3 4 5 6 7 8 9 10
Banking
Healthcare
Insurance
Otherindustries
Potential op. marginincrease by reducingaverage IT costs for topquartile to the average% points
Op. marginimprovement% increase
Industryop. marginrange1
%
12-30%
7-14%
5-25%
6-15% ~10-25%
~7-17%
~11-21%
~18-90%1
SOURCE: Gartner “IT Metrics: IT Spending and Staffing Report”, 2012, Bloomberg, team analysis
1 Operating margin range taken from the range of first and last quartiles of top 100 companies in each industry by revenueNote: IT spend = opex plus capex (no depreciation)
Bottomquartile
Average Topquartile
7/26/2019 McKinsey Report NewIT Oct2012
http://slidepdf.com/reader/full/mckinsey-report-newit-oct2012 10/30
McKinsey & Company
L a s t M o d i f i e d
1 1 / 2 1 / 2 0 1 2 1 2 : 3 1 P M C en t r al S t an d ar d T i m e P r i n t e d 3 1 / 1 0 / 2 0 1 2 2 0 : 5 8 R om an c e S t an d ar d T i m e
|
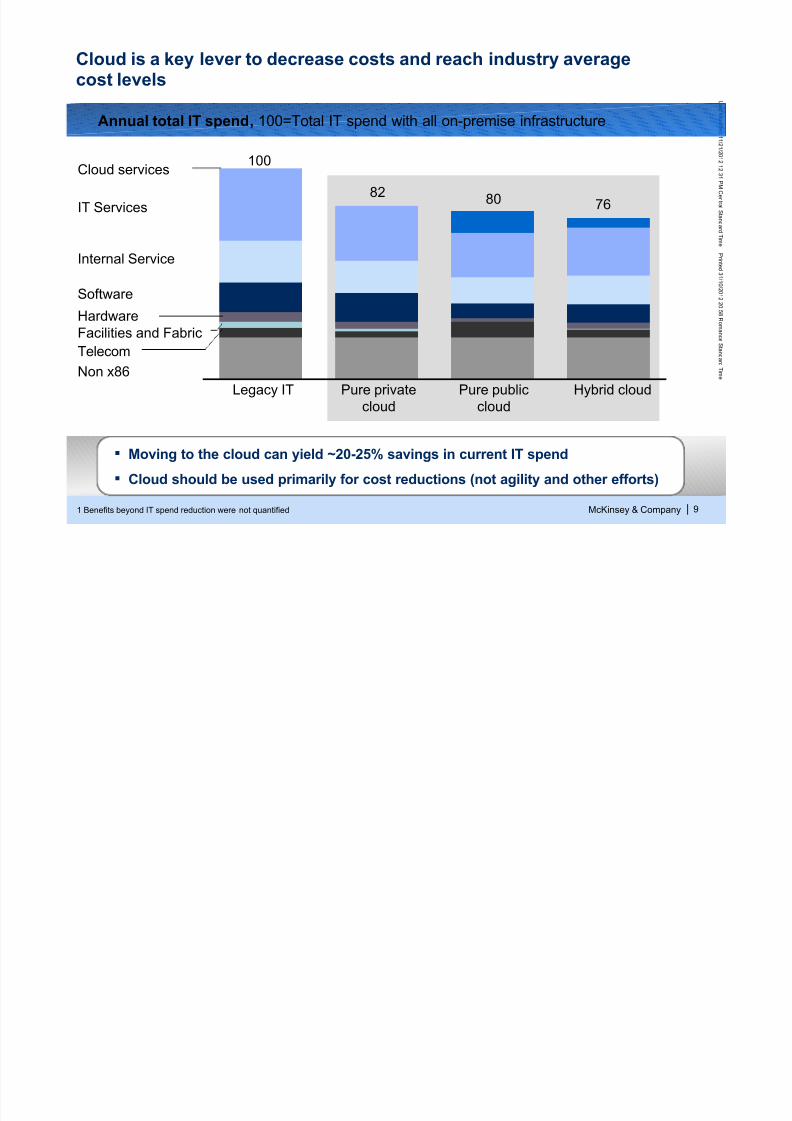
Cloud is a key lever to decrease costs and reach industry averagecost levels
91 Benefits beyond IT spend reduction were not quantified
Non x86
Telecom
Facilities and FabricHardware
Software
Internal Service
IT Services
Cloud services
Hybrid cloud
76
Pure publiccloud
80
Pure privatecloud
82
Legacy IT
100
Annual total IT spend, 100=Total IT spend with all on-premise infrastructure
! Moving to the cloud can yield ~20-25% savings in current IT spend
! Cloud should be used primarily for cost reductions (not agility and other efforts)

7/26/2019 McKinsey Report NewIT Oct2012
http://slidepdf.com/reader/full/mckinsey-report-newit-oct2012 11/30
McKinsey & Company
L a s t M o d i f i e d
1 1 / 2 1 / 2 0 1 2 1 2 : 3 1 P M C en t r al S t an d ar d T i m e P r i n t e d 3 1 / 1 0 / 2 0 1 2 2 0 : 5 8 R om an c e S t an d ar d T i m e
|
What I will talk about today
10
! “Current IT” as we know it is no longer a game-changer
! We already see significant disruption in many
business models
! “New IT” is rising to fill the place of “Current IT”
! How to take advantage of “New IT”

7/26/2019 McKinsey Report NewIT Oct2012
http://slidepdf.com/reader/full/mckinsey-report-newit-oct2012 12/30
McKinsey & Company
L a s t M o d i f i e d
1 1 / 2 1 / 2 0 1 2 1 2 : 3 1 P M C en t r al S t an d ar d T i m e P r i n t e d 3 1 / 1 0 / 2 0 1 2 2 0 : 5 8 R om an c e S t an d ar d T i m e
| 11
Historical and expected revenuesgenerated from new sources
The world is changing: CEOs recognize that future revenue growth willcome from new business models
25-30%
+50-67%
10-’15
expected
04-’09
15-20%
Increase in % ofMcKinsey engagements focused on innovation2 between ‘05 –’11
Increase in Google searchvolume3 for “business model
innovation” between ‘07 –’11
117%
183%
1 Estimates based on survey responses of ~1,500 CEOs globally, conducted in 2010 by IBM2 Engagements with “Innovation” as the primary or secondary functional classification3 Sourced from Google Insights for Search; indexed to 100 as peak search volume
SOURCE: McKinsey FPIS; Google Insights for Search worldwide (data pulled on March 14th, 2012); 2010 IBM GlobalCEO Study; McKinsey research
% of overall revenues1

7/26/2019 McKinsey Report NewIT Oct2012
http://slidepdf.com/reader/full/mckinsey-report-newit-oct2012 13/30
McKinsey & Company
L a s t M o d i f i e d
1 1 / 2 1 / 2 0 1 2 1 2 : 3 1 P M C en t r al S t an d ar d T i m e P r i n t e d 3 1 / 1 0 / 2 0 1 2 2 0 : 5 8 R om an c e S t an d ar d T i m e
| 12
“Current IT” models are transforming: Amazon ispursuing business model change across the value chain
Business model change lever Amazon.com example
Changing the cost ofinputs
Utilize a sophisticated supply chain managementsystem to improve operational efficiency
Eliminating value chainintermediaries
Providing a digital publishing platform bypassingtraditional publishing houses and keeping ~70%of sales
Driving customerpreference in anexisting market
Leveraged large amounts of data aroundcustomer behaviors to offer Prime
Serving an underservedmarket in a new way
Creating a single marketplace across thousandsof sellers of out of print books
AWS selling rented timeslot on the cloud, insteadof physical computer
Introducing newmonetization model
SOURCE: McKinsey, team analysis, Amazon.com, press releases
AMAZON.COM EXAMPLENOT EXHAUSTIVE
Enables changes e.g. real-time behavior and data tracking,scale and flexibility and multi-device connectivity

7/26/2019 McKinsey Report NewIT Oct2012
http://slidepdf.com/reader/full/mckinsey-report-newit-oct2012 14/30
McKinsey & Company
L a s t M o d i f i e d
1 1 / 2 1 / 2 0 1 2 1 2 : 3 1 P M C en t r al S t an d ar d T i m e P r i n t e d 3 1 / 1 0 / 2 0 1 2 2 0 : 5 8 R om an c e S t an d ar d T i m e
|
Need new ways to
delivershareholder value
13
A perfect storm is approaching: economic conditions arechanging, demanding business model transformation
SOURCE: McKinsey; client interviews
Emerging markets predominant in future
growth, with lower costpoints and differentconsumption models(e.g., bank-less, SMS-based money transfer)
Growing performancegap between leadersand laggards
Industries unable tomeet investorexpectations (e.g., insurance)
Increasingly competitiveenvironment putsincumbent players at risk (~65% surviving S&P500today vs. 90% in 1970s)
CROSS-INDUSTRYMODEL

7/26/2019 McKinsey Report NewIT Oct2012
http://slidepdf.com/reader/full/mckinsey-report-newit-oct2012 15/30
McKinsey & Company
L a s t M o d i f i e d
1 1 / 2 1 / 2 0 1 2 1 2 : 3 1 P M C en t r al S t an d ar d T i m e P r i n t e d 3
1 / 1 0 / 2 0 1 2 2 0 : 5 8 R om an c e S t an d ar d T i m e
| 14
Business model innovation can lead to success
20112005
4%
16%
+279%
18%
+468%
20112005
3%
Revenue
Performance of Apple, Amazon, and Google vs. remainder of NASDAQ-100% contribution to NASDAQ-100 aggregate
SOURCE: Bloomberg and public financial data
Some “pure play” New IT companies are already achieving major top- and
bottom-line advantage!
EBITDA
7/26/2019 McKinsey Report NewIT Oct2012
http://slidepdf.com/reader/full/mckinsey-report-newit-oct2012 16/30
McKinsey & Company
L a s t M o d i f i e d
1 1 / 2 1 / 2 0 1 2 1 2 : 3 1 P M C en t r al S t an d ar d T i m e P r i n t e d 3
1 / 1 0 / 2 0 1 2 2 0 : 5 8 R om an c e S t an d ar d T i m e
|
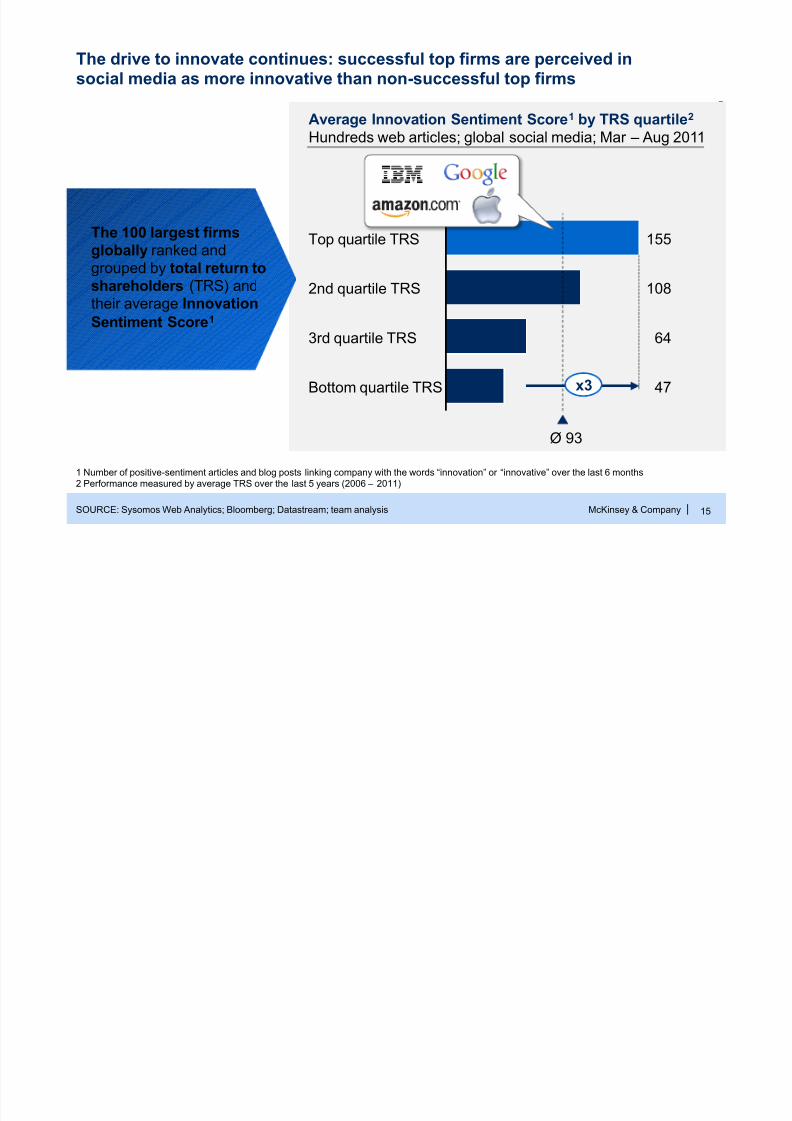
The drive to innovate continues: successful top firms are perceived insocial media as more innovative than non-successful top firms
15
64
108
155
Ø 93
47
The 100 largest firmsglobally ranked andgrouped by total return toshareholders (TRS) andtheir average Innovation
Sentiment Score1
2nd quartile TRS
Average Innovation Sentiment Score1 by TRS quartile2
Hundreds web articles; global social media; Mar – Aug 2011
Top quartile TRS
Bottom quartile TRS
3rd quartile TRS
1 Number of positive-sentiment articles and blog posts linking company with the words “innovation” or “innovative” over the last 6 months2 Performance measured by average TRS over the last 5 years (2006 – 2011)
SOURCE: Sysomos Web Analytics; Bloomberg; Datastream; team analysis
x3
7/26/2019 McKinsey Report NewIT Oct2012
http://slidepdf.com/reader/full/mckinsey-report-newit-oct2012 17/30
McKinsey & Company
L a s t M o d i f i e d 1 1 / 2 1 / 2 0 1 2 1 2 : 3 1 P M C en t r al S t an d ar d T i m e P r i n t e d 3
1 / 1 0 / 2 0 1 2 2 0 : 5 8 R om an c e S t an d ar d T i m e
|
What I will talk about today
16
! “Current IT” as we know it is no longer a game-changer
! We already see significant disruption in many
business models
! “New IT” is rising to fill the place of “Current IT”
! How to take advantage of “New IT”

7/26/2019 McKinsey Report NewIT Oct2012
http://slidepdf.com/reader/full/mckinsey-report-newit-oct2012 18/30
McKinsey & Company
L a s t M o d i f i e d 1 1 / 2 1 / 2 0 1 2 1 2 : 3 1 P M C en t r al S t an d ar d T i m e P r i n t e d 3
1 / 1 0 / 2 0 1 2 2 0 : 5 8 R om an c e S t an d ar d T i m e
|
“New IT” enables new business models and sources of growth
!
Online collaboration tools(e.g., internal wikis) helpteams work together
Individualworkerproductivity
! Google’s AdWords deliverscustomized, personalized ads
Non-human-scale
computing
! Amazon.com uses heavy“push” for cross-sellingrelated products
Laborautomation
Example usesCurrent IT use cases “New IT” use cases
Team &corporateproductivitygrowth
Digital only
products
Businessmodeltransfor-mation
a
b
c

7/26/2019 McKinsey Report NewIT Oct2012
http://slidepdf.com/reader/full/mckinsey-report-newit-oct2012 19/30
McKinsey & Company
L a s t M o d i f i e d 1 1 / 2 1 / 2 0 1 2 1 2 : 3 1 P M C en t r al S t an d ar d T i m e P r i n t e d 3
1 / 1 0 / 2 0 1 2 2 0 : 5 8 R om an c e S t an d ar d T i m e
| 18
Example: Amazon transforming e-retail by driving customerpreference and share of wallet gains
Approach
!
Collection and analysis of datato offer recommendations andgenerate “push” based sales
! 5X investment in internal IT toenable innovation
BUSINESS MODEL TRANSFORMATION
1 The only year this figure is available for – not reported separately in financial reports
SOURCE: Company web site, company reports, press and literature search
a
Amazon is the market leaderamong online retailers inaverage order size, drivenby “push” sales
35% of all sales (~$3.8B) in FY20061 came fromrecommendations
New businesses enabled
by investments in“NewIT” e.g. AWS ($1B),Kindle(10% of revenue) andinstant video to drive Prime
7/26/2019 McKinsey Report NewIT Oct2012
http://slidepdf.com/reader/full/mckinsey-report-newit-oct2012 20/30
McKinsey & Company
L a s t M o d i f i e d 1 1 / 2 1 / 2 0 1 2 1 2 : 3 1 P M C en t r al S t an d ar d T i m e P r i n t e d 3
1 / 1 0 / 2 0 1 2 2 0 : 5 8 R om an c e S t an d ar d T i m e
|
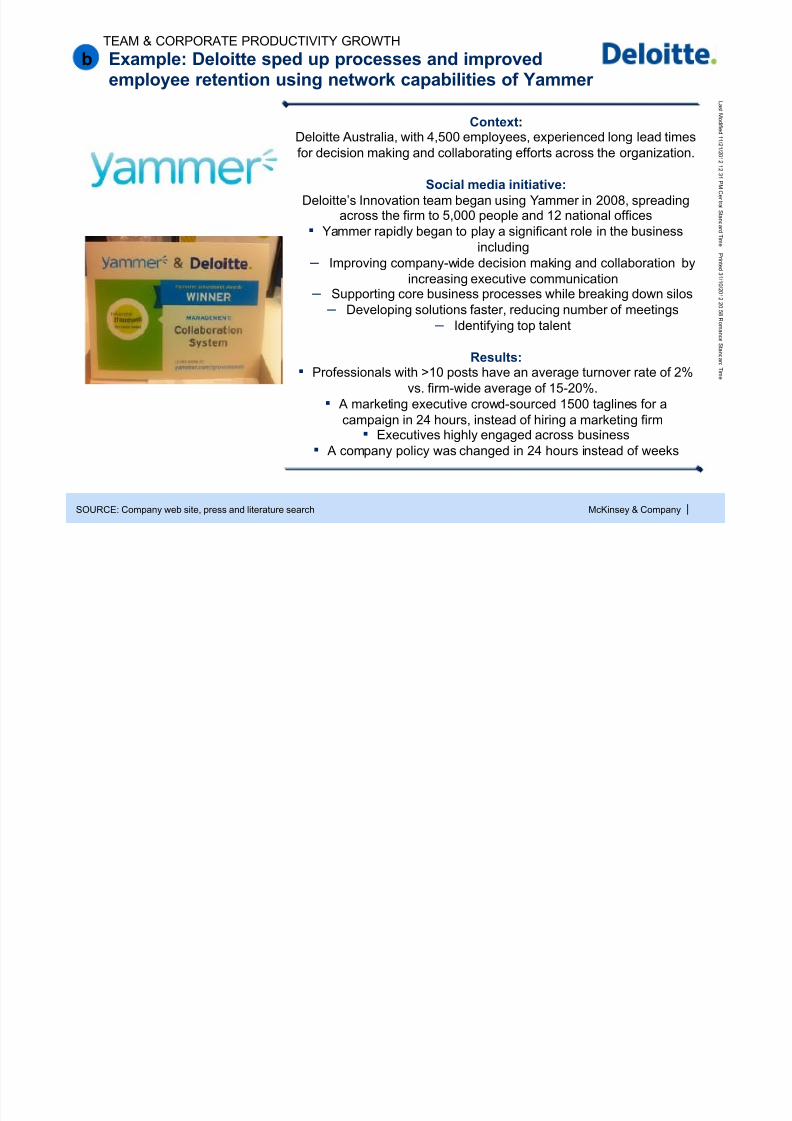
Example: Deloitte sped up processes and improvedemployee retention using network capabilities of Yammer
Context:
Deloitte Australia, with 4,500 employees, experienced long lead timesfor decision making and collaborating efforts across the organization.
Social media initiative: Deloitte’s Innovation team began using Yammer in 2008, spreading
across the firm to 5,000 people and 12 national offices! Yammer rapidly began to play a significant role in the business
including – Improving company-wide decision making and collaboration by
increasing executive communication – Supporting core business processes while breaking down silos
– Developing solutions faster, reducing number of meetings – Identifying top talent
Results:! Professionals with >10 posts have an average turnover rate of 2%
vs. firm-wide average of 15-20%.! A marketing executive crowd-sourced 1500 taglines for a
campaign in 24 hours, instead of hiring a marketing firm! Executives highly engaged across business
! A company policy was changed in 24 hours instead of weeks
TEAM & CORPORATE PRODUCTIVITY GROWTH
b
SOURCE: Company web site, press and literature search

7/26/2019 McKinsey Report NewIT Oct2012
http://slidepdf.com/reader/full/mckinsey-report-newit-oct2012 21/30
McKinsey & Company
L a s t M o d i f i e d 1 1 / 2 1 / 2 0 1 2 1 2 : 3 1 P M C en t r al S t an d ar d T i m e P r i n t e d 3
1 / 1 0 / 2 0 1 2 2 0 : 5 8 R om an c e S t an d ar d T i m e
| 20
Example: AdWords and AdSense deliver data-driven, customadvertisements, resulting in $36B of annual revenues for Google
(2012)Now(pre 2000)Then
!
Text-based custom ads delivered based on searchdata and page content
! In 2011, Google represented 6.5% of total
advertising industry, and 35.3% of the onlineadvertising industry
– In 2011 the total online advertising industry sizeis $78.6B, up from $10.5B in 2000
!
Offline advertisingdominated online ads
! Online ads were
untargeted andineffective, primarilydriven by display bannerand popup ads
DIGITAL-ONLY PRODUCTS
SOURCE: Interactive Advertising Bureau, Google finances, Magna Global forecasts 2012
c
7/26/2019 McKinsey Report NewIT Oct2012
http://slidepdf.com/reader/full/mckinsey-report-newit-oct2012 22/30
McKinsey & Company
L a s t M o d i f i e d 1 1 / 2 1 / 2 0 1 2 1 2 : 3 1 P M C en t r al S t an d ar d T i m e P r i n t e d 3
1 / 1 0 / 2 0 1 2 2 0 : 5 8 R om an c e S t an d ar d T i m e
|
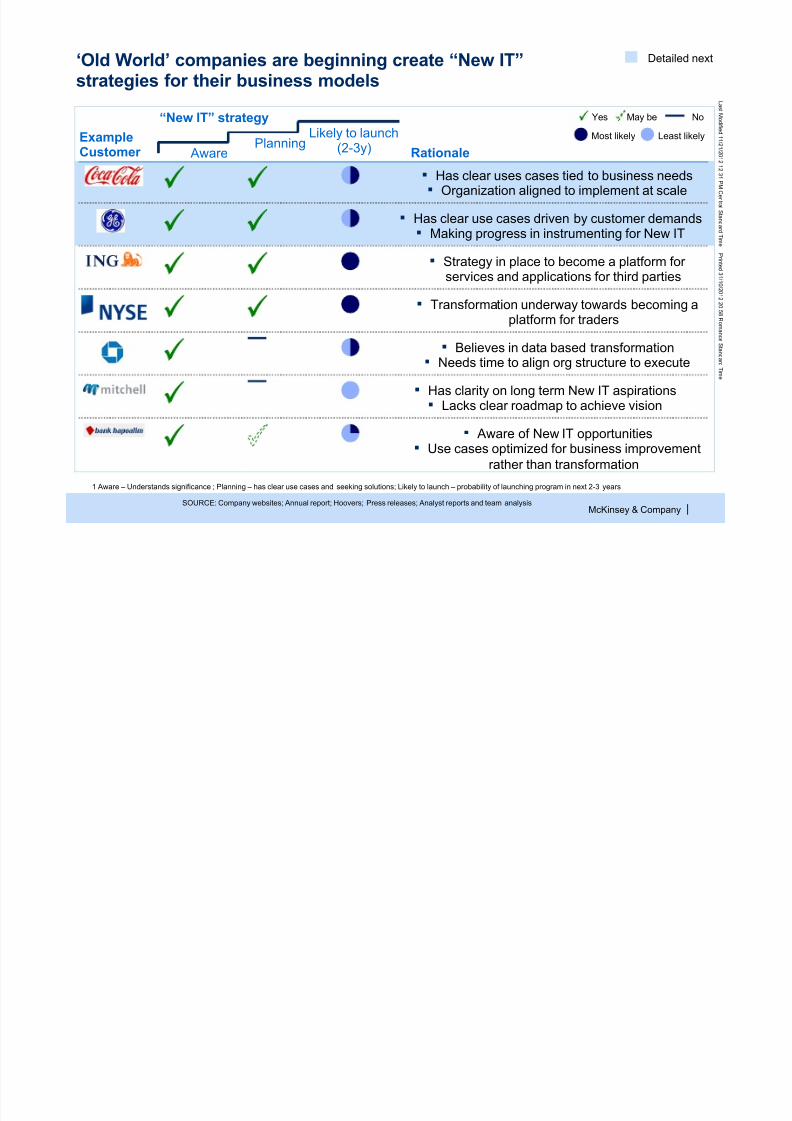
‘Old World’ companies are beginning create “New IT”strategies for their business models
1 Aware – Understands significance ; Planning – has clear use cases and seeking solutions; Likely to launch – probability of launching program in next 2-3 years
Rationale
“New IT” strategy
Likely to launch(2-3y) Aware PlanningExampleCustomer
Yes May be No
SOURCE: Company websites; Annual report; Hoovers; Press releases; Analyst reports and team analysis
! Has clear uses cases tied to business needs! Organization aligned to implement at scale
! Has clear use cases driven by customer demands! Making progress in instrumenting for New IT
! Strategy in place to become a platform for
services and applications for third parties
! Transformation underway towards becoming aplatform for traders
! Believes in data based transformation! Needs time to align org structure to execute
! Has clarity on long term New IT aspirations! Lacks clear roadmap to achieve vision
! Aware of New IT opportunities! Use cases optimized for business improvement
rather than transformation
Most likely Least likely
Detailed next
7/26/2019 McKinsey Report NewIT Oct2012
http://slidepdf.com/reader/full/mckinsey-report-newit-oct2012 23/30
McKinsey & Company
L a s t M o d i f i e d 1 1 / 2 1 / 2 0 1 2 1 2 : 3 1 P M C en t r al S t an d ar d T i m e P r i n t e d 3
1 / 1 0 / 2 0 1 2 2 0 : 5 8 R om an c e S t an d ar d T i m e
|
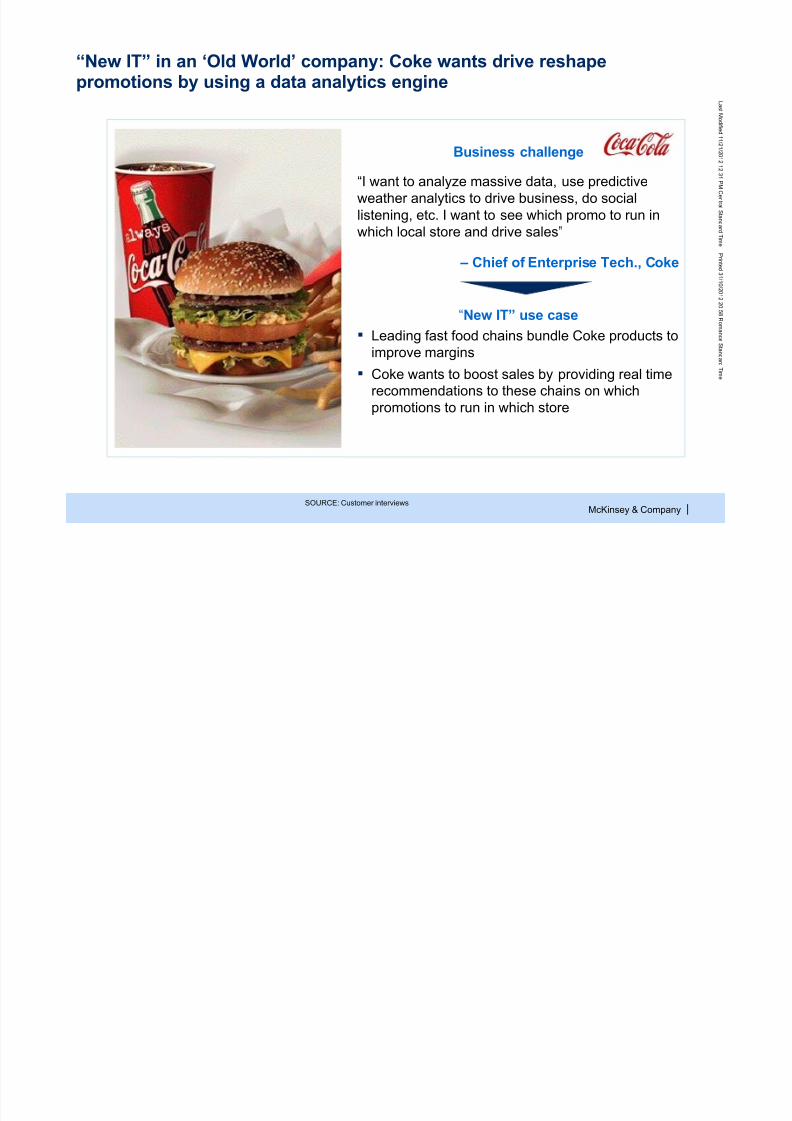
“New IT” in an ‘Old World’ company: Coke wants drive reshapepromotions by using a data analytics engine
SOURCE: Customer interviews
! Leading fast food chains bundle Coke products toimprove margins
!
Coke wants to boost sales by providing real timerecommendations to these chains on whichpromotions to run in which store
Business challenge
“New IT” use case
“I want to analyze massive data, use predictiveweather analytics to drive business, do sociallistening, etc. I want to see which promo to run inwhich local store and drive sales”
– Chief of Enterprise Tech., Coke
7/26/2019 McKinsey Report NewIT Oct2012
http://slidepdf.com/reader/full/mckinsey-report-newit-oct2012 24/30
McKinsey & Company
L a s t M o d i f i e d 1
1 / 2 1 / 2 0 1 2 1 2 : 3 1 P M C en t r al S t an d ar d T i m e P r i n t e d 3
1 / 1 0 / 2 0 1 2 2 0 : 5 8 R om an c e S t an d ar d T i m e
|
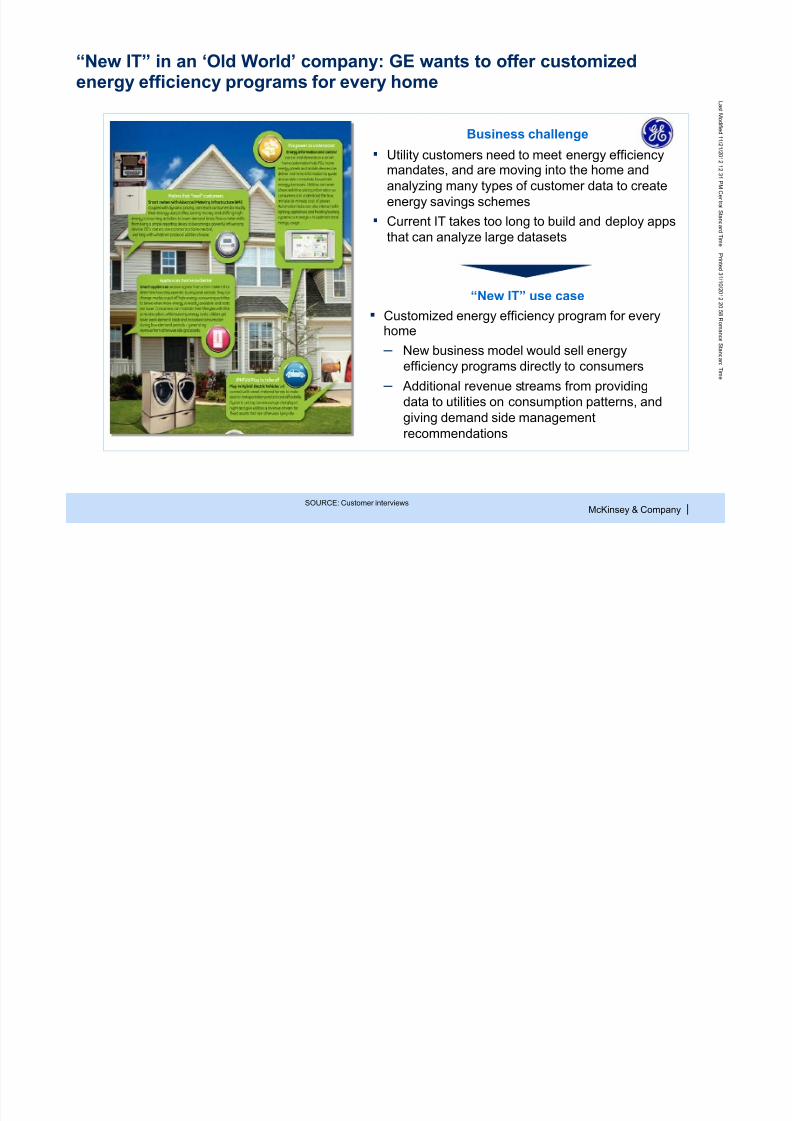
Business challenge
“New IT” in an ‘Old World’ company: GE wants to offer customizedenergy efficiency programs for every home
! Customized energy efficiency program for everyhome
– New business model would sell energyefficiency programs directly to consumers
– Additional revenue streams from providingdata to utilities on consumption patterns, and
giving demand side managementrecommendations
! Utility customers need to meet energy efficiencymandates, and are moving into the home andanalyzing many types of customer data to createenergy savings schemes
! Current IT takes too long to build and deploy appsthat can analyze large datasets
“New IT” use case
SOURCE: Customer interviews

7/26/2019 McKinsey Report NewIT Oct2012
http://slidepdf.com/reader/full/mckinsey-report-newit-oct2012 25/30
McKinsey & Company
L a s t M o d i f i e d 1
1 / 2 1 / 2 0 1 2 1 2 : 3 1 P M C en t r al S t an d ar d T i m e P r i n t e d 3
1 / 1 0 / 2 0 1 2 2 0 : 5 8 R om an c e S t an d ar d T i m e
|
What I will talk about today
24
! “Current IT” as we know it is no longer a game-changer
! We already see significant disruption in many
business models
! “New IT” is rising to fill the place of “Current IT”
! How to take advantage of “New IT”

7/26/2019 McKinsey Report NewIT Oct2012
http://slidepdf.com/reader/full/mckinsey-report-newit-oct2012 26/30
McKinsey & Company
L a s t M o d i f i e d 1
1 / 2 1 / 2 0 1 2 1 2 : 3 1 P M C en t r al S t an d ar d T i m e P r i n t e d 3 1 / 1 0 / 2 0 1 2 2 0 : 5 8 R om an c e S t an d ar d T i m e
|
CIO’s need to invest in “New IT” to enable business innovationand drive new monetization opportunities
25
Architect the Cloud for futureneeds so as to monetize thesenew business models
Envision the Cloud as avehicle that can delivernew revenue streams
Do not bow down todata silos
Select vendors withintegrated apps plusdata solutions
Engineer the Cloud to deriveinsights from data collectedacross multiple sources and BU’s
Choose solutions that provide anintegrated application and dataplatform, as independent dataand application offerings mightnot provide best in class results

7/26/2019 McKinsey Report NewIT Oct2012
http://slidepdf.com/reader/full/mckinsey-report-newit-oct2012 27/30
McKinsey & Company
L a s t M o d i f i e d 1
1 / 2 1 / 2 0 1 2 1 2 : 3 1 P M C en t r al S t an d ar d T i m e P r i n t e d 3 1 / 1 0 / 2 0 1 2 2 0 : 5 8 R om an c e S t an d ar d T i m e
|
Double click page on each next step
26SOURCE: Source
Text
7/26/2019 McKinsey Report NewIT Oct2012
http://slidepdf.com/reader/full/mckinsey-report-newit-oct2012 28/30
McKinsey & Company
L a s t M o d i f i e d 1
1 / 2 1 / 2 0 1 2 1 2 : 3 1 P M C en t r al S t an d ar d T i m e P r i n t e d 3 1 / 1 0 / 2 0 1 2 2 0 : 5 8 R om an c e S t an d ar d T i m e
|
Next steps!
27
! How does your organization currentlyview the role of IT?
! How aligned are your businessobjectives for IT and your IT
objectives?
! What kind of transformation do you seeNew IT leading towards in yourorganization

7/26/2019 McKinsey Report NewIT Oct2012
http://slidepdf.com/reader/full/mckinsey-report-newit-oct2012 29/30
McKinsey & Company
L a s t M o d i f i e d 1
1 / 2 1 / 2 0 1 2 1 2 : 3 1 P M C en t r al S t an d ar d T i m e P r i n t e d 3 1 / 1 0 / 2 0 1 2 2 0 : 5 8 R om an c e S t an d ar d T i m e
|
Appendix
28

7/26/2019 McKinsey Report NewIT Oct2012
http://slidepdf.com/reader/full/mckinsey-report-newit-oct2012 30/30
McKinsey & Company
L a s t M o d i f i e d 1
1 / 2 1 / 2 0 1 2 1 2 : 3 1 P M C en t r al S t an d ar d T i m e P r i n t e d 3 1 / 1 0 / 2 0 1 2 2 0 : 5 8 R om an c e S t an d ar d T i m e
| 29
CEOs are hoping to see improvements from cloud other than current ITcost reductionsPercent of respondents
SOURCE: McKinsey Quarterly Survey on information and technology strategy, 2010 (BTO strategy Q24, 25)
No
Do notknow
Yes
5
22
29
55
70
Other
Increased ability for ITto scale up (or shrink)to meet business needs
Disaster recovery andbusiness continuity
Lower unit cost of IT
Increased businessflexibility
(N = 332) Multiple selections allowed (N = 252)
Do you believe that cloudcomputing could drive valueat your company?
What are the most significant ways youexpect your company to realize value?
9
1675
Cloud is mainly
a cost reductionplay for CIOs