Embed Size (px)
Citation preview
A National Index on Wages and Income
Mapping
Opportunity:
J A N U A R Y 2 0 1 8
THEMcKellInstitute
THEMcKellInstitute
T H E M C K E L L I N S T I T U T E
1. IntroductionAbout the McKell Institute The McKell Institute is an independent, not-for-profit, public policy institute dedicated to developing practical policy ideas and contributing to public debate.
For more information phone (02) 9113 0944 or visit www.mckellinstitute.org.au
The opinions in this paper are those of the author and do not necessarily represent the views of the McKell Institute’s members, affiliates, individual board members or research committee members. Any remaining errors or omissions are the responsibility of the author.
THEMcKellInstitute
THEMcKellInstitute
ESTHER RAJADURAI
Esther Rajadurai is a policy officer at the McKell Institute, focusing on economic and quantitative analysis.
Prior to joining the McKell Institute, she gained experience working for a not-for-profit organisation combatting racism in Australia and was working on business case studies in collaboration with the Department of Education and Macquarie University, to be implemented as part of undergraduate coursework programs in the future. She also worked as a Research Assistant at the Faculty of Business and Economics at Macquarie University helping to collate data and research for published articles and journals.
She holds a Bachelor of Economics from Macquarie University with Distinction, and a Higher Diploma in Business from NCC Education UK with Honours.
About the Author
THEMcKellInstitute
T H E M C K E L L I N S T I T U T E
Mapping
Opportunity:
J A N U A R Y 2 0 1 8
A National Index on Wages and Income
4
T H E M C K E L L I N S T I T U T E
ContentsThe Advisory Panel 6
Foreword 11
Executive Summary 12
Introduction 15
Part one: The state of wages and income inequality in Australia today 16
Income inequality is widening ....................................................................................................................................................................................................................................16
Australia’s earnings distribution is becoming more disparate ......................................................................................................................................17
Australia’s minimum wage is declining ....................................................................................................................................................................................................18
Family employment status plays a critical role in combating unemployment ...........................................................................................18
Measures of inequality .........................................................................................................................................................................................................................................................19
The Gini Coefficient ........................................................................................................................................................................................................................................................19
The Lorenz Curve .............................................................................................................................................................................................................................................................20
The Wage Price Index .................................................................................................................................................................................................................................................21
The Great Gatsby Curve ..........................................................................................................................................................................................................................................23
Intergenerational inequality is prevalent in Australia .....................................................................................................................................................................24
This report helps develop an evidence base for overcoming wage inequality in Australia ........................................................24
Protecting our penalty rates and policies that disrupt inequality ..............................................................................................................................25
Part Two: The Challenges facing Australia’s ‘Fair-go’ 27
The changing compostion of the Australian economy ...................................................................................................................................................................27
Economic disruption has the potential to expand inequality ........................................................................................................................................28
STEM Education is vital, but it is not the solution to unemployment ..................................................................................................................28
Automation brings challenges and opportunities ................................................................................................................................................................................28
The rate of today’s occupations that face the risk of automation is gradually rising ........................................................................30
Automation is increasing wage flexibility and paving the way for the ‘gig economy’.......................................................................31
Impediments to employment can be overcome with technology ...........................................................................................................................31
Many of today’s occupations won’t exist in the future .........................................................................................................................................................32
5
THEMcKellInstitute
Mapping Opportunity: A National Index on Wages and Income
What an equitable society looks like and the dangers of inequality in opportunity ....................................................................................32
Income inequality affects the least fortunate in a multitude of ways ....................................................................................................................33
Financial stress indicators ......................................................................................................................................................................................................................................33
Intergenerational inequality is a scourge that Australia must avoid ......................................................................................................................35
Part Three: The variables that determine the Wage Index Model 36
Education ...................................................................................................................................................................................................................................................................................36
English proficiency ..........................................................................................................................................................................................................................................................38
Skills .................................................................................................................................................................................................................................................................................................39
Family employment ........................................................................................................................................................................................................................................................39
Sole parenthood ................................................................................................................................................................................................................................................................40
Access to the internet .................................................................................................................................................................................................................................................43
Unemployment ....................................................................................................................................................................................................................................................................43
Ethnicity and birthplace .............................................................................................................................................................................................................................................45
Part Four: Published findings from the model 46
The rankings ....................................................................................................................................................................................................................................................................................46
Key findings ......................................................................................................................................................................................................................................................................................48
State by State analysis ........................................................................................................................................................................................................................................................51
Median income ranked ........................................................................................................................................................................................................................................................66
Methodology for the model .............................................................................................................................................................................................................................................68
Median personal weekly income methodology ............................................................................................................................................................................68
The variables ..........................................................................................................................................................................................................................................................................69
Conclusion 70
References 72
6
T H E M C K E L L I N S T I T U T E
ANDREW LEIGH Andrew Leigh is the Shadow Assistant Treasurer and Federal Member for Fenner in the ACT. Prior to being elected in 2010, Andrew was a professor of economics at the Australian National University. He holds a PhD in public
policy from Harvard, having graduated from the University of Sydney with first class honours in Law and Arts. Andrew is a Fellow of the Australian Academy of Social Sciences, and a past recipient of the 'Young Economist Award', a prize given every two years by the Economics Society of Australia to the best Australian economist under 40. His books include Disconnected (2010), Battlers and Billionaires (2013), The Economics of Just About Everything (2014) and The Luck of Politics (2015). Andrew is a keen marathon runner, and hosts a podcast titled "The Good Life", which is available on iTunes. Andrew is the father of three sons - Sebastian, Theodore and Zachary, and lives with his wife Gweneth in Canberra. He has been a member of the Australian Labor Party since 1991.
ELISABETTA MAGNANI Lisa Magnani is Professor of Economics at Macquarie University. She has received a PhD in Economics from Yale University, where she was an Arthur Okun Prize recipient, and a Doctorate in Political Economy
from the University of Bologna (Italy). Lisa has held visiting positions at University of Rome, Johns Hopkins University Bologna Centre and University of Western Australia. Lisa is an Associate Investigator in the Centre of Excellence for Population Ageing Research at UNSW and an Associate Investigator in the Centre for Workforce Futures at Macquarie University.
Since her doctoral studies she has conducted research in the structural transformation of labour markets in OECD countries and its effect on societal outcomes. Her publications and international media engagement are testimony of Lisa's commitment to contribute to a broad debate on issues of global interests such as the ecological challenge, the impact of inequality on societal resilience, and the interface between financial and societal development.
The Advisory PanelThe McKell Institute would like to thank the following group of esteemed people for their valuable feedback and contributions in the creation of the Wages Index.
7
THEMcKellInstitute
Mapping Opportunity: A National Index on Wages and Income
RICHARD HOLDEN Richard is a Professor of Economics at UNSW Business School and an Australian Research Council Future Fellow. Prior to that he was on the faculty at the University of Chicago and the Massachusetts Institute of
Technology. He received a PhD from Harvard University in 2006, where he was a Frank Knox Scholar. Professor Holden has published in top general interest journals such as the American Economic Review and the Quarterly Journal of Economics, as well as in leading law journals such as the University of Chicago Law Review, and top political science journals such as the Journal of Politics.
He is currently editor of the Journal of Law and Economics, and is the founding director of the Herbert Smith Freehills Initiative on Law & Economics at UNSW. He has been a Visiting Professor of Economics at Harvard University and the MIT Department of Economics, and Visiting Professor of Law at the University of Chicago Law School. His research has been featured in press articles in such outlets as: the New York Times, the Financial Times, the New Republic, and the Daily Kos. He writes regularly for the Australian Financial Review and The Conversation .
He is also co-lead of the UNSW Grand Challenge on Inequality.
COLM HARMON Colm Harmon is Professor of Economics at University of Sydney, where he is also Head of the School of Economics. He received his BA and MA in Economics from University College Dublin (UCD), and his PhD
from the University of Keele in 1997. He has held visiting appointments at Princeton University, University College London, Australian National University, University of Chicago, and the University of Warwick. Working primarily in the economics of education, he has, together with colleagues, published papers in the American Economic Review, Economic Journal, Economica, European Economic Review, Fiscal Studies, Journal of the European Economic Association, Journal of the Royal Statistical Society, Health Economics and Labour Economics amongst others, and has made a number of policy and media contributions locally and internationally. He is a co-editor of Economics of Education Review.
8
T H E M C K E L L I N S T I T U T E
FAZEEL JALEEL Fazeel Jaleel is a Lecturer in the Department of Economics at Macquarie University. He received a PhD in Economics, from Macquarie University where he has been a faculty member since 2008. He has also completed a
Masters degree in Finance, a Postgraduate Diploma in Economic Development and has an Undergraduate degree in Economics and Statistics. Fazeel’s research interests lie in the areas of Applied Econometrics, Time series Econometrics, Applied Statistics, and Finance. He has published papers in international journals and presented papers at conferences, both locally and internationally.
PETER WHITEFORD Peter Whiteford is a Professor in the Crawford School of Public Policy at The Australian National University, Canberra. He is the Director of the Policy and Governance Teaching Programme, Director of the Social Policy Institute and a Fellow
of the Tax and Transfer Policy Institute in the Crawford School. He has previously worked at the OECD, and at the University of NSW and the University of York in the United Kingdom, as well as for the Australian public service. He is the author of more than 100 articles in refereed journals, book chapters or monographs on the Australian system of income support, international comparisons of social security policies, and on inequality and redistribution.
The Advisory Panel CONTINUED
9
THEMcKellInstitute
Mapping Opportunity: A National Index on Wages and Income
MELISSA WONG Dr Melissa Wong is a Research Fellow at the Social Policy Research Centre, University of New South Wales. She is an economist and social policy researcher whose main research interests include the measurements of
poverty and income inequality, multi-dimensional indicators of wellbeing and more recently, in the transition of young people from schooling to work. She has undertaken a wide range of projects funded by the Australian Research Council and commissioned by government and non-government organisations. These projects have explored issues concerning living standards of children and older people across countries, measuring national rates of poverty in Australia and material deprivation and social exclusion among adults and young people. Dr Wong was a member of the cost of living reference panel for Council of Social Service of New South Wales, rapporteur for the Economic and Social Research Council in the UK and a consultant for UNICEF advising on construction of indicators of wellbeing for children and women in Malaysia. She was a visiting fellow at the Centre of Methods and Policy Application in the Social Sciences, University of Auckland and at the School of Education, University of Leeds.
In 2015, Dr Wong was awarded a fellowship by the Japanese Institute of Labour Policy and Training in Tokyo to carry out a comparative study of youth unemployment in Australia and Japan.
PETER DAVIDSONPeter is Senior Advisor with the Australian Council of Social Service, specialising in employment, social security, superannuation and tax policies, income distribution and poverty. In his work for ACOSS over 20
years he has analysed and influenced Australian Government policies in these areas.
He has contributed to the development of policies including reform of working-age social security payments, youth allowances, job-seeker accounts for unemployed people, proposals to strengthen the personal income tax base and provide State Governments with a robust revenue base to fund community services. He has numerous publications across these policy areas.
Peter has served on various government advisory bodies including the Tax Reform Forum, Climate Change Household Assistance Working Group, the Community Tax Forum, superannuation policy advisory bodies, ABS CPI Review advisory group, Employment Services Industry Reference Group, Centrelink Service Delivery Policy Advisory Group, the Disability Support Pension Advisory Group, the Tax Research Foundation advisory group, and reference groups for numerous research projects on poverty and inequality.
He is completing a PhD at Social Policy Research Centre UNSW.
10
T H E M C K E L L I N S T I T U T E
11
Mapping Opportunity: A National Index on Wages and Income
It is crucial that measures are taken to improve the access to fair earnings across the nation and create a workforce that is suitable to meet the demands of a changing, globalised, world.
This report introduces the second of McKell’s opportunity indexes: The McKell Institute Index for Earnings, which maps the most advantaged and disadvantaged electorates nationally in terms of their access to wages. It explains the growing inequality in incomes across the top percentiles and the low-income earners, and the low mobility in income through generations.
It delves into the factors which affect an individual’s access to fair wages and the inherent opportunities available in an electorate for social mobility.
The access to wages is a vital component of income and the cornerstone of a sustainable livelihood. The inability to access wages leads to adverse effects on families, children and key lifestyle indicators like affordable housing, education, health and transport.
Today, Australians on low or middle incomes are finding it increasingly hard to sustain their livelihoods and the economic achievements of the nation’s past are inadequate to overcome the difficulties that are faced by the middle class today.
This report aims to add a deeper level of research to key policy reform and is aimed at strengthening opportunity for everyday Australians and increasing social mobility across generations in order to enable the economy to grow in a manner that benefits all.
The Hon John WatkinsCHAIR, MCKELL INSTITUTE
Sam CrosbyEXECUTIVE DIRECTOR, MCKELL INSTITUTE
One of Australia’s most significant achievements has been its strong and prospering economy with a growing middle class and the equal access to opportunity by all individuals. Today, this mainstay of the nation is being challenged and the increasing pressures on the daily lives of Australians are mounting, as wages stagnate and the gap in income widens.
Foreword
THEMcKellInstitute
12
T H E M C K E L L I N S T I T U T E
Access to wages in Australia has been facing a relative decline in the past few years which has led to growing income inequality across the states. It is widely accepted that the opportunity to earn wages is a key determinant of social mobility and therefore, the obstacles facing individuals in earning fair wages and income is something that must be addressed. With a growing middle class being one of the flagship signs of a prosperous economy, the declining middlle class with the few at the top becoming richer and the poor getting poorer is an alarming indicator of Australia’s increasing inequality and a threat to the ‘fair go’ ethos that this nation has embraced for decades. Real wage growth is facing stagnation and the opportunities for earnings are gradually diminishing.
Over the past few years, across electorate divisions, the vast disparities in access to earnings has led to negative social outcomes and declining economic indicators and has had costly effects on the Australian economy. It is said that if only 10 per cent of people
win when the economy does well, only ten per cent of people will care if the economy does well.2 Rising inequality is a threat to any economy’s growth and sustainability as stated by key economic institutions like the IMF and World Bank.3
In looking at income inequality in Australia and mapping out the access to wages across electorates, a variety of determinants can be identified that influence the access to earnings for individuals. These different factors are explored in detail in this report and the inequalities that stem from the access to these resources will be fed into a model that will seek to display the disparity in wages and access to earnings across federal electorates in Australia.
Part one of this report talks about the state of wages and income inequality in Australia today. It identifies common measures and indicators of income inequality and compares Australia with other advanced nations in the OECD. Part two identifies the challenges facing Australia’s access to earnings for the
Executive SummaryAt the heart of Australia’s society and economy is the idea of the ‘fair go’: the notion that, if we work hard enough, we will be able to get ahead no matter our gender, ethnicity, or our post code. But in recent years, the fair go has been under threat, particularly as wage and income inequality has widened, leaving more Australians behind.1
THEMcKellInstitute
13
Mapping Opportunity: A National Index on Wages and IncomeTHEMcKellInstitute
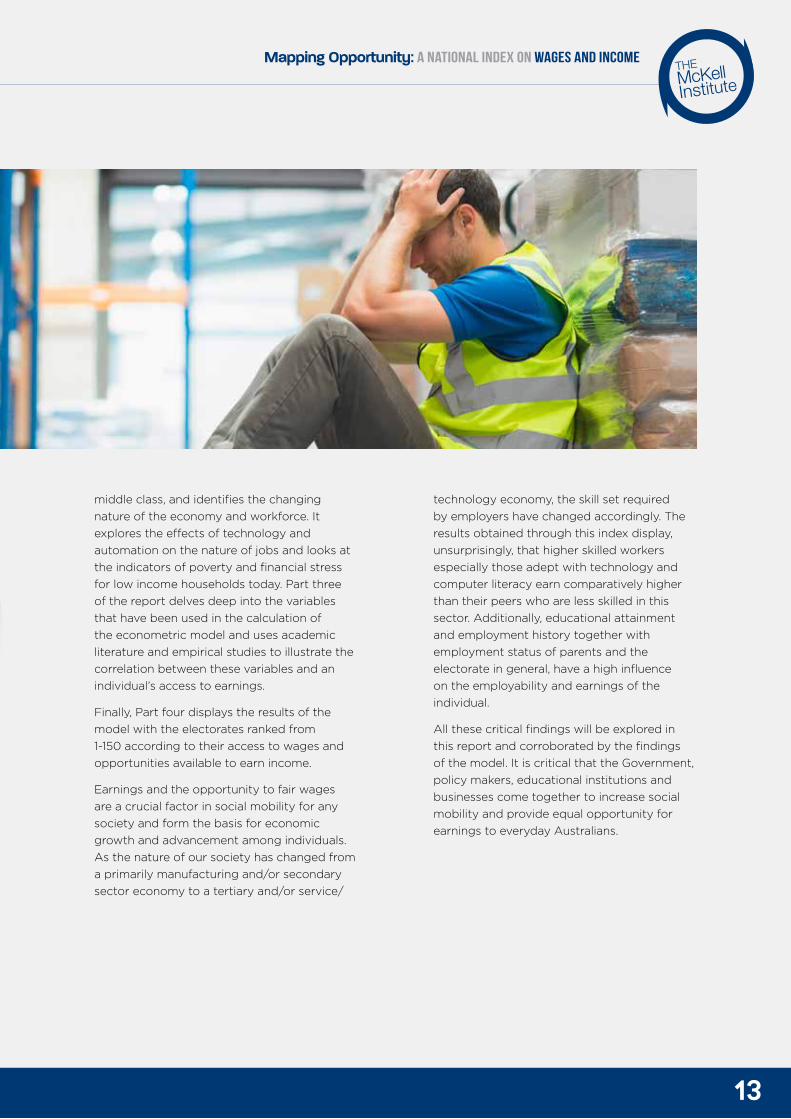
middle class, and identifies the changing nature of the economy and workforce. It explores the effects of technology and automation on the nature of jobs and looks at the indicators of poverty and financial stress for low income households today. Part three of the report delves deep into the variables that have been used in the calculation of the econometric model and uses academic literature and empirical studies to illustrate the correlation between these variables and an individual’s access to earnings.
Finally, Part four displays the results of the model with the electorates ranked from 1-150 according to their access to wages and opportunities available to earn income.
Earnings and the opportunity to fair wages are a crucial factor in social mobility for any society and form the basis for economic growth and advancement among individuals. As the nature of our society has changed from a primarily manufacturing and/or secondary sector economy to a tertiary and/or service/
technology economy, the skill set required by employers have changed accordingly. The results obtained through this index display, unsurprisingly, that higher skilled workers especially those adept with technology and computer literacy earn comparatively higher than their peers who are less skilled in this sector. Additionally, educational attainment and employment history together with employment status of parents and the electorate in general, have a high influence on the employability and earnings of the individual.
All these critical findings will be explored in this report and corroborated by the findings of the model. It is critical that the Government, policy makers, educational institutions and businesses come together to increase social mobility and provide equal opportunity for earnings to everyday Australians.

THEMcKellInstitute
14
T H E M C K E L L I N S T I T U T E
15
THEMcKellInstitute
Mapping Opportunity: A National Index on Wages and Income
THEMcKellInstitute
Introduction
It will map the federal electorates that are the most advantaged and disadvantaged in their opportunity to earn fair wages and more broadly, income. It will explore the reasons behind these inherent advantages and disadvantages and provide suggestions on how these barriers to fair earnings can be overcome.
Wage growth in Australia has been slow in recent years and has led to a weakened economy and increased income inequality. This index will offer statistical modelling to corroborate the findings and rank the federal electorates in order of opportunity to earn wages, based on an econometric model. Additionally, it will seek to offer avenues for improvement that could be taken up by local councils and the government in order to aid in increasing the access to wages across the nation and bridging the income inequality gap.
The OECD defines the poverty line as ‘50 per cent of median disposable income’ which according to a report by ACOSS in 2014, was $426.30 a week for single adults in Australia and for a couple with two children, $895.22 a week.4 In Australia, this report identifies that after housing costs were accounted for, 2.99 million people were living below the poverty line which included 731,300 children under the age of 15. This is an alarming statistic for a developed, advanced nation and is something that must be addressed by policy makers and local councils in their annual budgets and community development programs for low income households in disadvantaged electorates.
This index aims to be a tool which will aid in focusing attention on electorates that are in desperate need of increased opportunities and will seek to highlight electorates that have higher access to earnings and therefore can be used as a reference for less successful electorates.
This report introduces the second publication of McKell’s Opportunity Index Series: The McKell Institute Index for Access to Earnings in Australia.
16
T H E M C K E L L I N S T I T U T E
Part ONE: The state of wages and income inequality in Australia today
Income inequality is wideningIn recent years, the Australian labour market has seen a steady decline in the growth of nominal wages and thereby real wages (wages accounted for inflation), and this has led to lower living standards for workers. Additionally, income inequality among workers has also increased with the wages for workers at the top of the distribution rising disproportionately as opposed to those at the bottom of the earnings distribution.5
Income inequality can give rise to a wide range of social problems and is an impediment to the social and economic advancement of a country. In Australia, the most important source of income inequality is linked to access to earnings and wages of individuals.6 Other factors such as changes in the family structure and demographic structure of the economy have had their respective roles in income inequality but the differences in the opportunity to earn fair wages has had a significant effect on the extent of income inequality prevalent in Australia today. The income share of the richest 10 per cent and the richest 1 per cent started to rise in the late 1970s and has followed a pattern quite similar to other English speaking advanced nations. The largest portion of household income is wages and salaries and between 2009-10, close to 61 per cent of households had wages and salaries as their largest income source with government
pensions and allowances coming in second at close to 25 per cent.7 These statistics display how critical the access to fair wages is in determining household and individual income and in advancing social mobility among the working population.
After almost 25 years of sustained economic growth and prosperity, inequality in Australia is at a 75 year high.8 Close to 3 million Australians live below the poverty line with many individuals either unemployed or looking for more work – particularly younger Australians.9 Despite economic growth lifting the incomes of many people, there are still pockets of acute poverty and intrinsic disadvantage in certain communities. The Australian Bureau of Statistics (ABS) labour force data released in 2016 showed that the unemployment rate for people aged 15-24 was 12.7 per cent which was double the national average for unemployment; it also indicated that over 18 per cent of students who are not in school are unemployed.
The characteristics common among those most vulnerable to youth unemployment included early school leavers, low skilled and inexperienced, newly-arrived youth, remote locations with poor transport options and those living on urban fringes. High levels of unemployment and poverty result in increased inequality as the poor get poorer and the gap between high income earners and low income earners widens.
17
THEMcKellInstitute
Mapping Opportunity: A National Index on Wages and Income
Over the last 30 year period, there have been distinct periods in income growth and inequality trends in Australia. From early 1980 to mid 1990, Australia has experienced slow rises in real incomes (income adjusted to account for inflation) and falling trends in inequality and rising inequality simultaneously. The late 1990s was a period of upward movements in both real incomes and inequality surges. From the beginning of the 21st century leading up to the Great Recession, real disposable incomes in Australia have risen concurrently with inequality trends fluctuating.10 The most important cause of income inequality in Australia has been access to earnings. The income share of the richest 10 per cent and the richest 1 per cent started rising in the late 1970s and this has followed closely the patterns of similar English speaking countries. Despite Australia’s tax and transfer system being one of the most effective in comparison to other advanced nations, the effectiveness in reducing inequality has reduced over the years explained by transfers not keeping up with rising community incomes and a reduction in the redistributive impact of direct taxes.
The OECD index on strictness of employment protection states that the level of employment protection in Australia exceeds that of Canada, Ireland, New Zealand, the United Kingdom and the United states. It is apparent that the institutional framework in Australia serves to influence earnings inequality significantly.11
Australia’s earnings distribution is becoming more disparate
Australia’s earnings distribution has not always been as disparate as it is today. Previous research conducted among the 25 countries surveyed by the OECD states that, Australia and New Zealand and the more tightly regulated economies of Czechoslovakia and Hungary had the lowest degree of dispersion of (pre-tax) employment income in the mid 20th century.
Even decades later, the OECD reports that Australia had a less unequal distribution of earnings than most of the other comparable advanced OECD nations. This fact was accompanied with a relative high minimum wage level and an indiscriminate gap between male and female earnings. Moreover, the share of low pay in Australia was less than in many other advanced nations.
This can probably be attributed to Australia’s strict wage fixing institutions that have fought to remove unfair wage differentials. However, in the recent years, Australia’s advantage in earnings equality has been waning causing the nation to move towards the middle of the OECD rankings. As of the end of 2015, Australia ranks 20th in total income distribution among the 35 OECD countries.
18
T H E M C K E L L I N S T I T U T E
Australia’s minimum wage is declining
Since the late 1980s, Australia’s minimum wage has fallen from 65 per cent to 54 per cent of the median wage. In 1985, Australia had the highest minimum wage in the OECD in comparison to the median and 25 years later, it has shifted down to being the sixth largest.12 In 2010, the ratio of the 90th percentile in the economy in comparison to the 10th percentile for full time male and female workers was the sixteenth lowest ratio of 28 OECD countries which marked a considerable decline from being 11th in the 1990s and 13th in 2005. Between 1975 and 2010, the minimum wage rose by 10 per cent in real terms and the wages of the bottom 10 per cent rose by 14 per cent. Additionally, low pay rose dramatically in the 70s and early 80s and then fell back. It is evident that in Australia, real wage growth was much greater for those with higher incomes than middle and low income categories. This has contributed to the growing inequality in earnings. While the median income rose by 38 per cent in real terms and the mean by 50 per cent, the wages of the 90th percentile rose by 72 per cent in real terms.
Since 1975, the 90/10 ratio for full time non-
managerial employees has increased from 2:1 to 3:1 with the increase in inequality occurring more in the top half of the earnings distribution than in the bottom half. The changing demand for labour has led to a widened disparity in earnings with skilled jobs attracting higher income growth than lower skilled workers.13
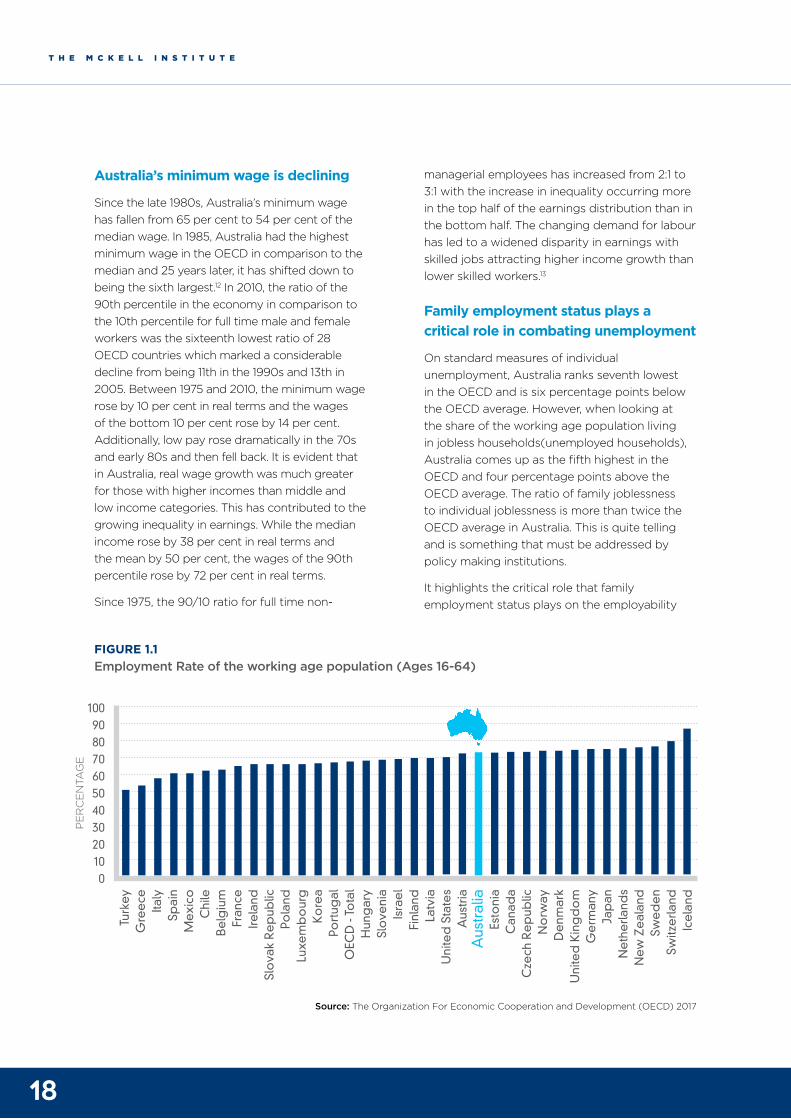
Family employment status plays a critical role in combating unemployment On standard measures of individual unemployment, Australia ranks seventh lowest in the OECD and is six percentage points below the OECD average. However, when looking at the share of the working age population living in jobless households(unemployed households), Australia comes up as the fifth highest in the OECD and four percentage points above the OECD average. The ratio of family joblessness to individual joblessness is more than twice the OECD average in Australia. This is quite telling and is something that must be addressed by policy making institutions.
It highlights the critical role that family employment status plays on the employability
Source: The Organization For Economic Cooperation and Development (OECD) 2017
FIGURE 1.1 Employment Rate of the working age population (Ages 16-64)
PE
RC
EN
TAG
E
1009080706050403020100
Turk
eyG
ree
ceIta
lySp
ain
Mex
ico
Chi
leB
elg
ium
Fran
ceIre
land
Slo
vak
Re
pub
licPo
land
Luxe
mb
our
gKo
rea
Port
ugal
OEC
D -
Tota
lH
ung
ary
Slo
veni
aIs
rae
lFi
nlan
dLa
tvia
Uni
ted
Sta
tes
Aus
tria
Aus
tral
iaEs
toni
aC
anad
aC
zech
Re
pub
licN
orw
ayD
enm
ark
Uni
ted
Kin
gd
om
Ge
rman
yJa
pan
Ne
the
rland
sN
ew Z
eal
and
Swe
de
nSw
itze
rland
Ice
land
19
THEMcKellInstitute
Mapping Opportunity: A National Index on Wages and Income
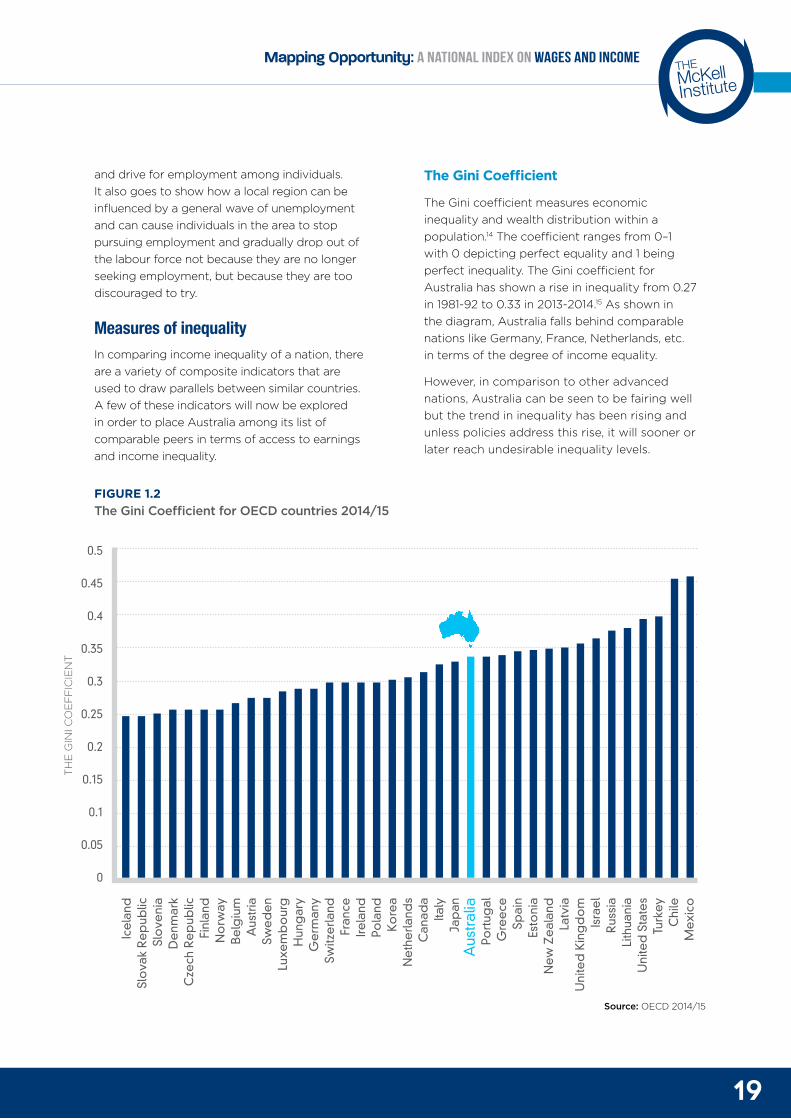
FIGURE 1.2 The Gini Coefficient for OECD countries 2014/15
Source: OECD 2014/15
THE
GIN
I CO
EFF
ICIE
NT
0.5
0.45
0.4
0.35
0.3
0.25
0.2
0.15
0.1
0.05
0
Ice
land
Slo
vak
Re
pub
licSl
ove
nia
De
nmar
kC
zech
Re
pub
licFi
nlan
dN
orw
ayB
elg
ium
Aus
tria
Swe
de
nLu
xem
bo
urg
Hun
gar
yG
erm
any
Switz
erla
ndFr
ance
Irela
ndPo
land
Kore
aN
eth
erla
nds
Can
ada
Italy
Jap
anA
ustr
alia
Port
ugal
Gre
ece
Spai
nEs
toni
aN
ew Z
eal
and
Latv
iaU
nite
d K
ing
do
mIs
rae
lR
ussi
aLi
thua
nia
Uni
ted
Sta
tes
Turk
eyC
hile
Mex
ico
and drive for employment among individuals. It also goes to show how a local region can be influenced by a general wave of unemployment and can cause individuals in the area to stop pursuing employment and gradually drop out of the labour force not because they are no longer seeking employment, but because they are too discouraged to try.
Measures of inequalityIn comparing income inequality of a nation, there are a variety of composite indicators that are used to draw parallels between similar countries. A few of these indicators will now be explored in order to place Australia among its list of comparable peers in terms of access to earnings and income inequality.
The Gini Coefficient
The Gini coefficient measures economic inequality and wealth distribution within a population.14 The coefficient ranges from 0–1 with 0 depicting perfect equality and 1 being perfect inequality. The Gini coefficient for Australia has shown a rise in inequality from 0.27 in 1981-92 to 0.33 in 2013-2014.15 As shown in the diagram, Australia falls behind comparable nations like Germany, France, Netherlands, etc. in terms of the degree of income equality.
However, in comparison to other advanced nations, Australia can be seen to be fairing well but the trend in inequality has been rising and unless policies address this rise, it will sooner or later reach undesirable inequality levels.
20
T H E M C K E L L I N S T I T U T E
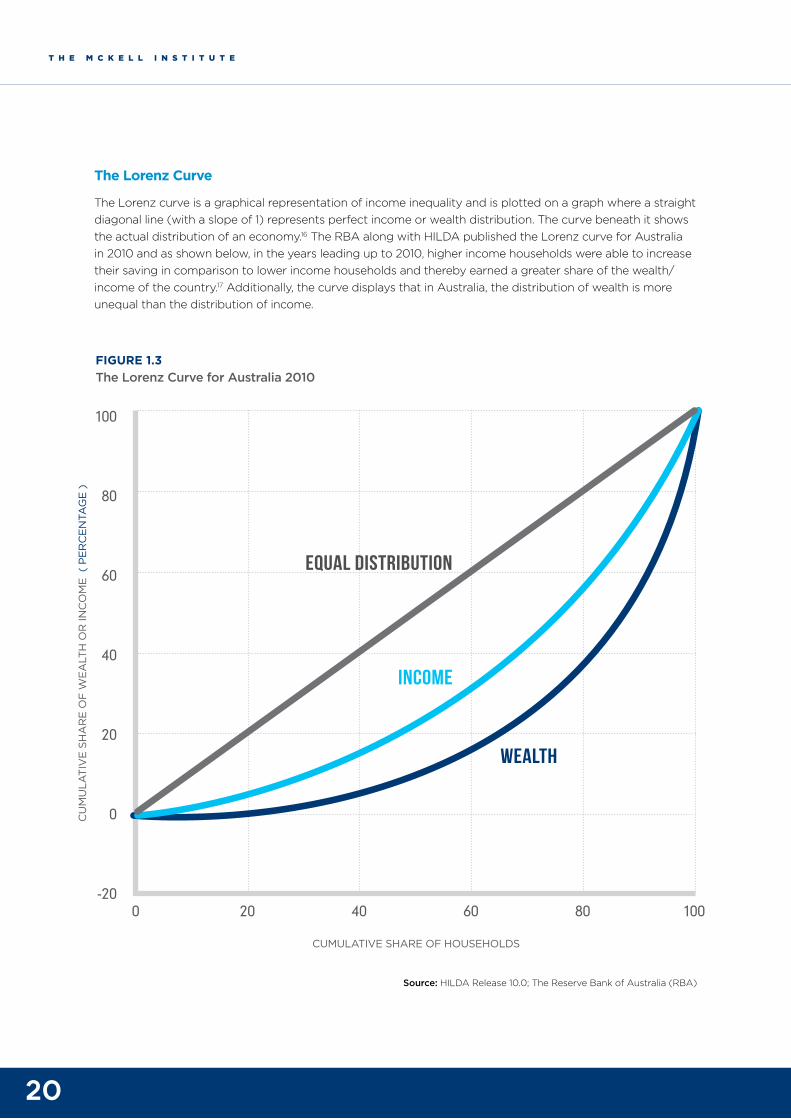
The Lorenz Curve
The Lorenz curve is a graphical representation of income inequality and is plotted on a graph where a straight diagonal line (with a slope of 1) represents perfect income or wealth distribution. The curve beneath it shows the actual distribution of an economy.16 The RBA along with HILDA published the Lorenz curve for Australia in 2010 and as shown below, in the years leading up to 2010, higher income households were able to increase their saving in comparison to lower income households and thereby earned a greater share of the wealth/income of the country.17 Additionally, the curve displays that in Australia, the distribution of wealth is more unequal than the distribution of income.
FIGURE 1.3 The Lorenz Curve for Australia 2010
Source: HILDA Release 10.0; The Reserve Bank of Australia (RBA)
CU
MU
LATI
VE
SHA
RE
OF
WEA
LTH
OR
INC
OM
E (
PER
CEN
TAG
E )
CUMULATIVE SHARE OF HOUSEHOLDS
100
80
60
40
20
0
-20
Wealth
INCOME
Equal distribution
20 40 60 80 1000
21
THEMcKellInstitute
Mapping Opportunity: A National Index on Wages and Income
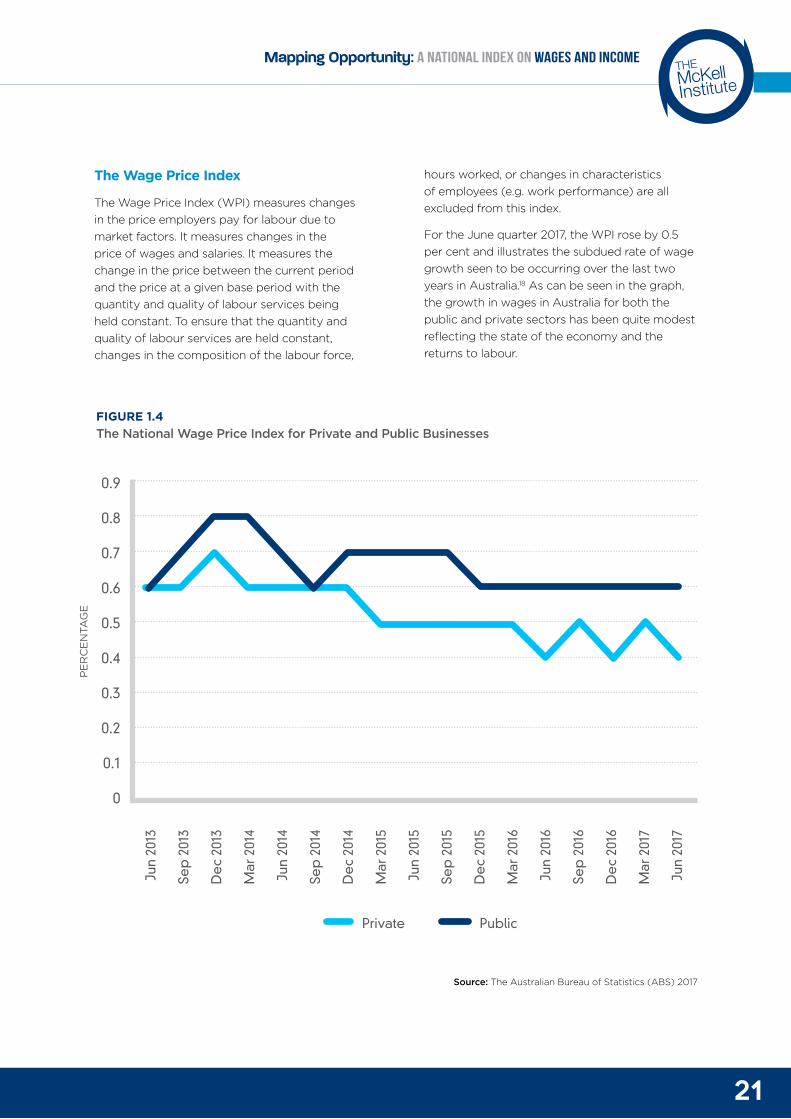
FIGURE 1.4 The National Wage Price Index for Private and Public Businesses
Source: The Australian Bureau of Statistics (ABS) 2017
The Wage Price Index
The Wage Price Index (WPI) measures changes in the price employers pay for labour due to market factors. It measures changes in the price of wages and salaries. It measures the change in the price between the current period and the price at a given base period with the quantity and quality of labour services being held constant. To ensure that the quantity and quality of labour services are held constant, changes in the composition of the labour force,
hours worked, or changes in characteristics of employees (e.g. work performance) are all excluded from this index.
For the June quarter 2017, the WPI rose by 0.5 per cent and illustrates the subdued rate of wage growth seen to be occurring over the last two years in Australia.18 As can be seen in the graph, the growth in wages in Australia for both the public and private sectors has been quite modest reflecting the state of the economy and the returns to labour.
0.9
0.8
0.7
0.6
0.5
0.4
0.3
0.2
0.1
0
Jun
2013
Sep
201
3
De
c 20
13
Mar
201
4
Jun
2014
Sep
201
4
De
c 20
14
Mar
201
5
Jun
2015
Sep
201
5
De
c 20
15
Mar
201
6
Jun
2016
Sep
201
6
De
c 20
16
Mar
201
7
Jun
2017
Private Public
PER
CEN
TAG
E
22
T H E M C K E L L I N S T I T U T E
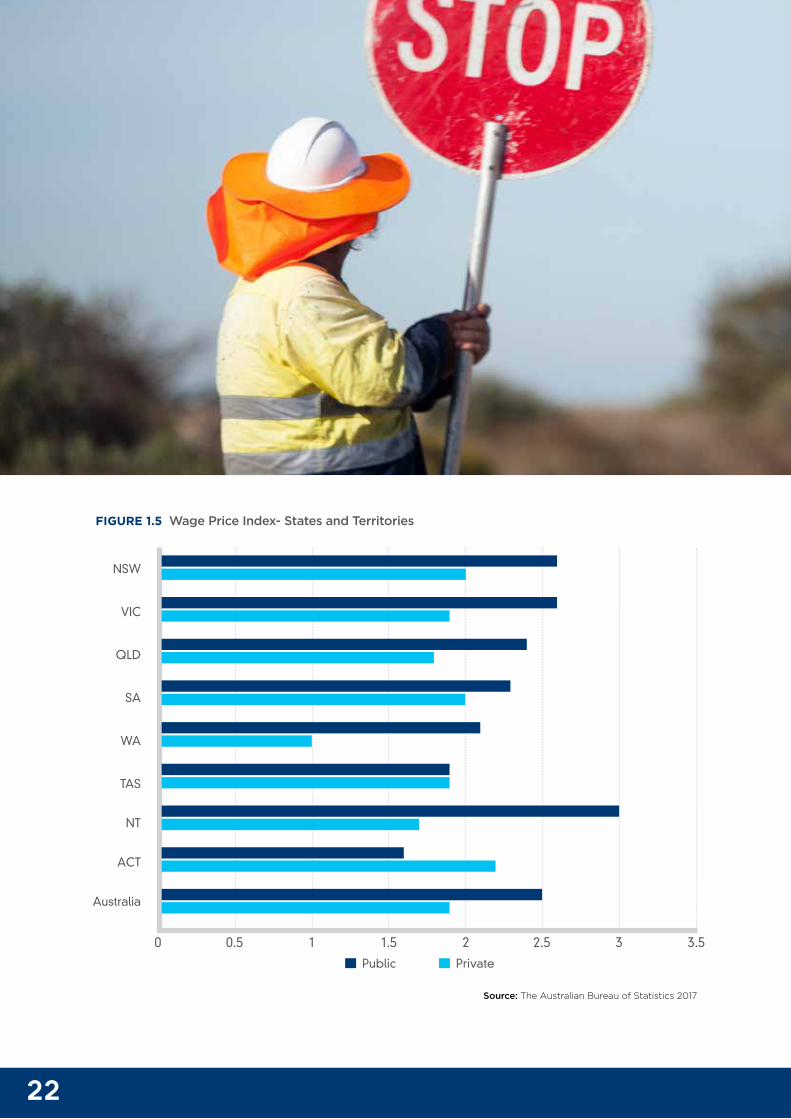
FIGURE 1.5 Wage Price Index- States and Territories
Source: The Australian Bureau of Statistics 2017
0 0.5 1 1.5 2 2.5 3 3.5
NSW
VIC
QLD
SA
WA
TAS
NT
ACT
Australia
PrivatePublic
23
THEMcKellInstitute
Mapping Opportunity: A National Index on Wages and Income
The Great Gatsby Curve
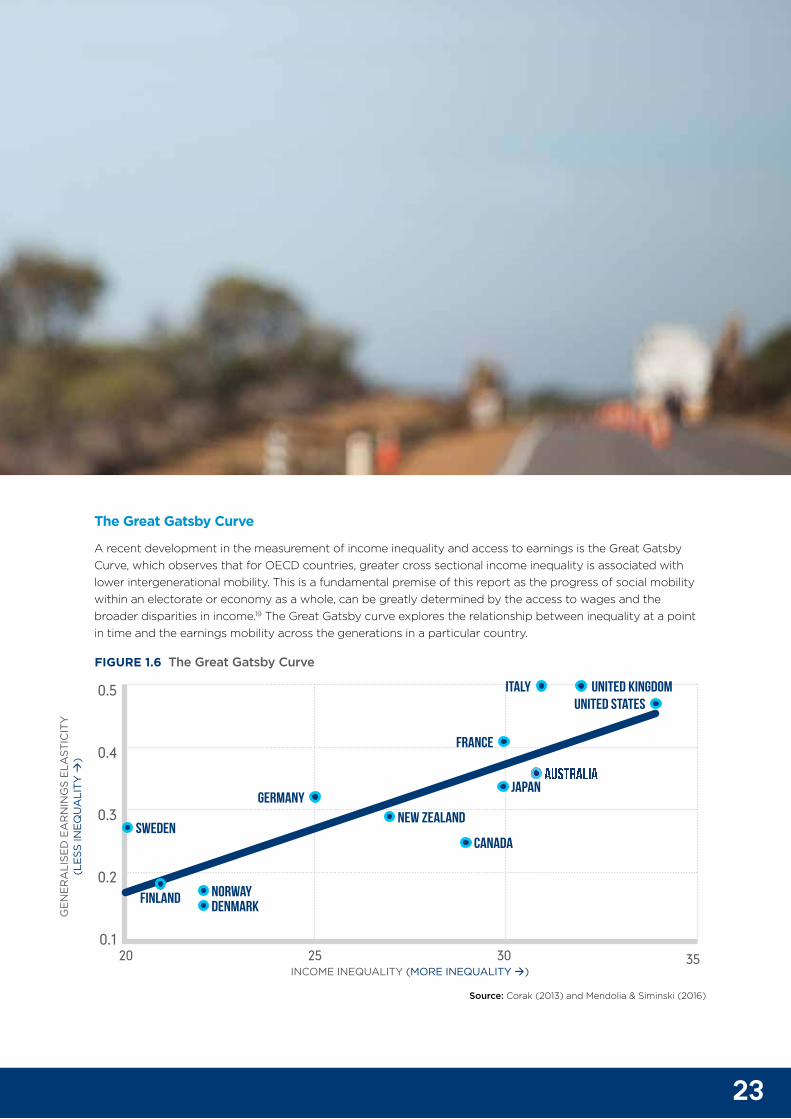
A recent development in the measurement of income inequality and access to earnings is the Great Gatsby Curve, which observes that for OECD countries, greater cross sectional income inequality is associated with lower intergenerational mobility. This is a fundamental premise of this report as the progress of social mobility within an electorate or economy as a whole, can be greatly determined by the access to wages and the broader disparities in income.19 The Great Gatsby curve explores the relationship between inequality at a point in time and the earnings mobility across the generations in a particular country.
FIGURE 1.6 The Great Gatsby Curve
Source: Corak (2013) and Mendolia & Siminski (2016)
20 25 30 35INCOME INEQUALITY (MORE INEQUALITY Æ)
GEN
ERA
LISE
D E
AR
NIN
GS
ELA
STIC
ITY
(L
ESS
INEQ
UA
LITY
Æ)
Norway Denmark
New zealand
united kingdom
canada australia
JapanGermany
france
italy United states
Sweden
Finland
0.5
0.4
0.3
0.2
0.1
24
T H E M C K E L L I N S T I T U T E
Intergenerational inequality is prevalent in Australia Countries with greater inequality of incomes also tend to be countries in which a greater fraction of economic advantage and disadvantage is passed on between parents and their children. There is evidence linking the family background and prevalence of income inequality in determining the ability of the next generation to move up the income ladder.20
The effects of income mobility and inequality are especially critical as they tend to permeate through generations and create a cycle of lower social mobility among families. Intergenerational earnings mobility has been consistently low among countries where income inequality is high such as in Italy, the United Kingdom, the United States and the Nordic countries.21
This report will aim to map those electorates which have very limited access to wages and suitable employment opportunities.
By highlighting the geographical locations in Australia in which access to fair wages is more difficult, this report aims to establish an evidence base for the implementation of public policy that aims to improve intergenerational earnings and social mobility.
The inequality of opportunity is the missing link between concepts of income inequality and social mobility and this report will seek to shed some light in this area. If higher inequality makes intergenerational mobility more difficult, it is likely because opportunities for economic advancement through the access to fair wages and well-paying jobs were unequally distributed.
This report calls for policy development and programs that will bridge the gap between the top 10 per cent and middle income groups, and between lower income groups and the bottom 20 per cent and unemployed individuals.
This report helps develop an evidence base for overcoming wage inequality in Australia
The index in this report illustrates that, while Australia is doing well in terms of income inequality and equality in opportunity among the advanced nations of the OECD, its access to earnings has declined in the past years. Accordingly, proactive policies should be pursued in order to address this emerging trend making sure that inherent disadvantages are removed from certain electorates.
Economic opportunities are partly determined by the circumstances of family background, such as parental education, occupation, marital status, region of birth etc. – over which individuals have no control. However, equality in opportunity is achieved when these factors have no role in the achievement of economic outcomes for the individual.22 The intergenerational elasticity is used to summarise the degree to which this inequality in opportunity and earnings is carried through generations. Mendolia and Siminski (2016)23 have followed on from Leigh’s (2007)24 estimates of intergenerational mobility and suggest that Australia is relatively mobile given its level of inequality.
The study found that intergenerational earnings elasticity is 0.35 which suggests that Australia’s level of mobility is consistent with its level of inequality. This estimate suggests that economic mobility is not particularly high in Australia in an international context even though it falls in the ranks of other OECD countries such as Finland, Canada and Germany.

25
THEMcKellInstitute
Mapping Opportunity: A National Index on Wages and Income
Protecting our penalty rates and policies that disrupt inequality
The report calls for improving employment outcomes among the population especially among the younger generation in order to improve their social mobility. Protecting penalty rates which have been under threat in the past year is one crucial way in making sure that people in low income brackets and students who work part time in the retail, hospitality, fast food and pharmacy sectors are not adversely affected by the cuts in their wages. Penalty rates are a source of critical income for low income households and previous research done by the McKell Institute detail the impacts in regions and urban areas due to these cuts in wages.25 It highlights the spill-over effects of these cuts to incomes especially in rural and regional areas and how this can lead to a weakened local economy.
The regression in this sector in terms of wage outcomes are yet another way of enlarging the disparity among the bottom 20 per cent and top 10 per cent of the economy. The report calls for programs and policies that will disrupt this inequality and give youth from low income households an impetus to complete their education, gain skills that are valuable, and attain successful employment.
To increase intergeneration mobility among low income neighbourhoods, community development programs and policies that invest in people; can be deployed. The building and maintenance of safe streets, infrastructure, and community centres for job seekers will help in alleviating generational cycles of poverty and social immobility and help in overcoming the inequality in access to earnings present in Australia today.

26
T H E M C K E L L I N S T I T U T E
27
THEMcKellInstitute
Mapping Opportunity: A National Index on Wages and Income
Part TWO: The Challenges facing Australia’s ‘Fair-go’The changing composition of the Australian economyThe Australian economy has undergone many changes in its structure and composition over the decades.
In 2016, several key events occurred in the Australian economy. As the last Ford rolled off the production lines in Geelong in October of that year, so ended an era in which Australia’s manufacturing sector could rely upon a robust automotive industry to maintain high employment.
However, despite the transition away from the resources investment boom, there is still a surge in resource production, and employment in these industries is quite significant.
The services sector continues to be the largest sector of the Australian economy representing close to 69 per cent of Australian GDP and in the year 2015-2016, had an output of $1,015 billion.26 It is also the largest employer, averaging at 9.4 million employees in 2015-16. The largest industry in this sector is the Financial & Insurance Services with $146.2 billion in output in 2015-16 employing 431,100 people. The largest services industry by employment was the Health Care & Social Assistance employing close to 1.5 million workers.
Across the economy, labour costs for employers are still the largest and most significant costs firms face, at 63 per cent. Wage growth has slowed in the recent years showing close to zero growth in real terms (change in wages after the effects of inflation have been removed). The high incomes associated with the mining boom have declined with jobs being created in lower wage areas like healthcare.
The Australian economy has proved to be stronger and fairer than that of most countries with sustained periods of growth and less severe income inequality than comparable advanced nations. However policies must be continuously developed to enable middle class Australians to reap the benefits of growth and maintain a robust fiscal economic policy.
28
T H E M C K E L L I N S T I T U T E
Economic disruption has the potential to expand inequality The growing importance of the tertiary sector in the Australian economy has wide ranging impacts on employment opportunities and the distribution of earnings. The distinction between the production sector and service sector has started diminishing with design of the product and after-sales services becoming increasingly important and being the source of the value addition in the product life cycle.27
The outsourcing of production by advanced countries has led to lower levels of employment, and the shift from generic manufacturing jobs to skilled service sector jobs. Such outsourcing is based on skills as much as it is based on low cost labour and therefore offers a good source of expenditure savings to high labour cost economies.
STEM Education is vital, but it is not the solution to unemployment
There is an increasing need for Australia to encourage the number of science, technology, engineering and mathematics (STEM) graduates in order to increase and sustain an economy with a high rate of digital technology immersion in firms. STEM skills are seen as essential to developing innovation and supporting economic growth. In 2014, the Office of the Chief Scientist reported that 65 per cent of Australia’s economic growth per capita could be sourced from improvements in the use of capital, labour and technology innovation made by STEM.
However, there is also a high rate of underemployment among STEM graduates, suggesting that an increase in STEM education is not a panacea to unemployment. Health care graduates have very high employment rates four months after graduating along with mining engineers and surveyors whereas employment outcomes for all other graduates in the STEM industries were below average and – often by significant margins. Moreover, even among
STEM graduates who find employment, a sizeable proportion do not identify as to be utilising their education in their respective jobs. For instance, approximately 30% of graduates in Information Technology do not attest to using the niche skills acquired during their tertiary education, in their job.28
It is evident that the Australian education system will have to create a cohort of workers with the skills and competencies required to thrive in a continuously changing environment. The most critical skill is the skill and ability to acquire new skills. The ability for life long learning coupled with literacy and numeracy skills will be one of the major ways in which we can create a workforce that meets the demands of the future Australia.
Automation brings challenges and opportunities The automation of tasks has been commonplace for centuries. It is usually the routine and mundane tasks that are subjected to automation and are usually characteristic of low and middle-skilled jobs. Many modern industries are now automated such as road toll collections, robot welders and software programs like MYOB that have replaced manual book keeping.
In contrast, technology has complemented high-skilled jobs and helped in raising productivity and the demand for suitably skilled workers. For instance, advanced manufacturing using three-dimensional printing processes needs designers and engineers that are adept with specialised computer software. Moreover, these processes necessitate a high level of design thought and creativity, different to the traditional manufacturing design processes.29
The digital and financial sector has brought with it a changed workforce resulting in ‘job polarisation’ where the share of middle-skilled jobs have been declining in comparison to high and low-skilled jobs. The offshoring of tasks especially apparent in the telecommunications and manufacturing sectors have intensified the rate of displacement among low-skilled and
29
THEMcKellInstitute
Mapping Opportunity: A National Index on Wages and Income
middle-skilled workers. However, this trend is not as significant in Australia as it is in most advanced nations as trends in job losses in Australia have moved back and forth over the past four decades.30
In the foreseeable future, there is scope for the expansion of automation to non-routine cognitive tasks31 due to the widespread availability of data and advances in technology and complex algorithms. The improvements in technology have additionally paved the way for non-routine manual tasks like that of which are used in bakeries and packaging.
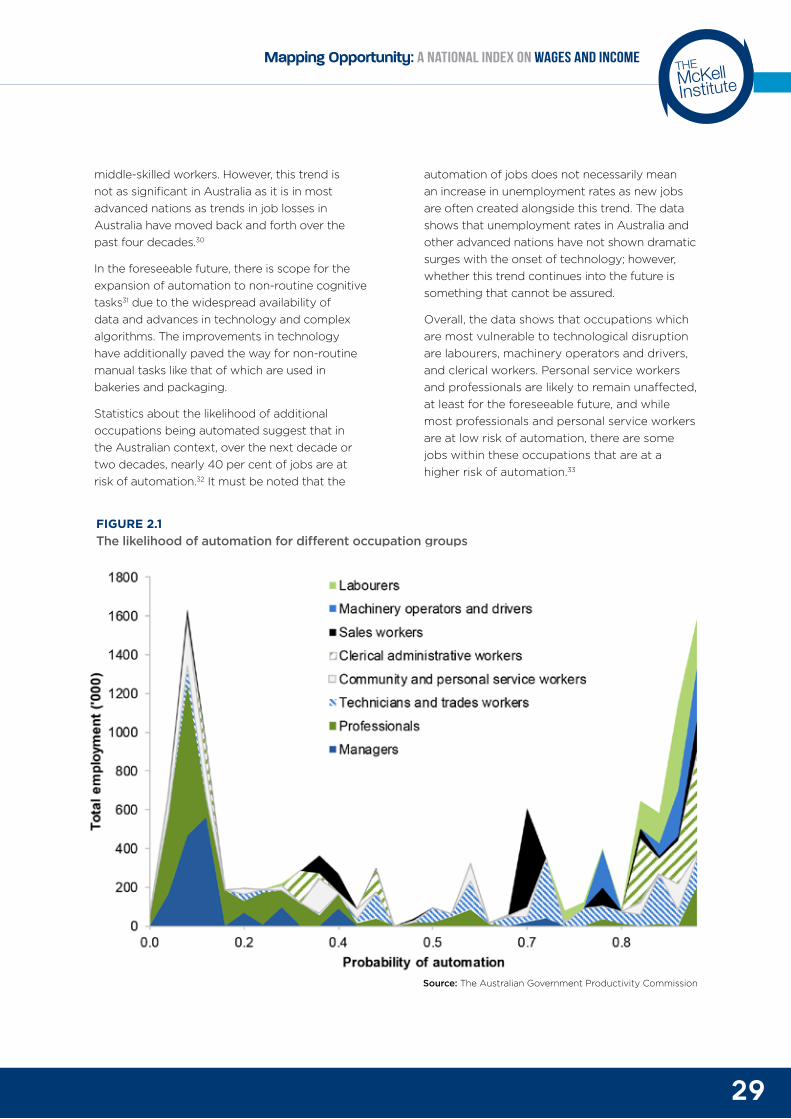
Statistics about the likelihood of additional occupations being automated suggest that in the Australian context, over the next decade or two decades, nearly 40 per cent of jobs are at risk of automation.32 It must be noted that the
automation of jobs does not necessarily mean an increase in unemployment rates as new jobs are often created alongside this trend. The data shows that unemployment rates in Australia and other advanced nations have not shown dramatic surges with the onset of technology; however, whether this trend continues into the future is something that cannot be assured.
Overall, the data shows that occupations which are most vulnerable to technological disruption are labourers, machinery operators and drivers, and clerical workers. Personal service workers and professionals are likely to remain unaffected, at least for the foreseeable future, and while most professionals and personal service workers are at low risk of automation, there are some jobs within these occupations that are at a higher risk of automation.33
FIGURE 2.1 The likelihood of automation for different occupation groups
Source: The Australian Government Productivity Commission
30
T H E M C K E L L I N S T I T U T E
The rate of today’s occupations that face the risk of automation is gradually rising
PwC, along with other studies, predict that close to 44 per cent of current jobs are at high risk of being affected by computerisation and technology with accounting clerks, bookkeepers, checkout operators and general office administration workers being most susceptible to these changes in the coming years.34
The changes in technology and the increasing penetration by the financial sector into all parts of the economy have left two groups of Australian society heavily marginalised: young people with
little experience and low skills, and older people in industries subject to major structural change who cannot adapt and learn new skills as easily. The statistics show that the increasing numbers of people on the Disability Support Pension seems to have been in part driven by long-term unemployment among some cohorts.
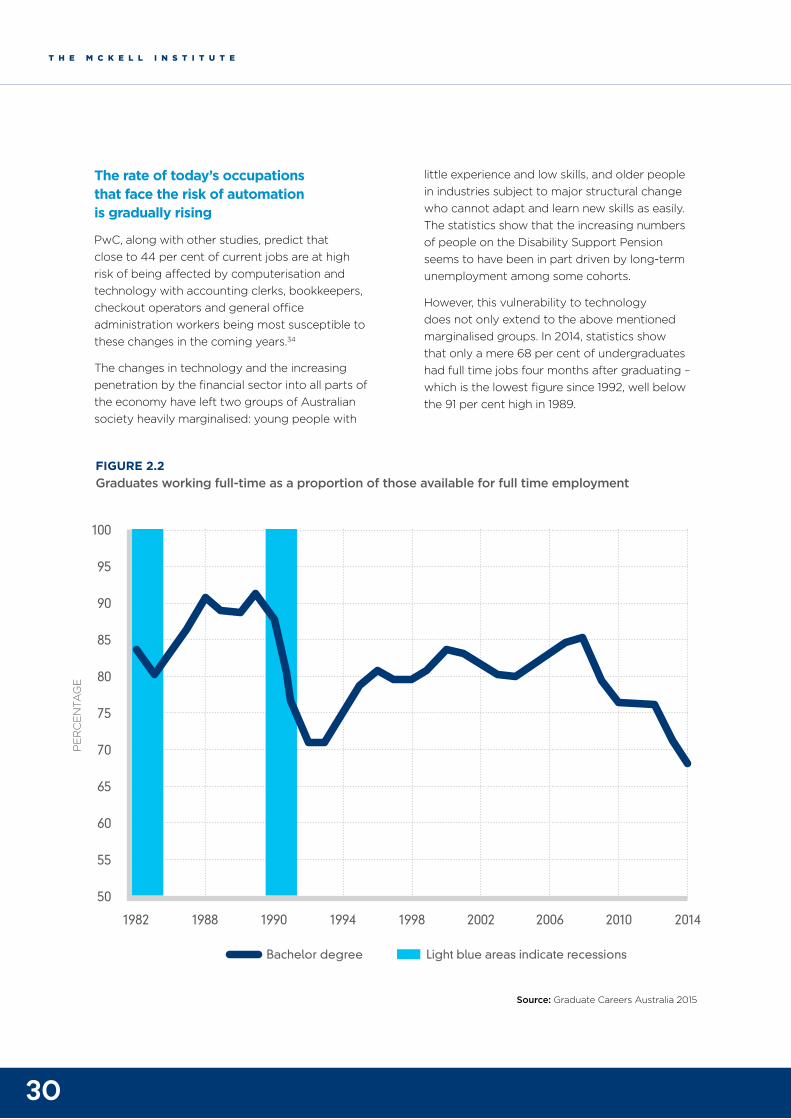
However, this vulnerability to technology does not only extend to the above mentioned marginalised groups. In 2014, statistics show that only a mere 68 per cent of undergraduates had full time jobs four months after graduating – which is the lowest figure since 1992, well below the 91 per cent high in 1989.
FIGURE 2.2 Graduates working full-time as a proportion of those available for full time employment
Source: Graduate Careers Australia 2015
1982 1988 1990 1994 1998 2002 2006 2010 2014
100
95
90
85
80
75
70
65
60
55
50
Light blue areas indicate recessionsBachelor degree
PE
RC
EN
TAG
E
31
THEMcKellInstitute
Mapping Opportunity: A National Index on Wages and Income
Some people blame this low rate of unemployment on technology. Previously, part of the costs associated with training and developing new graduates could be recouped through these employees undertaking routine and low-skill tasks. However, with the increased automation of such tasks, the incentive for employers to hire entry level workers has greatly reduced. It must be a goal of employers and the government to use technology and the financial sector in a way that improves the job prospects of graduates entering the workforce and future employees. There maybe a necessity for lawmakers to rethink degrees and associate degrees so that they are more vocationally focused and help students with employment prospects. TAFE and Vocational Education Training centres could be promoted more intensely in order to improve the access to earnings among these individuals.
Automation is increasing wage flexibility and paving the way for the ‘gig economy’
There is another aspect to the debate on the impact of technology on the workforce; it increases wage flexibility, especially, downwards for higher skilled jobs and therefore, may actually gradually improve job prospects over time.
The rise of platform websites (Uber, Freelancer, Airtasker) and the increasing use of mobile connectivity has extended the ability of businesses to breakdown jobs into components and create a ‘gig economy’; hiring labour on demand. The use of technology has enabled accurate matching and scaling of resources to exactly meet the needs of the business. Workers are employed on demand for particular tasks and this gig economy is changing the landscape of employment and the employer-employee relationship. Despite there being a proliferation in the number of gig economy platforms, they are still only a relatively small source of employment as most people gaining employment in this areana, do so through independent contractors. While this labour on demand economy provides flexibility for certain cohorts of workers, it has an element of instability and insecurity of employment and income. However, this benefit
of technology must be exploited to fulfil its potential in providing employment and creating a more flexible and agile workforce that changes according to the fluctuating demands of the economy.
Impediments to employment can be overcome with technology
Of the 1.6 million Australians who are unemployed or under-employed, close to 800,00 reported that they are impeded by ill-health or disability, unsuitable hours or location, or considered too old; among other reasons.35 Technology can aid in this arena by facilitating employment for people with disabilities to help them work effectively where disability has previously prevented them from being a part of the workforce.
Additionally, research shows that there are positive associations between internet use and earnings growth; indicating that some skills associated with internet use are inherently rewarded by the labour market.36 This is also important for the consequences it may have on disadvantaged minority groups who have no access to digital technology or the Internet, which as our model shows, is quite a significant number.
Research conducted in the USA concludes that citizens who have mastered and have access to the ‘tools of the new digital technology’ have ‘benefitted in the form of improved employment possibilities and a higher standard of life’ whereas those without access to and mastery of the technology are ‘increasingly constrained to marginal employment and a standard of living near the poverty level’.
The digital divide is a cause for great concern if individuals are disadvantaged in their pursuit of good jobs and adequate incomes due to the lack of access to technology. This is why the modelling in this report included Australia’s National Broadband Network or lack of access to internet as a critical variable in the ability to earn by individuals in different suburbs. In today’s increasingly inter-connected world, those who don’t keep up, will be left behind.
32
T H E M C K E L L I N S T I T U T E
Many of today’s occupations won’t exist in the future
Modelling suggests that a significant portion of Australian jobs that exist today will no longer exist by the next two decades. Technological change will mean that close to 5 million Australian jobs – 40 per cent of the workforce will face the high likelihood of being replaced by computers in the next 10-15 years.37 The report goes on to say that the health sector will see changes in its workforce composition, following suit sectors like mining and agriculture that have now increasingly become automated. Economic progress and technological progress has frequently created losers but have also led to the creation of demand through higher incomes and lower prices leading to new jobs economy wide. Despite that the technological revolution is assumed to replace a significant portion of Australia’s workforce, it is equally expected to disrupt the conventional style of work, expanding competition and reducing costs to consumers. Employment that involves low social interaction, low mobility and dexterity and low levels of creativity are likely to be automated or are the most vulnerable to automation.
What an equitable society looks like and the dangers of inequality in opportunityA well-functioning labour market enables the allocation of workers to their most efficient use at a minimum social and economic cost.38 Low unemployment rates signal a growing economy with the ability to create new job opportunities.
The growth in Australia’s labour productivity exceeds most of its comparable peers in the OECD growing at an average annual rate of 1.4 per cent in the five years leading up to 2015. Skilled migration continues to be an important source of labour market growth in Australia and adds to its employment outcomes annually.
The signposts for inclusive prosperity of an economy according to a report by the Chifley Research Centre include: good jobs and wages, housing that is affordable, healthcare when needed, education targeted for the future and secure income in retirement.39 In terms of income inequality and access to earnings, it can be said that transfers from people above the median to people living below the median will reduce inequality and poverty levels and close the bi-polarization that is seen to be occurring in the Australian economy.40
Government policy must try to address the poverty trap present in certain electorates – the difficulty for those born into poverty to escape.41 The index aims to identify these electorates that have intrinsic disadvantages present and remove the obstacles that are outside the individual’s control in accessing fair wages. Even though the Australian economy has maintained sustainable growth in Gross Domestic Product (GDP) over the years, especially after the Global Financial Crisis; GDP does not adequately capture the sustainability of growth that is occurring and usually does not present an accurate picture of what is happening to ‘most citizens’ in a country. The success of an economy can only truly be assessed by the standard of living and social mobility of individuals, and therefore the access to fair earnings is critical in exploring this issue. The social capital created by the belief of citizens that they are all earning fairly and have equal opportunity can lead to a society having equal opportunity and access to resources. The decline in opportunity usually mirrors very closely, the growing inequality in a country; countries with more inequality systematically have less equality of opportunity.42
If income inequality is left unchecked and allowed to grow without necessary intervention, it can lead to the inefficient functioning of society and be a threat to the stability and sustainability of the Australian economy in the long run.
33
THEMcKellInstitute
Mapping Opportunity: A National Index on Wages and Income
Income inequality affects the least fortunate in a multitude of ways When access to wages is unfairly distributed and the percentage of money at the top is skewed, equality of opportunity is diminished and one of the most critical and significant assets of a country – its people, is not utilised and left to diminish. The empirical research from The Price of Inequality by Joseph Stiglitz illustrates the cognitive resources that the poor expend for day-to-day survival and how this compares to the better off who do not spend as much. The survey asked individuals who had just exited a grocery store for how much they had spent at the store. The less well off/poor, were able to precisely respond, in minute detail, as to what was in their shopping bags and how much money was spent whereas the higher income earners could not. The stress of not having enough money to meet critical needs in a timely manner actually leads to the impairment of the ability to make decisions that would help in bettering their situation, as the data shows. In the lower income earners, the limited stock of cognitive resources is depleted and leads to irrational decision making.
Further, research shows that a majority of people abstain from an individually beneficial but socially harmful action if they perceive that other people do so too; however, on the contrary, desirable behaviour can degrade rapidly when people are exposed to a sufficient number of transgressions due to income inequality or the inability to access wages.43 In this way, the idea that individuals are earning highly unequal wages can lead to the social breakdown of trust as mentioned before and be quite harmful to the efficient functioning of an economy. A reformation of tax rates where the top marginal tax rates can be used to provide social welfare is an initiative that can be undertaken in order to restore trust in the ‘fair-go’ – a time honoured feature of the Australian economy.
Research suggests that to a certain degree, fair inequality emerges as a result of meritocratic societies rewarding people who are skilled and work harder while unfair inequality is driven
by differences in the lottery of birth where the choices available to people are already constrained by the circumstances that they were born into. This is a rather complex topic and the two types of inequality cannot be broken down so simply, however, in Economics, the fair kind is called inequality of outcomes while the unfair type is known as inequality of opportunities.44
This index aims to shed light on the inequality of opportunities present across the electorates in Australia and identify ways as to how these inequalities can be addressed and removed so that all individuals will have fair access to earnings.
Financial stress indicators The Australian Bureau of Statistics releases a list of key indicators that most households in financial distress exhibit and these are listed below.45 This is a good description of the financial struggle that the bottom 20 per cent undergo and how this deeply correlates with access to earnings and therefore must be explored. The financial stress experiences included families being; unable to raise $2000 in a week for something important, spending more money than what was received, inability to pay utility bills on time, inability to afford registration or insurance on time, pawning or selling something, forgoing meals, inability to heat homes, seeking assistance from welfare/community organisations, seeking financial help from friends or family, inability to afford holidays, inabiltiy to afford a night out twice a month, inability to afford friends or family over for a meal once a month, inability to afford a special meal once a week, inability to afford second hand clothes most of the time and inability to undertake hobbies or other leisure activities.
Sole parent families have been recorded as suffering more from financial stress than other households with two parents. Programs especially aimed at developing the conditions of sole parent families and bringing them out of poverty will greatly improve the gap in earnings among this low income group. Reforms to early
34
T H E M C K E L L I N S T I T U T E
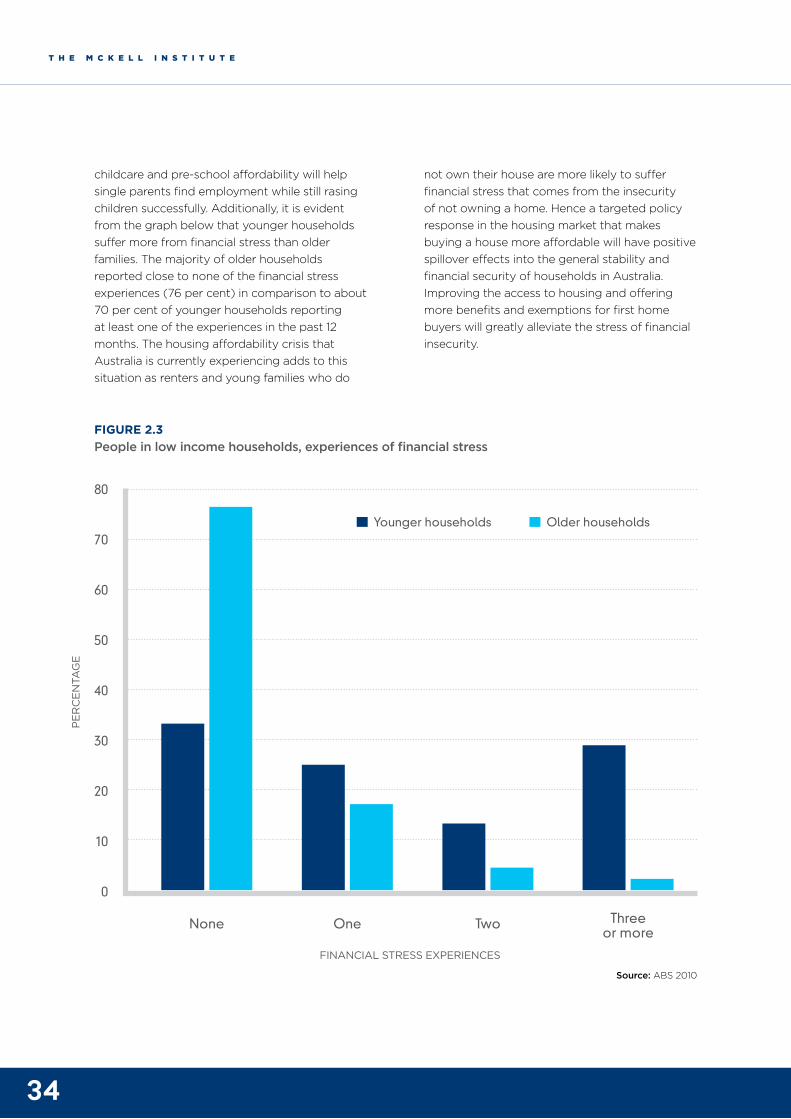
childcare and pre-school affordability will help single parents find employment while still rasing children successfully. Additionally, it is evident from the graph below that younger households suffer more from financial stress than older families. The majority of older households reported close to none of the financial stress experiences (76 per cent) in comparison to about 70 per cent of younger households reporting at least one of the experiences in the past 12 months. The housing affordability crisis that Australia is currently experiencing adds to this situation as renters and young families who do
not own their house are more likely to suffer financial stress that comes from the insecurity of not owning a home. Hence a targeted policy response in the housing market that makes buying a house more affordable will have positive spillover effects into the general stability and financial security of households in Australia. Improving the access to housing and offering more benefits and exemptions for first home buyers will greatly alleviate the stress of financial insecurity.
Source: ABS 2010
FIGURE 2.3 People in low income households, experiences of financial stress
None One Two Three or more
PER
CEN
TAG
E
80
70
60
50
40
30
20
10
0
FINANCIAL STRESS EXPERIENCES
Older householdsYounger households
35
THEMcKellInstitute
Mapping Opportunity: A National Index on Wages and Income
Intergenerational inequality is a scourge that Australia must avoid
Inequality can turn into a vicious cycle if disadvantaged youth are influenced by a combination of high inequality and low mobility and this can lead to damaging effects for the economy. It is evident in research done by the Brookings Institution in the United States that income inequality and dropout rates among high school students in low socioeconomic status areas are correlated.46 The report showed that boys with less-educated mothers are more likely to drop out of high school if they live in a state with more inequality in the bottom half of the distribution although this relationship does not occur in households with higher educated families.
The effect is that as the gap between the bottom and middle of the income distribution widens, middle class life and economic success feels increasingly out of reach to kids coming from especially disadvantaged households economically, and therefore results in a loss in motivation to stay in school and leads to high dropout rates not only from education, but more generally from life. This results in the vicious cycle with inequality and low mobility becoming self-perpetuating until a new policy comes and moves things in a new direction. Intergenerational poverty and immobility is something that the Australian economy must avoid at all cost and policies must be put in place that help in spurring disadvantaged youth out of their communities into bigger and better things.
Making education a priority and encouraging students to stay in school is a critical way in which intergenerational social immobility can be stopped. A society where teachers are valued and compensated for their efforts more, will translate into a better motivated workforce that imparts the value of education to the next generation. This report encourages reforms to the teaching sector and education field so that education is seen as a priority among students especially living in low socio-economic conditions where this value is not encouraged and developed.
36
T H E M C K E L L I N S T I T U T E
Part three: The variables that determine the Wage Index Model
The following section explains the empirical research that determined the choice of variables for the model. In total, eight variables have been selected that play an important role in the access to earnings for individuals. Each variable has then been broken down into categories and weighted in order of importance and the strength of correlation it shows to wages. These weightings and descriptions of each variable have been displayed at the end of this section.
Education
The academic literature is filled with studies of the positive correlation between the level of education and the access to earnings among individuals. The McKell Institute’s 2016 report, No Mind Left Behind, which was the first report in the Opportunity Index Series; identified the inequality in the levels of education among electorates in Australia and how this has flow on effects into other areas of the individual’s life.47 In a review of estimates of the schooling/earnings relationship by Colm Harmon et al,48 the strong evidence for the relationship between school and earnings exist with a considerable payoff from every additional year of schooling. Further studies point to the effect of maternal education on the outcome of children and find a positive relationship between maternal education and the child’s health overall.49 This has been an important relationship that has been used by policy makers to subsidise education and provide more educational opportunities for especially young mothers or mothers from low income households. There is general consensus that these policy interventions lead to multiplier effects through the positive spillovers they have over the generations resulting in educational attainment for their children and future generations as well.
37
THEMcKellInstitute
Mapping Opportunity: A National Index on Wages and Income
38
T H E M C K E L L I N S T I T U T E
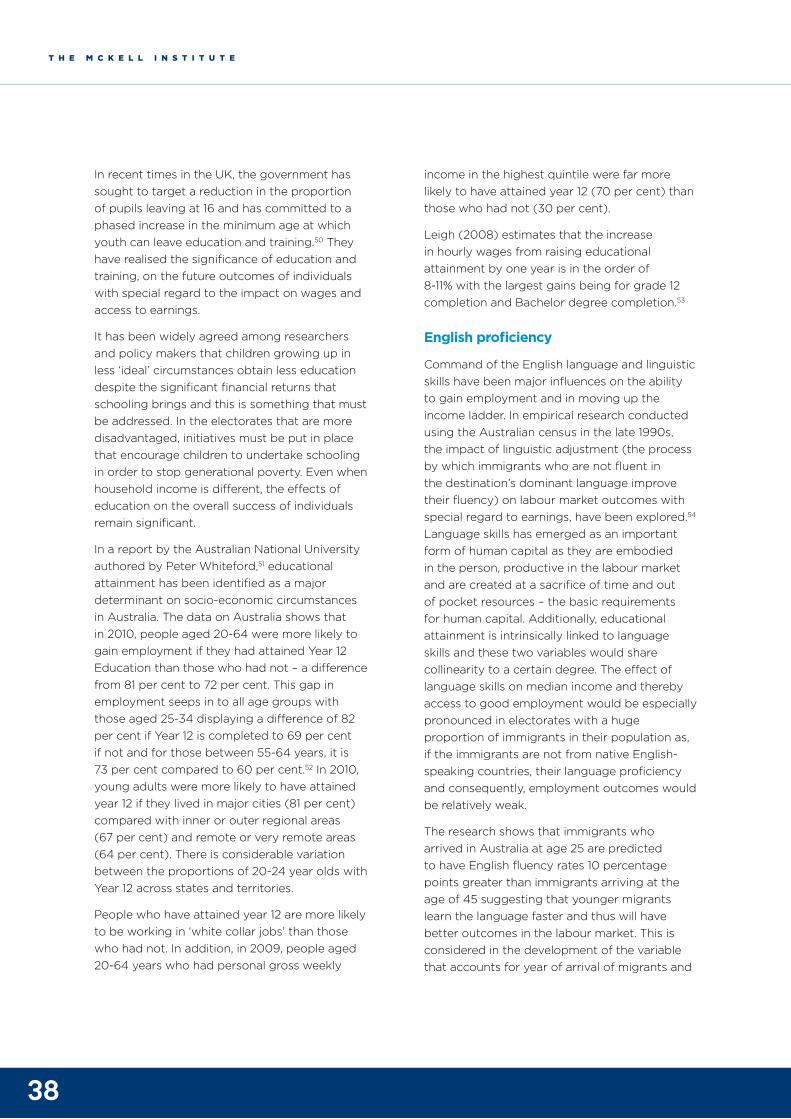
In recent times in the UK, the government has sought to target a reduction in the proportion of pupils leaving at 16 and has committed to a phased increase in the minimum age at which youth can leave education and training.50 They have realised the significance of education and training, on the future outcomes of individuals with special regard to the impact on wages and access to earnings.
It has been widely agreed among researchers and policy makers that children growing up in less ‘ideal’ circumstances obtain less education despite the significant financial returns that schooling brings and this is something that must be addressed. In the electorates that are more disadvantaged, initiatives must be put in place that encourage children to undertake schooling in order to stop generational poverty. Even when household income is different, the effects of education on the overall success of individuals remain significant.
In a report by the Australian National University authored by Peter Whiteford,51 educational attainment has been identified as a major determinant on socio-economic circumstances in Australia. The data on Australia shows that in 2010, people aged 20-64 were more likely to gain employment if they had attained Year 12 Education than those who had not – a difference from 81 per cent to 72 per cent. This gap in employment seeps in to all age groups with those aged 25-34 displaying a difference of 82 per cent if Year 12 is completed to 69 per cent if not and for those between 55-64 years, it is 73 per cent compared to 60 per cent.52 In 2010, young adults were more likely to have attained year 12 if they lived in major cities (81 per cent) compared with inner or outer regional areas (67 per cent) and remote or very remote areas (64 per cent). There is considerable variation between the proportions of 20-24 year olds with Year 12 across states and territories.
People who have attained year 12 are more likely to be working in ‘white collar jobs’ than those who had not. In addition, in 2009, people aged 20-64 years who had personal gross weekly
income in the highest quintile were far more likely to have attained year 12 (70 per cent) than those who had not (30 per cent).
Leigh (2008) estimates that the increase in hourly wages from raising educational attainment by one year is in the order of 8-11% with the largest gains being for grade 12 completion and Bachelor degree completion.53
English proficiency
Command of the English language and linguistic skills have been major influences on the ability to gain employment and in moving up the income ladder. In empirical research conducted using the Australian census in the late 1990s, the impact of linguistic adjustment (the process by which immigrants who are not fluent in the destination’s dominant language improve their fluency) on labour market outcomes with special regard to earnings, have been explored.54 Language skills has emerged as an important form of human capital as they are embodied in the person, productive in the labour market and are created at a sacrifice of time and out of pocket resources – the basic requirements for human capital. Additionally, educational attainment is intrinsically linked to language skills and these two variables would share collinearity to a certain degree. The effect of language skills on median income and thereby access to good employment would be especially pronounced in electorates with a huge proportion of immigrants in their population as, if the immigrants are not from native English-speaking countries, their language proficiency and consequently, employment outcomes would be relatively weak.
The research shows that immigrants who arrived in Australia at age 25 are predicted to have English fluency rates 10 percentage points greater than immigrants arriving at the age of 45 suggesting that younger migrants learn the language faster and thus will have better outcomes in the labour market. This is considered in the development of the variable that accounts for year of arrival of migrants and
39
THEMcKellInstitute
Mapping Opportunity: A National Index on Wages and Income
the corresponding influence on median income. Further, the data suggests that earnings rise among immigrants in Australia by about 6 per cent per year of schooling for immigrants as a whole, but the effect is larger (8 per cent) for those fluent in English and smaller (2 per cent) for those not fluent in English. Earnings vary systematically by size of suburb, with earnings being 6 per cent lower in small urban areas and about 20 per cent lower in rural areas compared to large urban areas in Australia.55
The data available for the USA shows that English proficiency helps immigrants integrate economically and raises their wages thus narrowing the employment and income gaps between migrants and US-born workers.56 It is also interesting to note that immigrants married to US natives have the opportunity to develop their language skills and thus access better jobs than immigrants choosing to live in ethnic enclaves which may lead to skills deteriorating. This is an avenue for public policy intervention in assimilating immigrants and making sure there is diversity in an electorate in order to improve overall outcomes. This is quite a challenging arena to operate in as most immigrants enjoy the familiarity brought about by living in enclaves with people of similar origin.
Skills
Skills and experience are an important determinant in the access to earnings of individuals and employees with higher skills have better opportunity to better compensating employment than low skilled workers. Most unemployed persons have low education and hence low skills and thus require a substantial increase in skills to be able to obtain and retain employment. There is research conducted on the link between parental background and the cognitive skills that children inherit based on this.57 Therefore, if skills must be targeted by policy, it requires a comprehensive response that combines other variables in order to have the best impact. Increasingly technology skills are the most remunerated asset in the marketplace and individuals who are not computer literate
are at a serious disadvantage in terms of access to good employment and income. The variable for skills in the model takes into account high skilled and low skilled workers and their varying access to earnings.
A focus on improving and developing skills that meet the demands of the economy will make low-skilled workers more employable.
Family employment
Studies point to the importance of parental education and employment on the overall atmosphere of learning, hard work and effort created in the house, and the run-on effects on their children and their access to earnings. The effect of parental education and hence employment levels have been investigated in the studies of twins and adopted children versus natural children and the results have consistently pointed significantly to the causal effect that the adoptive parents’ education has on the education and general outcomes of children.
A report by ACOSS published in 2016 showed that being unemployed has a significant impact on poverty and thereby the rate of employment in each household as recorded by the ABS in the 2016 census has been included in this model.58 It is a well accepted fact that the employment status of parents affect the overall wellbeing of the child and their access to education and thereby earnings. The interaction between families, labour markets and public policies all influence and structure the individual’s opportunities and determine the extent to which adult earnings are related to family background.59 The literature points to the increasing role played by family ‘background’ and employment outcomes in determining adult outcomes of young people.
In electorates where, as the model shows, both parents are employed full time, the outcomes for the individuals in the home and their future access to earnings will be unarguably higher in comparison to a home where only one partner is employed and the other is looking for work or where both partners are unemployed. These
40
T H E M C K E L L I N S T I T U T E
outcomes and the family circumstances children are born into, together with the quality of the neighbourhood and other latent features of the region, feed into and influence their success at school and employment later on.60 A household where both parents are employed will lead to better access and ability to pay for good schooling and jobs and the overall eventual income from working, for the child.
An important link is the correlation between employment in the household and the overall attitudes prevalent and encouraged, such as hard work, the pursuit of ambition, intelligent choices, discipline etc. which all help in raising the access to earnings that individuals have and therefore help in acquiring high levels of income. Research based on US data explores the relationship between family/household income and education outcomes and concludes that even when controlling for cognitive skills, the strength of the relationship between family income and college attendance (and hence labour market outcomes) increased significantly over the period almost doubling in impact.61
Hence it is seen that family employment in the household is linked to success in general, of the individual.
Sole parenthood
A report commissioned in the US explored the role of the family structure and identified that the income inequality levels and economic mobility across generations were heavily influenced by peoples’ decisions and attitudes towards marriage.62 It identified that in 1980, 78 per cent of families with children were headed by married parents and this statistic declined to 66 per cent by 2012. This has led to significant effects on the participation rates among men in the labour force, high school drop out rates among children and teen pregnancy rates. Although this correlation does not imply a causation, it is evident that sole parents face quite a disadvantage in the labour market and this affects their access
to earnings and the social mobility of their children. It is strongly related to economic mobility and the ability to move up the income ladder. It is seen that unmarried parent families generally lead to increased low-income families resulting in worsening income inequality trends.
Additionally, a body of research exists that identifies the high poverty rates for sole parent families which are significantly greater than two parent families with children, or simply even compared to the population as a whole. There is an argument in the Australian context that the income-tested nature of social security payments for sole parents has a created a ‘poverty trap that reinforces income support dependency once the support is received’.63 This may result in sole parents choosing to remain in a cycle of poverty and not pursing active means of earning income; however, this is a highly complex and equally nuanced debate that needs to consider other things apart from the level, availability and conditions attached to income support payments. The rates of dependency on income support among sole parents are high in Australia although the duration of income support is not unduly long; however, this coupled with the fact that it is the only form of income support for most sole parent families leads to them being on the lower end of the income distribution. An ACOSS report into inequality points to the fact that the proportion of sole parent families who fall within the bottom 20 per cent of income distribution show that they are more likely to be low income earners than high income earners.64
In electorates where the occurrence of sole parenthood is high, policies and community development programs like priority access to childcare, flexible working hours, family friendly employment, job security in low skilled jobs, skills training and other similar initiatives based on individual circumstances, can be put in place to support these people and raise them out of their cycles of poverty.
41
THEMcKellInstitute
Mapping Opportunity: A National Index on Wages and Income
42
T H E M C K E L L I N S T I T U T E
43
THEMcKellInstitute
Mapping Opportunity: A National Index on Wages and Income
Access to the internet
It is said that the internet will vastly expand access to education, good jobs and better health and open areas for a host of other sectors.65 This is already evident in Australia and computer/internet literacy has emerged as a core employer requirement during recruiting and thus was included in this model as it will undoubtedly have an impact on the access to earnings for individuals. Therefore, inequality in the access to internet will certainly lead to inequality in socioeconomic mobility especially earnings and other types of income. In Australia, with the roll out of the National Broadband Network, internet access will be widespread in the future but there are (surprisingly), quite a few households with no internet access. It is evident in research that internet use rates rise linearly with family income resulting in what is identified as the ‘Knowledge Gap’ stating that people of high socioeconomic status are always advantaged in exploiting new sources of information due to their privileged social locations.66
Additionally, having internet access allows job seekers to get on recruitment website like SEEK and professional sites like LinkedIn in order to be better accessible to their potential employers. In an increasingly ‘connected’ world, the lack of access to internet at home would seriously constrict an individual’s ability to gain employment or look for suitable and appropriate, well-paying jobs.
Research based on the earnings data of US workers found that there are positive associations between web use and earnings growth indicating that some skills and behaviours associated with Internet use are/were rewarded by the labour market.67
An early study of the ‘digital divide’ warned that consequences to American society of racial inequality in Internet access are ‘expected to be severe’ and noted that ‘the Internet may provide for equal opportunity … but only for those with access’. If minority and low income households do not have access to the internet,
the consequences could become increasingly significant. The expectation that people without Internet access are disadvantaged in their pursuit of good jobs and adequate incomes is a central basis for concern about the digital divide. Technology and the internet in particular could aid in establishing a worker’s positive face before potential and actual employers and through the use of social networks facilitated by the internet, job seekers can gain better access to a whole new market.
There are three kinds of social capital enhancements that internet users may benefit from: they can use the internet to search online job listings or post their resumes, online activities can lead workers to expand their personal social networks creating new ties that may provide informal information about job opportunities and employees with large accessible professional networks may use technology to benefit their employers.
Thus increasing the access to internet among electorates especially in rural and remote locations will vastly improve their social mobility and access to earnings.
Unemployment
The variable for unemployment is defined as the unemployment rate in each electorate. It is unanimously agreed that unemployment, by definition, vastly reduces the access to earnings and increases the gap between high income earners and low income earners.
Additionally, when there is high unemployment in an electorate, it tends to pervade into an attitude of joblessness and reduces the incentive and motivation to work among individuals. The current unemployment rate is almost 6 per cent and does not include persons unaccounted for or unemployed in hidden markets, implying that the real unemployment rate would be much higher. Research based on labour market statistics in Australia identifies that between the mid 1900s and late 1900s, unemployment rose from 6.5 per cent to 9.2 per cent.68 This has led to the currently seen dispersions in labour market
44
T H E M C K E L L I N S T I T U T E
earnings and income, and therefore the policy response must deal with the inequality present at the household and neighbourhood level.
It is seen that neighbourhoods with relatively low rates of unemployment display less cyclical sensitivity to changes in the aggregate level of unemployment and thus do not suffer as significantly when the economy undergoes a recession. A study in 1993 found that a large part of the variation in unemployment rates across electorates could be attributed to differences in the characteristics of the population like educational attainment levels.69 One explanation for differences in the probability of employment for individuals who have the same characteristics but live in different neighbourhoods might be ‘spatial mismatch’; the individuals who live longer distances from where jobs are located may be relatively disadvantaged in obtaining employment. However this argument is not agreed upon by all social scientists as there is conflicting evidence on the importance of living near a Central Business District and public transport to explain the variation in the rate of unemployment.
The decline of the manufacturing sector is one of the dominant elements in the variation of industry structure across social status. The unemployment increase in low-status areas was particularly pronounced in 1981-86. This was a result of a large loss of manufacturing jobs and those living in low-status districts were disproportionately represented in manufacturing employment. Community services increased employment of women in most regions but increased the employment of women from high status regions. The wholesale and retail sector also employed more women from high status areas.70
There are many solutions to increasing the level of employment in disadvantaged or low social status electorates; such as increasing education, offering more community developed programs, public transport improvements, affordable housing in area where jobs are abundant and successfully helping to integrate ethnic minorities and Indigenous people in these disadvantaged communities, into the local economy.
45
THEMcKellInstitute
Mapping Opportunity: A National Index on Wages and Income
Ethnicity and birthplace
There is increasing evidence that the age of arrival in Australia plays a key role in the outcomes and socio-economic status of immigrants later on in life. Data based on research in the US shows that childhood immigrants with first exposure to English after the critical period for learning has passed, attain poorer English proficiency as adults and their lower English proficiency in turn influences their socioeconomic outcomes and access to earnings.71 Therefore, in terms of policy directives, a system that favours migrating when one’s children are younger like in Canada, might tend to increase the social and economic welfare of would-be immigrants although care must be taken that the system is designed in a way that does not allow exploitation.
The variable for ethnicity and migration in the model accounts for the year of arrival and whether individuals are Indigenous/Torres strait islander origin as there is evidence that these communities are consistently discriminated against and have very low socio-economic mobility in comparison to the rest of society.
The model also accounts for the birthplace of the individual and places a positive correlation between being born in Australia/New Zealand and achieving higher access to earnings as the familiarity and opportunities that an individual is exposed to from birth will greatly influence the success of the individual.
A report commissioned by Unions NSW found that 78 per cent of businesses that were sampled in their research advertised rates of pay that were below the relevant minimum award rates.72 Based on the websites that advertised these positions, workers employed here were most likely to be young and from migrant families where English wasn’t a first language.
Hence in including the ethnicity variable and negatively correlating year of arrival in Australia with access to earnings, this relationship was taken into account in understanding the access to earnings and the significant barriers that Indigenous/Torres Strait Islander and immigrants face in accessing fair wages.
46
T H E M C K E L L I N S T I T U T E
Part Four: Published findings from the model
The rankings
The rankings displayed are a combination of the results from the constructed model. It depicts the access to earnings in each electorate and the different obstacles that individuals of the working age population face in earning wages depending on where they live. As is seen, North Sydney in New South Wales offers the highest opportunity to earn wages in Australia based on the findings from the 2016 census with Wakefield, South Australia offering the lowest rate of opportunity to earn wages. It must be noted that this index displays the advantages and disadvantages in each electorate in accessing wages and does not necessarily mean that individuals living in the disadvantaged electorates have no access to a suitable job and income.
The following table displays the results of the model where all the variables have been combined to show the electorates ranked from 1-150 in order of the ease of access to earnings.
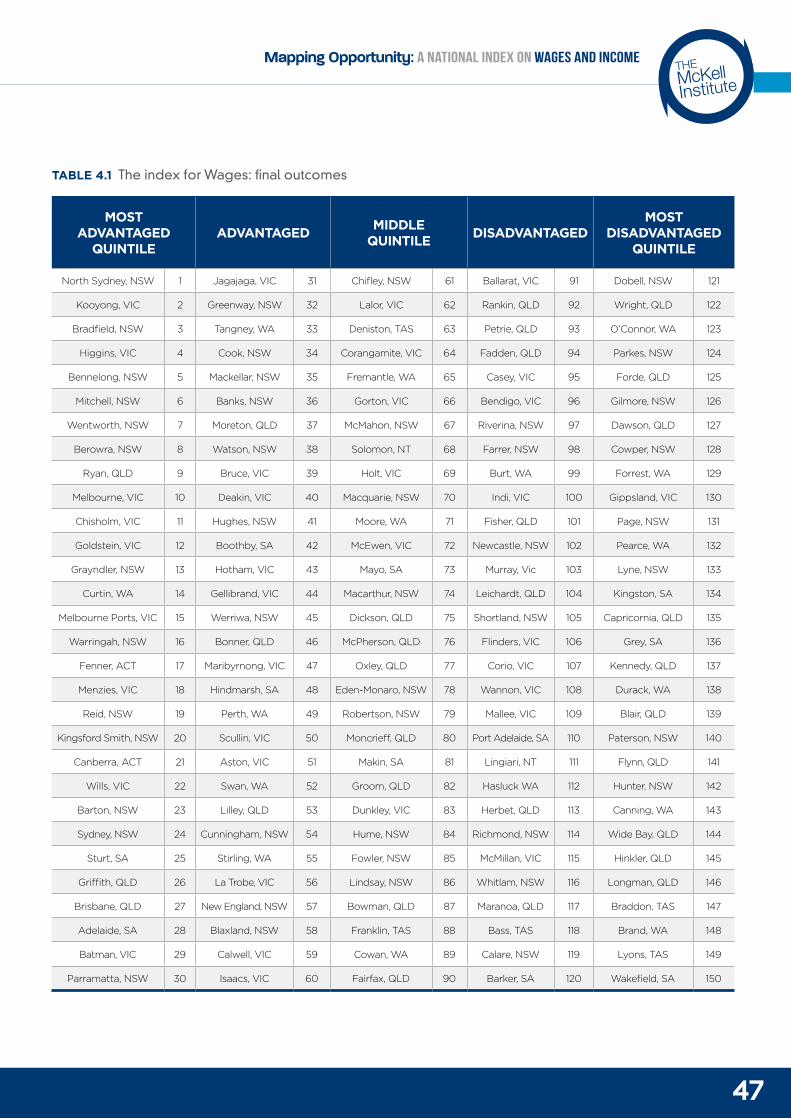
47
THEMcKellInstitute
Mapping Opportunity: A National Index on Wages and Income
Part Four: Published findings from the model
MOST ADVANTAGED
QUINTILEADVANTAGED MIDDLE
QUINTILE DISADVANTAGEDMOST
DISADVANTAGED QUINTILE
North Sydney, NSW 1 Jagajaga, VIC 31 Chifley, NSW 61 Ballarat, VIC 91 Dobell, NSW 121
Kooyong, VIC 2 Greenway, NSW 32 Lalor, VIC 62 Rankin, QLD 92 Wright, QLD 122
Bradfield, NSW 3 Tangney, WA 33 Deniston, TAS 63 Petrie, QLD 93 O’Connor, WA 123
Higgins, VIC 4 Cook, NSW 34 Corangamite, VIC 64 Fadden, QLD 94 Parkes, NSW 124
Bennelong, NSW 5 Mackellar, NSW 35 Fremantle, WA 65 Casey, VIC 95 Forde, QLD 125
Mitchell, NSW 6 Banks, NSW 36 Gorton, VIC 66 Bendigo, VIC 96 Gilmore, NSW 126
Wentworth, NSW 7 Moreton, QLD 37 McMahon, NSW 67 Riverina, NSW 97 Dawson, QLD 127
Berowra, NSW 8 Watson, NSW 38 Solomon, NT 68 Farrer, NSW 98 Cowper, NSW 128
Ryan, QLD 9 Bruce, VIC 39 Holt, VIC 69 Burt, WA 99 Forrest, WA 129
Melbourne, VIC 10 Deakin, VIC 40 Macquarie, NSW 70 Indi, VIC 100 Gippsland, VIC 130
Chisholm, VIC 11 Hughes, NSW 41 Moore, WA 71 Fisher, QLD 101 Page, NSW 131
Goldstein, VIC 12 Boothby, SA 42 McEwen, VIC 72 Newcastle, NSW 102 Pearce, WA 132
Grayndler, NSW 13 Hotham, VIC 43 Mayo, SA 73 Murray, Vic 103 Lyne, NSW 133
Curtin, WA 14 Gellibrand, VIC 44 Macarthur, NSW 74 Leichardt, QLD 104 Kingston, SA 134
Melbourne Ports, VIC 15 Werriwa, NSW 45 Dickson, QLD 75 Shortland, NSW 105 Capricornia, QLD 135
Warringah, NSW 16 Bonner, QLD 46 McPherson, QLD 76 Flinders, VIC 106 Grey, SA 136
Fenner, ACT 17 Maribyrnong, VIC 47 Oxley, QLD 77 Corio, VIC 107 Kennedy, QLD 137
Menzies, VIC 18 Hindmarsh, SA 48 Eden-Monaro, NSW 78 Wannon, VIC 108 Durack, WA 138
Reid, NSW 19 Perth, WA 49 Robertson, NSW 79 Mallee, VIC 109 Blair, QLD 139
Kingsford Smith, NSW 20 Scullin, VIC 50 Moncrieff, QLD 80 Port Adelaide, SA 110 Paterson, NSW 140
Canberra, ACT 21 Aston, VIC 51 Makin, SA 81 Lingiari, NT 111 Flynn, QLD 141
Wills, VIC 22 Swan, WA 52 Groom, QLD 82 Hasluck WA 112 Hunter, NSW 142
Barton, NSW 23 Lilley, QLD 53 Dunkley, VIC 83 Herbet, QLD 113 Canning, WA 143
Sydney, NSW 24 Cunningham, NSW 54 Hume, NSW 84 Richmond, NSW 114 Wide Bay, QLD 144
Sturt, SA 25 Stirling, WA 55 Fowler, NSW 85 McMillan, VIC 115 Hinkler, QLD 145
Griffith, QLD 26 La Trobe, VIC 56 Lindsay, NSW 86 Whitlam, NSW 116 Longman, QLD 146
Brisbane, QLD 27 New England, NSW 57 Bowman, QLD 87 Maranoa, QLD 117 Braddon, TAS 147
Adelaide, SA 28 Blaxland, NSW 58 Franklin, TAS 88 Bass, TAS 118 Brand, WA 148
Batman, VIC 29 Calwell, VIC 59 Cowan, WA 89 Calare, NSW 119 Lyons, TAS 149
Parramatta, NSW 30 Isaacs, VIC 60 Fairfax, QLD 90 Barker, SA 120 Wakefield, SA 150
TABLE 4.1 The index for Wages: final outcomes
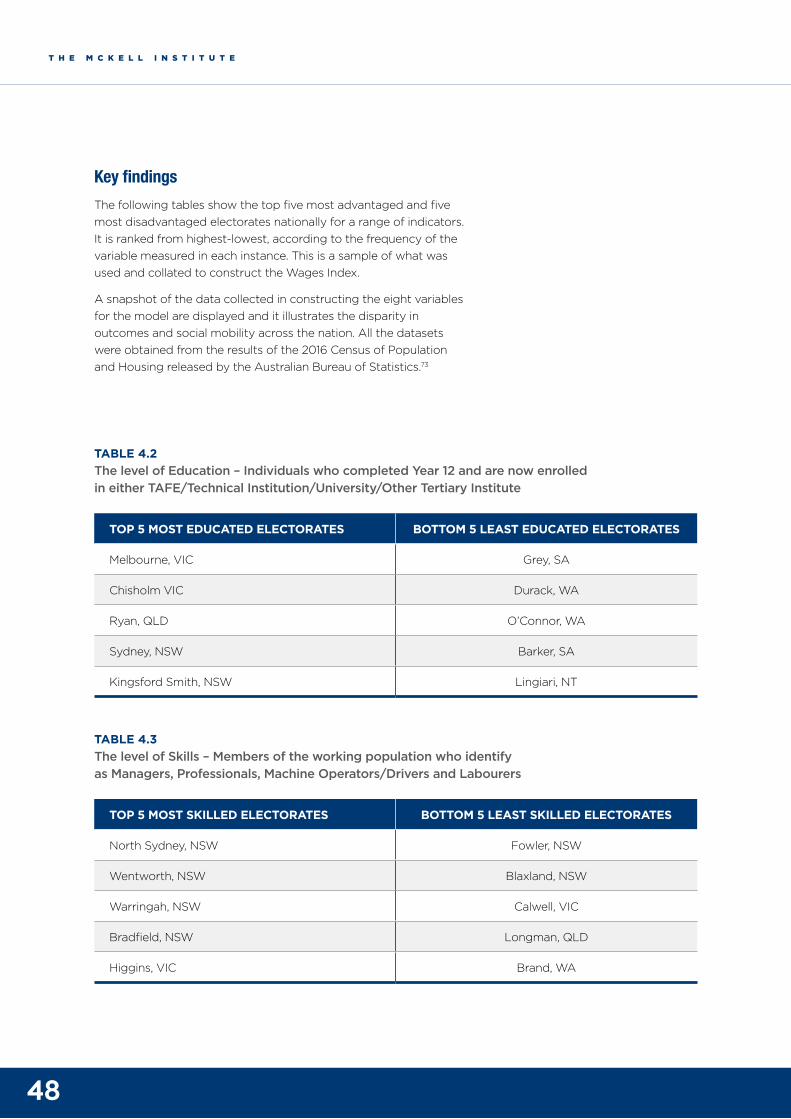
48
T H E M C K E L L I N S T I T U T E
Key findingsThe following tables show the top five most advantaged and five most disadvantaged electorates nationally for a range of indicators. It is ranked from highest-lowest, according to the frequency of the variable measured in each instance. This is a sample of what was used and collated to construct the Wages Index.
A snapshot of the data collected in constructing the eight variables for the model are displayed and it illustrates the disparity in outcomes and social mobility across the nation. All the datasets were obtained from the results of the 2016 Census of Population and Housing released by the Australian Bureau of Statistics.73
TOP 5 MOST EDUCATED ELECTORATES BOTTOM 5 LEAST EDUCATED ELECTORATES
Melbourne, VIC Grey, SA
Chisholm VIC Durack, WA
Ryan, QLD O’Connor, WA
Sydney, NSW Barker, SA
Kingsford Smith, NSW Lingiari, NT
TOP 5 MOST SKILLED ELECTORATES BOTTOM 5 LEAST SKILLED ELECTORATES
North Sydney, NSW Fowler, NSW
Wentworth, NSW Blaxland, NSW
Warringah, NSW Calwell, VIC
Bradfield, NSW Longman, QLD
Higgins, VIC Brand, WA
TABLE 4.2 The level of Education – Individuals who completed Year 12 and are now enrolled in either TAFE/Technical Institution/University/Other Tertiary Institute
TABLE 4.3 The level of Skills – Members of the working population who identify as Managers, Professionals, Machine Operators/Drivers and Labourers
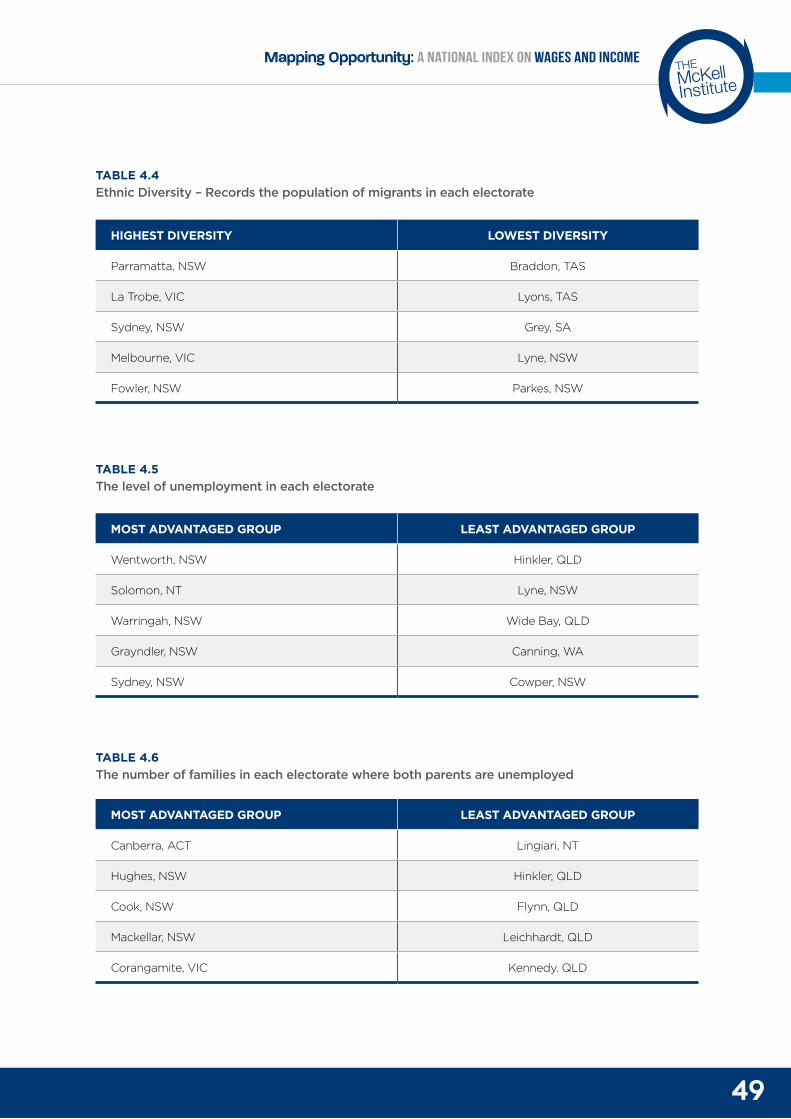
49
THEMcKellInstitute
Mapping Opportunity: A National Index on Wages and Income
MOST ADVANTAGED GROUP LEAST ADVANTAGED GROUP
Wentworth, NSW Hinkler, QLD
Solomon, NT Lyne, NSW
Warringah, NSW Wide Bay, QLD
Grayndler, NSW Canning, WA
Sydney, NSW Cowper, NSW
HIGHEST DIVERSITY LOWEST DIVERSITY
Parramatta, NSW Braddon, TAS
La Trobe, VIC Lyons, TAS
Sydney, NSW Grey, SA
Melbourne, VIC Lyne, NSW
Fowler, NSW Parkes, NSW
MOST ADVANTAGED GROUP LEAST ADVANTAGED GROUP
Canberra, ACT Lingiari, NT
Hughes, NSW Hinkler, QLD
Cook, NSW Flynn, QLD
Mackellar, NSW Leichhardt, QLD
Corangamite, VIC Kennedy. QLD
TABLE 4.5 The level of unemployment in each electorate
TABLE 4.4 Ethnic Diversity – Records the population of migrants in each electorate
TABLE 4.6 The number of families in each electorate where both parents are unemployed
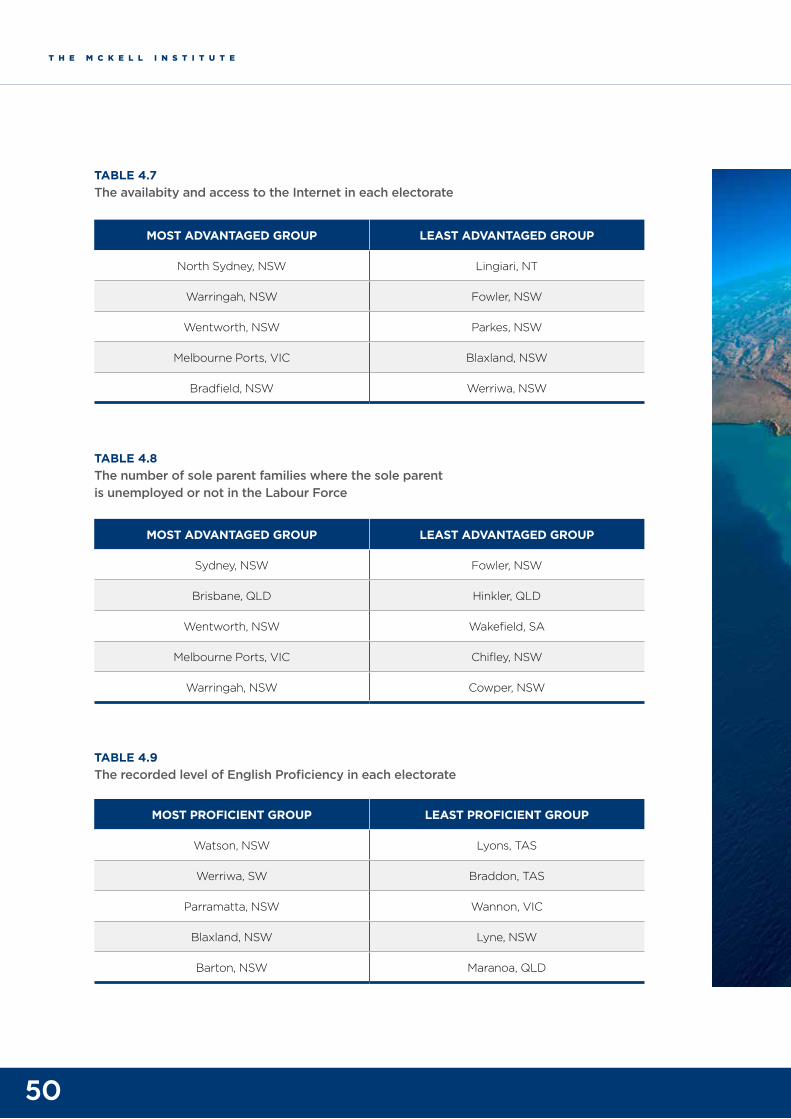
50
T H E M C K E L L I N S T I T U T E
MOST ADVANTAGED GROUP LEAST ADVANTAGED GROUP
Sydney, NSW Fowler, NSW
Brisbane, QLD Hinkler, QLD
Wentworth, NSW Wakefield, SA
Melbourne Ports, VIC Chifley, NSW
Warringah, NSW Cowper, NSW
MOST ADVANTAGED GROUP LEAST ADVANTAGED GROUP
North Sydney, NSW Lingiari, NT
Warringah, NSW Fowler, NSW
Wentworth, NSW Parkes, NSW
Melbourne Ports, VIC Blaxland, NSW
Bradfield, NSW Werriwa, NSW
MOST PROFICIENT GROUP LEAST PROFICIENT GROUP
Watson, NSW Lyons, TAS
Werriwa, SW Braddon, TAS
Parramatta, NSW Wannon, VIC
Blaxland, NSW Lyne, NSW
Barton, NSW Maranoa, QLD
TABLE 4.8 The number of sole parent families where the sole parent is unemployed or not in the Labour Force
TABLE 4.7 The availabity and access to the Internet in each electorate
TABLE 4.9 The recorded level of English Proficiency in each electorate
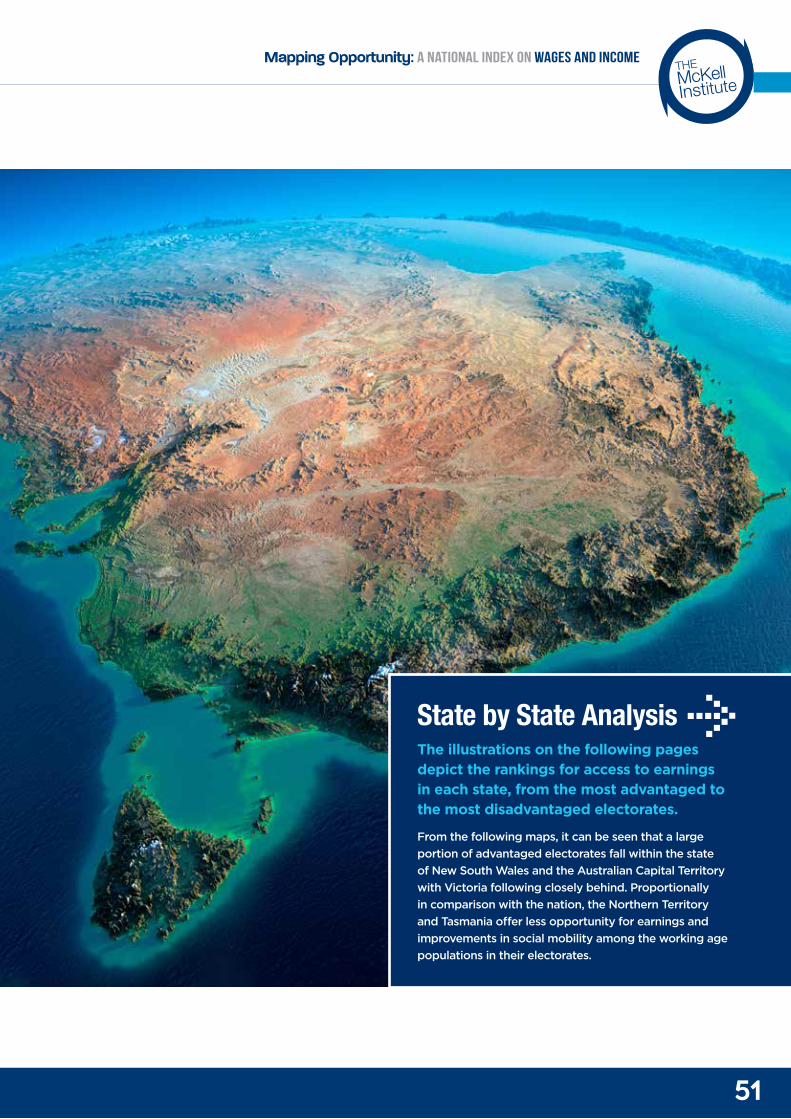
51
THEMcKellInstitute
Mapping Opportunity: A National Index on Wages and Income
State by State AnalysisThe illustrations on the following pages depict the rankings for access to earnings in each state, from the most advantaged to the most disadvantaged electorates.
From the following maps, it can be seen that a large portion of advantaged electorates fall within the state of New South Wales and the Australian Capital Territory with Victoria following closely behind. Proportionally in comparison with the nation, the Northern Territory and Tasmania offer less opportunity for earnings and improvements in social mobility among the working age populations in their electorates.
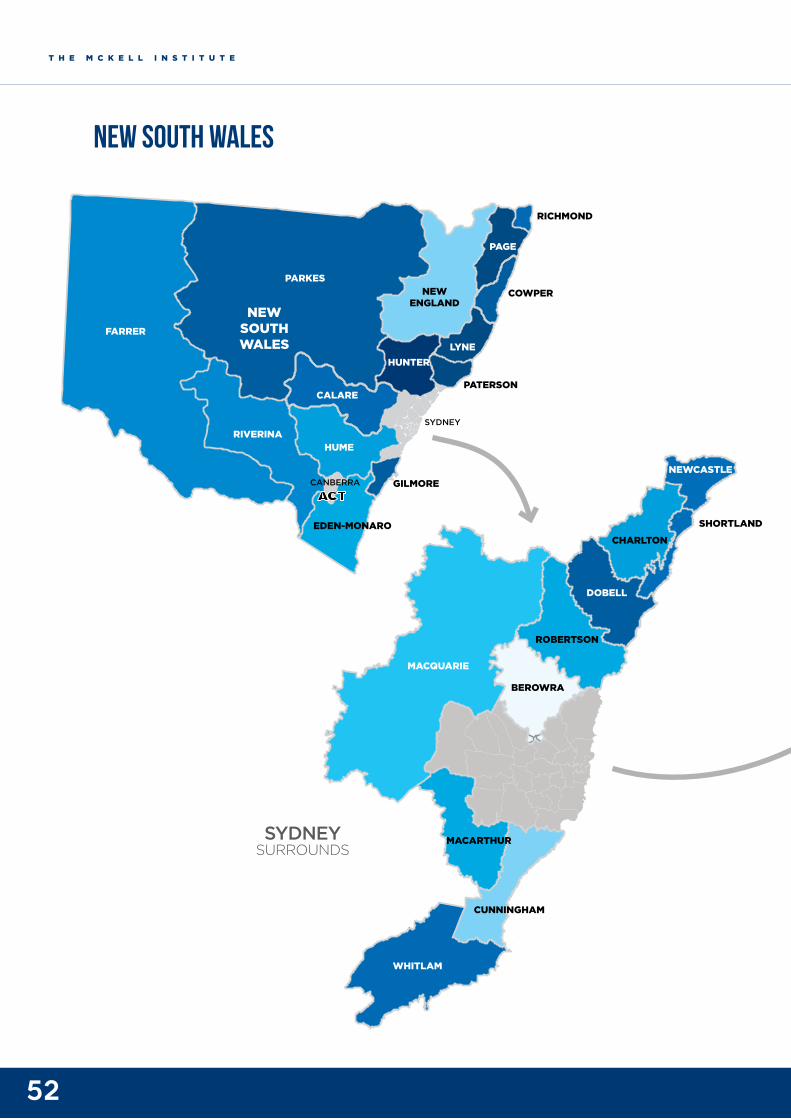
52
T H E M C K E L L I N S T I T U T E
SYDNEY
PARKES
NEWSOUTHWALES
FARRER
RIVERINA
CALARE
CANBERRA
HUME
ACT
HUNTER
NEWENGLAND
PATERSON
LYNE
PAGE
COWPER
RICHMOND
GILMORE
EDEN-MONARO
CHIFLEY
LINDSAY
MCMAHON
FOWLER
WERRIWA
HUGHES
COOK
BANKS
BARTON
WATSON
BLAXLAND
REIDSYDNEY
NORTHSYDNEY
GRAYNDLER
WENTWORTH
WARRINGAH
BRADFIELDMITCHELL
GREENWAY
MACKELLAR
BENNELONG
PARRAMATTA
KINGSFORDSMITH
MACQUARIE
BEROWRA
MACARTHUR
CUNNINGHAM
WHITLAM
ROBERTSON
DOBELL
CHARLTONSHORTLAND
NEWCASTLE
BEST WORST
NEW SOUTH WALES
SYDNEYSURROUNDS
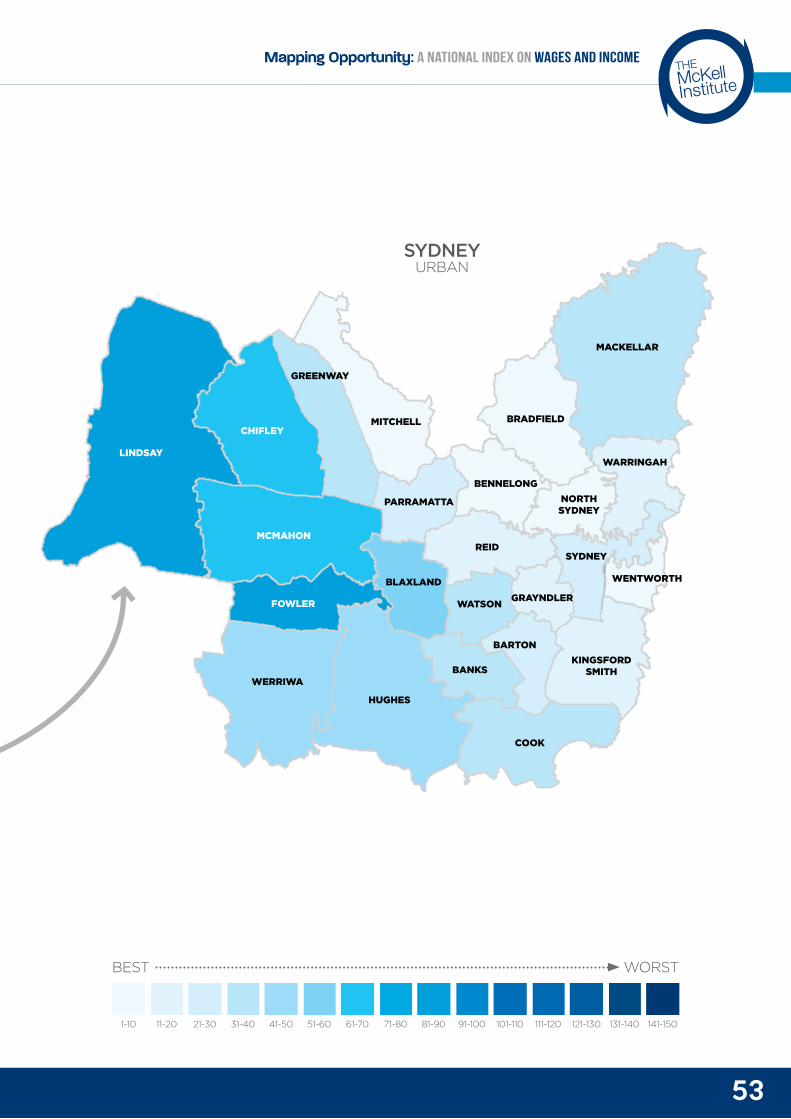
53
THEMcKellInstitute
Mapping Opportunity: A National Index on Wages and Income
SYDNEY
PARKES
NEWSOUTHWALES
FARRER
RIVERINA
CALARE
CANBERRA
HUME
ACT
HUNTER
NEWENGLAND
PATERSON
LYNE
PAGE
COWPER
RICHMOND
GILMORE
EDEN-MONARO
CHIFLEY
LINDSAY
MCMAHON
FOWLER
WERRIWA
HUGHES
COOK
BANKS
BARTON
WATSON
BLAXLAND
REIDSYDNEY
NORTHSYDNEY
GRAYNDLER
WENTWORTH
WARRINGAH
BRADFIELDMITCHELL
GREENWAY
MACKELLAR
BENNELONG
PARRAMATTA
KINGSFORDSMITH
MACQUARIE
BEROWRA
MACARTHUR
CUNNINGHAM
WHITLAM
ROBERTSON
DOBELL
CHARLTONSHORTLAND
NEWCASTLE
BEST WORST
SYDNEYURBAN
1-10 41-50 81-9011-20 51-60 91-10021-30 61-70 101-11031-40 71-80 111-120 121-130 131-140 141-150
BEST WORST
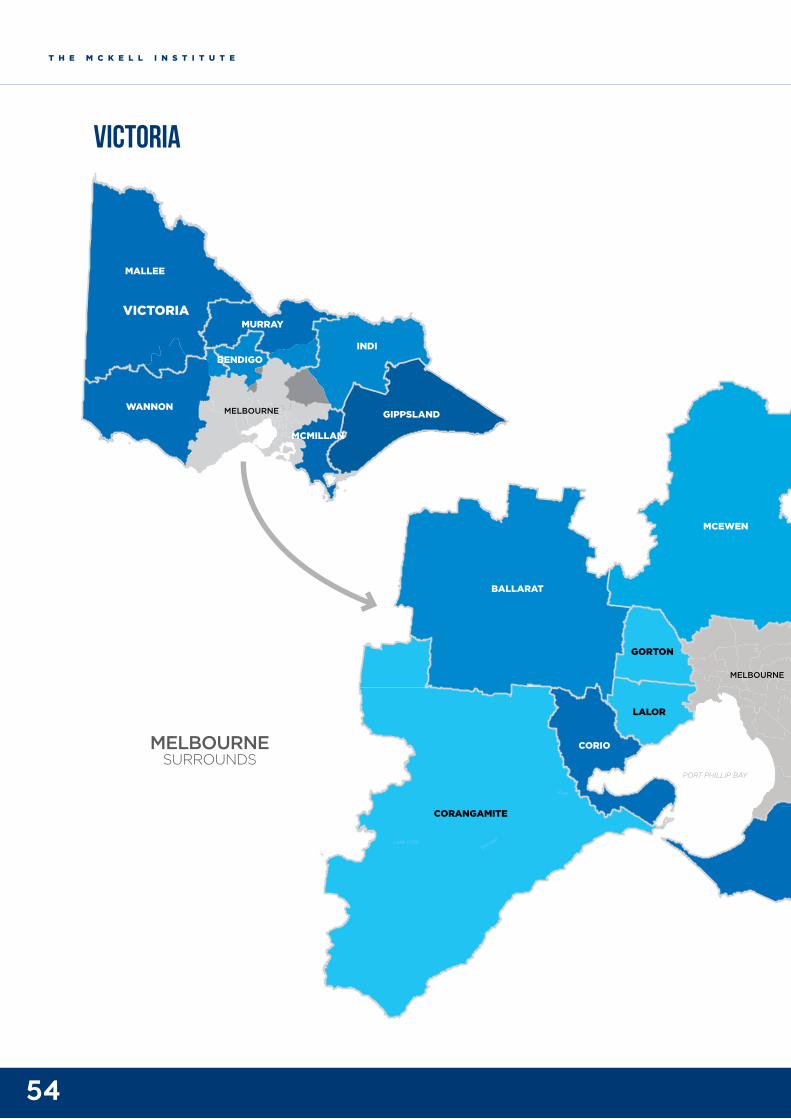
54
T H E M C K E L L I N S T I T U T E
VICTORIA
MALLEE
MURRAY
INDI
GIPPSLAND
MCMILLAN
BENDIGO
WANNON MELBOURNE
Lake ColacBarw
on
River
MELBOURNE
MELBOURNE
PORT PHILLIP BAY
PORT PHILLIP BAY
BALLARAT
MCEWEN
CALWELL SCULLIN
BATMANWILLS
MELBOURNE
KOOYONG
HIGGINSMELBOURNE
PORTS
JAGAJAGA
MENZIES
DEAKIN
ASTON
BRUCE
CHISOLM
GOLDSTEIN
DUNKLEY
ISAACS
HOTHAM
HOLT
GELLIBRAND
MARIBYRNONG
GORTON CASEY
LA TROBE
FLINDERS
LALOR
CORIO
CORANGAMITE
VICTORIA
MELBOURNESURROUNDS
VICTORIA
MALLEE
MURRAY
INDI
GIPPSLAND
MCMILLAN
BENDIGO
WANNON MELBOURNE
Lake ColacBarw
on
River
MELBOURNE
MELBOURNE
PORT PHILLIP BAY
PORT PHILLIP BAY
BALLARAT
MCEWEN
CALWELL SCULLIN
BATMANWILLS
MELBOURNE
KOOYONG
HIGGINSMELBOURNE
PORTS
JAGAJAGA
MENZIES
DEAKIN
ASTON
BRUCE
CHISOLM
GOLDSTEIN
DUNKLEY
ISAACS
HOTHAM
HOLT
GELLIBRAND
MARIBYRNONG
GORTON CASEY
LA TROBE
FLINDERS
LALOR
CORIO
CORANGAMITE
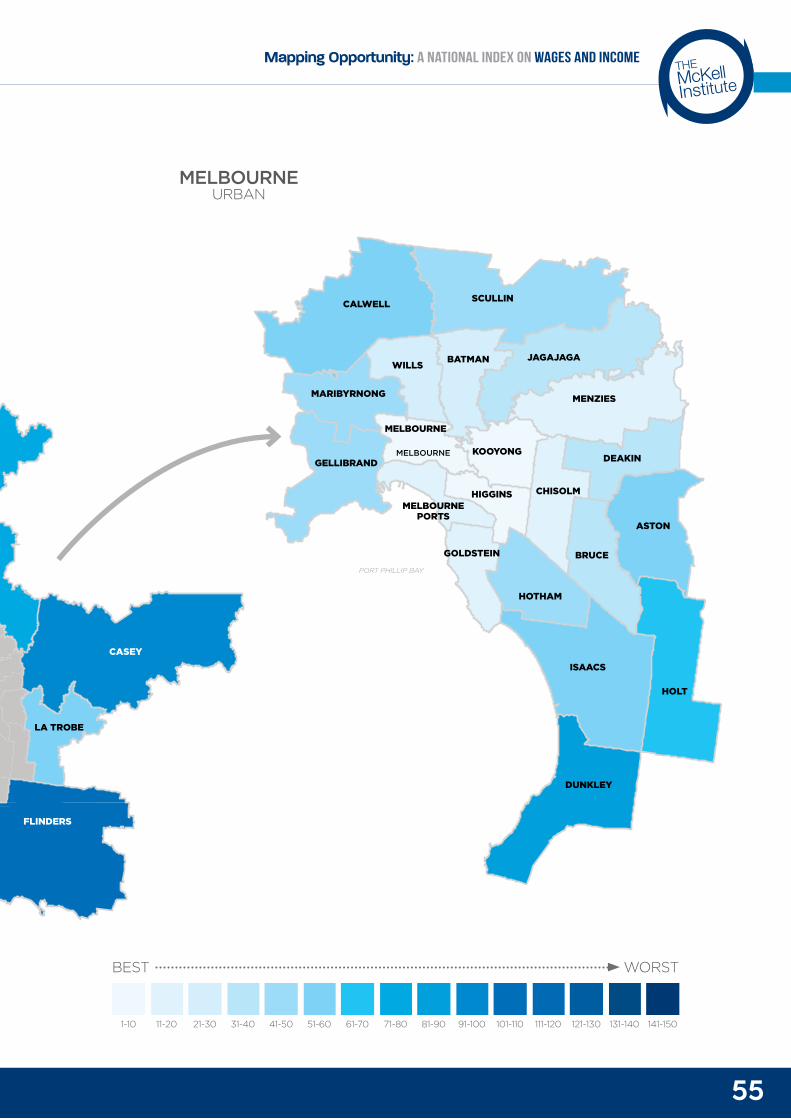
55
THEMcKellInstitute
Mapping Opportunity: A National Index on Wages and Income
VICTORIA
MALLEE
MURRAY
INDI
GIPPSLAND
MCMILLAN
BENDIGO
WANNON MELBOURNE
Lake ColacBarw
on
River
MELBOURNE
MELBOURNE
PORT PHILLIP BAY
PORT PHILLIP BAY
BALLARAT
MCEWEN
CALWELL SCULLIN
BATMANWILLS
MELBOURNE
KOOYONG
HIGGINSMELBOURNE
PORTS
JAGAJAGA
MENZIES
DEAKIN
ASTON
BRUCE
CHISOLM
GOLDSTEIN
DUNKLEY
ISAACS
HOTHAM
HOLT
GELLIBRAND
MARIBYRNONG
GORTON CASEY
LA TROBE
FLINDERS
LALOR
CORIO
CORANGAMITE
MELBOURNEURBAN
1-10 41-50 81-9011-20 51-60 91-10021-30 61-70 101-11031-40 71-80 111-120 121-130 131-140 141-150
BEST WORST
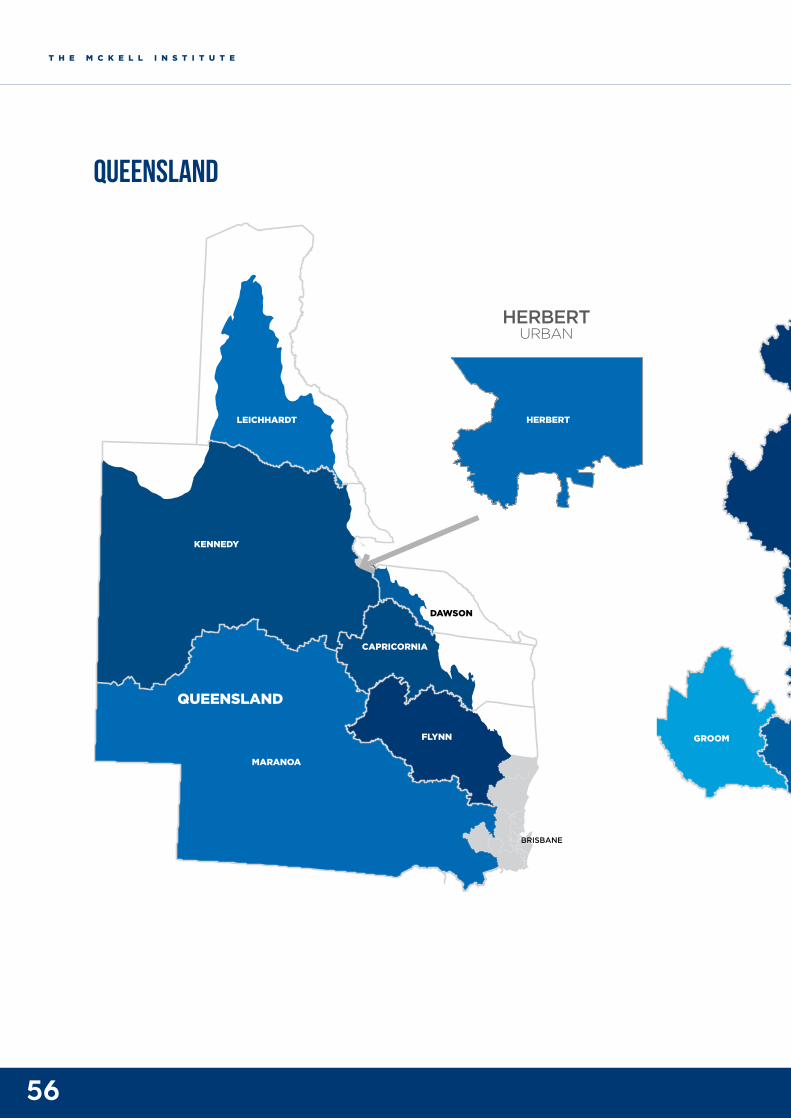
56
T H E M C K E L L I N S T I T U T E
QUEENSLAND
BRISBANE
HERBERTLEICHHARDT
CAPRICORNIA
FLYNN
DAWSON
KENNEDY
MARANOA
!
HINKLER
WIDE BAY
BLAIR
WRIGHT
FISHER
LONGMAN
FORDE
FADDEN
DICKSON
FAIRFAX
RYAN
BRISBANE
BONNER
GRIFFITH
MORETON
OXLEY
RANKIN
BOWMAN
LILLEY
PETRIE
MCPHERSON
MONCRIEFF
GROOMBRISBANE
QUEENSLAND
BRISBANE
HERBERTLEICHHARDT
CAPRICORNIA
FLYNN
DAWSON
KENNEDY
MARANOA
!
HINKLER
WIDE BAY
BLAIR
WRIGHT
FISHER
LONGMAN
FORDE
FADDEN
DICKSON
FAIRFAX
RYAN
BRISBANE
BONNER
GRIFFITH
MORETON
OXLEY
RANKIN
BOWMAN
LILLEY
PETRIE
MCPHERSON
MONCRIEFF
GROOMBRISBANE
QUEENSLAND
HERBERTURBAN
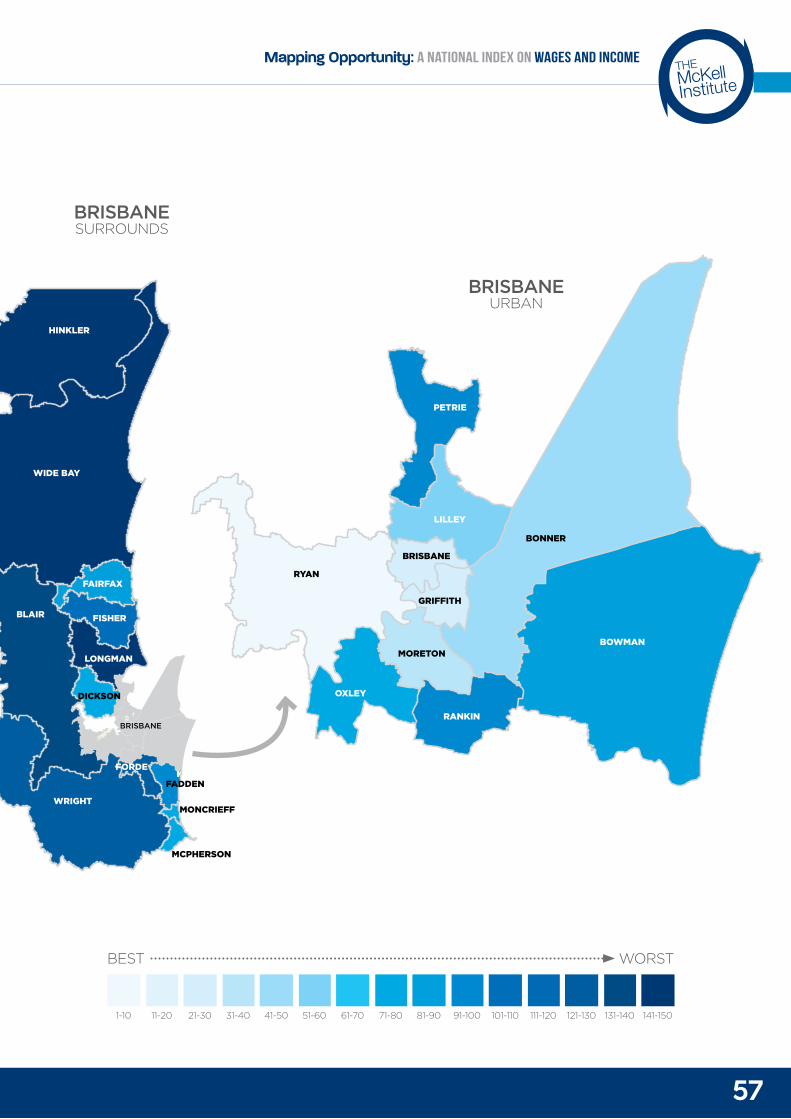
57
THEMcKellInstitute
Mapping Opportunity: A National Index on Wages and Income
QUEENSLAND
BRISBANE
HERBERTLEICHHARDT
CAPRICORNIA
FLYNN
DAWSON
KENNEDY
MARANOA
!
HINKLER
WIDE BAY
BLAIR
WRIGHT
FISHER
LONGMAN
FORDE
FADDEN
DICKSON
FAIRFAX
RYAN
BRISBANE
BONNER
GRIFFITH
MORETON
OXLEY
RANKIN
BOWMAN
LILLEY
PETRIE
MCPHERSON
MONCRIEFF
GROOMBRISBANE
QUEENSLAND
BRISBANE
HERBERTLEICHHARDT
CAPRICORNIA
FLYNN
DAWSON
KENNEDY
MARANOA
!
HINKLER
WIDE BAY
BLAIR
WRIGHT
FISHER
LONGMAN
FORDE
FADDEN
DICKSON
FAIRFAX
RYAN
BRISBANE
BONNER
GRIFFITH
MORETON
OXLEY
RANKIN
BOWMAN
LILLEY
PETRIE
MCPHERSON
MONCRIEFF
GROOMBRISBANE
BRISBANESURROUNDS
BRISBANEURBAN
1-10 41-50 81-9011-20 51-60 91-10021-30 61-70 101-11031-40 71-80 111-120 121-130 131-140 141-150
BEST WORST
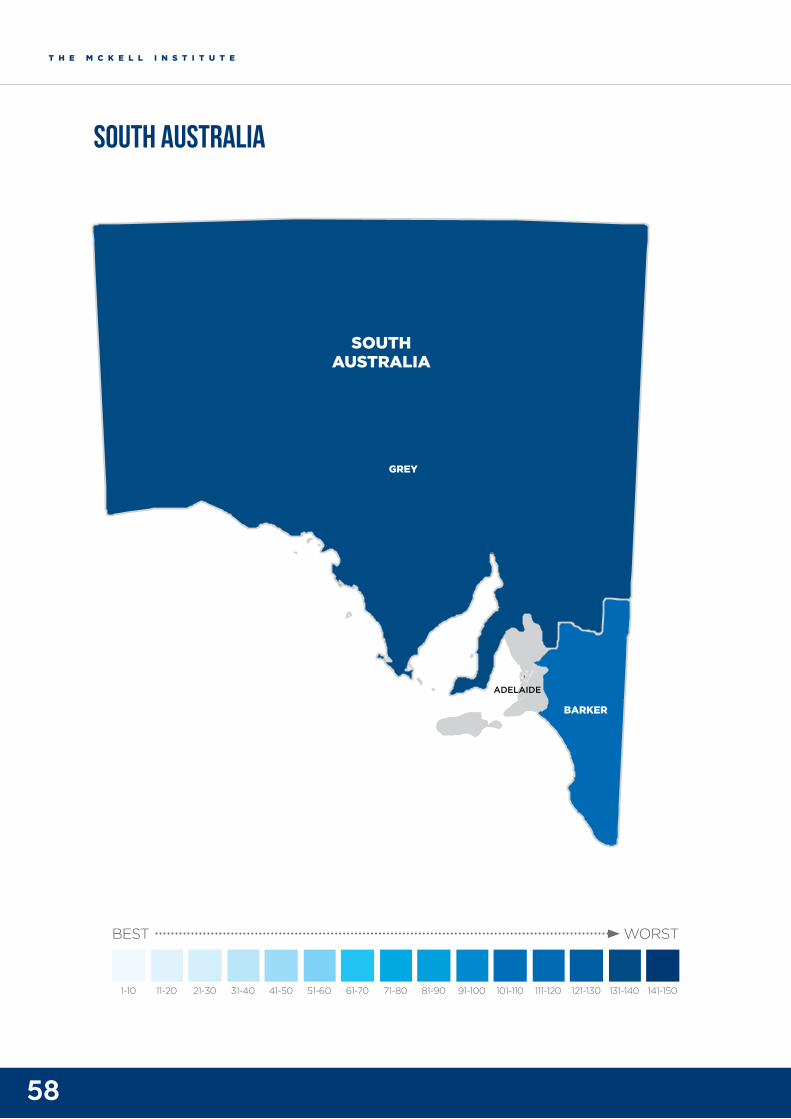
58
T H E M C K E L L I N S T I T U T E
SOUTHAUSTRALIA
GREY
BARKER
ADELAIDE
GULFST VINCENT
km20
5 km
50 km
KINGSTON
PORT ADELAIDE
MAKIN
WAKEFIELD
MAYO
STURT
ADELAIDE
BOOTHBY
HINDMARSH
PART OFMAYO
ADELAIDE
KANGAROOISLAND
BEST WORST
SOUTH AUSTRALIA
1-10 41-50 81-9011-20 51-60 91-10021-30 61-70 101-11031-40 71-80 111-120 121-130 131-140 141-150
BEST WORST
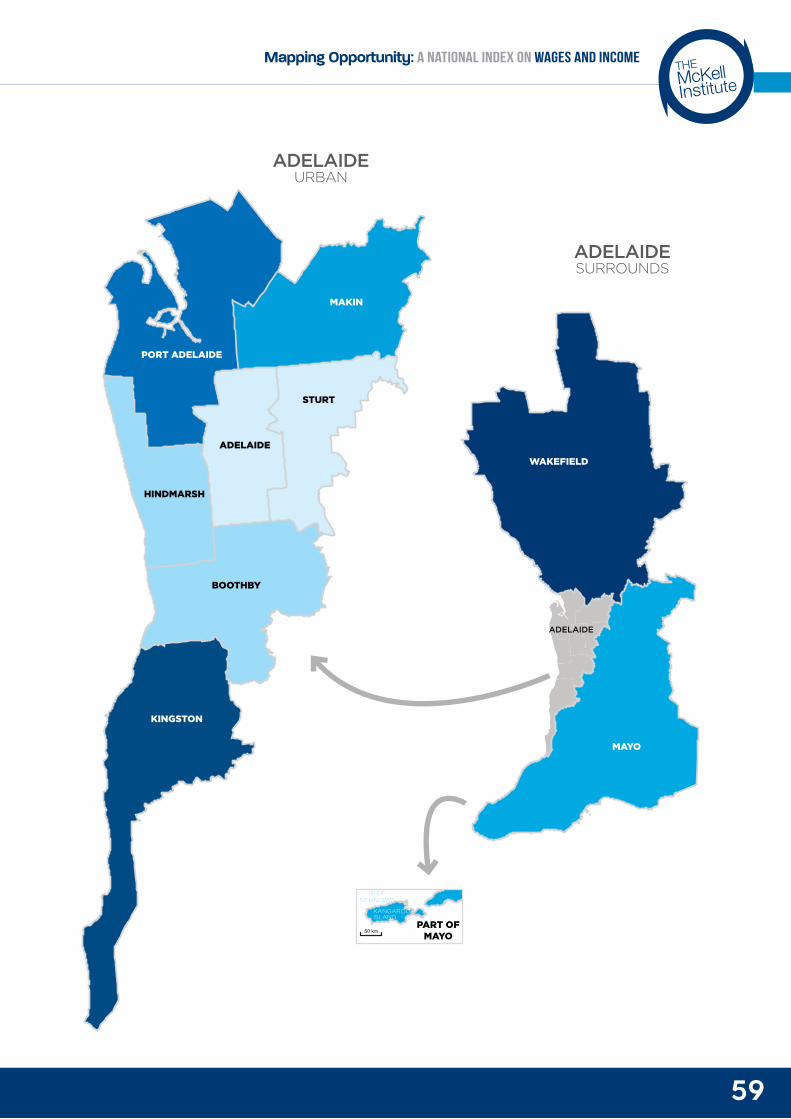
59
THEMcKellInstitute
Mapping Opportunity: A National Index on Wages and Income
SOUTHAUSTRALIA
GREY
BARKER
ADELAIDE
GULFST VINCENT
km20
5 km
50 km
KINGSTON
PORT ADELAIDE
MAKIN
WAKEFIELD
MAYO
STURT
ADELAIDE
BOOTHBY
HINDMARSH
PART OFMAYO
ADELAIDE
KANGAROOISLAND
BEST WORST
ADELAIDESURROUNDS
ADELAIDEURBAN
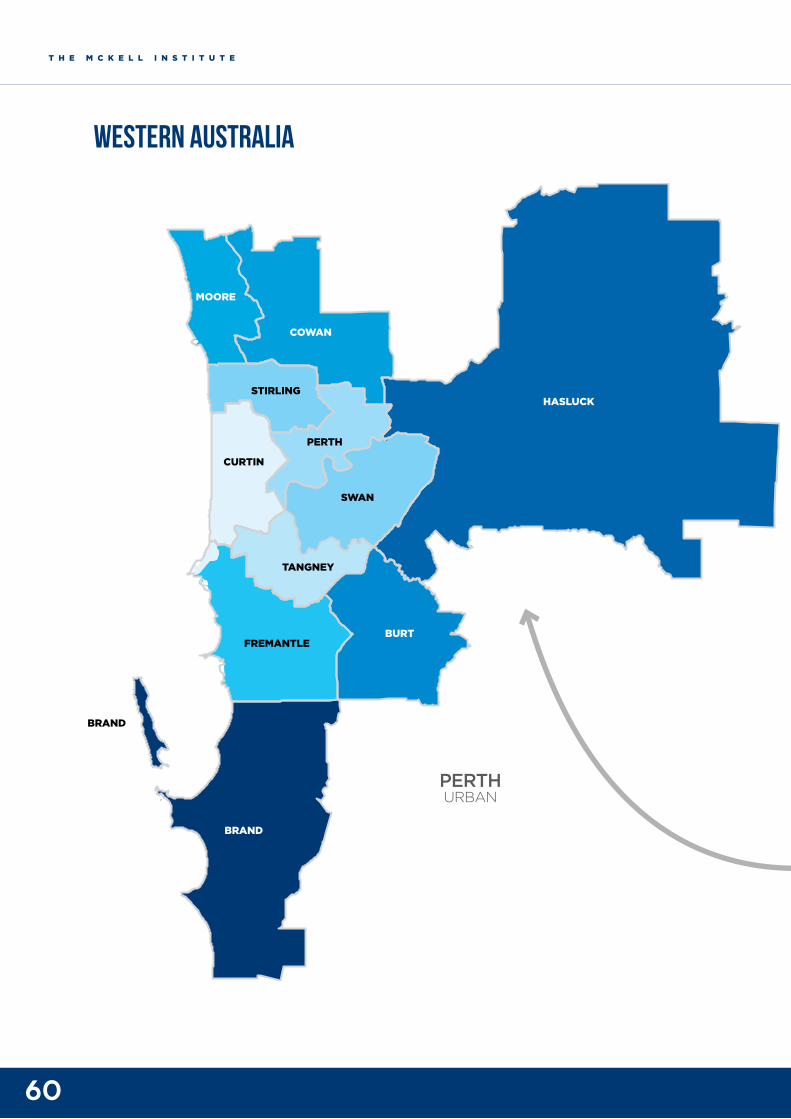
60
T H E M C K E L L I N S T I T U T E
MOORE
PERTH
FREMANTLE
FREMANTLE
BRAND
BURT
TANGNEY
COWAN
HASLUCKSTIRLING
BRAND
CURTIN
SWAN
DURACK
O’CONNOR
WESTERNAUSTRALIA
PEARCE
CANNING
FORREST
PERTH
MOORE
PERTH
FREMANTLE
FREMANTLE
BRAND
BURT
TANGNEY
COWAN
HASLUCKSTIRLING
BRAND
CURTIN
SWAN
DURACK
O’CONNOR
WESTERNAUSTRALIA
PEARCE
CANNING
FORREST
PERTH
WESTERN AUSTRALIA
PERTHURBAN
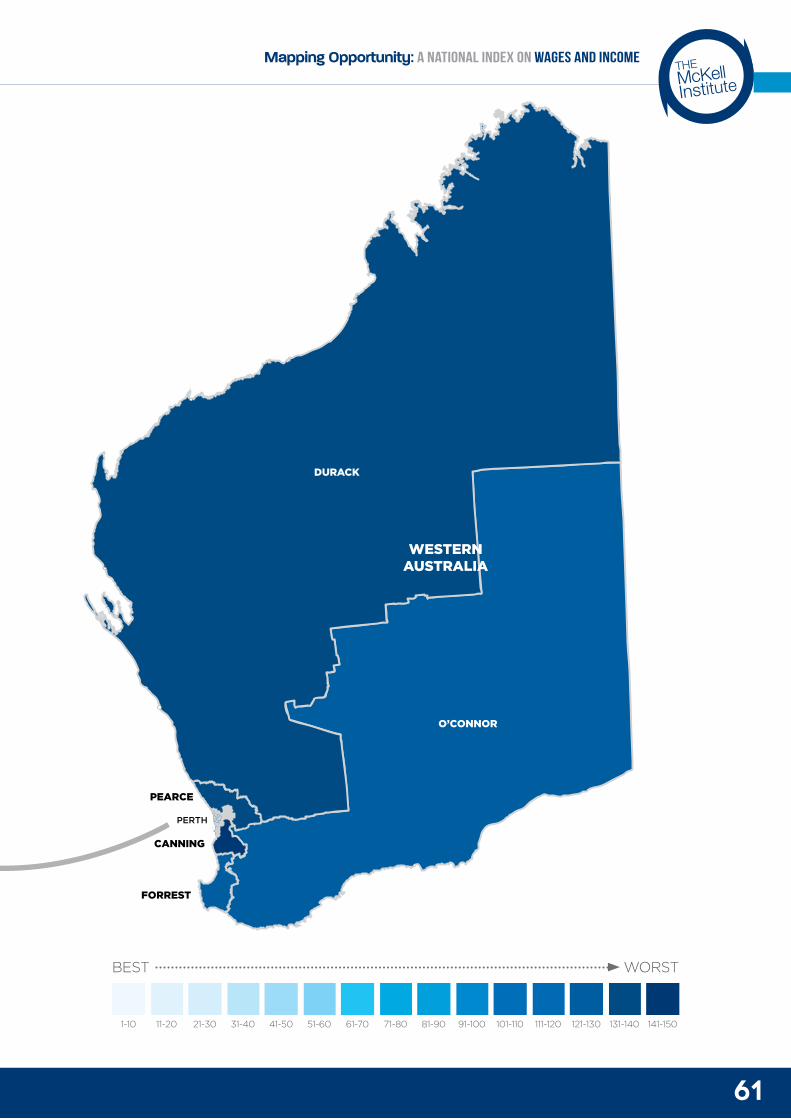
61
THEMcKellInstitute
Mapping Opportunity: A National Index on Wages and Income
MOORE
PERTH
FREMANTLE
FREMANTLE
BRAND
BURT
TANGNEY
COWAN
HASLUCKSTIRLING
BRAND
CURTIN
SWAN
DURACK
O’CONNOR
WESTERNAUSTRALIA
PEARCE
CANNING
FORREST
PERTH
MOORE
PERTH
FREMANTLE
FREMANTLE
BRAND
BURT
TANGNEY
COWAN
HASLUCKSTIRLING
BRAND
CURTIN
SWAN
DURACK
O’CONNOR
WESTERNAUSTRALIA
PEARCE
CANNING
FORREST
PERTH
1-10 41-50 81-9011-20 51-60 91-10021-30 61-70 101-11031-40 71-80 111-120 121-130 131-140 141-150
BEST WORST
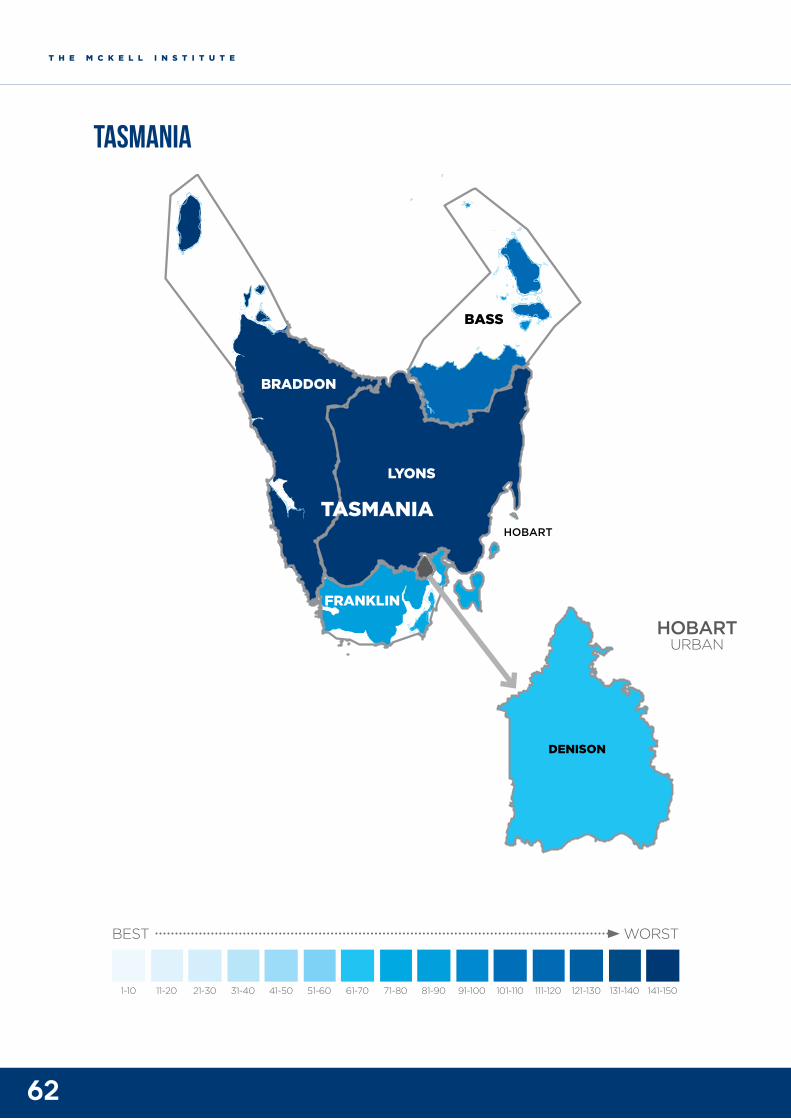
62
T H E M C K E L L I N S T I T U T E
5 km
MelbourneURBAN
VICTORIA
MALLEE
MURRAY
INDI
GIPPSLAND
MCMILLAN
BENDIGO
WANNONMELBOURNE
Lake ColacBarw
on
River
20 km
MelbourneSURROUNDS
MELBOURNE
MELBOURNE
PORT PHILLIP BAY
PORT PHILLIP BAY
BALLARAT
MCEWEN
CALWELL SCULLIN
BATMANWILLS
MELBOURNE
KOOYONG
HIGGINS
PORTMELBOURNE
JAGAJAGA
MENZIES
DEAKIN
ASTON
BRUCE
CHISOLM
GOLDSTEIN
DUNKLEY
ISAACS
HOTHAM
HOLT
GELLIBRAND
MARIBYRNONG
GORTON CASEY
LA TROBE
FLINDERS
LALOR
CORIO
CORANGAMITE
BEST WORST
VICTORIA
DENISON
LYONS
BASS
BRADDON
FRANKLIN
TASMANIAHOBART
TASMANIA
HOBARTURBAN
1-10 41-50 81-9011-20 51-60 91-10021-30 61-70 101-11031-40 71-80 111-120 121-130 131-140 141-150
BEST WORST
63
THEMcKellInstitute
Mapping Opportunity: A National Index on Wages and Income
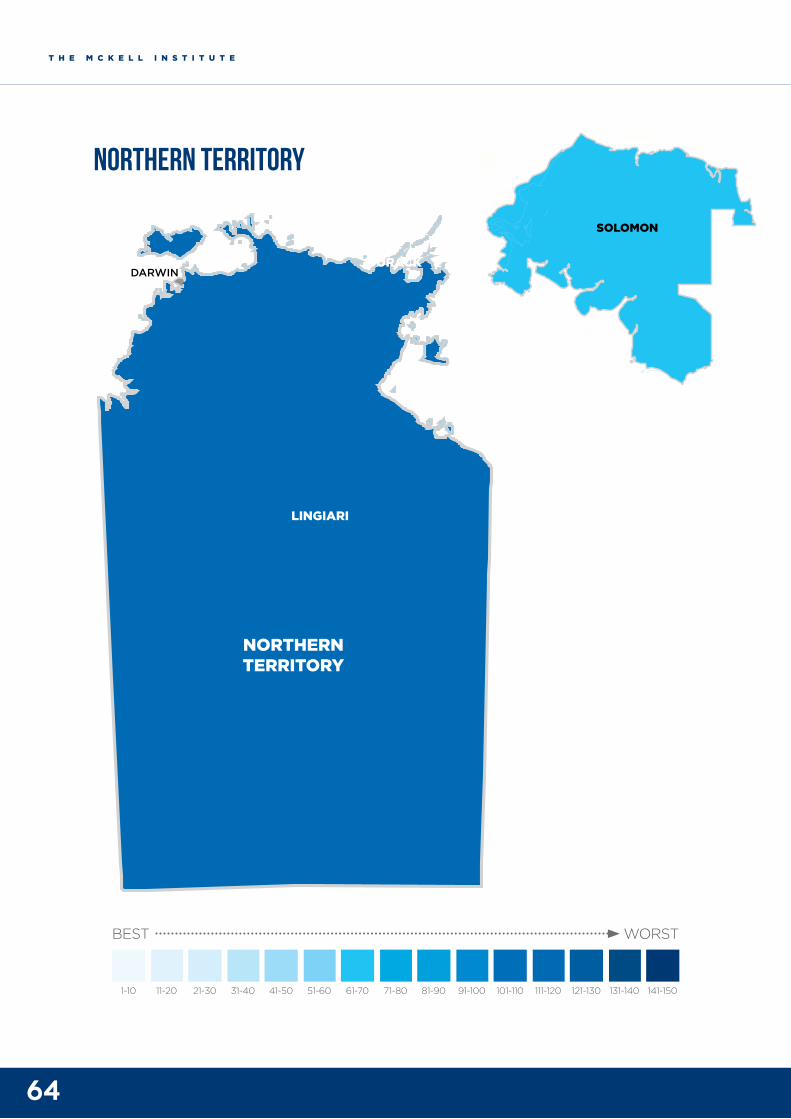
64
T H E M C K E L L I N S T I T U T E
NORTHERN TERRITORY
1-10 41-50 81-9011-20 51-60 91-10021-30 61-70 101-11031-40 71-80 111-120 121-130 131-140 141-150
BEST WORST
NORTHERNTERRITORY
DURACKDARWIN
SOLOMON
LINGIARI
BEST WORST
NORTHERN TERRITORY
AdelaideSURROUNDS
AdelaideURBAN
NORTHERNTERRITORY
DURACKDARWIN
SOLOMON
LINGIARI
BEST WORST
NORTHERN TERRITORY
AdelaideSURROUNDS
AdelaideURBAN
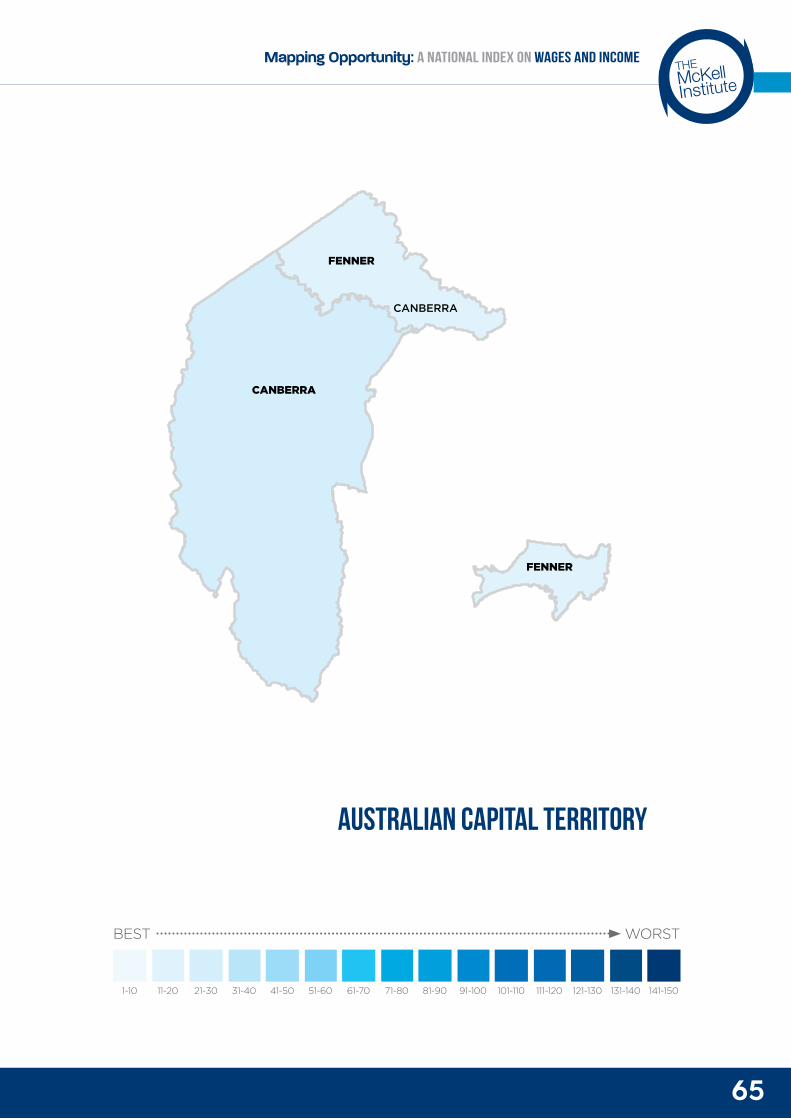
65
THEMcKellInstitute
Mapping Opportunity: A National Index on Wages and Income
AUSTRALIAN CAPITAL TERRITORY
1-10 41-50 81-9011-20 51-60 91-10021-30 61-70 101-11031-40 71-80 111-120 121-130 131-140 141-150
BEST WORST
FENNER
FENNER
CANBERRA
CANBERRA
BEST WORST
AUSTRALIAN CAPITAL TERRITORY
AdelaideSURROUNDS
AdelaideURBAN
66
T H E M C K E L L I N S T I T U T E
Median income ranked The table below displays the median incomes of the electorates ranked from 1–150 according to the data obtained from the ABS Census of Population and Housing 2016. Wentworth, NSW is the highest income earning electorate with the median being $1249 weekly closely followed by North Sydney, NSW with a median of $1172 weekly. The lowest earning electorate in terms of median personal weekly income is Fowler, NSW with $458 followed by Blaxland, NSW with a median of $468. The difference between the highest income earning electorate and the lowest earning electorate is $791 weekly.
It must be noted that although wages is the largest component of income, it is not the only source of income for individuals. The median incomes ranked below account for income earned through wages, interest rates on investments, transfers and Centrelink payments, superannuation, wealth inherited, income from share holdings etc.
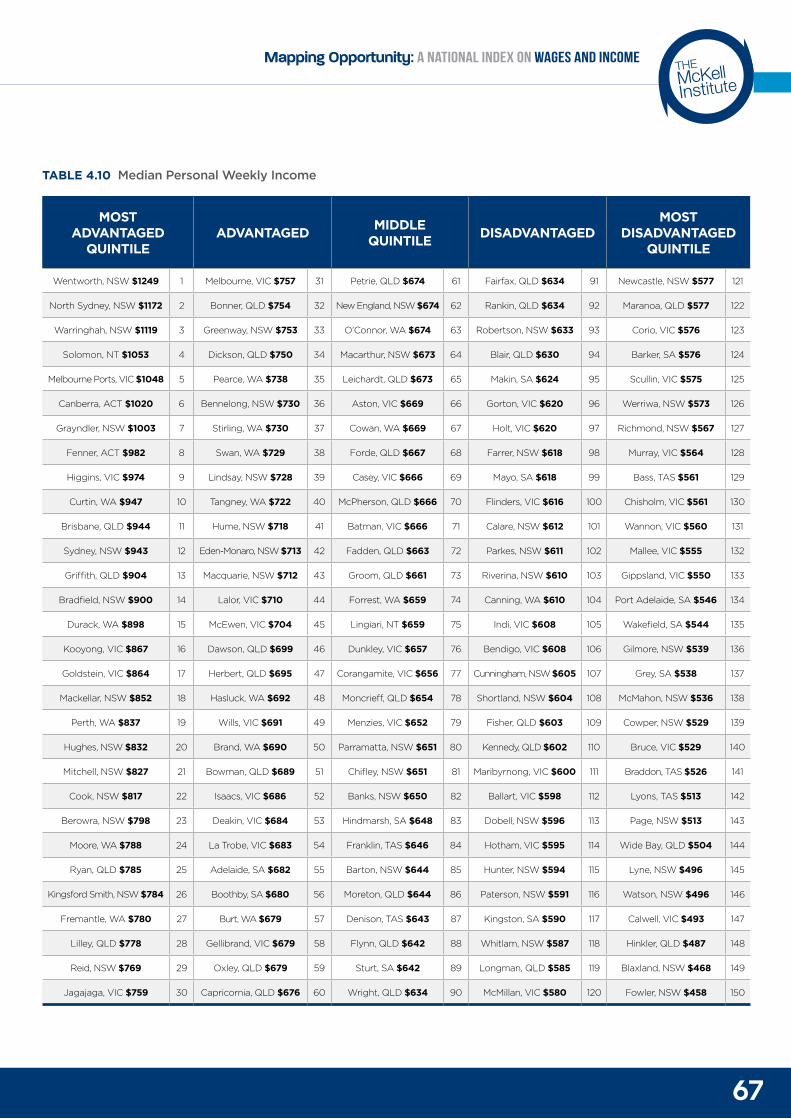
67
THEMcKellInstitute
Mapping Opportunity: A National Index on Wages and Income
MOST ADVANTAGED
QUINTILEADVANTAGED MIDDLE
QUINTILE DISADVANTAGEDMOST
DISADVANTAGED QUINTILE
Wentworth, NSW $1249 1 Melbourne, VIC $757 31 Petrie, QLD $674 61 Fairfax, QLD $634 91 Newcastle, NSW $577 121
North Sydney, NSW $1172 2 Bonner, QLD $754 32 New England, NSW $674 62 Rankin, QLD $634 92 Maranoa, QLD $577 122
Warringhah, NSW $1119 3 Greenway, NSW $753 33 O’Connor, WA $674 63 Robertson, NSW $633 93 Corio, VIC $576 123
Solomon, NT $1053 4 Dickson, QLD $750 34 Macarthur, NSW $673 64 Blair, QLD $630 94 Barker, SA $576 124
Melbourne Ports, VIC $1048 5 Pearce, WA $738 35 Leichardt, QLD $673 65 Makin, SA $624 95 Scullin, VIC $575 125
Canberra, ACT $1020 6 Bennelong, NSW $730 36 Aston, VIC $669 66 Gorton, VIC $620 96 Werriwa, NSW $573 126
Grayndler, NSW $1003 7 Stirling, WA $730 37 Cowan, WA $669 67 Holt, VIC $620 97 Richmond, NSW $567 127
Fenner, ACT $982 8 Swan, WA $729 38 Forde, QLD $667 68 Farrer, NSW $618 98 Murray, VIC $564 128
Higgins, VIC $974 9 Lindsay, NSW $728 39 Casey, VIC $666 69 Mayo, SA $618 99 Bass, TAS $561 129
Curtin, WA $947 10 Tangney, WA $722 40 McPherson, QLD $666 70 Flinders, VIC $616 100 Chisholm, VIC $561 130
Brisbane, QLD $944 11 Hume, NSW $718 41 Batman, VIC $666 71 Calare, NSW $612 101 Wannon, VIC $560 131
Sydney, NSW $943 12 Eden-Monaro, NSW $713 42 Fadden, QLD $663 72 Parkes, NSW $611 102 Mallee, VIC $555 132
Griffith, QLD $904 13 Macquarie, NSW $712 43 Groom, QLD $661 73 Riverina, NSW $610 103 Gippsland, VIC $550 133
Bradfield, NSW $900 14 Lalor, VIC $710 44 Forrest, WA $659 74 Canning, WA $610 104 Port Adelaide, SA $546 134
Durack, WA $898 15 McEwen, VIC $704 45 Lingiari, NT $659 75 Indi, VIC $608 105 Wakefield, SA $544 135
Kooyong, VIC $867 16 Dawson, QLD $699 46 Dunkley, VIC $657 76 Bendigo, VIC $608 106 Gilmore, NSW $539 136
Goldstein, VIC $864 17 Herbert, QLD $695 47 Corangamite, VIC $656 77 Cunningham, NSW $605 107 Grey, SA $538 137
Mackellar, NSW $852 18 Hasluck, WA $692 48 Moncrieff, QLD $654 78 Shortland, NSW $604 108 McMahon, NSW $536 138
Perth, WA $837 19 Wills, VIC $691 49 Menzies, VIC $652 79 Fisher, QLD $603 109 Cowper, NSW $529 139
Hughes, NSW $832 20 Brand, WA $690 50 Parramatta, NSW $651 80 Kennedy, QLD $602 110 Bruce, VIC $529 140
Mitchell, NSW $827 21 Bowman, QLD $689 51 Chifley, NSW $651 81 Maribyrnong, VIC $600 111 Braddon, TAS $526 141
Cook, NSW $817 22 Isaacs, VIC $686 52 Banks, NSW $650 82 Ballart, VIC $598 112 Lyons, TAS $513 142
Berowra, NSW $798 23 Deakin, VIC $684 53 Hindmarsh, SA $648 83 Dobell, NSW $596 113 Page, NSW $513 143
Moore, WA $788 24 La Trobe, VIC $683 54 Franklin, TAS $646 84 Hotham, VIC $595 114 Wide Bay, QLD $504 144
Ryan, QLD $785 25 Adelaide, SA $682 55 Barton, NSW $644 85 Hunter, NSW $594 115 Lyne, NSW $496 145
Kingsford Smith, NSW $784 26 Boothby, SA $680 56 Moreton, QLD $644 86 Paterson, NSW $591 116 Watson, NSW $496 146
Fremantle, WA $780 27 Burt, WA $679 57 Denison, TAS $643 87 Kingston, SA $590 117 Calwell, VIC $493 147
Lilley, QLD $778 28 Gellibrand, VIC $679 58 Flynn, QLD $642 88 Whitlam, NSW $587 118 Hinkler, QLD $487 148
Reid, NSW $769 29 Oxley, QLD $679 59 Sturt, SA $642 89 Longman, QLD $585 119 Blaxland, NSW $468 149
Jagajaga, VIC $759 30 Capricornia, QLD $676 60 Wright, QLD $634 90 McMillan, VIC $580 120 Fowler, NSW $458 150
TABLE 4.10 Median Personal Weekly Income
68
T H E M C K E L L I N S T I T U T E
Methodology for the modelIn calculating the econometric model for the determination of wages, eight variables were considered. There are many other factors that determine the access to wages but the most critical factors were explored in this report. Academic evidence and empirical studies have shown correlations between these chosen factors and the individual’s access to wages.
Different weightings were applied to the variables and their subcategories. The weightings ranged from +0.75 to -0.25 and were applied to each subset within the variable in accordance to firstly whether it was positively/negatively correlated with the individual’s access to wages, and secondly, in order of how strong this correlation was. The numbers were generated based on the academic literature which demonstrated the strength of the correlation.
The variables were then divided by the working age population in each electorate in order to create standardisation among the results since this index is calculated for the access to wages across the electorates and therefore only applies to the subset of the population that is working. The combined total was finally ranked in order of importance (percentage distribution out of 100 per cent) as to what extent these factors determine the access to wages. The final rankings were then listen from 1-150 for the electorates, according to the most advantaged/disadvantaged electorates in the access to wages in Australia.
Median personal weekly income methodology
In calculating the ranking for median incomes per person weekly, the dataset was directly obtained from the ABS 2016 Census of Population and Housing. The tables were constructed for each Commonwealth Electoral Division using TableBuilder. The data was then exported to Microsoft Excel and the median personal weekly income for each electorate was calculated. This was then ranked nationally to show the differences in median incomes across the 150 electoral divisions for the entire population; it was not specific to simply the working age population. The entire population of the electorate was considered in the calculation so that a broad idea of the social mobility within the electorate could be illustrated.
The table below displays the variables selected for the model and shows their sub-categories as obtained from the ABS with the relevant weightings applied.
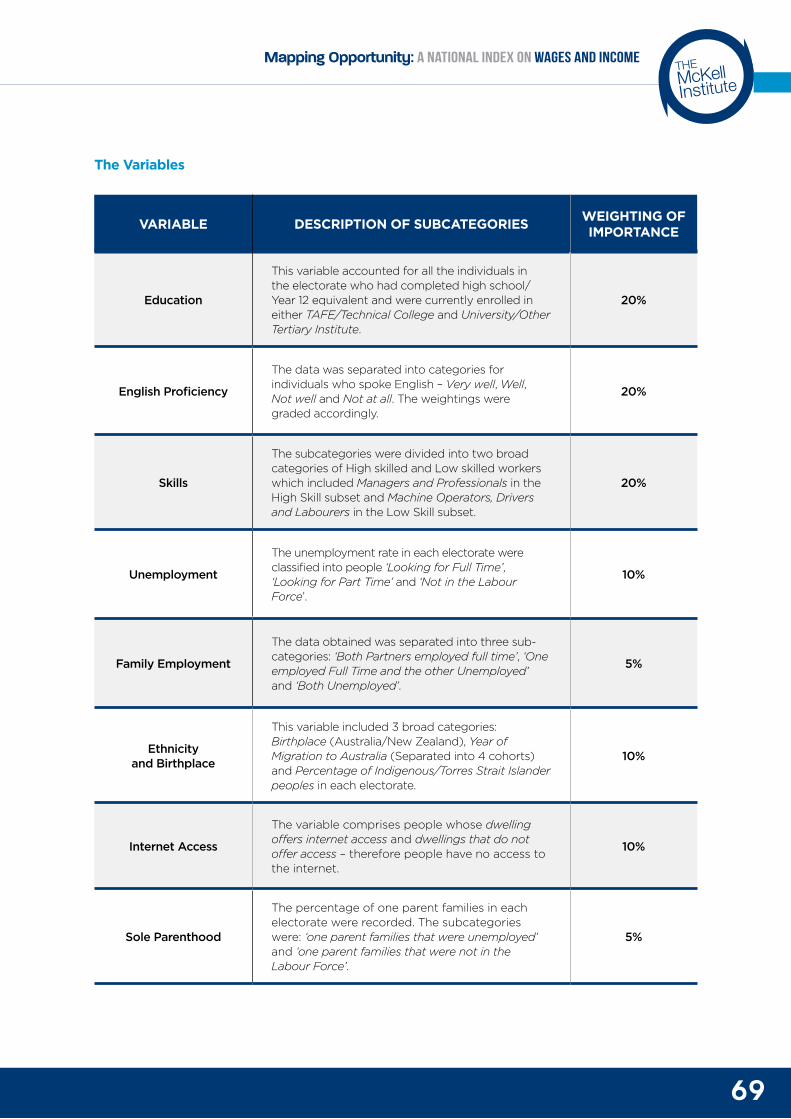
69
THEMcKellInstitute
Mapping Opportunity: A National Index on Wages and Income
VARIABLE DESCRIPTION OF SUBCATEGORIES WEIGHTING OF IMPORTANCE
Education
This variable accounted for all the individuals in the electorate who had completed high school/Year 12 equivalent and were currently enrolled in either TAFE/Technical College and University/Other Tertiary Institute.
20%
English Proficiency
The data was separated into categories for individuals who spoke English – Very well, Well, Not well and Not at all. The weightings were graded accordingly.
20%
Skills
The subcategories were divided into two broad categories of High skilled and Low skilled workers which included Managers and Professionals in the High Skill subset and Machine Operators, Drivers and Labourers in the Low Skill subset.
20%
Unemployment
The unemployment rate in each electorate were classified into people ‘Looking for Full Time’, ‘Looking for Part Time’ and ‘Not in the Labour Force’.
10%
Family Employment
The data obtained was separated into three sub-categories: ‘Both Partners employed full time’, ‘One employed Full Time and the other Unemployed’ and ‘Both Unemployed’.
5%
Ethnicity and Birthplace
This variable included 3 broad categories: Birthplace (Australia/New Zealand), Year of Migration to Australia (Separated into 4 cohorts) and Percentage of Indigenous/Torres Strait Islander peoples in each electorate.
10%
Internet Access
The variable comprises people whose dwelling offers internet access and dwellings that do not offer access – therefore people have no access to the internet.
10%
Sole Parenthood
The percentage of one parent families in each electorate were recorded. The subcategories were: ‘one parent families that were unemployed’ and ‘one parent families that were not in the Labour Force’.
5%
The Variables
70
T H E M C K E L L I N S T I T U T E
Taxes on the high income earners in the top 10 per cent who save a significant proportion of their income have the least damaging effect on aggregate demand. On the contrary, taxes on lower income individuals have the most adverse effect on aggregate demand. Hence a reform which increases the progressivity of the tax system improves the distribution of income, and additionally results in a significant impetus to the economy.
A change in other forms of taxes can also lead to a more direct stimulation of the economy. An increase in the inheritance tax can lead to incentivising the wealthy to consume now. A tax on pollution encourages firms to make carbon-reducing investments and leads to ripple benefits and raises revenue which incentivises firms to retro-fit thus encouraging investment that leads to higher output and employment.
It is demand that creates jobs and high inequality destroys jobs accordingly.74
The spread of wealth in Australia is more unequal than for income, due to home ownership rates. Due to the accumulation of wealth over the working life of individuals, Australia has historically had a high rate of home ownership than comparable countries.
However, in 2014, less than 20 per cent of people living in Sydney aged 18-39 were home owners in comparison to 36 per cent or more
Economic opportunities are partly determined by factors beyond a person’s control and the equality in accessing opportunities is achieved when these factors do not play a part in achieving economic outcomes. Empirical studies show that economic weaknesses following the Great Recession reduced the potential growth of economies and a critical contributing factor to this was persistent high unemployment, especially long term unemployment. This could be a problem in Australia if nothing is done to address the unemployment rates especially if long term unemployment is left to grow unchecked. Additionally, youth unemployment must be avoided at all costs as it is pernicious to the economy and has social costs on families and living standards.
Conclusion
71
THEMcKellInstitute
Mapping Opportunity: A National Index on Wages and Income
in the ACT, urban Northern Territory and non-urban regions of Australia. This is a depiction of the soaring house prices nationally and the differences in income between individuals across states.75
Especially significant was that home ownership differed in certain employment categories. In 2014, home ownership was distinctly rare among community and personal services workers, sales workers and labourers. Renting has increasingly become common among the younger generation due to the changes in the distribution of income and the unaffordability of housing.
Research indicates that from an early age, differences in circumstances affect the access to opportunity and wages in the long run. Income support and the government social welfare system can aid in alleviating the effect of intrinsic disadvantage present in certain communities and remove the barriers to moving up the income ladder for individuals.76 The relationship between inequality and economic growth arises from limited opportunities for human capital investment for children at the lower levels of socio-economic distribution.77
Programs such as early childhood, preschool programs and other such early development support can aid in school achievement and job performance of individuals as they join the workforce. Helping parents in looking for jobs and applying for government services by
making them aware of the available services could also help bridge the gap in the equality of opportunity.
Opportunity stems from many sources, including demographic characteristics that individuals cannot change such as parents’ educational level or their racial heritage, personal characteristics and attributes, such as determination or intelligence, and inherent conditions present in communities like quality schools and safe streets.78 Community conditions are highly amenable to policy change and can, through collective efforts, improve the access to opportunity and quality of life for individuals. Some communities have features that open many doors to its occupants, others unfortunately do not.
High levels of inequality in a society can have damaging effects on the individuals and lead to adverse effects on levels of education, skills acquisition and labour market outcomes; to name a few.
This report seeks to highlight the differences in the access to earnings across electorates and identify the important factors that determine one’s earnings ability. The findings of this report serve as an evidence base for increasing income inequality in Australia and urges for policy reform and other programs in order to improve the access to economic opportunities for individuals and thereby increase social mobility in the economy as a whole.
THEMcKellInstitute
72
T H E M C K E L L I N S T I T U T E
references
1. Biddle, N & Markham, F, ‘What Income inequality looks like across Australia’, viewed 5 November 2017: http://theconversation.com/what-income-inequality-looks-like-across-australia-80069.
2. Swan, Cooney et al 2016, Inequality: The facts and the future, Chifley Research Centre Inclusive Prosperity Commission, viewed 15 July 2017: http://www.chifley.org.au/Inequality-the-facts-and-the-future.
3. Ibid.
4. Australian Council Of Social Service (ACOSS) Social Policy Research centre 2016, Poverty in Australia 2016, viewed 21 July 2017: http://www.acoss.org.au/wp-content/uploads/2016/10/Poverty-in-Australia-2016.pdf.
5. Whiteford, P 2015, Inequality and its Socioeconomic Impacts, Wiley Online Library, viewed 25 July 2017: http://onlinelibrary.wiley.com/doi/10.1111/1467-8462.12099/abstract.
6. Whiteford, P 2013, Australia: Inequality and prosperity and their impacts in a radical welfare state, Social Policy Action Research Centre, Australian National University, viewed 30 July 2017: https://crawford.anu.edu.au/pdf/events/2013/8801/Whiteford-Australia-Inequality-and-Prosperity-final.pdf.
7. Ibid.
8. Bill Shorten MP on the ABC Q&A Program, 2015, https://theconversation.com/factcheck-qanda-is-australia-the-most-unequal-it-has-been-in-75-years-47931.
9. Australian Labor 2016, Labor’s agenda for tackling inequality, viewed 25 July 2017: http://cdn.australianlabor.com.au/documents/Growing-Together.pdf.
10. The Australian National University 2013, Australia, Inequality and Prosperity, viewed 5 August 2017: https://coombsforum.crawford.anu.edu.au/public_policy_community/content/doc/Australia_Inequality-and-Prosperity_final-15-March-13.pdf.
11. Ibid.
12. Ibid.
13. Keating, M 2003, The labour market and inequality, Australian Economic Review, 36(4), pp.374-396.
14. Investopedia 2017, Gini Index, viewed 10 August 2017:http://www.investopedia.com/terms/g/gini-index.asp.
15. Ibid.
16. Investopedia 2017, Lorenz Curve, viewed 6 August 2017: http://www.investopedia.com/terms/l/lorenz-curve.asp.
17. The Reserve Bank of Australia 2016, The Distribution of Household Wealth in Australia: Evidence from the 2010
HILDA Survey, viewed 15 August 2017: http://www.rba.gov.au/publications/bulletin/2012/mar/3.html.
18. The Australian Bureau of Statistics 2017, Wage Price Index Australia, viewed 20 August 2017: http://www.abs.gov.au/ausstats/[email protected]/mf/6345.0.
19. Durlauhf, S N & Seshadri, A 2016, Understanding the Great Gatsby Curve, viewed 25 August 2017: https://economics.uchicago.edu/sites/economics.uchicago.edu/files/uploads/PDF/Durlauf%20-%20Understanding%20the%20Great%20Gatsby%20Curve%20041817.pdf.
20. Corak, M 2013, Income Inequality, Equality of Opportunity, and Intergenerational Mobility, Journal of Economic Perspectives, Vol 27, PP 79-102, viewed 17 August 2017: http://pubs.aeaweb.org/doi/pdfplus/10.1257/jep.27.3.79.
21. Ibid.
22. Mendolia, S & Siminski P M 2016, New estimates of intergenerational mobility in Australia, University of Wollongong Faculty of Business Papers, viewed 5 September 2017: http://ro.uow.edu.au/cgi/viewcontent.cgi?article=1849&context=buspapers.
23. Ibid.
24. Leigh, A 2007, Intergenerational Mobility in Australia, The Berkeley Electronic Journal of Economic Analysis & Policy, Vol 7, viewed 26 August 2017: https://openresearch-repository.anu.edu.au/bitstream/10440/716/1/Leigh_Intergenerational2007.pdf.
25. The McKell Institute, Unfair Burden, viewed 25 September 2017: https://mckellinstitute.org.au/app/uploads/The-McKell-Institute-Unfair-Burden.pdf.
26. Department of Industry Innovation and Science 2016, Australian Industry Report, viewed 15 August 2017: https://industry.gov.au/Office-of-the-Chief Economist/Publications/AustralianIndustryReport/assets/Australian-Industry-Report-2016.pdf.
27. The Australian Government Productivity Commission 2016, Digital Disruption What do governments need to do?, viewed 2 August 2017: http://www.pc.gov.au/research/completed/digital-disruption/digital-disruption-research-paper.pdf.
28. Ibid.
29. Ibid.
30. Ibid.
31. Durrant-Whyte, H. 2016, Rise of the machine, Australian Academy of Science, Australian National University, viewed 20 August 2017: https://www.science.org.au/news-and-events/events/public-speaker-series/bots-bacteria-booze-science-everyday/rise-machines.
32. Ibid.
THEMcKellInstitute
73
Mapping Opportunity: A National Index on Wages and IncomeTHEMcKellInstitute
33. PwC (PricewaterhouseCoopers) 2015, A Smart Move – Future Proofing Australia’s Workforce by Growing Skills in Science, Technology, Engineering and Maths (STEM), viewed 15 August 2017: https://www.pwc.com.au/pdf/a-smart-move-pwc-stem-report-april-2015.pdf.
34. Ibid.
35. Minifie, J 2016, Peer-to-Peer Pressure – Policy for the Sharing Economy, Grattan Institute, viewed 25 August 2017: https://grattan.edu.au/wp-content/uploads/2016/04/871-Peer-to-peer-pressure.pdf.
36. Ibid.
37. Committee for Economic Development of Australia (CEDA) 2015, Australia’s Future Workforce, viewed 22 August 2017: https://cica.org.au/wp-content/uploads/Australias-future-workforce.pdf.
38. Ibid.
39. Ibid.
40. Ibid.
41. Ibid.
42. Stiglitz, J 2012, The Price of Inequality.
43. Martinez et al 2017, A journal of applied economics and policy, Economic Papers.
44. Ibid.
45. The Australian Bureau of Statistics 2014, Financial Stress Indicators, viewed 2 September 2017: http://www.abs.gov.au/ausstats/[email protected]/Lookup/by%20Subject/6523.0~2013-14~Main%20Features~Financial%20Stress%20Indicators~33.
46. Kearney, M S & Levine P B 2015, Economic despair: The vicious cycle of inequality and social mobility, Brookings Institution Social Mobility memos, viewed 1 September 2017: https://www.brookings.edu/blog/social-mobility-memos/2015/05/29/economic-despair-the-vicious-circle-of-inequality-and-social-mobility/.
47. The McKell Institute, No Mind Left Behind, viewed 16 August 2017: https://mckellinstitute.org.au/research/reports/no-mind-left-behind/.
48. Harmon, C et al 1999, A Review of Estimates of the Schooling/Earnings Relationship, with Tests for Publication Bias, Labour Economics, Vol 6, pp. 453-470, viewed on 1 September 2017: https://www.researchgate.net/profile/Hessel_Oosterbeek/publication/4899002_A_Review_of_Estimates_of_the_SchoolingEarnings_Relationship_With_Tests_For_Publication_Bias/links/53f473880cf2888a7490f727/A-Review-of-Estimates-of-the-Schooling-Earnings-Relationship-With-Tests-For-Publication-Bias.pdf.
49. Ibid.
50. Ibid.
51. Whiteford, P 2013, Australia: Inequality and prosperity
and their impacts in a radical welfare state, Social Policy Action Research Centre, Australian National University, viewed 30 July 2017: https://crawford.anu.edu.au/pdf/events/2013/8801/Whiteford-Australia-Inequality-and-Prosperity-final.pdf.
52. Wilkins R 2017, Home ownership falling, debts rising- it’s looking grim for the under 40s, The Conversation Australia, viewed 2 September 2017: https://theconversation.com/home-ownership-falling-debts-rising-its-looking-grim-for-the-under-40s-81619.
53. Leigh, A 2008, Returns to Education in Australia, Economic Papers, The Economic Society of Australia, Vol 27, pp 233-249, viewed 17 August 2017, https://www.rse.anu.edu.au/researchpapers/CEPR/DP561.pdf.
54. Chiswick, B R & Miller, P W, 1995. The endogeneity between language and earnings: International analyses, Journal of Labor Economics, Vol 13, pp.246-288, viewed 5 September 2017: http://www.journals.uchicago.edu/doi/abs/10.1086/298374.
55. Ibid.
56. Bleakley, H & Chin, A 2012, Age at arrival, English proficiency, and social assimilation among US immigrants, American Economic Journal, Applied Economics, Vol 2, p 165, viewed 25 August 2017, https://www.ncbi.nlm.nih.gov/pmc/articles/PMC2813069/.
57. Ibid.
58. ACOSS 2015, Inequality in Australia, viewed 15 August 2017: http://trove.nla.gov.au/work/193613609?selectedversion=NBD54918777.
59. Rampino, T et al 2017, The inequality you can’t change that lasts a lifetime, The Conversation Australia, viewed 30 August 2017: https://theconversation.com/the-inequality-you-cant-change-that-lasts-a-lifetime-82153.
60. Harmon, C et al 2013, The impact of parental income and education on the schooling of their children, Journal of Labor Economics, Vol 2, pp 1-22, viewed 6 September 2017, https://link.springer.com/article/10.1186/2193-8997-2-8.
61. The Opportunity Nation 2016, Opportunity Index Technical Guide, viewed 15 August 2017: http://opportunityindex.org/wp-content/uploads/2013/09/Create_Your_Own_Index_Toolkit.pdf.
62. Forbes 2014, The biggest reason for income inequality is single parenthood, viewed 1 August 2017: https://www.forbes.com/sites/theapothecary/2014/11/19/the-biggest-reason-for-income-inequality-is-single-parenthood/#53e1bb652555.
63. Ross, R & Saunders, P 1993, The labor supply behaviour of sole mothers and married mothers in Australia: Evidence from the 1986 income distribution survey, Australian Economic Papers, Vol 32, pp 116-133,viewed 29 August 2017: http://onlinelibrary.wiley.com/doi/10.1111/j.1467-8454.1993.tb00134.x/full.
THEMcKellInstitute
74
T H E M C K E L L I N S T I T U T E
References CONTINUED
64. Ibid.
65. DiMaggio, P et al 2004, From unequal access to differentiated use: A literature review and agenda for research on digital inequality, Social inequality, pp.355-400, viewed 16 August 2017: https://pdfs.semanticscholar.org/4b80/e96eb81f92eeacc978a48436c0ed9b820b6f.pdf.
66. Ibid.
67. DiMaggio, P & Bonikowski, B 2008, Make money surfing the web? The impact of Internet use on the earnings of US workers, American Sociological Review, Vol 73, pp.227-250, viewed 18 August 2017: http://www.russellsage.org/sites/all/files/u4/Bonikowski%20&%20DiMaggio_Make%20Money%20Surfing%20the%20Web.pdf.
68. Ibid.
69. Ibid.
70. Ibid.
71. Ibid.
72. Unions NSW, Lighting up the black market, viewed 20 October 2017: http://www.wagethieves.com.au/wp/wp-content/uploads/2017/07/Unions-NSW-Wage-Theft-Lighting-Up-The-Black-Market.pdf.
73. Australian Bureau of Statistics, Census 2016, viewed 10 November 2017: http://www.abs.gov.au/websitedbs/D3310114.nsf/Home/Census.
74. Ibid.
75. Ibid.
76. Borland, J 1995, Employment and income in Australia: does the neighbourhood dimension matter ?, Australian Bulletin of Labour, Vol 21, p 281, viewed 30 August 2017: http://search.informit.com.au/documentSummary;dn=960605612;res=IELAPA.
77. Hunter, B 1996, Explaining changes in the social structure of employment: the importance of geography, viewed 5 September 2017: https://ideas.repec.org/p/wop/sprcdp/0067.html.
78. Ibid.

75
THEMcKellInstitute
Mapping Opportunity: A National Index on Wages and Income
THEMcKellInstitute

76
T H E M C K E L L I N S T I T U T E
THEMcKellInstitute
THEMcKellInstitute
CONTACT THE MCKELL INSTITUTE
T. (02) 9113 0944 F. (02) 9113 0949 E. [email protected] PO Box 21552, World Square NSW 2002
@McKellInstitute www.facebook.com/mckellinstitutewww.mckellinstitute.org.au