Embed Size (px)
Citation preview
MC/INF/295 Original: English 15 October 2009
NINETY-EIGHTH SESSION _________________________________________________________________________
REPORT ON HUMAN RESOURCES MANAGEMENT
MC/INF/295 Page i
CONTENTS
Page I. INTRODUCTION ………………………………………………………..……... 1 II. IOM STAFF …………………………………………………………..………….. 1 New Director of HRM ………….………………………………………………… 1
Vacancies and placements ……………………..…………………………………. 1
Associate Experts ….….………………………………………………………….. 2
Staff exchanges, secondments and loans ………...……………………………….. 2
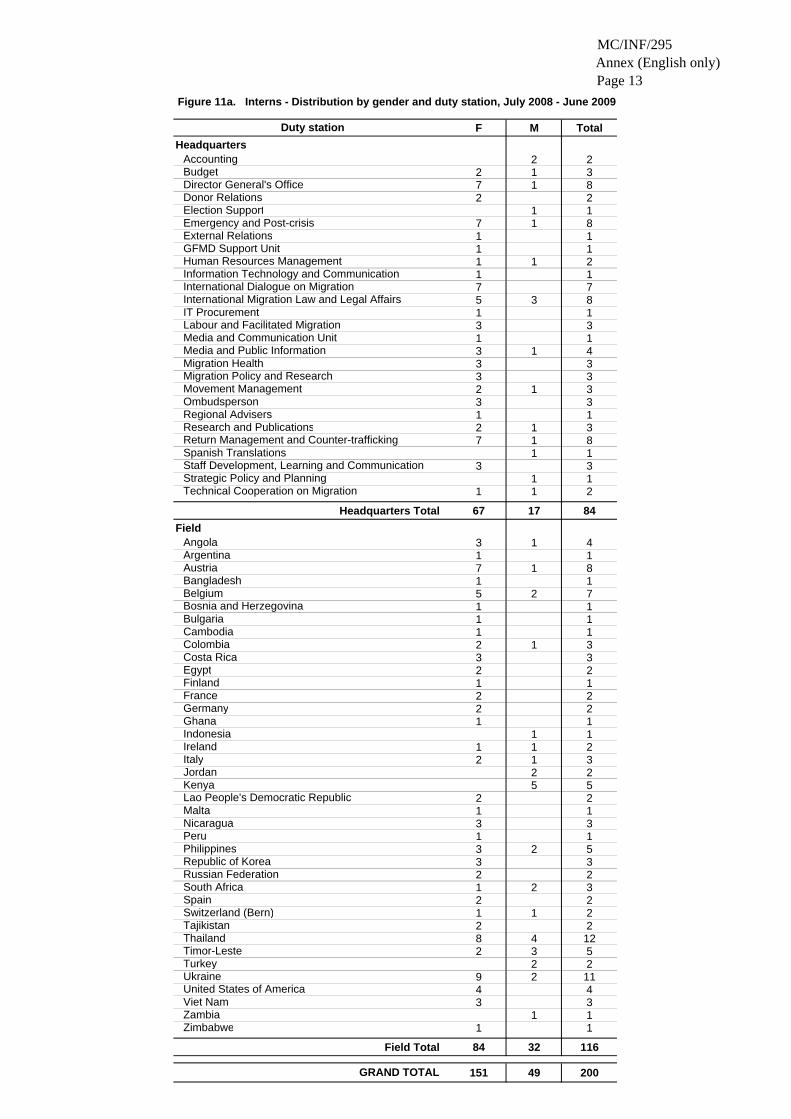
Internships ……...………………………………………..……………………….. 2
Rotation ………...………………………………………..……………………….. 2 III. EFFECTIVE HUMAN RESOURCES SERVICE DELIVERY …………….. 3 HRM policy and services ………………………………...………………………. 3
Staff well-being, health insurance and improved working conditions ……..……. 4
Staff relations …….………………………………………………………………. 4
Staff Development and Learning …….…………………………………………… 5 ANNEX - Statistical Overview
MC/INF/295 Page 1
REPORT ON HUMAN RESOURCES MANAGEMENT I. INTRODUCTION 1. During the reporting period, the Organization experienced a further increase in the number of projects, and this resulted in staff strength worldwide increasing by another 11 per cent, from 6,873 in June 2008 to 7,735 at the end of June 2009. 2. During the same period, key developments at Human Resources Management (HRM) included: • the arrival of a new Director of HRM;
• a review of the Staff Regulations;
• the production of the “Welcome to IOM” package to facilitate staff induction;
• the extension of health insurance coverage to local staff worldwide;
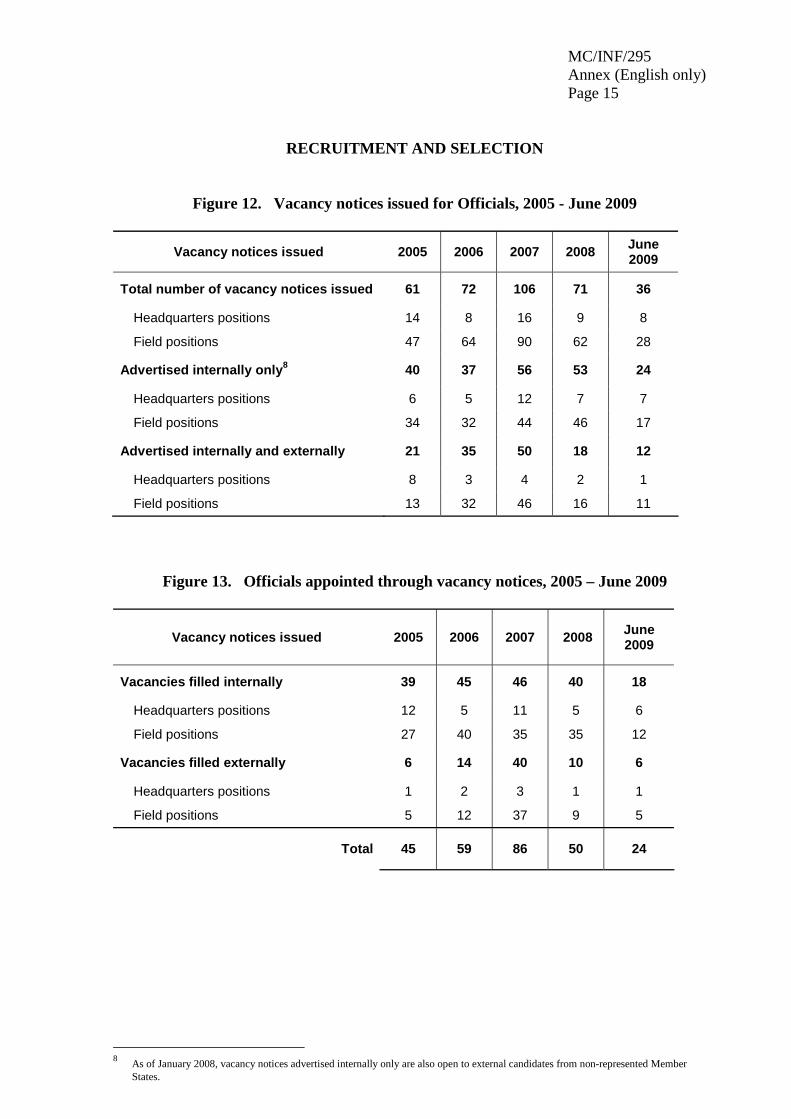
• the implementation of staff rotation and the incorporation of lessons learned. II. IOM STAFF New Director of HRM 3. The new Director of Human Resources Management joined IOM in December 2008. He is expected to have the requisite objective and fresh outlook on human resources management, and the potential to make human resource policy and strategic changes and to formulate recommendations for the Director General in order to further strengthen one of the most important areas of the Organization. Vacancies and placements 4. The Recruitment Unit continued to focus on streamlining IOM’s selection processes and enhancing its talent management tool to respond to the need for speedy and effective recruitment, while upholding IOM’s principles of equal opportunity, transparency and fairness. Between July 2008 and June 2009, IOM issued 36 vacancy notices and recruited or placed 24 staff members through internal (18) and external (6) advertisements. Furthermore, three vacancy notices were placed for General Service staff at Headquarters and 19 short-term vacancy notices for Officials. The figures show that internal candidates have the qualifications and experience needed to fill vacancies (see Annex, Figures 131 and 16).
1 Figure 13 compares the number of vacancies for Officials worldwide and Employees at Headquarters
filled by internal and external candidates.
MC/INF/295 Page 2
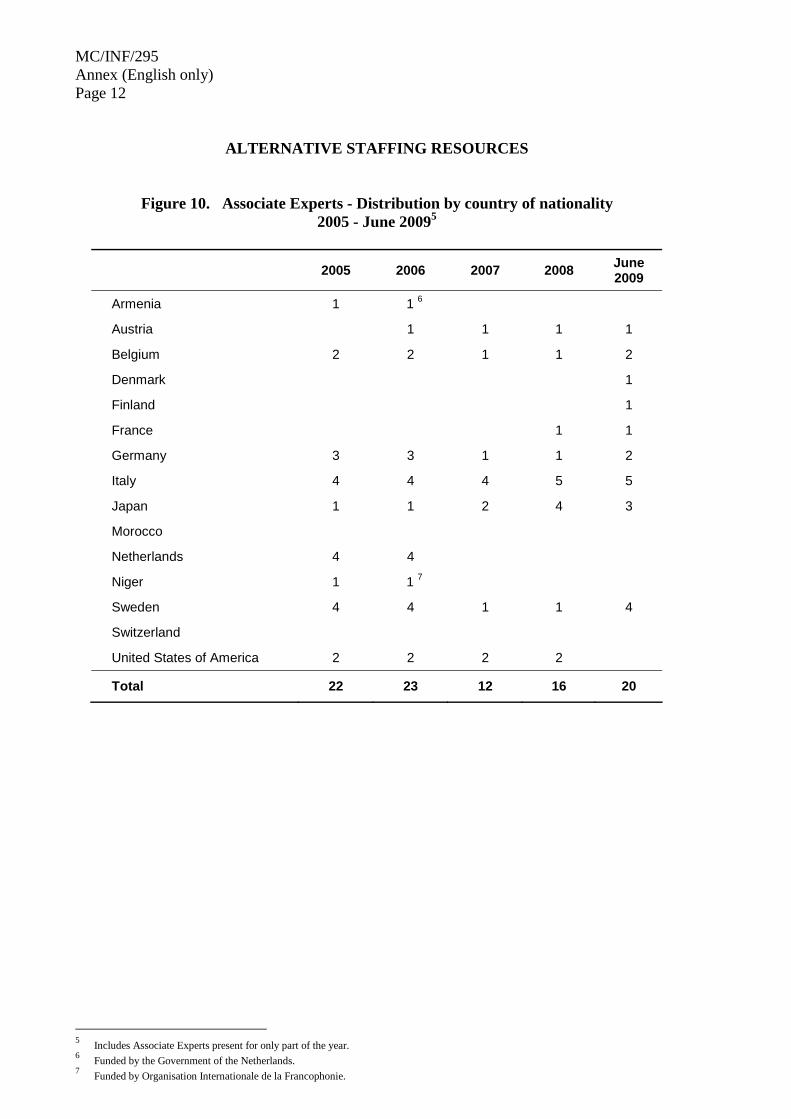
Associate Experts 5. IOM’s Associate Expert programme continues to expand. The Organization presently has 16 agreements with various donors, including a newly signed agreement with the Government of Norway. Five new Associate Experts joined IOM in the first semester of 2009, funded by Austria, Denmark and Sweden. The number of Associate Experts remains consistently high, with a total of 27 working at IOM during the reporting period. Ongoing efforts to encourage donor countries to fund Associate Experts from developing countries will result in an Associate Expert who is a national of Zimbabwe and funded by the Italian Government joining the Migration Policy and Research Department. During the reporting period IOM retained six Associate Experts as Officials of the Organization once their assignment had ended.
Staff exchanges, secondments and loans 6. During the reporting period 19 staff members were seconded to or from IOM. The secondments to IOM comprised one person from the Danish Refugee Council to work in emergency programmes in Myanmar, and 11 people from SYNI2 to Headquarters and five from SYNI to the Field (four to Chisinau and one to Belgrade) to work in migration research, gender, media and external relations. IOM loaned one staff member to the Global Forum on Migration and Development, another to the International Labour Organization (ILO) and a third to the North Atlantic Treaty Organization. It is discussing the secondment of a senior IOM migration health official to the WHO Health Action in Crises Cluster, to enhance joint programme efficiency and supplement the operational and conceptual capacities of both parties. The secondment is expected to start in August 2010. Internships 7. The IOM internship programme continues to expand both at Headquarters and in the Field, providing mutually rewarding learning experiences and opportunities for both the talented young professionals involved and the Organization. During the reporting period IOM hosted 200 interns (84 at Headquarters and 116 in the Field) from a wide range of educational and national backgrounds. In addition, a new agreement has recently been signed with the McGill University Faculty of Medicine/School of Nursing to host a graduate student in migration and health activities. During the reporting period 9 interns were retained on special contracts. Rotation 8. In 2009 steps were taken to clear the fairly large back-log of staff members due for rotation, with the Administration assigning 69 of the 123 staff members up for rotation to another location. Further rotations are expected to take place during the second half of 2009 and in 2010. A few pending cases will be reviewed during the last quarter of 2009 2 SYNI is a non-profit professional project carried out by Lausanne City Council that offers motivated
professionals the possibility of participating in formative international cooperation assignments in Switzerland and abroad. To that end it facilitates short-term subsidized assignments to Swiss resident professionals interested in acquiring international working experience. SYNI is funded and commissioned by the Swiss State Secretariat for Economic Affairs (SECO) and Lausanne City Council.
MC/INF/295 Page 3
and the next cycle of rotations, which will begin in July 2010. Several meetings have been held, and others are planned, between the Administration, the Staff Association Committee and senior managers concerning rotation and to draw on the lessons learned. The aim is to improve rotation’s potential to enhance staff career development and to match operational needs with potential candidates, subject to rotation, through a consultative process. A new software, the Rotation Management System, is being developed for the same purpose. It is expected to be completed for the next cycle of rotations. III. EFFECTIVE HUMAN RESOURCES SERVICE DELIVERY 9. In order to provide appropriate and relevant services to IOM staff and operations, HRM strives constantly to improve; applying lessons learned and best human resource practices. Some of these are illustrated below. (a) The Policy, Standards and Quality Control Unit at Headquarters is working on a
system of checks and balances to ensure the integrity and validity of human resources data and information, which are key to making informed decisions (i.e. checking on data structure and content so they reflect the policy being implemented).
(b) Key Performance Indicators (KPIs), such as quick and effective responses to
personnel queries, were implemented in HRM Manila and Headquarters, giving HRM a “dashboard” for monitoring and adjusting its operational activities. A minimum timeframe has been established for responding to queries.
(c) In 2009 the financial information system (PRISM FI) and the human resources
information system (PRISM HR) were fully integrated to ensure that the flow of financial and human resource information is accurate and reliable. The Personnel Administration and Payroll Units in HRM Manila tested and adjusted the system to ensure minimal disruption to human resource activities during the integration. Furthermore, HRM units in Manila and Panama working in close consultation with Headquarters and the information technology team, identified the system functionality upgrades required for the PRISM payroll roll-out.
HRM policy and services (a) HRM developed the “Welcome to IOM” package for new staff. The package
comprises three booklets: one containing general information on IOM, a second on staff entitlements and a third on the specific conditions that apply to each IOM Field Office.
(b) During the reporting period, the Human Resources Policy Unit, working in
coordination with the Legal Affairs Department and the Staff Association Committee, reviewed the Staff Regulations that apply to Officials and those that apply to Headquarters Employees and prepared a new, unified version that applies to all IOM staff at Headquarters and in the Field.
MC/INF/295 Page 4
(c) The Occupational Health Unit developed policies on staff well-being in the workplace in respect of physical or mental risks, specifically in relation to measures to prevent tuberculosis infection among IOM health care workers and reduce staff exposure to the virus.
10. HRM staff members traveled to a number of IOM Field Offices – in Egypt, the Syrian Arab Republic, Jordan, Nepal, Sri Lanka, Colombia, Myanmar, Thailand, Sudan, Panama and the Mindanao region in the Philippines - to provide support for human resource activities such as recruitment, training, personnel administration, capacity-building and staff management. Staff well-being, health insurance and improved working conditions (a) Agreements were concluded with major hospitals in the Philippines, Nepal,
Pakistan, the United Republic of Tanzania and Italy to facilitate admission procedures and improve the cost effectiveness of health services. Other agreements are being negotiated in other IOM Field locations.
(b) In order to be medically prepared for epidemics, IOM staff travelling on duty were
given vaccinations and medical kits and support was provided to Field Offices exposed to epidemics. The Administration has been working in close coordination with WHO to prepare for the possibility of an H1N1 outbreak among IOM staff and dependants.
(c) The extension of health insurance coverage (MSP) and of regular periodic medical
exams for local staff worldwide is in its final phase. The Health Claims and Processing Unit recently established at the Panama Administrative Centre is functioning well, helping IOM Field Offices in Africa and the Americas file health claims. The MSP has now been rolled out to all Field Offices worldwide, with 29 new Field Offices (1,753 participants) joining in 2009. A total of 105 Field Offices are now enrolled, with 5,325 participants (staff member and eligible dependents).
Staff relations (a) HRM worked closely with the Staff Association Committee throughout the
reporting period, particularly in a series of Joint Administration and Staff Association Committee meetings that sought to address staff matters in a constructive fashion. During the reporting period HRM and the Staff Association Committee met six times.
(b) The Director of HRM and the Ombudsperson now meet weekly to discuss
individual staff complaints with HRM implications. Together they have looked into conflict management within the Organization and are developing policies with respect thereto. HRM is encouraging Chiefs of Mission to manage conflicts more effectively. To this effect, a number of case studies have been developed in collaboration with the Ombudsperson and will be included in the next training workshop for Chiefs of Mission.
MC/INF/295 Page 5
(c) As concerns staff grievances, the Joint Administrative Review Board received three appeals in the twelve months ending on 30 June 2009, and one complaint was filed with the ILO Administrative Tribunal.
Staff Development and Learning (a) In 2009, Phase 2 of IOM’s Project Management Training Package was transferred
to Field locations in order to facilitate staff access to it and to reduce travel costs. While four sessions had been organized in Geneva in 2008, five sessions are planned for 2009, one in Geneva and four in the Field (specifically Manila and Brussels in February and March, and Panama and Nairobi in the second half of 2009).
(b) A new programme, Public Speaking and Presentation Skills, was designed and
launched in the first half of 2009 to enhance the ability of all IOM staff at all levels to present the Organization in a professional manner to all target groups. Similarly, a new training-of-trainers programme focusing on project development augmented the pool of IOM project development trainers to 20, ensuring that IOM’s efforts to develop good quality projects could draw on a sustainable source of trainers.
(c) During the reporting period, the Staff Development and Learning Unit played an
instrumental role in the organization of the Director General’s regional meetings with IOM Chiefs of Mission in the second half of 2008 and first quarter of 2009 and facilitated the selection of the specialized provider for the first organization-wide satisfaction survey in early 2009.
(d) The Performance Development System is under review and plans are being made to
develop a career development system. (e) The Unit has also had reference training material translated into Spanish to
facilitate communication with IOM staff in the Organization’s Spanish-speaking Field Offices.
11. IOM’s staff are its most valuable asset, and HRM therefore plans further to enhance working conditions and hone the Organization’s ethics and values by communicating more transparently and frequently with staff on human resource matters, furthering career development and ensuring that the staff development system is applied in a systematic, fair and equitable manner throughout the Organization to all categories of staff.
MC/INF/295 Annex (English only) Page 1
Annex
STATISTICAL OVERVIEW
IOM STAFF COMPOSITION ………..……………………………………………… 2 Figure 1 IOM Field locations, 2005-2009 ……………………….……….……….. 2 Figure 2 IOM staffing trends, 2005-2009 ………………………………………… 2 Figure 3 IOM staff – Distribution by category, location and gender, June 2009 …. 3 Figure 4 Officials - Distribution by gender and category/grade, 2005-2009 ….…. 3 Figure 5 Distribution by gender and category/grade, June 2009 (Officials
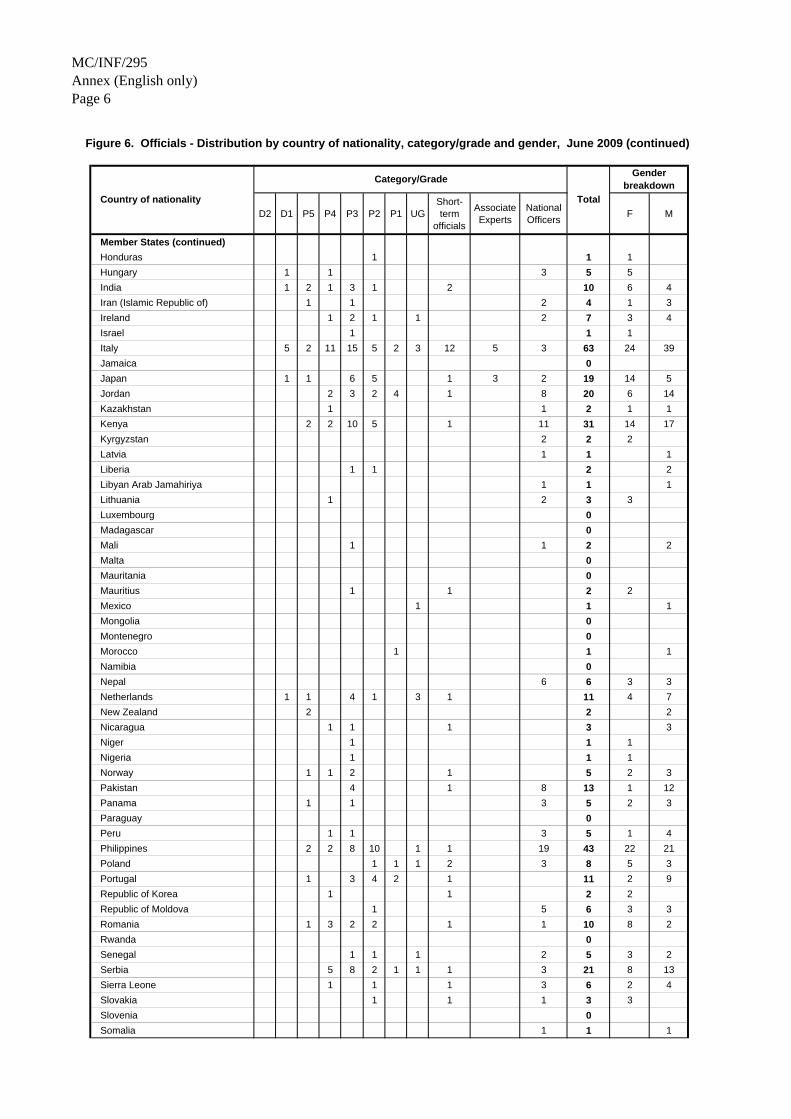
and Headquarters General Service staff) ………………………………... 4 Figure 6 Officials - Distribution by country of nationality, category/grade
and gender, June 2009 ………..………………………………………… 5 Figure 7 General Service staff - Distribution by category/grade and
gender, June 2009 ………………………………………………..……… 8 Figure 8 Headquarters General Service staff - Distribution by country
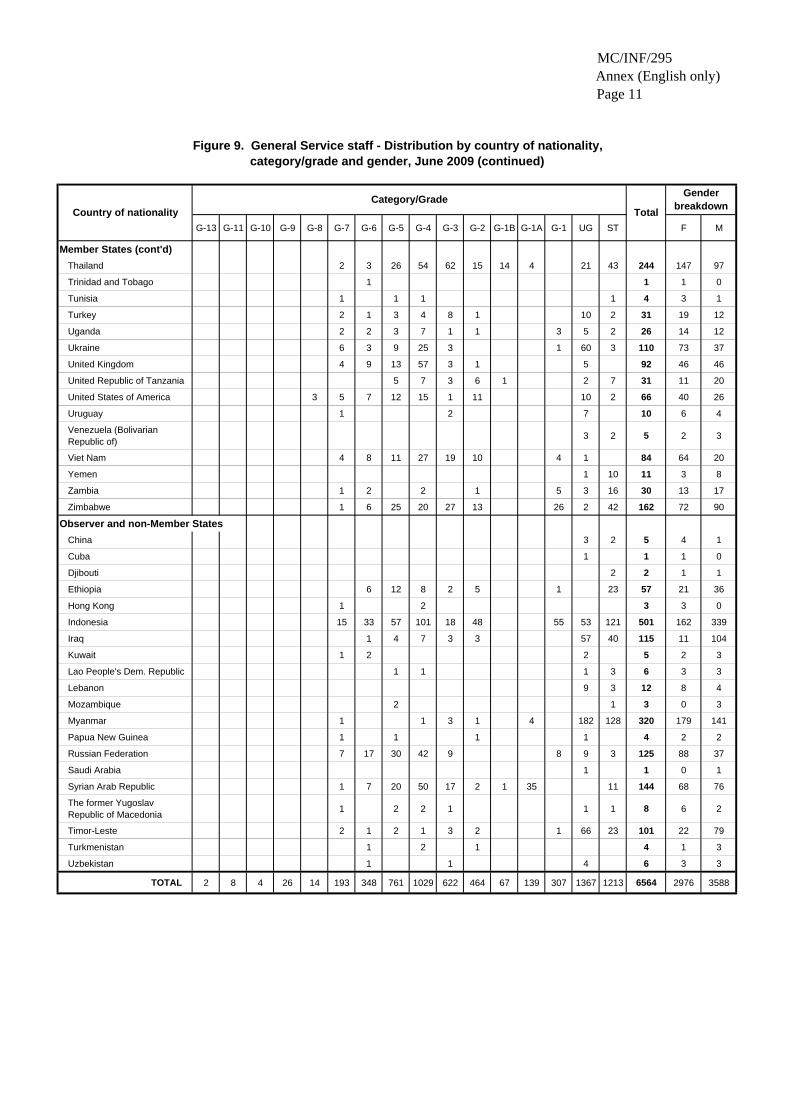
of nationality and gender, June 2009 ……………………………..…….. 8 Figure 9 General Service staff - Distribution by country of nationality,
category/grade and gender, June 2009 ..………………………………… 9 ALTERNATIVE STAFFING RESOURCES ……………………………...………….. 12 Figure 10 Associate Experts - Distribution by country of nationality,
2005 - June 2009 …..……………………………………………………. 12 Figure 11a Interns - Distribution by gender and duty station,
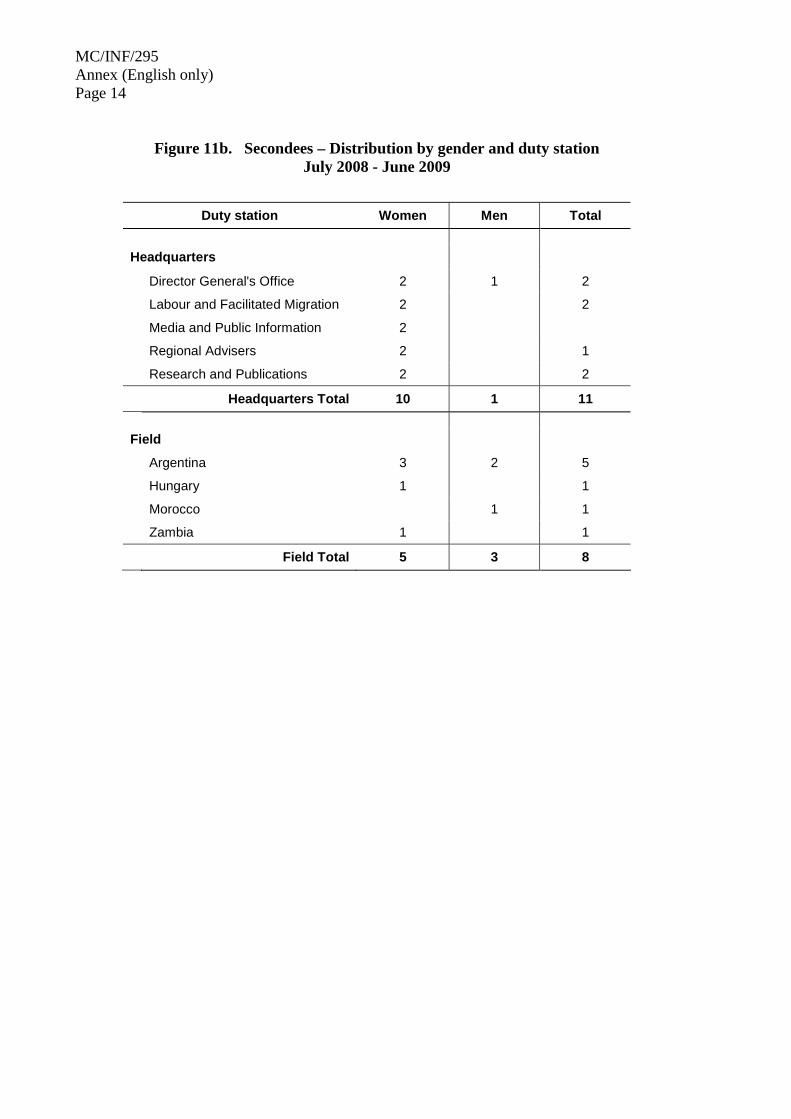
July 2008 - June 2009 ……..……………………………………………. 13 Figure 11b Secondees – Distribution by gender and duty station,
July 2008 - June 2009 …………………………………………………... 14 RECRUITMENT AND SELECTION ……………………………………….………. 15 Figure 12 Vacancy notices issued for Officials, 2005 - June 2009 .…..…………… 15 Figure 13 Officials appointed through vacancy notices,
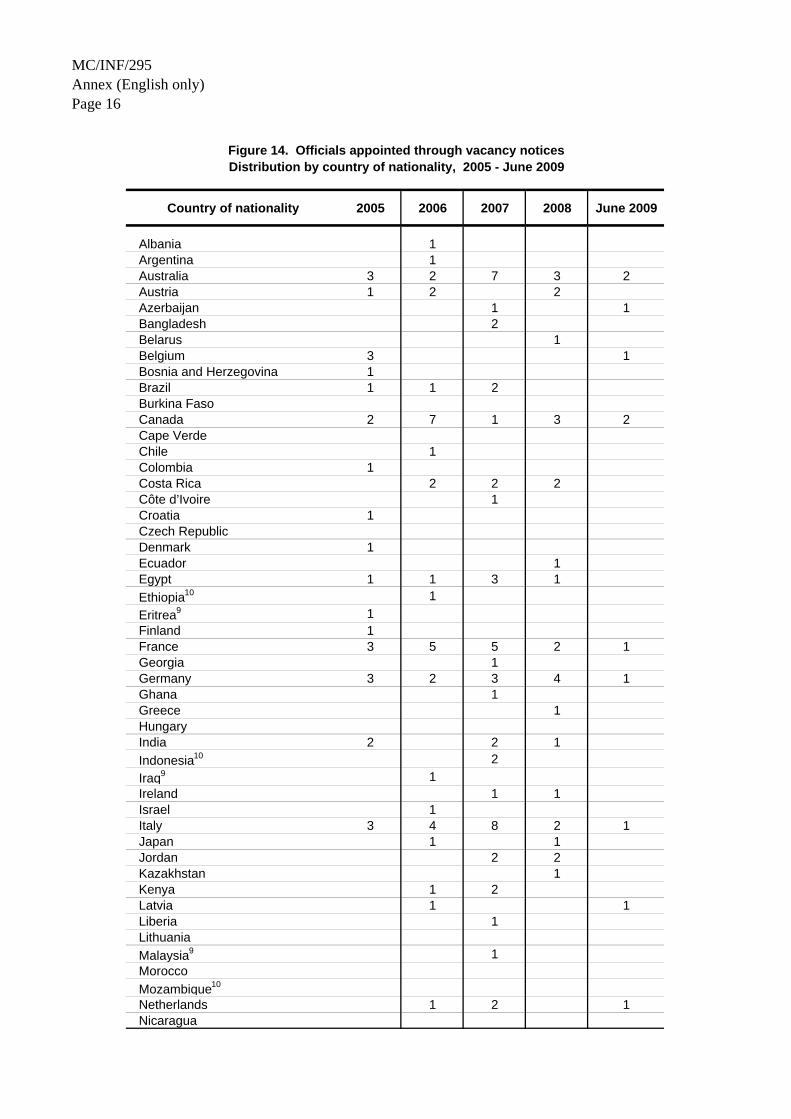
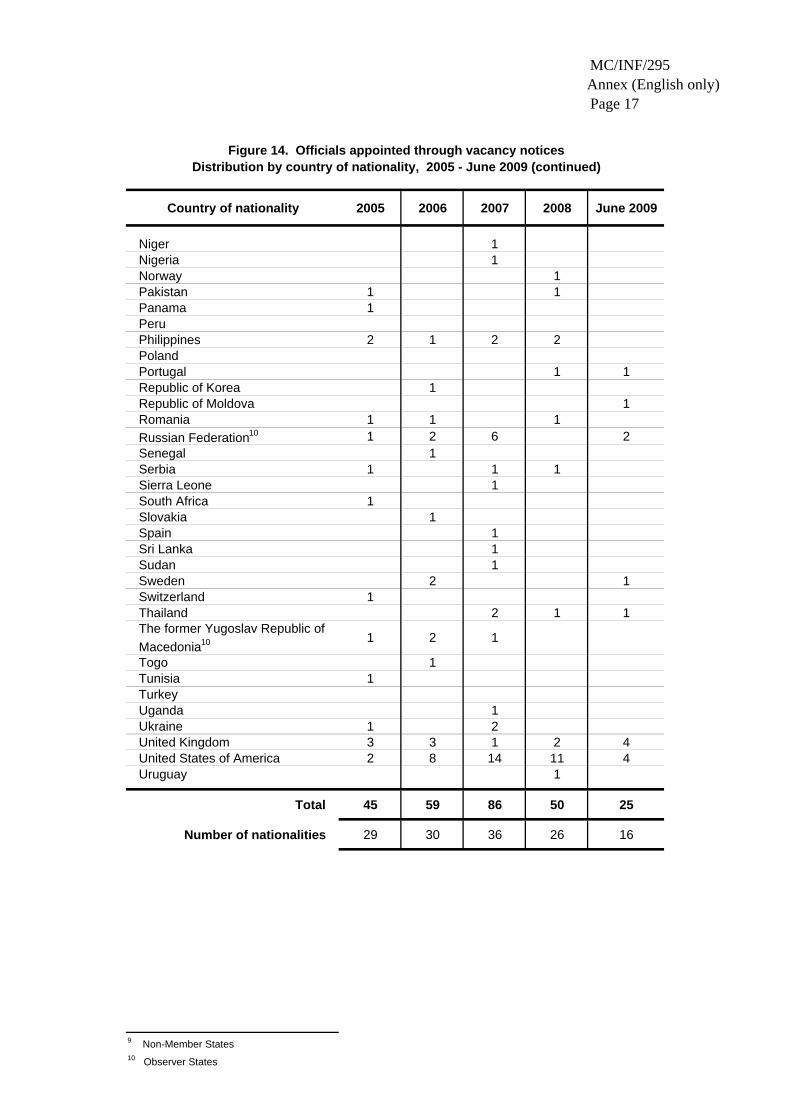
2005 - June 2009 ………………………………………………………… 15 Figure 14 Officials appointed through vacancy notices – Distribution by
country of nationality, 2005 - June 2009 ….…..……………………….. 16 Figure 15 Vacancy notices issued for Employees at Headquarters,
2005 - June 2009 ………………………………………………………… 18 Figure 16 Mobility of internal staff, 2005 - June 2009 ….…..…………………….. 18 Figure 17 Temporary recruitment and selection, 2005 - June 2009 ….….………... 18 STAFF DEVELOPMENT AND LEARNING ….…………………………………… 19 Figure 18 Staff development and learning activities, 2005 - June 2009 …..………. 19 Figure 19 Staff trained – Distribution by gender, 2005 - June 2009 …..………….. 19 Figure 20 Staff trained – Distribution by location, 2005 - June 2009 …..………… 20 Figure 21 Staff trained – Distribution by category, 2005 - June 2009 …....….……. 20 Figure 22 Regional distribution, January – June 2009 ….……………….………… 21 Figure 23 Staff trained – Distribution by main areas of learning and
development and gender, January - June 2009 …………….…………… 21
MC/INF/295 Annex (English only) Page 2
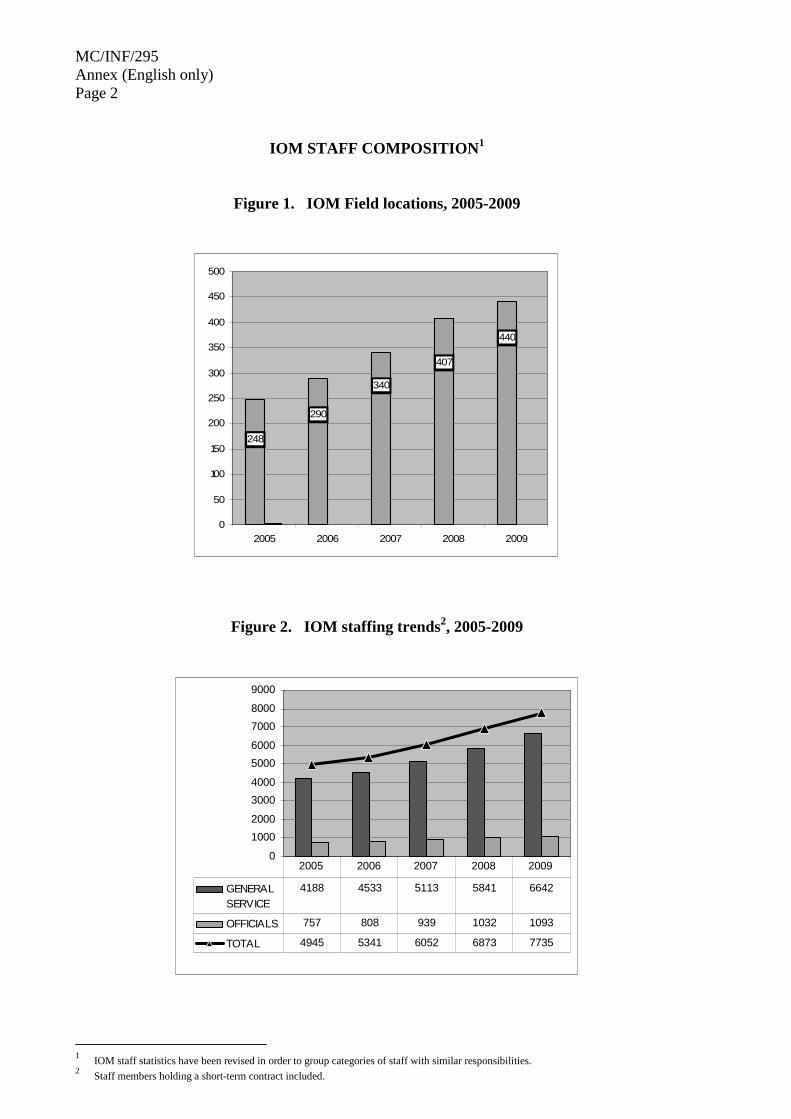
IOM STAFF COMPOSITION1
Figure 1. IOM Field locations, 2005-2009
440
407
340
290
248
0
50
100
150
200
250
300
350
400
450
500
2005 2006 2007 2008 2009
Figure 2. IOM staffing trends2, 2005-2009
0
10002000
30004000
50006000
70008000
9000
GENERALSERVICE
4188 4533 5113 5841 6642
OFFICIALS 757 808 939 1032 1093
TOTAL 4945 5341 6052 6873 7735
2005 2006 2007 2008 2009
1 IOM staff statistics have been revised in order to group categories of staff with similar responsibilities. 2 Staff members holding a short-term contract included.
MC/INF/295 Annex (English only) Page 3
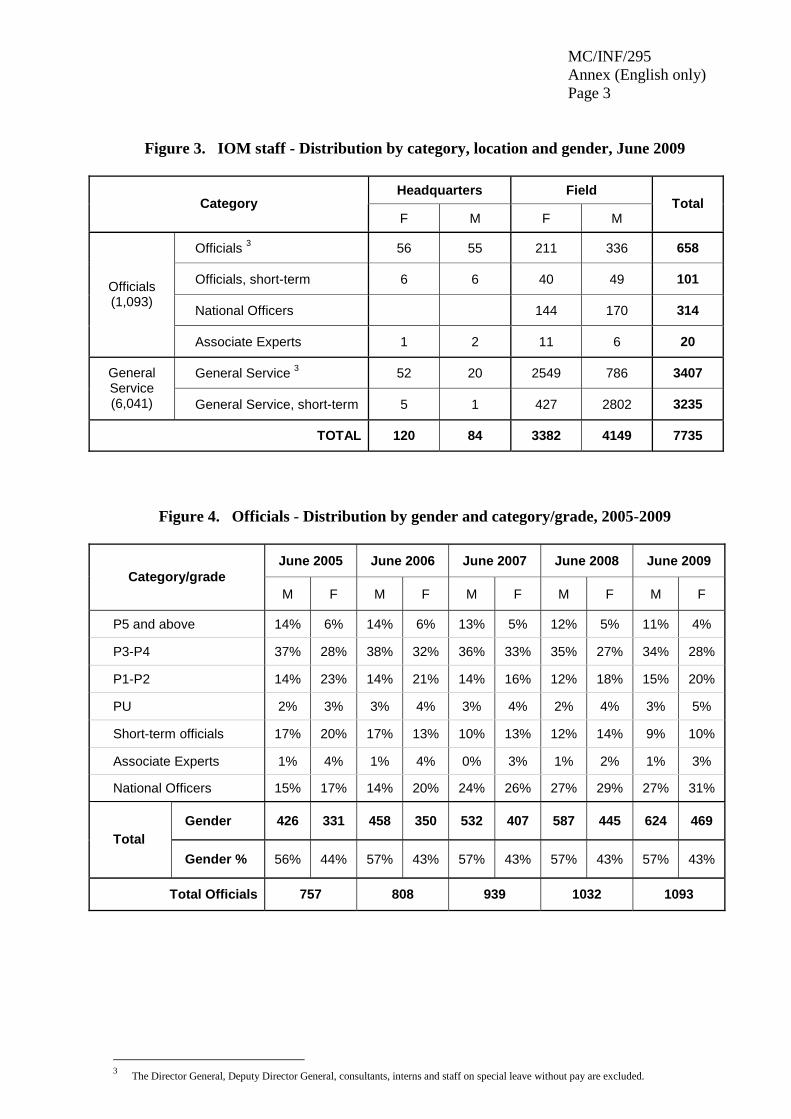
Figure 3. IOM staff - Distribution by category, location and gender, June 2009
Headquarters Field Category
F M F M Total
Officials 3 56 55 211 336 658
Officials, short-term 6 6 40 49 101
National Officers 144 170 314
Officials (1,093)
Associate Experts 1 2 11 6 20
General Service 3 52 20 2549 786 3407 General Service (6,041) General Service, short-term 5 1 427 2802 3235
TOTAL 120 84 3382 4149 7735
Figure 4. Officials - Distribution by gender and category/grade, 2005-2009
June 2005 June 2006 June 2007 June 2008 June 2009 Category/grade
M F M F M F M F M F
P5 and above 14% 6% 14% 6% 13% 5% 12% 5% 11% 4%
P3-P4 37% 28% 38% 32% 36% 33% 35% 27% 34% 28%
P1-P2 14% 23% 14% 21% 14% 16% 12% 18% 15% 20%
PU 2% 3% 3% 4% 3% 4% 2% 4% 3% 5%
Short-term officials 17% 20% 17% 13% 10% 13% 12% 14% 9% 10%
Associate Experts 1% 4% 1% 4% 0% 3% 1% 2% 1% 3%
National Officers 15% 17% 14% 20% 24% 26% 27% 29% 27% 31%
Gender 426 331 458 350 532 407 587 445 624 469 Total
Gender % 56% 44% 57% 43% 57% 43% 57% 43% 57% 43%
Total Officials 757 808 939 1032 1093
3 The Director General, Deputy Director General, consultants, interns and staff on special leave without pay are excluded.
MC/INF/295 Annex (English only) Page 4
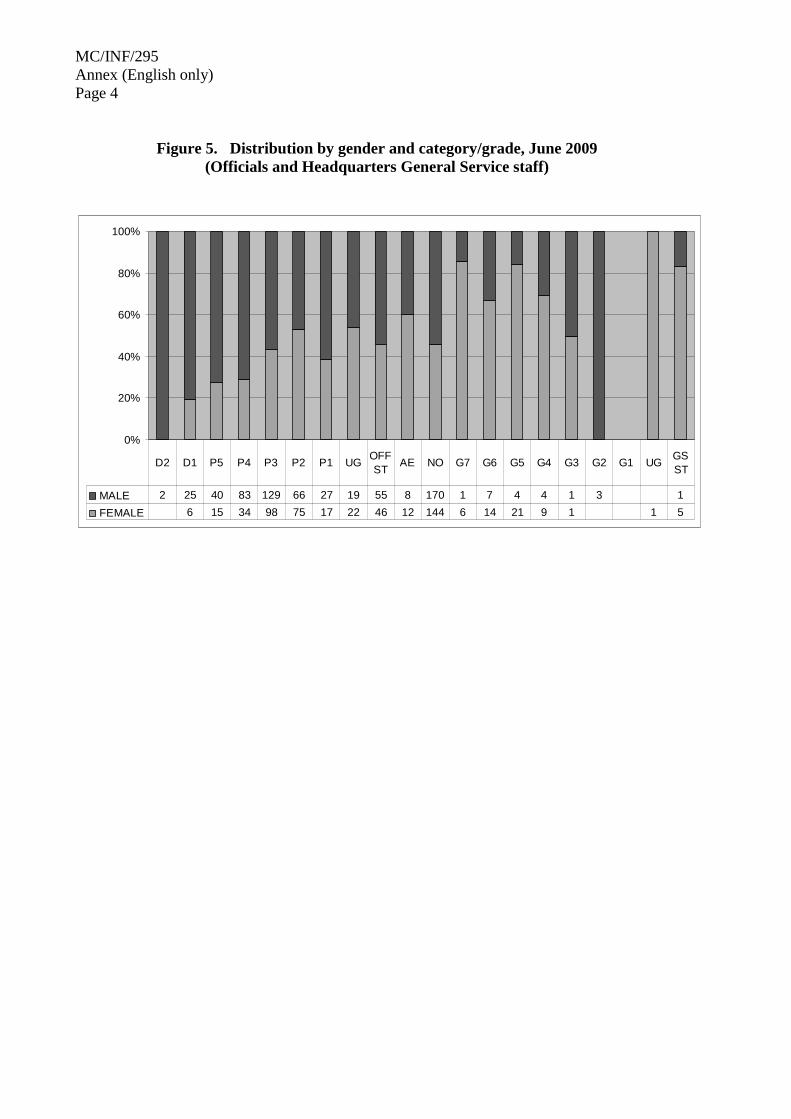
Figure 5. Distribution by gender and category/grade, June 2009 (Officials and Headquarters General Service staff)
0%
20%
40%
60%
80%
100%
MALE 2 25 40 83 129 66 27 19 55 8 170 1 7 4 4 1 3 1FEMALE 6 15 34 98 75 17 22 46 12 144 6 14 21 9 1 1 5
D2 D1 P5 P4 P3 P2 P1 UG OFF ST AE NO G7 G6 G5 G4 G3 G2 G1 UG GS
ST
MC/INF/295Annex (English only)Page 5
D2 D1 P5 P4 P3 P2 P1 UGShort-term
officials
Associate Experts
National Officers F M
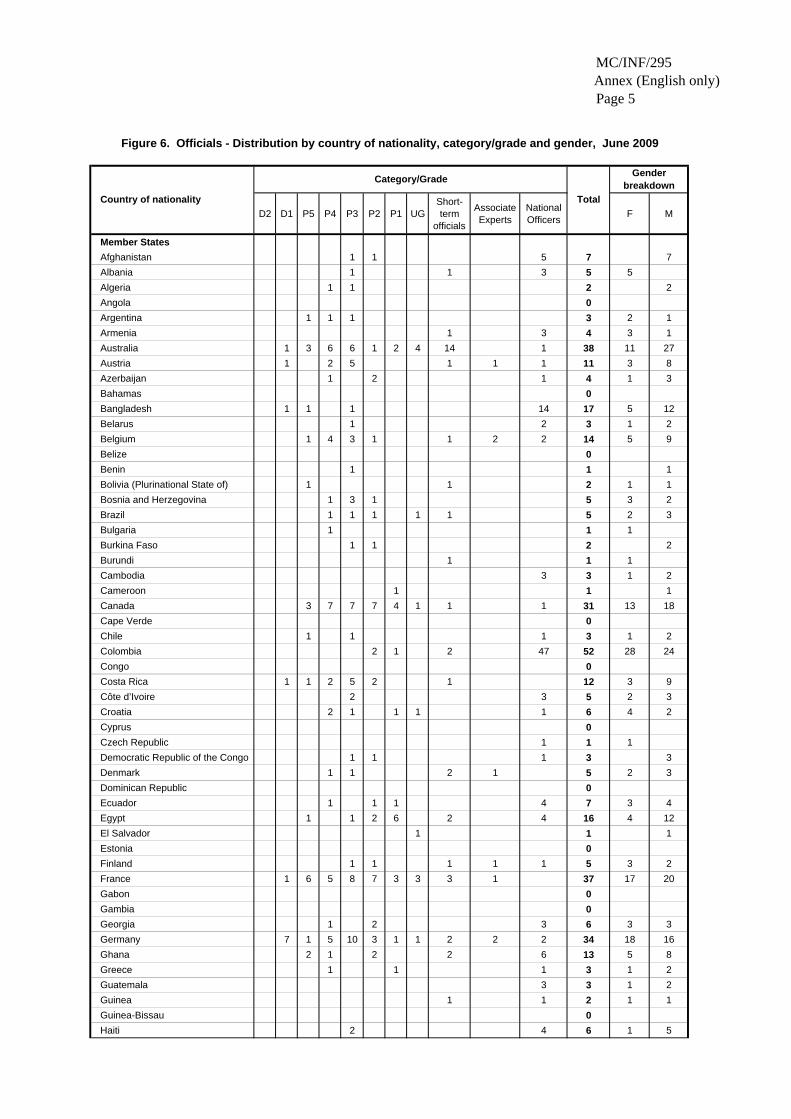
Member StatesAfghanistan 1 1 5 7 7Albania 1 1 3 5 5Algeria 1 1 2 2Angola 0Argentina 1 1 1 3 2 1Armenia 1 3 4 3 1Australia 1 3 6 6 1 2 4 14 1 38 11 27Austria 1 2 5 1 1 1 11 3 8Azerbaijan 1 2 1 4 1 3Bahamas 0Bangladesh 1 1 1 14 17 5 12Belarus 1 2 3 1 2Belgium 1 4 3 1 1 2 2 14 5 9Belize 0Benin 1 1 1Bolivia (Plurinational State of) 1 1 2 1 1Bosnia and Herzegovina 1 3 1 5 3 2Brazil 1 1 1 1 1 5 2 3Bulgaria 1 1 1Burkina Faso 1 1 2 2Burundi 1 1 1Cambodia 3 3 1 2Cameroon 1 1 1Canada 3 7 7 7 4 1 1 1 31 13 18Cape Verde 0Chile 1 1 1 3 1 2Colombia 2 1 2 47 52 28 24Congo 0Costa Rica 1 1 2 5 2 1 12 3 9Côte d’Ivoire 2 3 5 2 3Croatia 2 1 1 1 1 6 4 2Cyprus 0Czech Republic 1 1 1Democratic Republic of the Congo 1 1 1 3 3Denmark 1 1 2 1 5 2 3Dominican Republic 0Ecuador 1 1 1 4 7 3 4Egypt 1 1 2 6 2 4 16 4 12El Salvador 1 1 1Estonia 0Finland 1 1 1 1 1 5 3 2France 1 6 5 8 7 3 3 3 1 37 17 20Gabon 0Gambia 0Georgia 1 2 3 6 3 3Germany 7 1 5 10 3 1 1 2 2 2 34 18 16Ghana 2 1 2 2 6 13 5 8Greece 1 1 1 3 1 2Guatemala 3 3 1 2Guinea 1 1 2 1 1Guinea-Bissau 0Haiti 2 4 6 1 5
Figure 6. Officials - Distribution by country of nationality, category/grade and gender, June 2009
Country of nationality
Gender breakdownCategory/Grade
Total
MC/INF/295Annex (English only)Page 6
D2 D1 P5 P4 P3 P2 P1 UGShort-term
officials
Associate Experts
National Officers F M
Member States (continued)Honduras 1 1 1Hungary 1 1 3 5 5India 1 2 1 3 1 2 10 6 4Iran (Islamic Republic of) 1 1 2 4 1 3Ireland 1 2 1 1 2 7 3 4Israel 1 1 1Italy 5 2 11 15 5 2 3 12 5 3 63 24 39Jamaica 0Japan 1 1 6 5 1 3 2 19 14 5Jordan 2 3 2 4 1 8 20 6 14Kazakhstan 1 1 2 1 1Kenya 2 2 10 5 1 11 31 14 17Kyrgyzstan 2 2 2Latvia 1 1 1Liberia 1 1 2 2Libyan Arab Jamahiriya 1 1 1Lithuania 1 2 3 3Luxembourg 0Madagascar 0Mali 1 1 2 2Malta 0Mauritania 0Mauritius 1 1 2 2Mexico 1 1 1Mongolia 0Montenegro 0Morocco 1 1 1Namibia 0Nepal 6 6 3 3Netherlands 1 1 4 1 3 1 11 4 7New Zealand 2 2 2Nicaragua 1 1 1 3 3Niger 1 1 1Nigeria 1 1 1Norway 1 1 2 1 5 2 3Pakistan 4 1 8 13 1 12Panama 1 1 3 5 2 3Paraguay 0Peru 1 1 3 5 1 4Philippines 2 2 8 10 1 1 19 43 22 21Poland 1 1 1 2 3 8 5 3Portugal 1 3 4 2 1 11 2 9Republic of Korea 1 1 2 2Republic of Moldova 1 5 6 3 3Romania 1 3 2 2 1 1 10 8 2Rwanda 0Senegal 1 1 1 2 5 3 2Serbia 5 8 2 1 1 1 3 21 8 13Sierra Leone 1 1 1 3 6 2 4Slovakia 1 1 1 3 3Slovenia 0Somalia 1 1 1
Gender breakdown
Figure 6. Officials - Distribution by country of nationality, category/grade and gender, June 2009 (continued)
Country of nationality
Category/Grade
Total
MC/INF/295Annex (English only)Page 7
D2 D1 P5 P4 P3 P2 P1 UGShort-term
officials
Associate Experts
National Officers F M
Member States (continued)South Africa 3 5 8 7 1Spain 1 1 2 2 1 1 8 5 3Sri Lanka 1 1 1 1 3 7 1 6Sudan 1 1 1 15 18 3 15Sweden 1 5 2 4 12 8 4Switzerland 2 2 3 2 4 1 1 15 9 6Tajikistan 1 2 1 4 1 3Thailand 1 3 3 1 3 10 21 11 10Togo 1 1 1Trinidad and Tobago 0Tunisia 2 2 2Turkey 1 1 2 2Uganda 1 2 4 7 3 4Ukraine 2 1 1 5 9 7 2United Kingdom 1 3 8 15 3 3 6 3 42 17 25United Republic of Tanzania 1 1 1United States of America 3 8 16 25 18 7 3 14 1 95 36 59Uruguay 2 3 1 1 1 8 2 6Venezuela (Bolivarian Republic of) 1 1 2 1 1Viet Nam 1 5 6 4 2Yemen 0Zambia 0Zimbabwe 2 9 11 2 9Observers/non-Member StatesBahrain 0Bhutan 0Chad 1 1 1China 1 1 2 2Cuba 0Djibouti 1 1 1Eritrea 1 1 2 1 1Ethiopia 1 3 7 11 3 8Guyana 0Holy See 0Indonesia 2 6 1 1 9 19 10 9Iraq 2 4 6 4 2Lebanon 1 1 2 1 1Malaysia 1 1 2 2Mozambique 1 3 1 1 6 2 4Myanmar 3 1 3 7 4 3Papua New Guinea 1 1 1Qatar 0Russian Federation 2 3 7 2 14 8 6San Marino 0Sao Tome and Principe 0Saudi Arabia 0Syrian Arab Republic 4 4 2 2The former Yugoslav Republic of Macedonia 1 4 3 8 1 7
Turkmenistan 2 2 2Uzbekistan 0
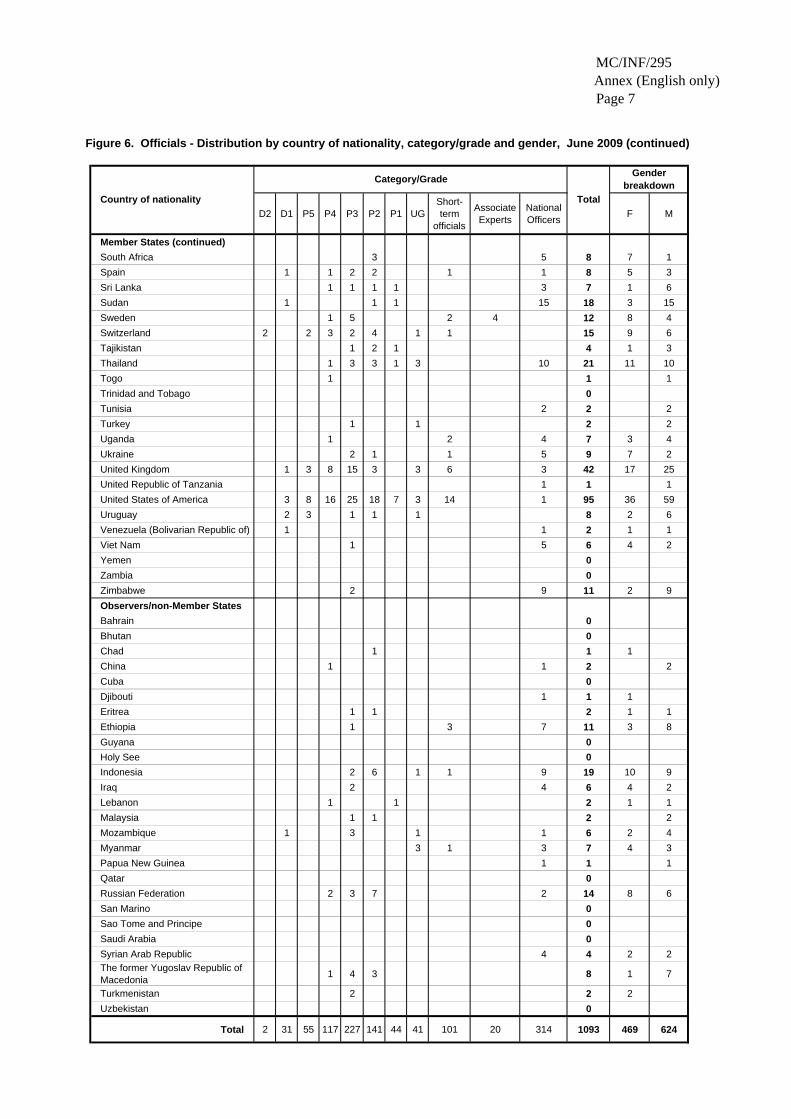
Total 2 31 55 117 227 141 44 41 101 20 314 1093 469 624
Figure 6. Officials - Distribution by country of nationality, category/grade and gender, June 2009 (continued)
Country of nationality
Category/Grade
Total
Gender breakdown
MC/INF/295 Annex (English only) Page 8
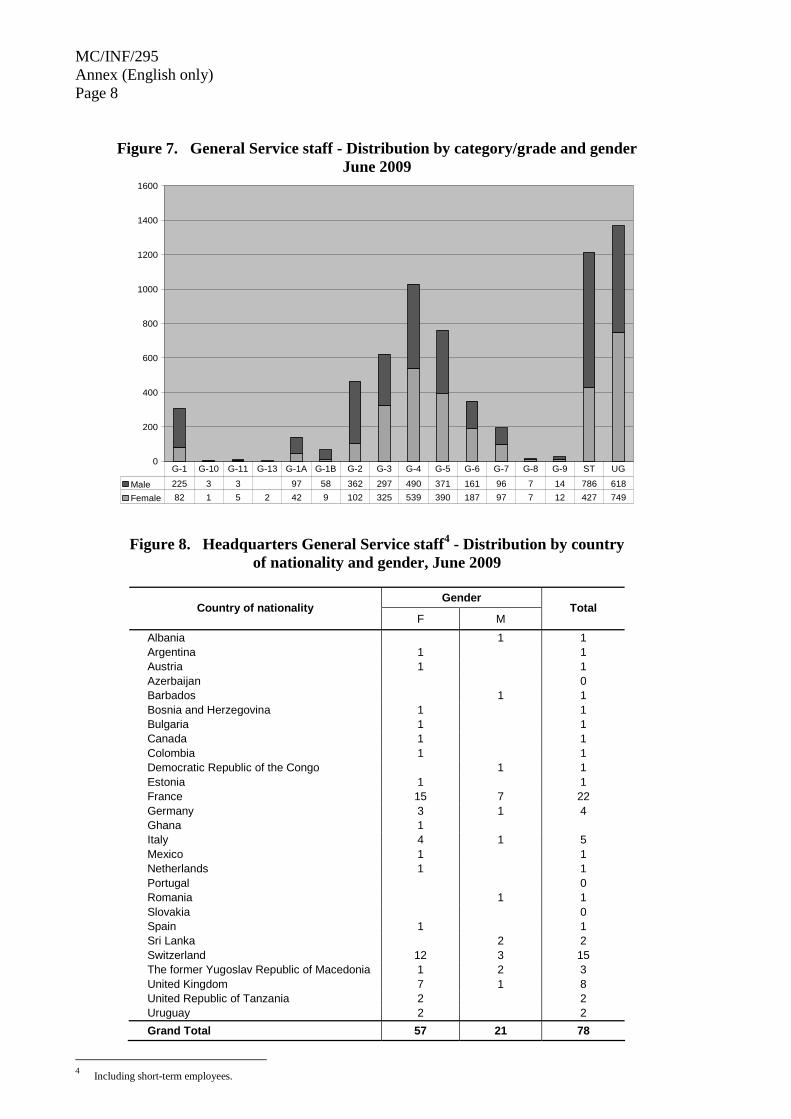
Figure 7. General Service staff - Distribution by category/grade and gender June 2009
0
200
400
600
800
1000
1200
1400
1600
Male 225 3 3 97 58 362 297 490 371 161 96 7 14 786 618Female 82 1 5 2 42 9 102 325 539 390 187 97 7 12 427 749
G-1 G-10 G-11 G-13 G-1A G-1B G-2 G-3 G-4 G-5 G-6 G-7 G-8 G-9 ST UG
Figure 8. Headquarters General Service staff4 - Distribution by country of nationality and gender, June 2009
Gender
Country of nationality F M
Total
Albania 1 1 Argentina 1 1 Austria 1 1 Azerbaijan 0 Barbados 1 1 Bosnia and Herzegovina 1 1 Bulgaria 1 1 Canada 1 1 Colombia 1 1 Democratic Republic of the Congo 1 1 Estonia 1 1 France 15 7 22 Germany 3 1 4 Ghana 1 Italy 4 1 5 Mexico 1 1 Netherlands 1 1 Portugal 0 Romania 1 1 Slovakia 0 Spain 1 1 Sri Lanka 2 2 Switzerland 12 3 15 The former Yugoslav Republic of Macedonia 1 2 3 United Kingdom 7 1 8 United Republic of Tanzania 2 2 Uruguay 2 2 Grand Total 57 21 78
4 Including short-term employees.
MC/INF/295Annex (English only)Page 9
G-13 G-11 G-10 G-9 G-8 G-7 G-6 G-5 G-4 G-3 G-2 G-1B G-1A G-1 UG ST F M
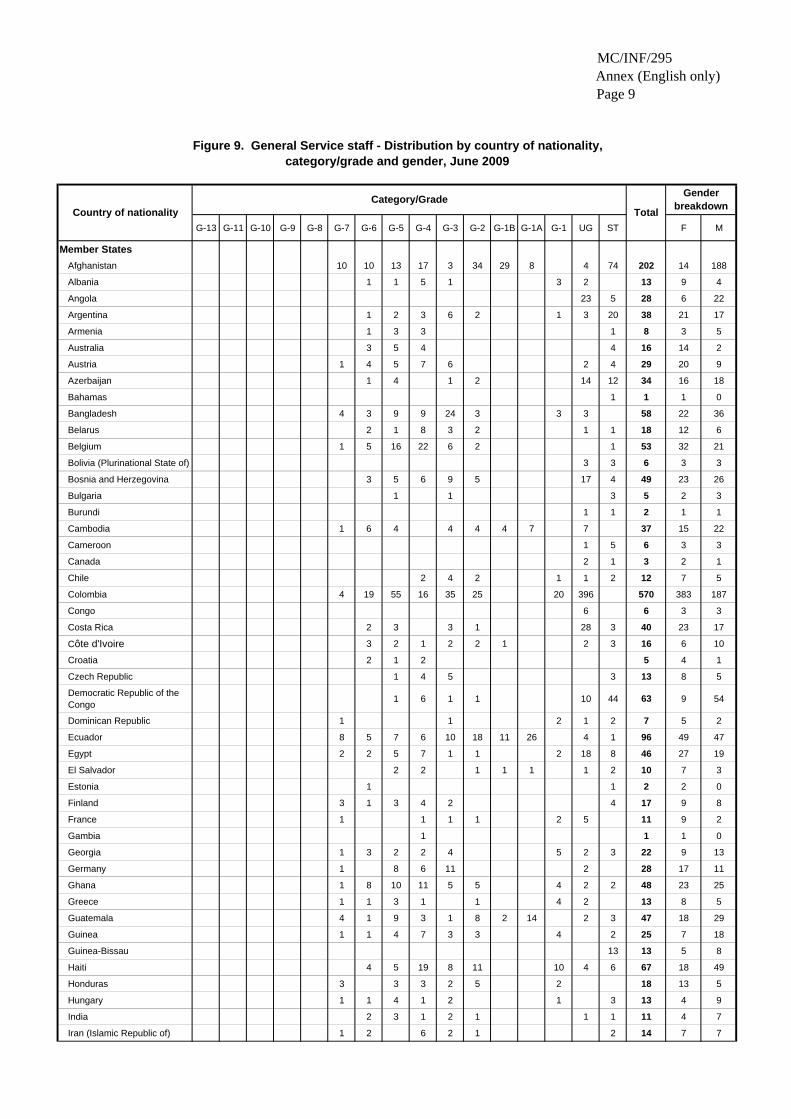
Member States Afghanistan 10 10 13 17 3 34 29 8 4 74 202 14 188
Albania 1 1 5 1 3 2 13 9 4
Angola 23 5 28 6 22
Argentina 1 2 3 6 2 1 3 20 38 21 17
Armenia 1 3 3 1 8 3 5
Australia 3 5 4 4 16 14 2
Austria 1 4 5 7 6 2 4 29 20 9
Azerbaijan 1 4 1 2 14 12 34 16 18
Bahamas 1 1 1 0
Bangladesh 4 3 9 9 24 3 3 3 58 22 36
Belarus 2 1 8 3 2 1 1 18 12 6
Belgium 1 5 16 22 6 2 1 53 32 21
Bolivia (Plurinational State of) 3 3 6 3 3
Bosnia and Herzegovina 3 5 6 9 5 17 4 49 23 26
Bulgaria 1 1 3 5 2 3
Burundi 1 1 2 1 1
Cambodia 1 6 4 4 4 4 7 7 37 15 22
Cameroon 1 5 6 3 3
Canada 2 1 3 2 1
Chile 2 4 2 1 1 2 12 7 5
Colombia 4 19 55 16 35 25 20 396 570 383 187
Congo 6 6 3 3
Costa Rica 2 3 3 1 28 3 40 23 17
Côte d'Ivoire 3 2 1 2 2 1 2 3 16 6 10
Croatia 2 1 2 5 4 1
Czech Republic 1 4 5 3 13 8 5
Democratic Republic of the Congo 1 6 1 1 10 44 63 9 54
Dominican Republic 1 1 2 1 2 7 5 2
Ecuador 8 5 7 6 10 18 11 26 4 1 96 49 47
Egypt 2 2 5 7 1 1 2 18 8 46 27 19
El Salvador 2 2 1 1 1 1 2 10 7 3
Estonia 1 1 2 2 0
Finland 3 1 3 4 2 4 17 9 8
France 1 1 1 1 2 5 11 9 2
Gambia 1 1 1 0
Georgia 1 3 2 2 4 5 2 3 22 9 13
Germany 1 8 6 11 2 28 17 11
Ghana 1 8 10 11 5 5 4 2 2 48 23 25
Greece 1 1 3 1 1 4 2 13 8 5
Guatemala 4 1 9 3 1 8 2 14 2 3 47 18 29
Guinea 1 1 4 7 3 3 4 2 25 7 18
Guinea-Bissau 13 13 5 8
Haiti 4 5 19 8 11 10 4 6 67 18 49
Honduras 3 3 3 2 5 2 18 13 5
Hungary 1 1 4 1 2 1 3 13 4 9
India 2 3 1 2 1 1 1 11 4 7
Iran (Islamic Republic of) 1 2 6 2 1 2 14 7 7
Figure 9. General Service staff - Distribution by country of nationality, category/grade and gender, June 2009
Gender breakdownCountry of nationality
Category/GradeTotal
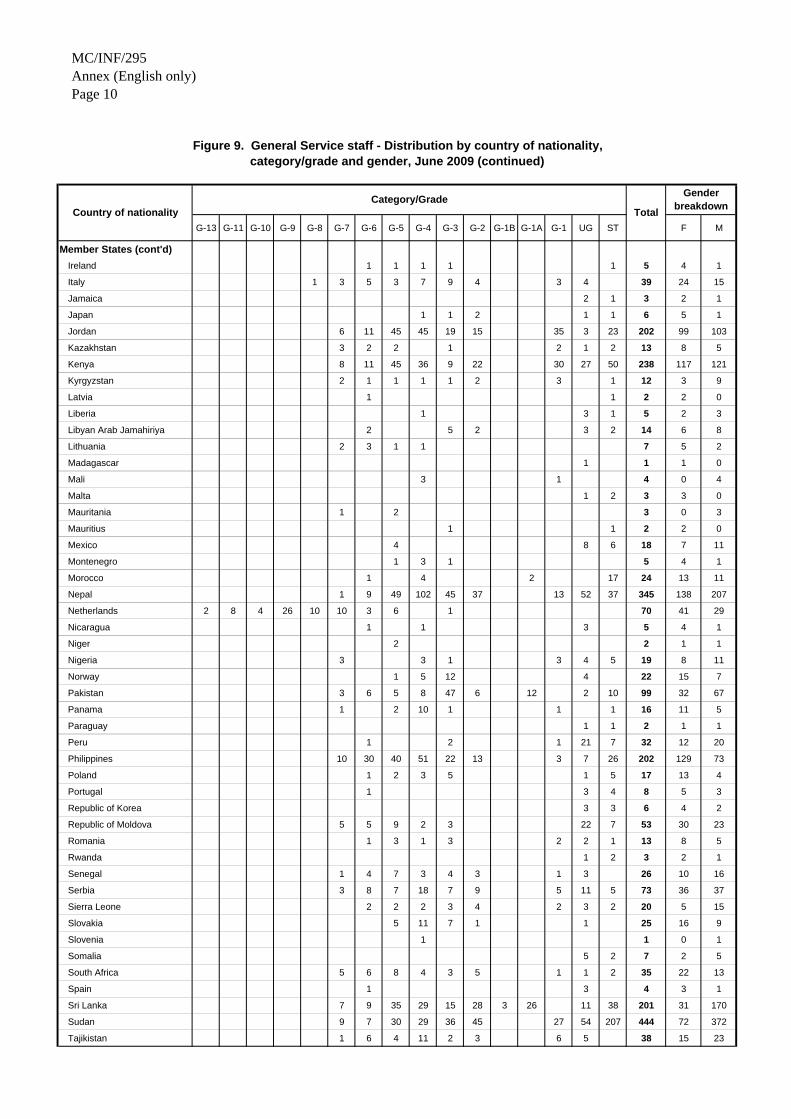
MC/INF/295Annex (English only)Page 10
G-13 G-11 G-10 G-9 G-8 G-7 G-6 G-5 G-4 G-3 G-2 G-1B G-1A G-1 UG ST F M
Member States (cont'd)Ireland 1 1 1 1 1 5 4 1
Italy 1 3 5 3 7 9 4 3 4 39 24 15
Jamaica 2 1 3 2 1
Japan 1 1 2 1 1 6 5 1
Jordan 6 11 45 45 19 15 35 3 23 202 99 103
Kazakhstan 3 2 2 1 2 1 2 13 8 5
Kenya 8 11 45 36 9 22 30 27 50 238 117 121
Kyrgyzstan 2 1 1 1 1 2 3 1 12 3 9
Latvia 1 1 2 2 0
Liberia 1 3 1 5 2 3
Libyan Arab Jamahiriya 2 5 2 3 2 14 6 8
Lithuania 2 3 1 1 7 5 2
Madagascar 1 1 1 0
Mali 3 1 4 0 4
Malta 1 2 3 3 0
Mauritania 1 2 3 0 3
Mauritius 1 1 2 2 0
Mexico 4 8 6 18 7 11
Montenegro 1 3 1 5 4 1
Morocco 1 4 2 17 24 13 11
Nepal 1 9 49 102 45 37 13 52 37 345 138 207
Netherlands 2 8 4 26 10 10 3 6 1 70 41 29
Nicaragua 1 1 3 5 4 1
Niger 2 2 1 1
Nigeria 3 3 1 3 4 5 19 8 11
Norway 1 5 12 4 22 15 7
Pakistan 3 6 5 8 47 6 12 2 10 99 32 67
Panama 1 2 10 1 1 1 16 11 5
Paraguay 1 1 2 1 1
Peru 1 2 1 21 7 32 12 20
Philippines 10 30 40 51 22 13 3 7 26 202 129 73
Poland 1 2 3 5 1 5 17 13 4
Portugal 1 3 4 8 5 3
Republic of Korea 3 3 6 4 2
Republic of Moldova 5 5 9 2 3 22 7 53 30 23
Romania 1 3 1 3 2 2 1 13 8 5
Rwanda 1 2 3 2 1
Senegal 1 4 7 3 4 3 1 3 26 10 16
Serbia 3 8 7 18 7 9 5 11 5 73 36 37
Sierra Leone 2 2 2 3 4 2 3 2 20 5 15
Slovakia 5 11 7 1 1 25 16 9
Slovenia 1 1 0 1
Somalia 5 2 7 2 5
South Africa 5 6 8 4 3 5 1 1 2 35 22 13
Spain 1 3 4 3 1
Sri Lanka 7 9 35 29 15 28 3 26 11 38 201 31 170
Sudan 9 7 30 29 36 45 27 54 207 444 72 372
Tajikistan 1 6 4 11 2 3 6 5 38 15 23
Figure 9. General Service staff - Distribution by country of nationality, category/grade and gender, June 2009 (continued)
Country of nationalityCategory/Grade
Total
Gender breakdown
MC/INF/295Annex (English only)Page 11
G-13 G-11 G-10 G-9 G-8 G-7 G-6 G-5 G-4 G-3 G-2 G-1B G-1A G-1 UG ST F M
Member States (cont'd)Thailand 2 3 26 54 62 15 14 4 21 43 244 147 97
Trinidad and Tobago 1 1 1 0
Tunisia 1 1 1 1 4 3 1
Turkey 2 1 3 4 8 1 10 2 31 19 12
Uganda 2 2 3 7 1 1 3 5 2 26 14 12
Ukraine 6 3 9 25 3 1 60 3 110 73 37
United Kingdom 4 9 13 57 3 1 5 92 46 46
United Republic of Tanzania 5 7 3 6 1 2 7 31 11 20
United States of America 3 5 7 12 15 1 11 10 2 66 40 26
Uruguay 1 2 7 10 6 4
Venezuela (Bolivarian Republic of) 3 2 5 2 3
Viet Nam 4 8 11 27 19 10 4 1 84 64 20
Yemen 1 10 11 3 8
Zambia 1 2 2 1 5 3 16 30 13 17
Zimbabwe 1 6 25 20 27 13 26 2 42 162 72 90
Observer and non-Member StatesChina 3 2 5 4 1
Cuba 1 1 1 0
Djibouti 2 2 1 1
Ethiopia 6 12 8 2 5 1 23 57 21 36
Hong Kong 1 2 3 3 0
Indonesia 15 33 57 101 18 48 55 53 121 501 162 339
Iraq 1 4 7 3 3 57 40 115 11 104
Kuwait 1 2 2 5 2 3
Lao People's Dem. Republic 1 1 1 3 6 3 3
Lebanon 9 3 12 8 4
Mozambique 2 1 3 0 3
Myanmar 1 1 3 1 4 182 128 320 179 141
Papua New Guinea 1 1 1 1 4 2 2
Russian Federation 7 17 30 42 9 8 9 3 125 88 37
Saudi Arabia 1 1 0 1
Syrian Arab Republic 1 7 20 50 17 2 1 35 11 144 68 76
The former Yugoslav Republic of Macedonia 1 2 2 1 1 1 8 6 2
Timor-Leste 2 1 2 1 3 2 1 66 23 101 22 79
Turkmenistan 1 2 1 4 1 3
Uzbekistan 1 1 4 6 3 3
TOTAL 2 8 4 26 14 193 348 761 1029 622 464 67 139 307 1367 1213 6564 2976 3588
Figure 9. General Service staff - Distribution by country of nationality, category/grade and gender, June 2009 (continued)
Country of nationalityCategory/Grade
Total
Gender breakdown
MC/INF/295 Annex (English only) Page 12
ALTERNATIVE STAFFING RESOURCES
Figure 10. Associate Experts - Distribution by country of nationality 2005 - June 20095
2005 2006 2007 2008 June 2009
Armenia 1 1 6
Austria 1 1 1 1
Belgium 2 2 1 1 2
Denmark 1
Finland 1
France 1 1
Germany 3 3 1 1 2
Italy 4 4 4 5 5
Japan 1 1 2 4 3
Morocco
Netherlands 4 4
Niger 1 1 7
Sweden 4 4 1 1 4
Switzerland
United States of America 2 2 2 2
Total 22 23 12 16 20
5 Includes Associate Experts present for only part of the year. 6 Funded by the Government of the Netherlands. 7 Funded by Organisation Internationale de la Francophonie.
MC/INF/295Annex (English only)Page 13
F M TotalHeadquarters
Accounting 2 2Budget 2 1 3Director General's Office 7 1 8Donor Relations 2 2Election Support 1 1Emergency and Post-crisis 7 1 8External Relations 1 1GFMD Support Unit 1 1Human Resources Management . 1 1 2Information Technology and Communication . 1 1International Dialogue on Migration . 7 7International Migration Law and Legal Affairs . 5 3 8IT Procurement 1 1Labour and Facilitated Migration . 3 3Media and Communication Unit . 1 1Media and Public Information . 3 1 4Migration Health 3 3Migration Policy and Research . 3 3Movement Management . 2 1 3Ombudsperson 3 3Regional Advisers 1 1Research and Publications 2 1 3Return Management and Counter-trafficking . 7 1 8Spanish Translations 1 1Staff Development, Learning and Communication . 3 3Strategic Policy and Planning . 1 1Technical Cooperation on Migration . 1 1 2
Headquarters Total 67 17 84Field
Angola 3 1 4Argentina 1 1Austria 7 1 8Bangladesh 1 1Belgium 5 2 7Bosnia and Herzegovina . 1 1Bulgaria 1 1Cambodia 1 1Colombia 2 1 3Costa Rica 3 3Egypt 2 2Finland 1 1France 2 2Germany 2 2Ghana 1 1Indonesia 1 1Ireland 1 1 2Italy 2 1 3Jordan 2 2Kenya 5 5Lao People's Democratic Republic . 2 2Malta 1 1Nicaragua 3 3Peru 1 1Philippines 3 2 5Republic of Korea 3 3Russian Federation 2 2South Africa 1 2 3Spain 2 2Switzerland (Bern) 1 1 2Tajikistan 2 2Thailand 8 4 12Timor-Leste 2 3 5Turkey 2 2Ukraine 9 2 11United States of America . 4 4Viet Nam 3 3Zambia 1 1Zimbabwe 1 1
Field Total 84 32 116
151 49 200
Duty station
GRAND TOTAL
Figure 11a. Interns - Distribution by gender and duty station, July 2008 - June 2009
MC/INF/295 Annex (English only) Page 14
Figure 11b. Secondees – Distribution by gender and duty station July 2008 - June 2009
Duty station Women Men Total Headquarters
Director General's Office 2 1 2
Labour and Facilitated Migration 2 2
Media and Public Information 2
Regional Advisers 2 1
Research and Publications 2 2
Headquarters Total 10 1 11 Field
Argentina 3 2 5
Hungary 1 1
Morocco 1 1
Zambia 1 1
Field Total 5 3 8
MC/INF/295 Annex (English only) Page 15
RECRUITMENT AND SELECTION
Figure 12. Vacancy notices issued for Officials, 2005 - June 2009
Vacancy notices issued 2005 2006 2007 2008 June 2009
Total number of vacancy notices issued 61 72 106 71 36
Headquarters positions 14 8 16 9 8
Field positions 47 64 90 62 28
Advertised internally only8 40 37 56 53 24
Headquarters positions 6 5 12 7 7
Field positions 34 32 44 46 17
Advertised internally and externally 21 35 50 18 12
Headquarters positions 8 3 4 2 1
Field positions 13 32 46 16 11
Figure 13. Officials appointed through vacancy notices, 2005 – June 2009
Vacancy notices issued 2005 2006 2007 2008 June 2009
Vacancies filled internally 39 45 46 40 18
Headquarters positions 12 5 11 5 6
Field positions 27 40 35 35 12
Vacancies filled externally 6 14 40 10 6
Headquarters positions 1 2 3 1 1
Field positions 5 12 37 9 5
Total 45 59 86 50 24
8 As of January 2008, vacancy notices advertised internally only are also open to external candidates from non-represented Member
States.
MC/INF/295Annex (English only)Page 16
Country of nationality 2005 2006 2007 2008 June 2009
Albania 1Argentina 1Australia 3 2 7 3 2Austria 1 2 2Azerbaijan 1 1Bangladesh 2Belarus 1Belgium 3 1Bosnia and Herzegovina 1Brazil 1 1 2Burkina FasoCanada 2 7 1 3 2Cape VerdeChile 1Colombia 1Costa Rica 2 2 2Côte d’Ivoire 1Croatia 1Czech RepublicDenmark 1Ecuador 1Egypt 1 1 3 1Ethiopia10 1Eritrea9 1Finland 1France 3 5 5 2 1Georgia 1Germany 3 2 3 4 1Ghana 1Greece 1HungaryIndia 2 2 1Indonesia10 2Iraq9 1Ireland 1 1Israel 1Italy 3 4 8 2 1Japan 1 1Jordan 2 2Kazakhstan 1Kenya 1 2Latvia 1 1Liberia 1LithuaniaMalaysia9 1MoroccoMozambique10
Netherlands 1 2 1Nicaragua
Figure 14. Officials appointed through vacancy noticesDistribution by country of nationality, 2005 - June 2009
MC/INF/295Annex (English only)Page 17
Country of nationality 2005 2006 2007 2008 June 2009
Niger 1Nigeria 1Norway 1Pakistan 1 1Panama 1PeruPhilippines 2 1 2 2PolandPortugal 1 1Republic of Korea 1Republic of Moldova 1Romania 1 1 1Russian Federation10 1 2 6 2Senegal 1Serbia 1 1 1Sierra Leone 1South Africa 1Slovakia 1Spain 1Sri Lanka 1Sudan 1Sweden 2 1Switzerland 1Thailand 2 1 1The former Yugoslav Republic of Macedonia10 1 2 1
Togo 1Tunisia 1TurkeyUganda 1Ukraine 1 2United Kingdom 3 3 1 2 4United States of America 2 8 14 11 4Uruguay 1
Total 45 59 86 50 25
Number of nationalities 29 30 36 26 16
9 Non-Member States10 Observer States
Figure 14. Officials appointed through vacancy noticesDistribution by country of nationality, 2005 - June 2009 (continued)
MC/INF/295 Annex (English only) Page 18
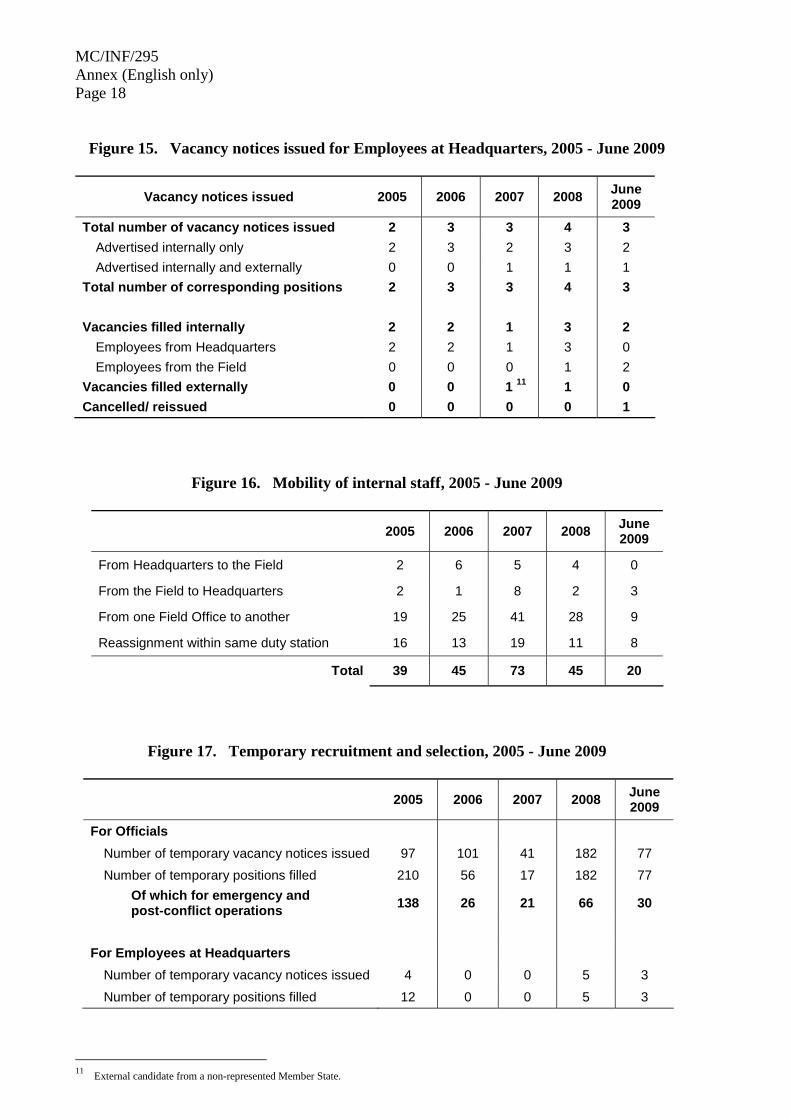
Figure 15. Vacancy notices issued for Employees at Headquarters, 2005 - June 2009
Vacancy notices issued 2005 2006 2007 2008 June 2009
Total number of vacancy notices issued 2 3 3 4 3 Advertised internally only 2 3 2 3 2 Advertised internally and externally 0 0 1 1 1
Total number of corresponding positions 2 3 3 4 3 Vacancies filled internally 2 2 1 3 2
Employees from Headquarters 2 2 1 3 0 Employees from the Field 0 0 0 1 2
Vacancies filled externally 0 0 1 11 1 0 Cancelled/ reissued 0 0 0 0 1
Figure 16. Mobility of internal staff, 2005 - June 2009
2005 2006 2007 2008 June 2009
From Headquarters to the Field 2 6 5 4 0
From the Field to Headquarters 2 1 8 2 3
From one Field Office to another 19 25 41 28 9
Reassignment within same duty station 16 13 19 11 8
Total 39 45 73 45 20
Figure 17. Temporary recruitment and selection, 2005 - June 2009
2005 2006 2007 2008 June 2009
For Officials Number of temporary vacancy notices issued 97 101 41 182 77 Number of temporary positions filled 210 56 17 182 77
Of which for emergency and post-conflict operations 138 26 21 66 30
For Employees at Headquarters
Number of temporary vacancy notices issued 4 0 0 5 3 Number of temporary positions filled 12 0 0 5 3
11 External candidate from a non-represented Member State.
MC/INF/295 Annex (English only) Page 19
STAFF DEVELOPMENT AND LEARNING
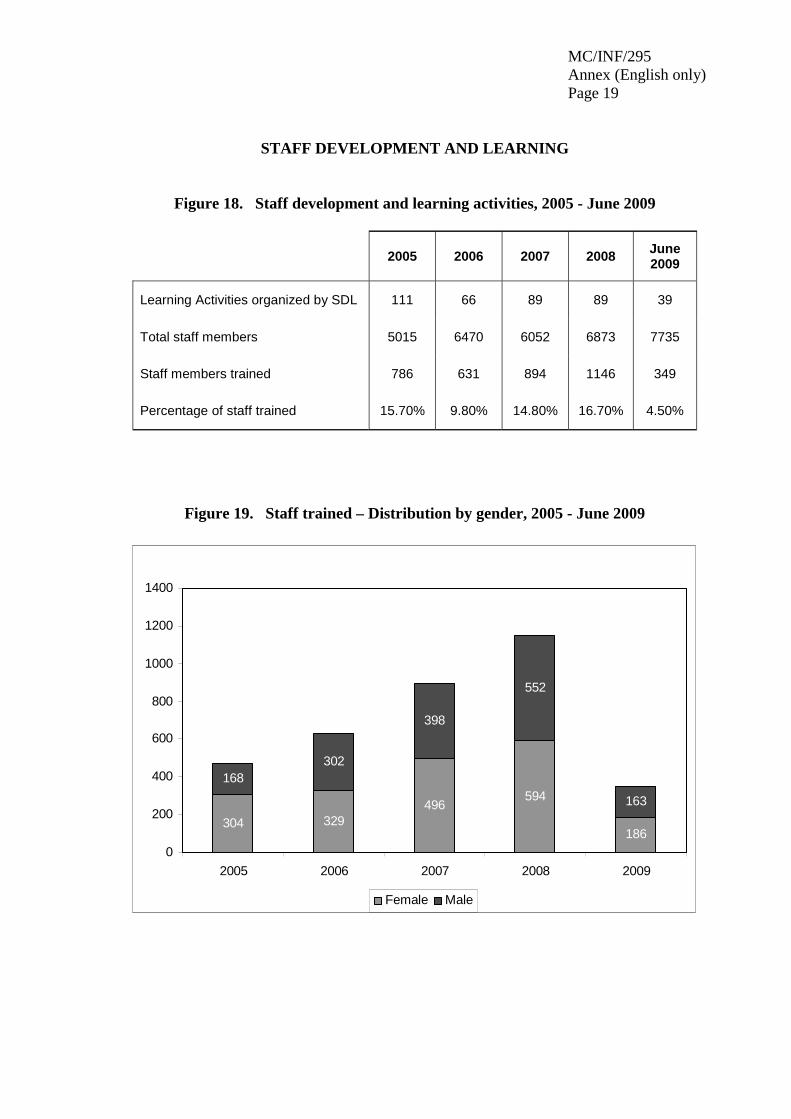
Figure 18. Staff development and learning activities, 2005 - June 2009
2005 2006 2007 2008 June 2009
Learning Activities organized by SDL 111 66 89 89 39
Total staff members 5015 6470 6052 6873 7735
Staff members trained 786 631 894 1146 349
Percentage of staff trained 15.70% 9.80% 14.80% 16.70% 4.50%
Figure 19. Staff trained – Distribution by gender, 2005 - June 2009
329496
594
186
168302
398
552
163
304
0
200
400
600
800
1000
1200
1400
2005 2006 2007 2008 2009
Female Male
MC/INF/295 Annex (English only) Page 20
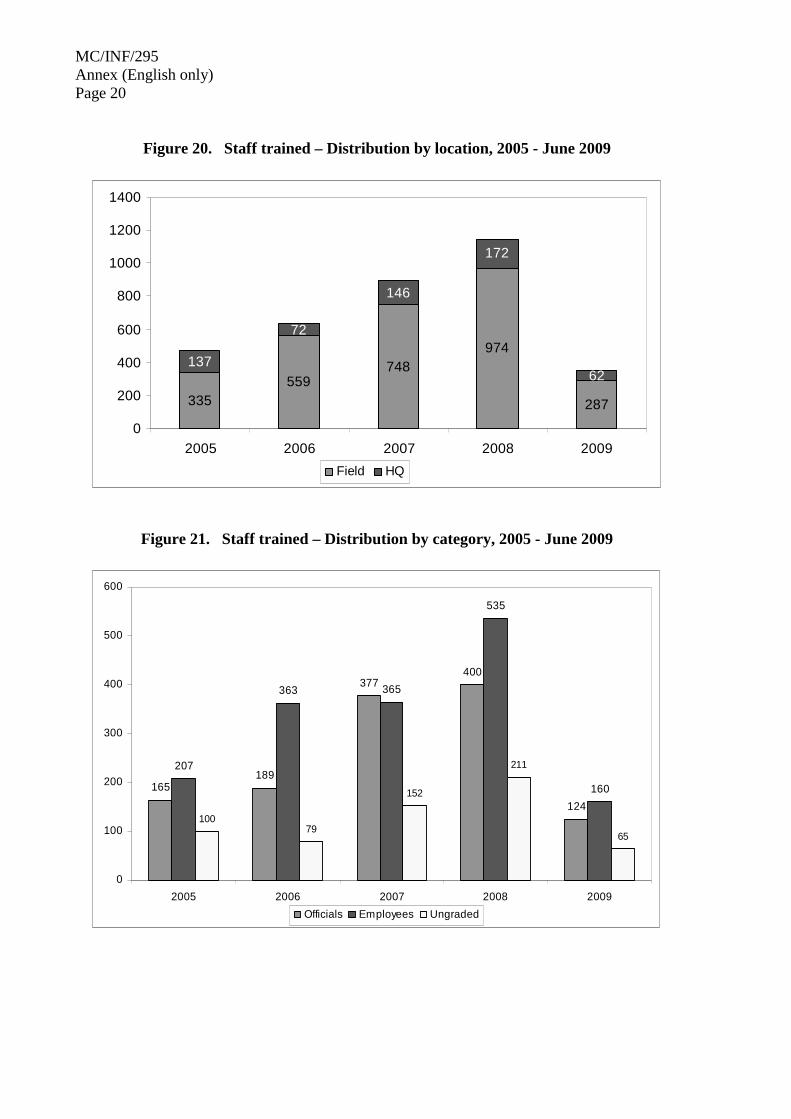
Figure 20. Staff trained – Distribution by location, 2005 - June 2009
335559
748974
287
137
72
146
172
62
0
200
400
600
800
1000
1200
1400
2005 2006 2007 2008 2009Field HQ
Figure 21. Staff trained – Distribution by category, 2005 - June 2009
165189
377400
124
207
363 365
535
160
10079
152
211
65
0
100
200
300
400
500
600
2005 2006 2007 2008 2009Officials Employees Ungraded
MC/INF/295 Annex (English only) Page 21
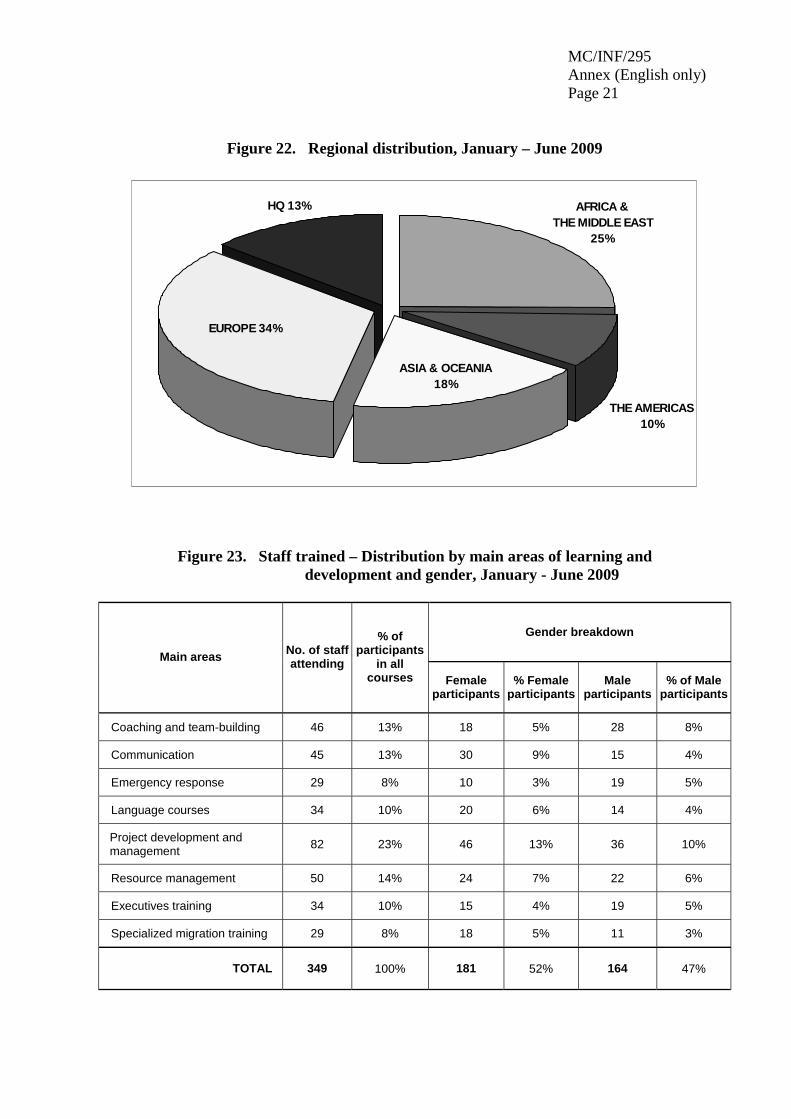
Figure 22. Regional distribution, January – June 2009
AFRICA &THE MIDDLE EAST
25%
THE AMERICAS 10%
ASIA & OCEANIA 18%
HQ 13%
EUROPE 34%
Figure 23. Staff trained – Distribution by main areas of learning and development and gender, January - June 2009
Gender breakdown
Main areas No. of staff attending
% of participants
in all courses Female
participants% Female
participants Male
participants % of Male
participants
Coaching and team-building 46 13% 18 5% 28 8%
Communication 45 13% 30 9% 15 4%
Emergency response 29 8% 10 3% 19 5%
Language courses 34 10% 20 6% 14 4%
Project development and management 82 23% 46 13% 36 10%
Resource management 50 14% 24 7% 22 6%
Executives training 34 10% 15 4% 19 5%
Specialized migration training 29 8% 18 5% 11 3%
TOTAL 349 100% 181 52% 164 47%


![[Inf 295] week 6 parul seth patient-reported outcomes as a source of evidence in off-label prescribing](https://img.pdfslide.us/doc/110x75/5481e772b4af9f3b018b462a/inf-295-week-6-parul-seth-patient-reported-outcomes-as-a-source-of-evidence-in-off-label-prescribing.jpg)


![[Inf 295] week 9 parul seth documenting transitional information in emr](https://img.pdfslide.us/doc/110x75/5598cefb1a28ab76338b4734/inf-295-week-9-parul-seth-documenting-transitional-information-in-emr-559c107ee9066.jpg)