Embed Size (px)
Citation preview
© The McGraw-Hill Companies, Inc., 20031.1McGraw-Hill/Irwin
Table of ContentsChapter 1 (Introduction)
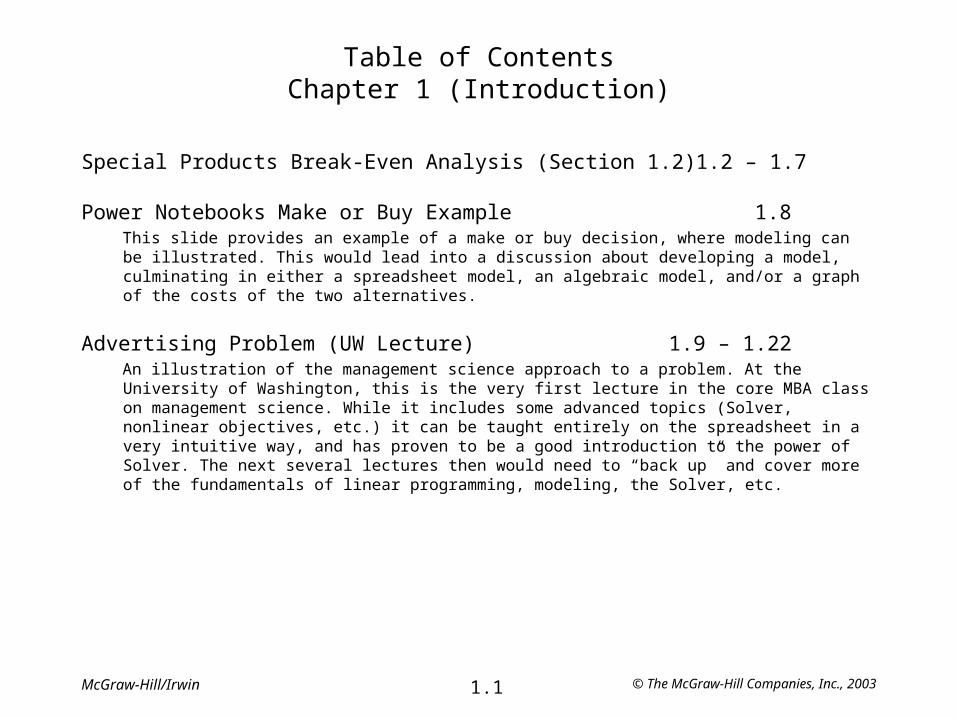
Special Products Break-Even Analysis (Section 1.2) 1.2 – 1.7
Power Notebooks Make or Buy Example 1.8This slide provides an example of a make or buy decision, where modeling can be illustrated. This would lead into a discussion about developing a model, culminating in either a spreadsheet model, an algebraic model, and/or a graph of the costs of the two alternatives.
Advertising Problem (UW Lecture) 1.9 – 1.22An illustration of the management science approach to a problem. At the University of Washington, this is the very first lecture in the core MBA class on management science. While it includes some advanced topics (Solver, nonlinear objectives, etc.) it can be taught entirely on the spreadsheet in a very intuitive way, and has proven to be a good introduction to the power of Solver. The next several lectures then would need to “back up” and cover more of the fundamentals of linear programming, modeling, the Solver, etc.

© The McGraw-Hill Companies, Inc., 20031.2McGraw-Hill/Irwin
Special Products Break-Even Analysis
• The Special Products Company produces expensive and unusual gifts.
• The latest new-product proposal is a limited edition grandfather clock.
• Data:– If they go ahead with this product, a fixed cost of $50,000 is incurred.
– The variable cost is $400 per clock produced.
– Each clock sold would generate $900 in revenue.
– A sales forecast will be obtained.
Question: Should they produce the clocks, and if so, how many?
© The McGraw-Hill Companies, Inc., 20031.3McGraw-Hill/Irwin
Expressing the Problem Mathematically
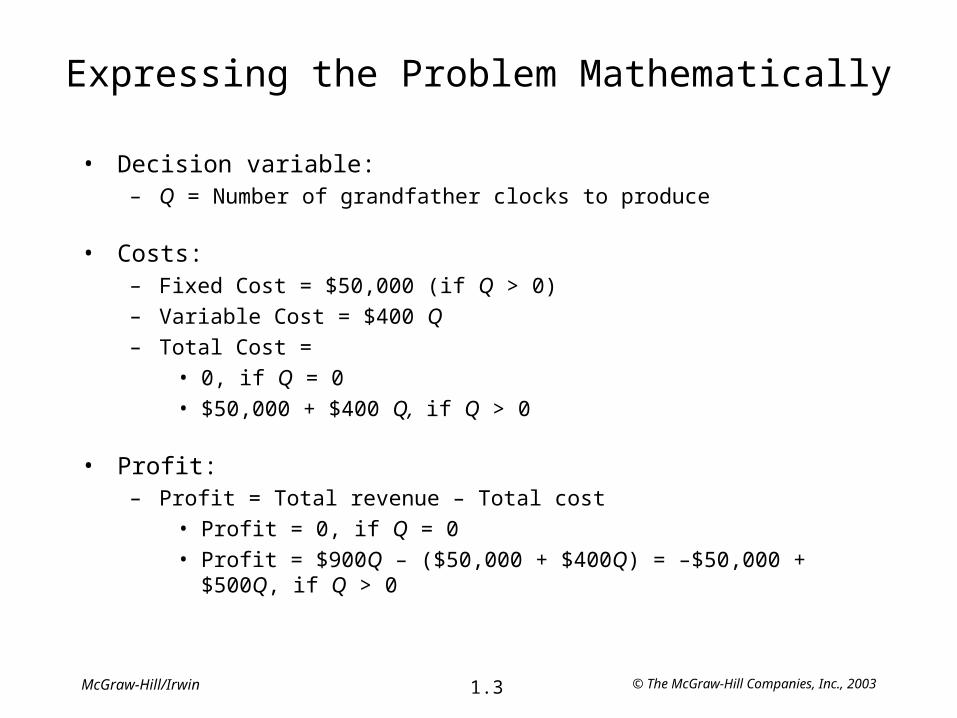
• Decision variable:– Q = Number of grandfather clocks to produce
• Costs:– Fixed Cost = $50,000 (if Q > 0)
– Variable Cost = $400 Q
– Total Cost =
• 0, if Q = 0
• $50,000 + $400 Q, if Q > 0
• Profit:– Profit = Total revenue – Total cost
• Profit = 0, if Q = 0
• Profit = $900Q – ($50,000 + $400Q) = –$50,000 + $500Q, if Q > 0

© The McGraw-Hill Companies, Inc., 20031.4McGraw-Hill/Irwin
Analysis of the Problem
$
$40,000
$80,000
$120,000
$160,000
$200,000
0 40 80 120 160 200
Revenue = $900 x
Fixed cost
Loss
Profit
Cost = $50,000 + $400 x
x
Break-even point = 100 units

© The McGraw-Hill Companies, Inc., 20031.5McGraw-Hill/Irwin
Management Science Interactive Modules
• Sensitivity analysis can be performed using the Break-Even module in the Interactive Management Science Modules (available on your MS Courseware CD packaged with the text).
– Here we see the impact of changing the fixed cost to $75,000.
© The McGraw-Hill Companies, Inc., 20031.6McGraw-Hill/Irwin
Special Products Co. Spreadsheet
3456789
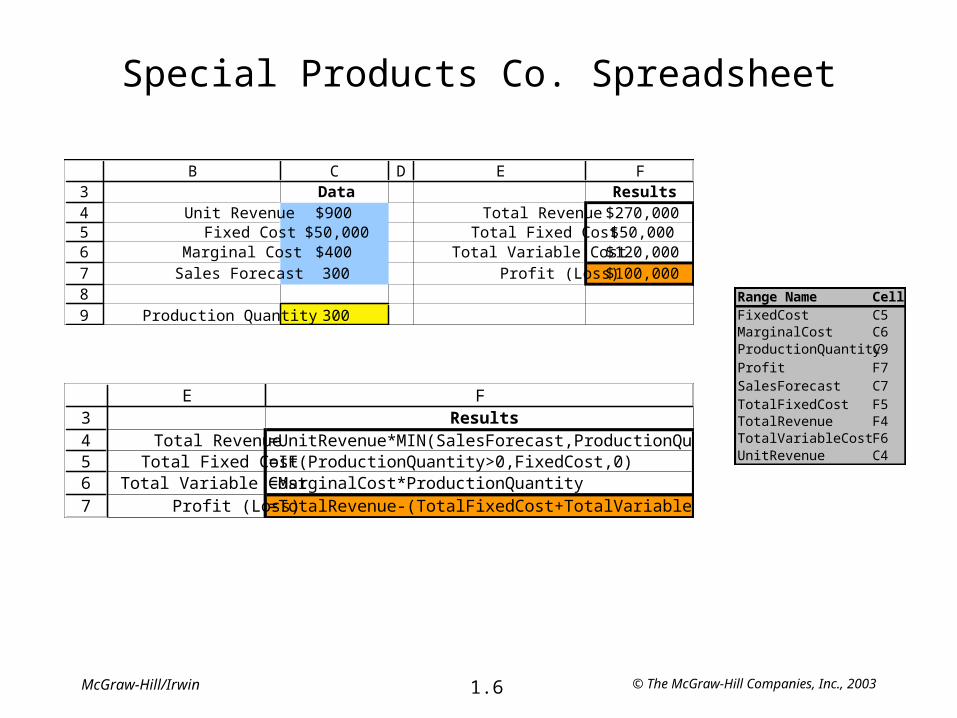
B C D E FData Results
Unit Revenue $900 Total Revenue $270,000Fixed Cost $50,000 Total Fixed Cost $50,000
Marginal Cost $400 Total Variable Cost $120,000Sales Forecast 300 Profit (Loss) $100,000
Production Quantity 300
34567
E FResults
Total Revenue =UnitRevenue*MIN(SalesForecast,ProductionQuantity)Total Fixed Cost =IF(ProductionQuantity>0,FixedCost,0)
Total Variable Cost =MarginalCost*ProductionQuantityProfit (Loss) =TotalRevenue-(TotalFixedCost+TotalVariableCost)
Range Name CellFixedCost C5MarginalCost C6ProductionQuantity C9Profit F7SalesForecast C7TotalFixedCost F5TotalRevenue F4TotalVariableCost F6UnitRevenue C4
© The McGraw-Hill Companies, Inc., 20031.7McGraw-Hill/Irwin
Special Products Co. Spreadsheet
3456789
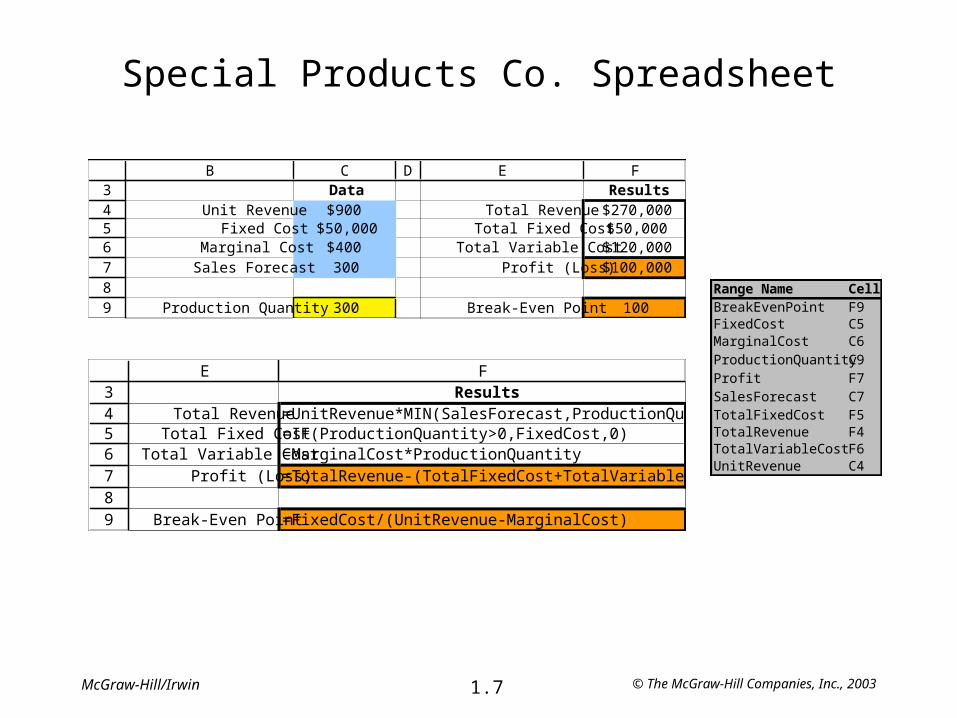
B C D E FData Results
Unit Revenue $900 Total Revenue $270,000Fixed Cost $50,000 Total Fixed Cost $50,000
Marginal Cost $400 Total Variable Cost $120,000Sales Forecast 300 Profit (Loss) $100,000
Production Quantity 300 Break-Even Point 100
3456789
E FResults
Total Revenue =UnitRevenue*MIN(SalesForecast,ProductionQuantity)Total Fixed Cost =IF(ProductionQuantity>0,FixedCost,0)
Total Variable Cost =MarginalCost*ProductionQuantityProfit (Loss) =TotalRevenue-(TotalFixedCost+TotalVariableCost)
Break-Even Point =FixedCost/(UnitRevenue-MarginalCost)
Range Name CellBreakEvenPoint F9FixedCost C5MarginalCost C6ProductionQuantity C9Profit F7SalesForecast C7TotalFixedCost F5TotalRevenue F4TotalVariableCost F6UnitRevenue C4

© The McGraw-Hill Companies, Inc., 20031.8McGraw-Hill/Irwin
Make or Buy?
• Power Notebooks, Inc. is a manufacturer of notebook computers. They are trying to decide whether to purchase the LCD screens for their computers from an outside supplier or to manufacture the screens in-house.
• The screens cost $100 each from the outside supplier.
• To set up the assembly process required to produce the screens in-house would cost $10,000. They could then produce each screen for $75.
Question: For what range of production volume is each alternative best?
© The McGraw-Hill Companies, Inc., 20031.9McGraw-Hill/Irwin
An Advertising Problem
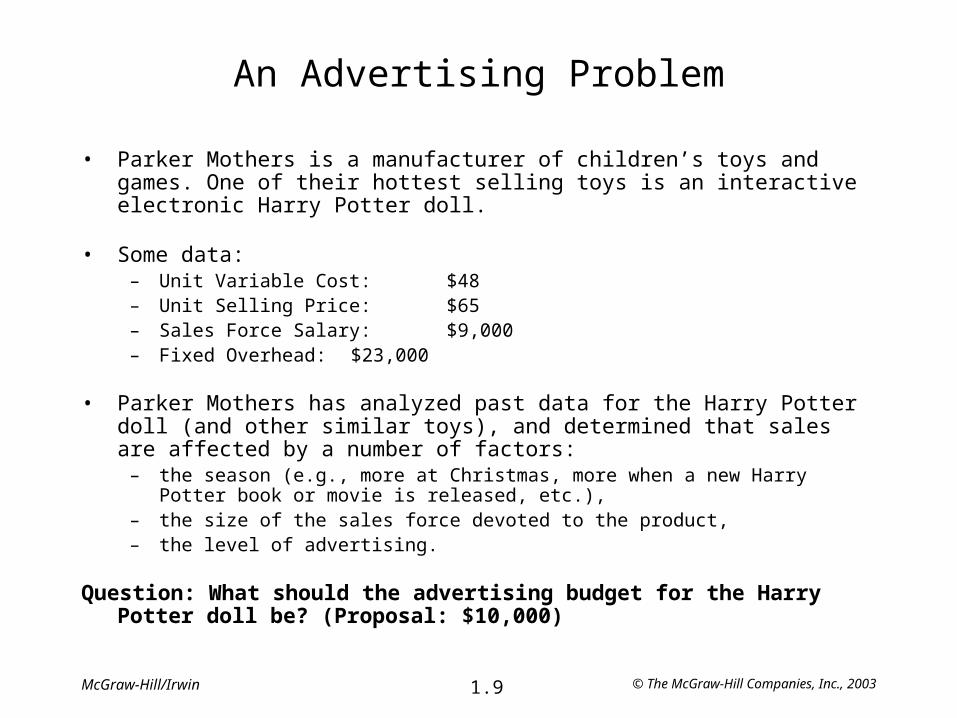
• Parker Mothers is a manufacturer of children’s toys and games. One of their hottest selling toys is an interactive electronic Harry Potter doll.
• Some data:– Unit Variable Cost: $48– Unit Selling Price: $65– Sales Force Salary: $9,000– Fixed Overhead: $23,000
• Parker Mothers has analyzed past data for the Harry Potter doll (and other similar toys), and determined that sales are affected by a number of factors:
– the season (e.g., more at Christmas, more when a new Harry Potter book or movie is released, etc.),
– the size of the sales force devoted to the product,– the level of advertising.
Question: What should the advertising budget for the Harry Potter doll be? (Proposal: $10,000)

© The McGraw-Hill Companies, Inc., 20031.10McGraw-Hill/Irwin
Predicting the Sales Level
• After performing a statistical regression analysis, they estimate that sales for the quarter will be approximately related to the season, sales force salary, and advertising budget, as follows:
• Seasonality Factors:– Q1: 1.2 (publication of new Harry Potter book)– Q2: 0.7– Q3: 0.8– Q4: 1.3 (Christmas and expected release of new Harry Potter movie)
• Effect of Advertising / Sales Force:
Sales(35)(Seasonality Factor) Advertising+
Sales Force2
Advertising + (Sales Force/2)
Sales
© The McGraw-Hill Companies, Inc., 20031.11McGraw-Hill/Irwin
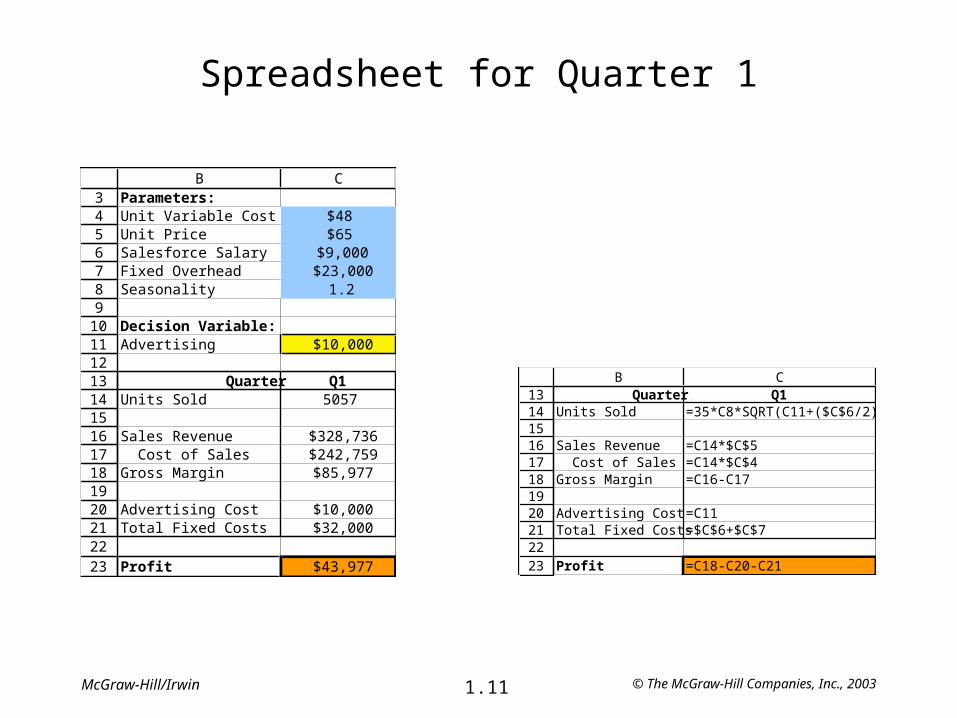
Spreadsheet for Quarter 1
34567891011121314151617181920212223
B CParameters:Unit Variable Cost $48Unit Price $65Salesforce Salary $9,000Fixed Overhead $23,000Seasonality 1.2
Decision Variable:Advertising $10,000
Quarter Q1Units Sold 5057
Sales Revenue $328,736 Cost of Sales $242,759Gross Margin $85,977
Advertising Cost $10,000Total Fixed Costs $32,000
Profit $43,977
1314151617181920212223
B CQuarter Q1
Units Sold =35*C8*SQRT(C11+($C$6/2))
Sales Revenue =C14*$C$5 Cost of Sales =C14*$C$4Gross Margin =C16-C17
Advertising Cost =C11Total Fixed Costs =$C$6+$C$7
Profit =C18-C20-C21
© The McGraw-Hill Companies, Inc., 20031.12McGraw-Hill/Irwin
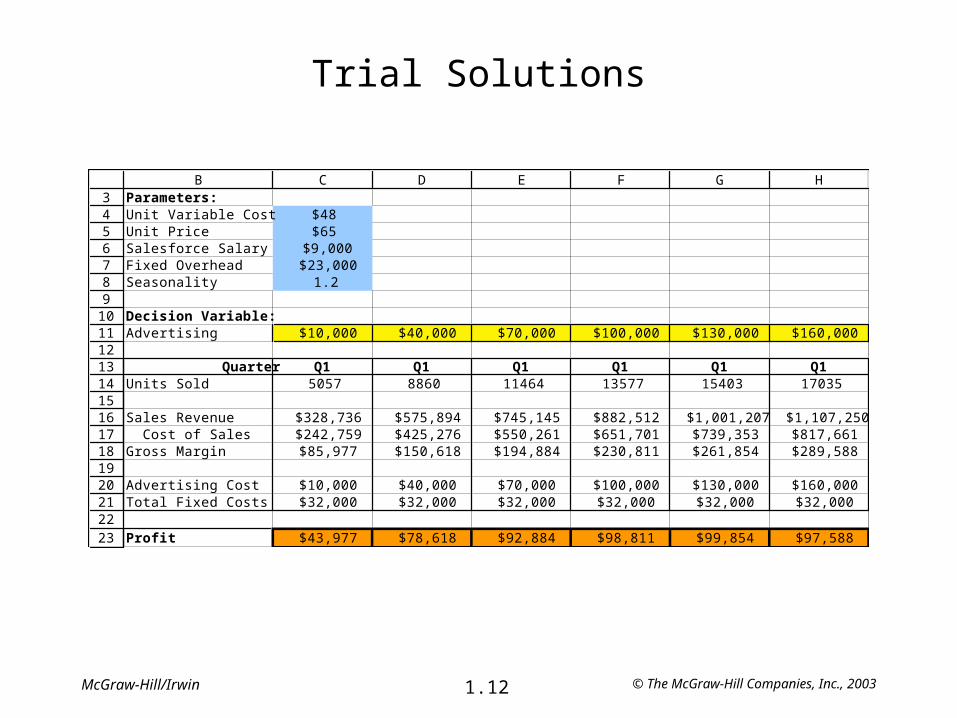
Trial Solutions
34567891011121314151617181920212223
B C D E F G HParameters:Unit Variable Cost $48Unit Price $65Salesforce Salary $9,000Fixed Overhead $23,000Seasonality 1.2
Decision Variable:Advertising $10,000 $40,000 $70,000 $100,000 $130,000 $160,000
Quarter Q1 Q1 Q1 Q1 Q1 Q1Units Sold 5057 8860 11464 13577 15403 17035
Sales Revenue $328,736 $575,894 $745,145 $882,512 $1,001,207 $1,107,250 Cost of Sales $242,759 $425,276 $550,261 $651,701 $739,353 $817,661Gross Margin $85,977 $150,618 $194,884 $230,811 $261,854 $289,588
Advertising Cost $10,000 $40,000 $70,000 $100,000 $130,000 $160,000Total Fixed Costs $32,000 $32,000 $32,000 $32,000 $32,000 $32,000
Profit $43,977 $78,618 $92,884 $98,811 $99,854 $97,588
© The McGraw-Hill Companies, Inc., 20031.13McGraw-Hill/Irwin
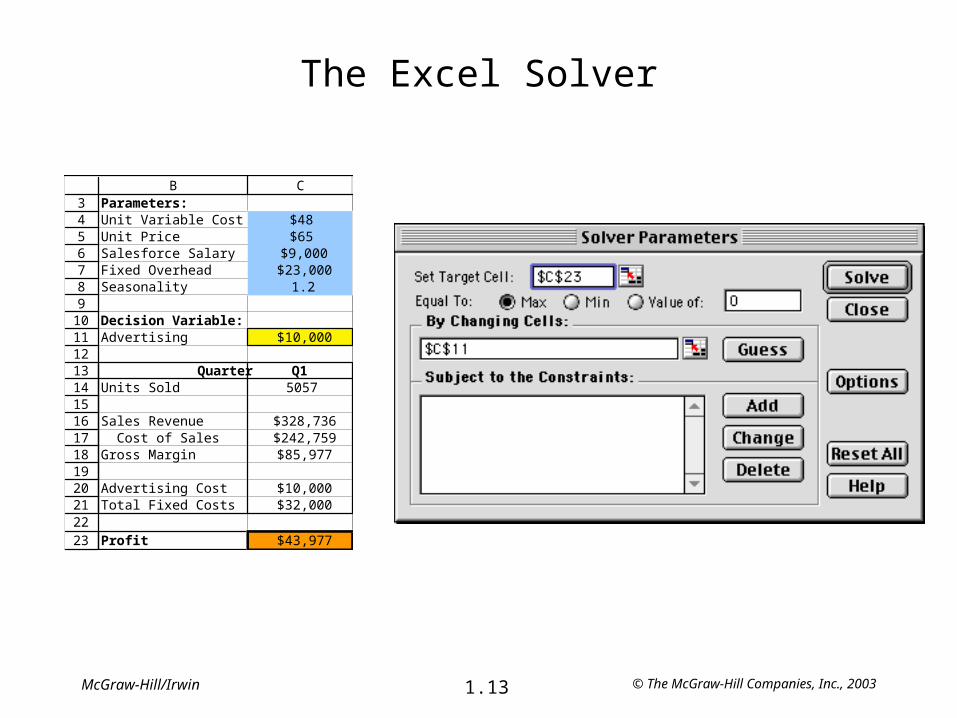
The Excel Solver
34567891011121314151617181920212223
B CParameters:Unit Variable Cost $48Unit Price $65Salesforce Salary $9,000Fixed Overhead $23,000Seasonality 1.2
Decision Variable:Advertising $10,000
Quarter Q1Units Sold 5057
Sales Revenue $328,736 Cost of Sales $242,759Gross Margin $85,977
Advertising Cost $10,000Total Fixed Costs $32,000
Profit $43,977
© The McGraw-Hill Companies, Inc., 20031.14McGraw-Hill/Irwin
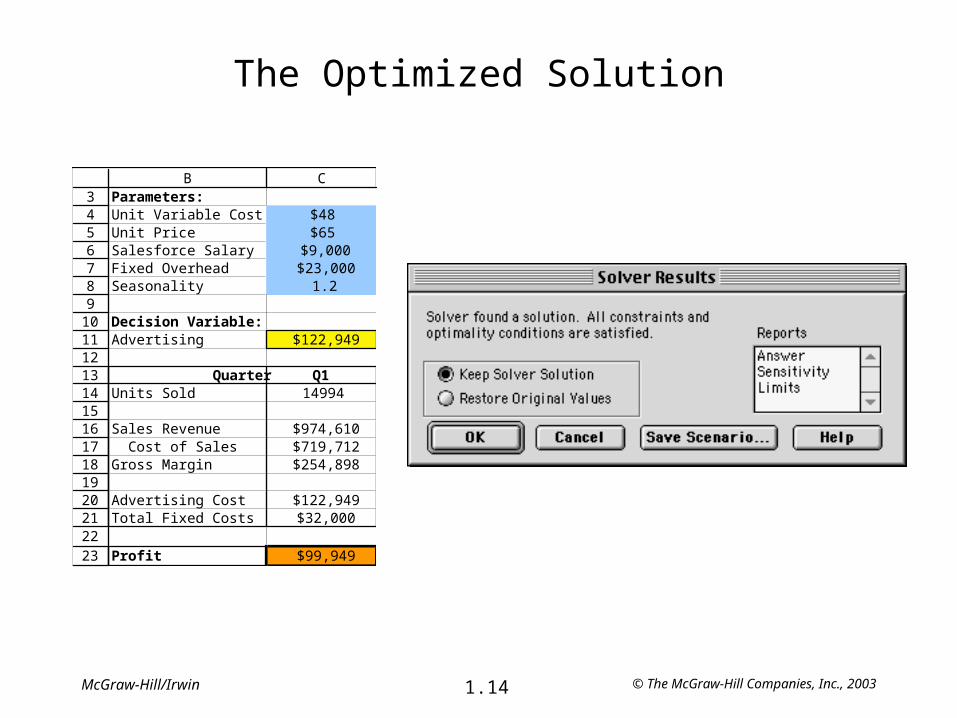
The Optimized Solution
34567891011121314151617181920212223
B CParameters:Unit Variable Cost $48Unit Price $65Salesforce Salary $9,000Fixed Overhead $23,000Seasonality 1.2
Decision Variable:Advertising $122,949
Quarter Q1Units Sold 14994
Sales Revenue $974,610 Cost of Sales $719,712Gross Margin $254,898
Advertising Cost $122,949Total Fixed Costs $32,000
Profit $99,949
© The McGraw-Hill Companies, Inc., 20031.15McGraw-Hill/Irwin
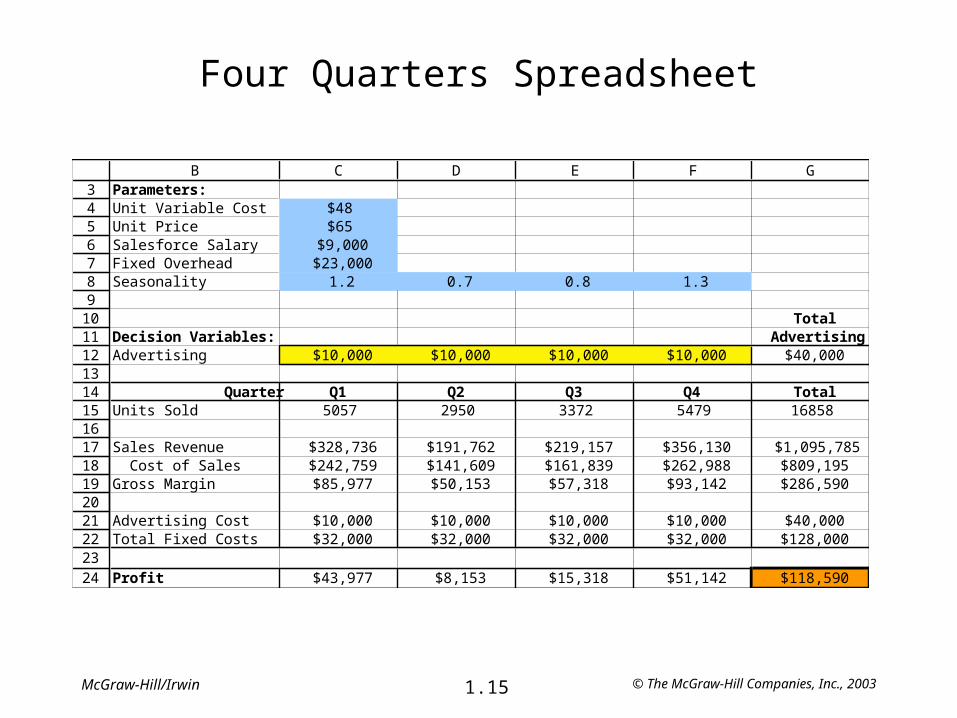
Four Quarters Spreadsheet
3456789101112131415161718192021222324
B C D E F GParameters:Unit Variable Cost $48Unit Price $65Salesforce Salary $9,000Fixed Overhead $23,000Seasonality 1.2 0.7 0.8 1.3
TotalDecision Variables: AdvertisingAdvertising $10,000 $10,000 $10,000 $10,000 $40,000
Quarter Q1 Q2 Q3 Q4 TotalUnits Sold 5057 2950 3372 5479 16858
Sales Revenue $328,736 $191,762 $219,157 $356,130 $1,095,785 Cost of Sales $242,759 $141,609 $161,839 $262,988 $809,195Gross Margin $85,977 $50,153 $57,318 $93,142 $286,590
Advertising Cost $10,000 $10,000 $10,000 $10,000 $40,000Total Fixed Costs $32,000 $32,000 $32,000 $32,000 $128,000
Profit $43,977 $8,153 $15,318 $51,142 $118,590
© The McGraw-Hill Companies, Inc., 20031.16McGraw-Hill/Irwin
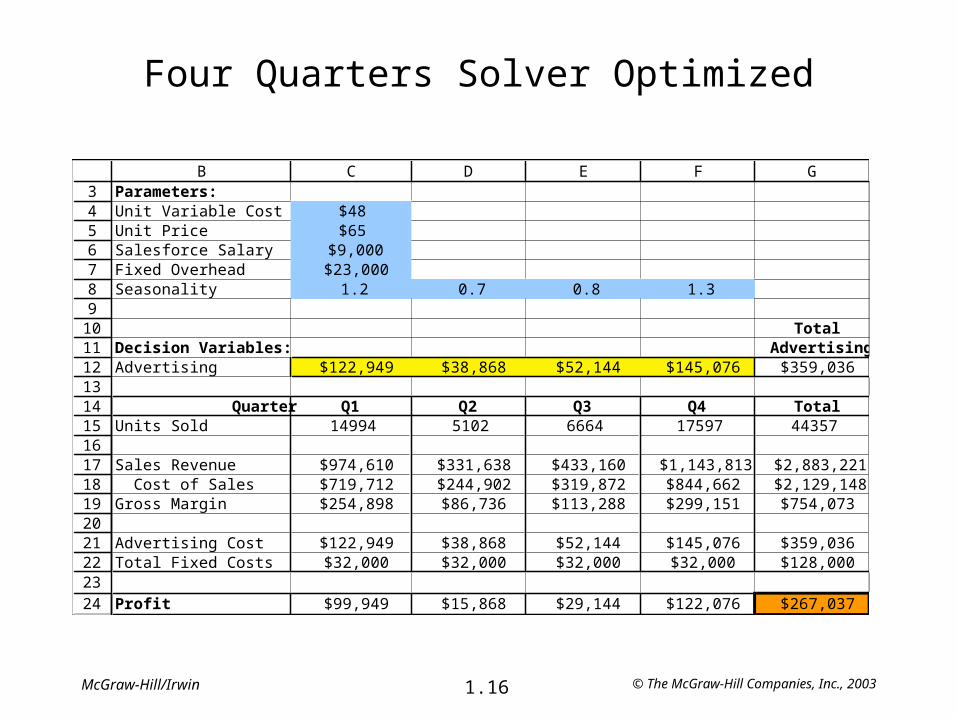
Four Quarters Solver Optimized
3456789101112131415161718192021222324
B C D E F GParameters:Unit Variable Cost $48Unit Price $65Salesforce Salary $9,000Fixed Overhead $23,000Seasonality 1.2 0.7 0.8 1.3
TotalDecision Variables: AdvertisingAdvertising $122,949 $38,868 $52,144 $145,076 $359,036
Quarter Q1 Q2 Q3 Q4 TotalUnits Sold 14994 5102 6664 17597 44357
Sales Revenue $974,610 $331,638 $433,160 $1,143,813 $2,883,221 Cost of Sales $719,712 $244,902 $319,872 $844,662 $2,129,148Gross Margin $254,898 $86,736 $113,288 $299,151 $754,073
Advertising Cost $122,949 $38,868 $52,144 $145,076 $359,036Total Fixed Costs $32,000 $32,000 $32,000 $32,000 $128,000
Profit $99,949 $15,868 $29,144 $122,076 $267,037
© The McGraw-Hill Companies, Inc., 20031.17McGraw-Hill/Irwin
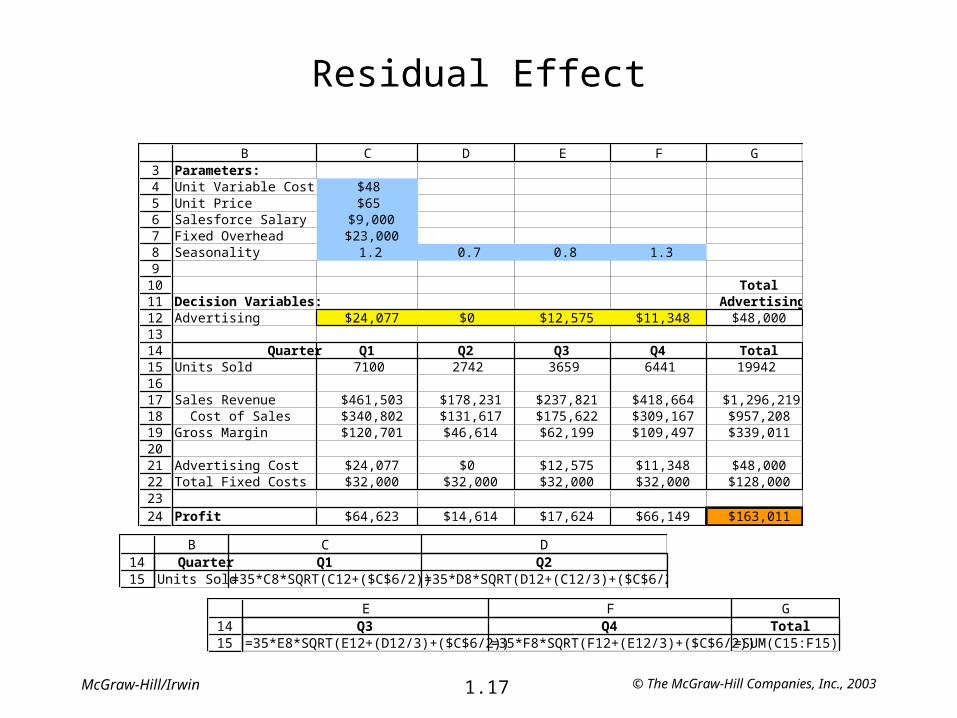
Residual Effect
3456789101112131415161718192021222324
B C D E F GParameters:Unit Variable Cost $48Unit Price $65Salesforce Salary $9,000Fixed Overhead $23,000Seasonality 1.2 0.7 0.8 1.3
TotalDecision Variables: AdvertisingAdvertising $24,077 $0 $12,575 $11,348 $48,000
Quarter Q1 Q2 Q3 Q4 TotalUnits Sold 7100 2742 3659 6441 19942
Sales Revenue $461,503 $178,231 $237,821 $418,664 $1,296,219 Cost of Sales $340,802 $131,617 $175,622 $309,167 $957,208Gross Margin $120,701 $46,614 $62,199 $109,497 $339,011
Advertising Cost $24,077 $0 $12,575 $11,348 $48,000Total Fixed Costs $32,000 $32,000 $32,000 $32,000 $128,000
Profit $64,623 $14,614 $17,624 $66,149 $163,011
1415
B C DQuarter Q1 Q2
Units Sold =35*C8*SQRT(C12+($C$6/2)) =35*D8*SQRT(D12+(C12/3)+($C$6/2))
1415
E F GQ3 Q4 Total
=35*E8*SQRT(E12+(D12/3)+($C$6/2)) =35*F8*SQRT(F12+(E12/3)+($C$6/2)) =SUM(C15:F15)
© The McGraw-Hill Companies, Inc., 20031.18McGraw-Hill/Irwin
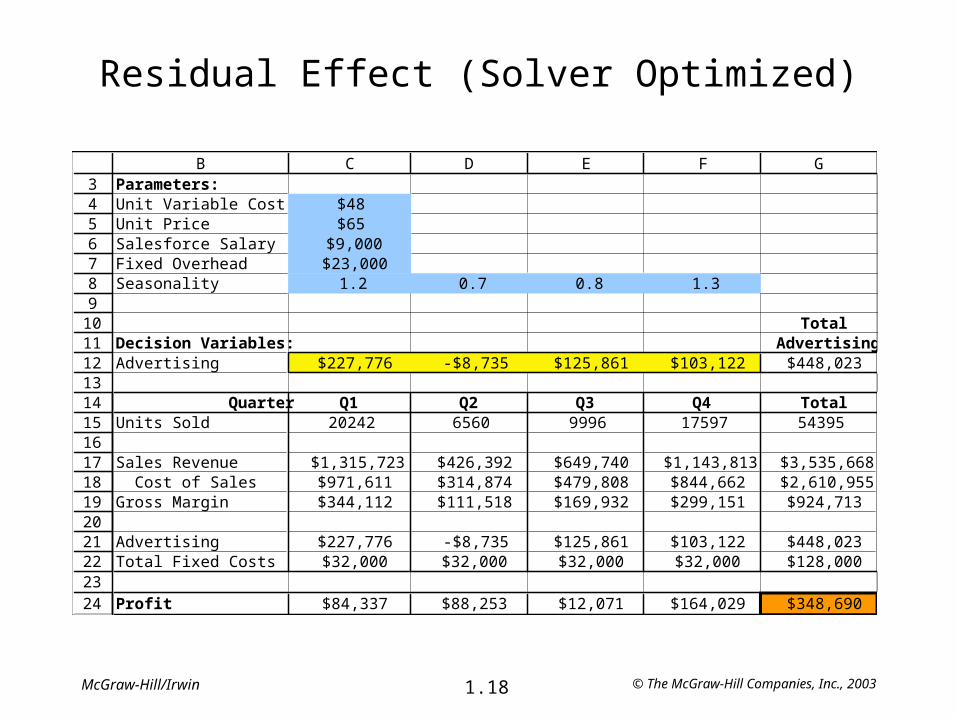
Residual Effect (Solver Optimized)
3456789101112131415161718192021222324
B C D E F GParameters:Unit Variable Cost $48Unit Price $65Salesforce Salary $9,000Fixed Overhead $23,000Seasonality 1.2 0.7 0.8 1.3
TotalDecision Variables: AdvertisingAdvertising $227,776 -$8,735 $125,861 $103,122 $448,023
Quarter Q1 Q2 Q3 Q4 TotalUnits Sold 20242 6560 9996 17597 54395
Sales Revenue $1,315,723 $426,392 $649,740 $1,143,813 $3,535,668 Cost of Sales $971,611 $314,874 $479,808 $844,662 $2,610,955Gross Margin $344,112 $111,518 $169,932 $299,151 $924,713
Advertising $227,776 -$8,735 $125,861 $103,122 $448,023Total Fixed Costs $32,000 $32,000 $32,000 $32,000 $128,000
Profit $84,337 $88,253 $12,071 $164,029 $348,690
© The McGraw-Hill Companies, Inc., 20031.19McGraw-Hill/Irwin
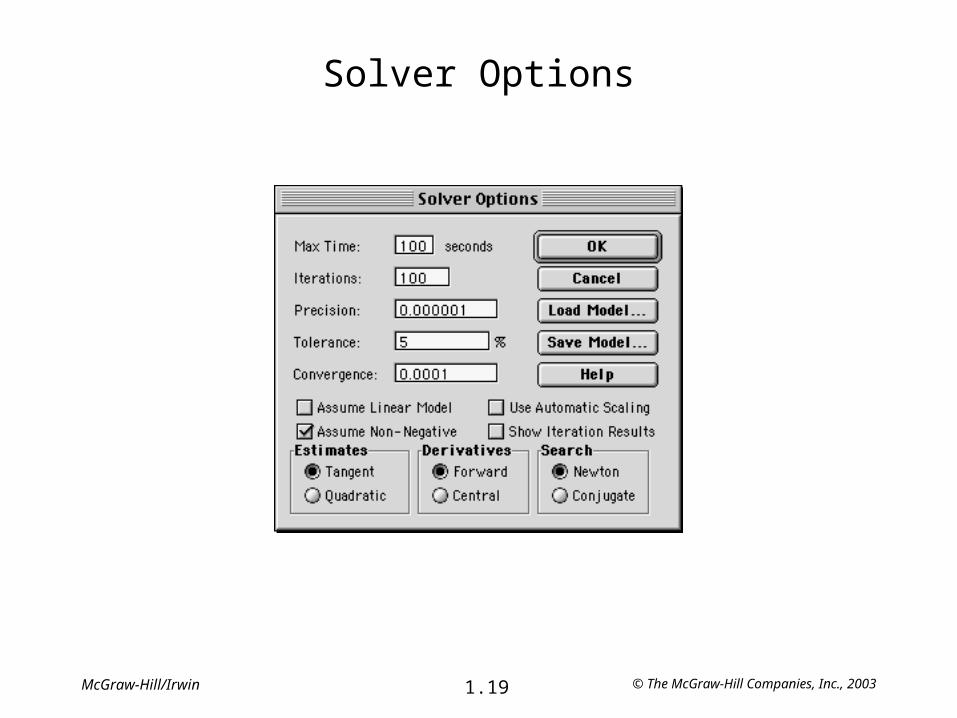
Solver Options
© The McGraw-Hill Companies, Inc., 20031.20McGraw-Hill/Irwin
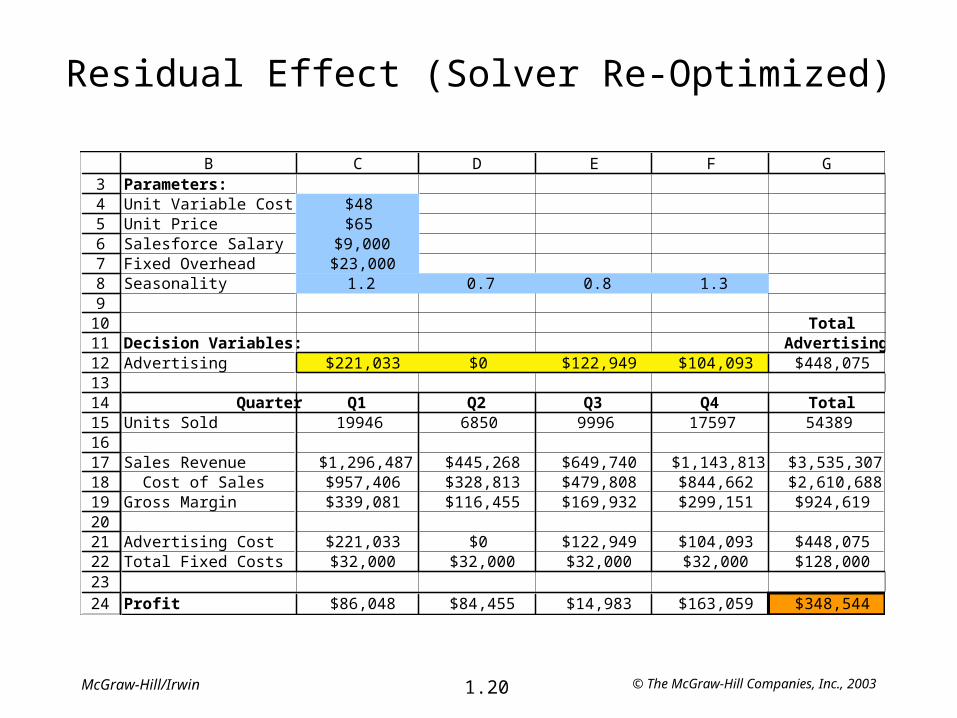
Residual Effect (Solver Re-Optimized)
3456789101112131415161718192021222324
B C D E F GParameters:Unit Variable Cost $48Unit Price $65Salesforce Salary $9,000Fixed Overhead $23,000Seasonality 1.2 0.7 0.8 1.3
TotalDecision Variables: AdvertisingAdvertising $221,033 $0 $122,949 $104,093 $448,075
Quarter Q1 Q2 Q3 Q4 TotalUnits Sold 19946 6850 9996 17597 54389
Sales Revenue $1,296,487 $445,268 $649,740 $1,143,813 $3,535,307 Cost of Sales $957,406 $328,813 $479,808 $844,662 $2,610,688Gross Margin $339,081 $116,455 $169,932 $299,151 $924,619
Advertising Cost $221,033 $0 $122,949 $104,093 $448,075Total Fixed Costs $32,000 $32,000 $32,000 $32,000 $128,000
Profit $86,048 $84,455 $14,983 $163,059 $348,544

© The McGraw-Hill Companies, Inc., 20031.21McGraw-Hill/Irwin
Residual Effect with Budget (Optimized)
3456789101112131415161718192021222324
B C D E F G H IParameters:Unit Variable Cost $48Unit Price $65Salesforce Salary $9,000Fixed Overhead $23,000Seasonality 1.2 0.7 0.8 1.3
TotalDecision Variables: Advertising BudgetAdvertising $24,077 $0 $12,575 $11,348 $48,000 <= $48,000
Quarter Q1 Q2 Q3 Q4 TotalUnits Sold 7100 2742 3659 6441 19942
Sales Revenue $461,503 $178,231 $237,821 $418,664 $1,296,219 Cost of Sales $340,802 $131,617 $175,622 $309,167 $957,208Gross Margin $120,701 $46,614 $62,199 $109,497 $339,011
Advertising Cost $24,077 $0 $12,575 $11,348 $48,000Total Fixed Costs $32,000 $32,000 $32,000 $32,000 $128,000
Profit $64,623 $14,614 $17,624 $66,149 $163,011
© The McGraw-Hill Companies, Inc., 20031.22McGraw-Hill/Irwin
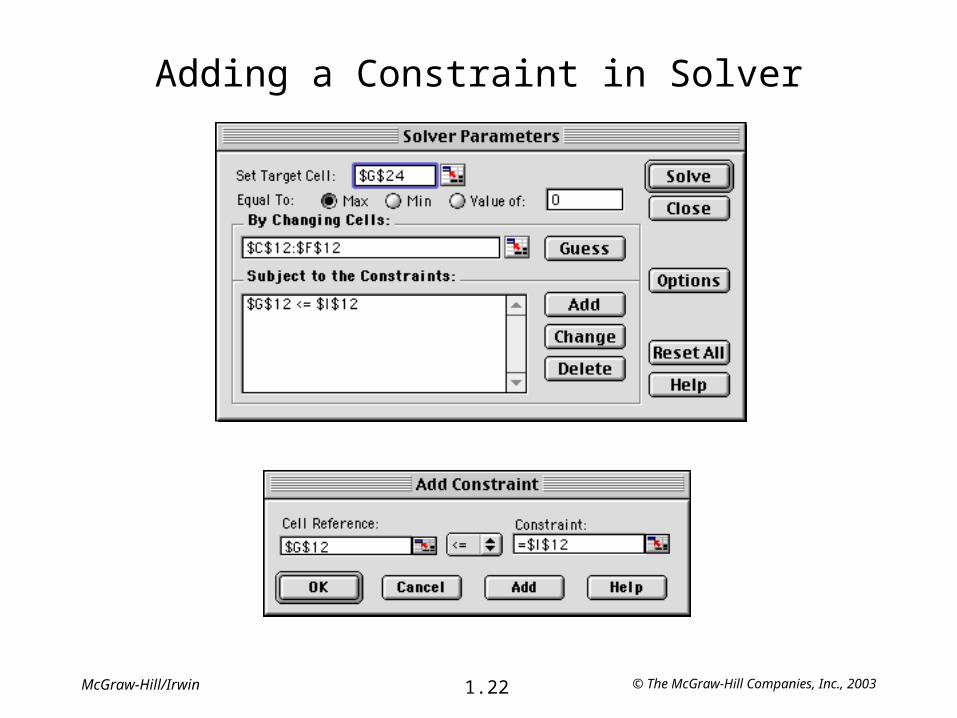
Adding a Constraint in Solver


