Embed Size (px)
Citation preview

Volume 3Volume 3
Emergency Response in theWake of the World Trade Center Attack:
The Remote Sensing Perspective
By Charles K. Huyck and Beverley J. Adams
Emergency Response in theWake of the World Trade Center Attack:
The Remote Sensing Perspective
MCEER Special Report SeriesMCEER Special Report Series
Engineering and Organizational Issues Related tothe World Trade Center Terrorist Attack
Engineering and Organizational Issues Related tothe World Trade Center Terrorist Attack
By Charles K. Huyck and Beverley J. Adams

The Multidisciplinary Center for Earthquake Engineering Research (MCEER) is a national centerof excellence in advanced technology applications that is dedicated to the reduction of earthquakelosses nationwide. Headquartered at the University at Buffalo, State University of New York, the Centerwas originally established by the National Science Foundation (NSF) in 1986, as the National Centerfor Earthquake Engineering Research (NCEER).
Comprising a consortium of researchers from numerous disciplines and institutions throughoutthe United States, the Center’s mission is to reduce earthquake losses through research and the applica-tion of advanced technologies that improve engineering, pre-earthquake planning and post-earthquakerecovery strategies. Toward this end, the Center coordinates a nationwide program of multidisciplinaryteam research, education and outreach activities.
Funded principally by NSF, the State of New York and the Federal Highway Administration (FHWA),the Center derives additional support from the Federal Emergency Management Agency (FEMA), otherstate governments, academic institutions, foreign governments and private industry.
Cover design by Hector Velasco with Charles Huyck, Beverley Adams and Michelle Zuppa; center imageprovided by ImageCat, Inc. and background image is from National Oceanic & Atmospheric Adminis-tration (NOAA).
The Multidisciplinary Center for Earthquake Engineering Research

MCEER Special Report Series
Engineering and Organizational Issues Related toThe World Trade Center Terrorist Attack
Volume 3Emergency Response in the Wake of
the World Trade Center Attack:The Remote Sensing Perspective
By Charles K. Huyck and Beverley J. AdamsImageCat, Inc.
Long Beach, California 90802
June 2002
MCEER-02-SP05Red Jacket Quadrangle
Tel: (716) 645-3391; Fax: (716) 645-3399; Email: [email protected] Wide Web: http://mceer.buffalo.edu


iii
Foreword
The terrorist attack that took place on September 11, 2001 in New York Cityresulted in thousands of lives lost, the collapse of the twin towers of the WorldTrade Center as well as damage to adjacent buildings, and extensive disruptionof transportation and other lifeline systems, economic activity, and other socialactivities within the city and the surrounding area. When the final accountingtakes place, this attack will almost certainly constitute one of the most deadlyand costly disaster events in U. S. history.
In a very real sense, the September 11 tragedy, the nature of the damage thatoccurred, the challenges that the city's emergency response faced, and the actionsthat were undertaken to meet those demands can be seen as a "proxy"-albeit ageographically concentrated one-for what a major earthquake can do in acomplex, densely-populated modern urban environment. Like an earthquake,the terrorist attack occurred with virtually no warning. As would be expectedin an earthquake, fires broke out and multiple structural collapses occurred. Ashas been observed in major urban earthquakes and in other disasters (e.g.,Hurricane Andrew), structures housing facilities that perform critical emergencyfunctions were destroyed, heavily damaged, or evacuated for life-safety reasons.Additionally, because the majority of the damage occurred to relatively newand well-engineered structures and because the emergency response system inNew York City was considered very well prepared for all types of emergencies,particularly terrorist attacks, the attack and its aftermath provide a usefullaboratory for exploring a variety of engineering and emergency managementissues.
In this perspective, the Multidisciplinary Center for Earthquake EngineeringResearch initiated a research project (funded by the National Science Foundation)to collect perishable data in the aftermath of the attack for later study to gain abetter understanding of how resilience is achieved in both physical, engineeredsystems and in organizational systems. The project is divided into two majorcomponents, focusing on the impact of the disaster on engineering andorganizational systems:
(a) Damage to Buildings in the Vicinity of Ground Zero - The objective of thiseffort is to collect perishable information on the various types of damagesuffered by buildings at Ground Zero, including, most importantly, thosethat suffered moderate damage from the impact of large debris but that didnot collapse, and to investigate whether state-of-practice analytical methodsused in earthquake engineering can be used to explain the observed structuralbehavior.

iv
(b) Organizational and Community Resilience in the World Trade Center Disaster- The objective of this effort is to collect information on the response activitiesof the City's Emergency Operations Center and on other critical emergencyresponse facilities. Of particular interest is to identify the plans that were inplace at the time of the disaster, as well as how decision systems and remotesensing technologies were used and coordinated with engineering decisions.Efforts will also include identifying the technologies and tools that weremost useful or failed (or did not meet expectations) during the emergencyperiod, the types of adaptations that had to be made by these organizations,how well intra-organizational communication and coordination functioned,and whether any emerging technologies were used during the emergencyperiod.
The MCEER special report series "Engineering and Organizational Issues Relatedto The World Trade Center Terrorist Attack" was initiated to present the findingsfrom this work. The decision to publish a number of brief individual reportsfocusing on different topics was prompted by the desire to provide timely accessto this information. As such, each report in the series focuses on a narrow aspectof the disaster as studied by MCEER researchers. A compendium of these shortreports is planned at a later time. It is hoped that this work will provide auseful contribution that can lead to a better understanding of how to cost-effectively enhance the resilience of buildings against catastrophic events.

v
Acknowledgments
This work was supported primarily by the Earthquake Engineering ResearchCenters Program of the National Science Foundation (NSF) under a Supple-ment to Award Number ECC-9701471 to the Multidisciplinary Center forEarthquake Engineering Research. The authors thank Dr. Priscilla Nelsonand Dr. Joy Pauschke of NSF for their initiative and support of this project.
Additionally, the following individuals were kind enough to speak to theauthors concerning their knowledge of the use of remote sensing after theattacks on the World Trade Center. This information was absolutely indis-pensable to the production of this report.
Kay Adams, URS CorporationDr. Sean Ahearn, Hunter CollegeDennis Atkins, United States Geological SurveyDr. Susan Cutter, The University of South CarolinaGeorge Davis, Private ConsultantJim Hall, PlangraphicsRuss Johnson, Environmental Systems Research InstituteDavid Kaplan, MITRE CorporationDave Kehrlein, State of California Governor’s Office of Emergency ServicesRon Langhelm, The Federal Emergency Management AgencyAlan Leidner, City of New York, Department of Information, Technology and
TelecommunicationsDaniel O’Brien, New York State Emergency Management OfficeBruce Oswald, New York State Office for TechnologyCharles Rigeway, The Federal Emergency Management AgencyJohn Schmidt, Keystone Aerial Surveys, Inc.Chris Sheline, Environmental Systems Research InstituteDavid Shreve, State of California Governor’s Office of Emergency ServicesDebbie Simerlink, EarthData AviationHarvey Simons, The Environmental Protection AgencyJean Tu, PlangraphicsChief Nicholas Visconti, The New York Fire Department


vii
Contents
1.0 Introduction 1
2.0 Historical Overview 5
3.0 Evaluation of Remote Sensing Data 93.1 Aerial Photography 9
3.1.1 Specification 93.1.2 Uses and Usefulness 103.1.3 Problems 123.1.4 Potential Uses 13
3.2 Multispectral Satellite Imagery 143.2.1 Specification 143.2.2 Uses and Usefulness 153.2.3 Problems 153.2.4 Potential Uses 17
3.3 LIDAR Altimetry 183.3.1 Specification 183.3.2 Uses and Usefulness 183.3.3 Problems 203.3.4 Potential Uses 20
3.4 Thermal Imagery 203.4.1 Specification 213.4.2 Uses and Usefulness 213.4.3 Problems 243.4.4 Potential Uses 25
3.5 Hyperspectral Data 253.5.1 Specification 253.5.2 Uses and Usefulness 263.5.3 Problems 263.5.4 Potential Uses 26
3.6 SAR Imagery 263.6.1 Specification 283.6.2 Uses and Usefulness 283.6.3 Problems 283.6.4 Potential Uses 28
3.7 Geospatial Cross-Referencing and GIS 293.7.1 Methods 293.7.2 Uses and Usefulness 29

viii
Contents (Cont’d)
3.7.3 Problems 303.7.4 Potential Uses and Improvements 31
4.0 Lessons Learned 374.1 Remote Sensing Data 374.2 Geospatial Cross-Referencing 384.3 GIS Operations 384.4 Feedback 394.5 Education 39
5.0 Recommendations 41
6.0 References 43

ix
List of Illustrations
3.1 High-resolution vertical aerial photograph acquired byEarthData, showing Ground Zero on the 15th September 2001 11
3.2 High-resolution aerial photograph acquired by NOAA, showingGround Zero on the 23rd September 2001 14
3.3 Multispectral IKONOS satellite coverage of Ground Zeroacquired on the 15th September 2001 16
3.4 Infrared SPOT image, acquired three hours after the WorldTrade Center attack on the 11th of September 2001 17
3.5 Map of LIDAR 3D terrain model for Ground Zero, by EarthDataon the 19th September 19
3.6 Thermal image of Ground Zero acquired by EarthData on the7th October 2001, using a Raytheon airborne sensor 22
3.7 AVIRIS thermal image showing hotspots at Ground Zero on the16th September 2001 23
3.8 RADARSAT1 SAR imagery of Ground Zero, acquired on the 13th
September 2001 using the sensor operating in ‘Standard’ mode 273.9 Visualization of Ground Zero, with orthophotography and
thermal data draped over a LIDAR 3D terrain model 323.10 Changes in elevation on the debris pile at Ground Zero recorded
using 3D LIDAR terrain models for the 17th September andthe 19th September 2001 34
3.11 Temperature data, acquired by EarthData using the FLIRthermal device during October 2001 35


xi
List of Tables
2.1 Timeline showing the acquisition of remote sensing data forGround Zero 7


1
1.0 Introduction
A combination of factors culminated in a breakthrough for remote sensingtechnology in emergency management, following the events of September 11th.First, the World Trade Center attack is an event unparalleled in history. Thedevastation was beyond the imaginative capabilities of emergency managementprofessionals - there was simply no appropriate script for such an event. Thedemand for information proved to be immense. Second, Manhattan is uniquein the United States because of the density of high-rise buildings and the valueof real estate. Because of this, and the logistical needs that follow, the City ofNew York had already undertaken intense mapping efforts, resulting in theproduction of highly accurate vector and raster databases. Third, even thoughthis was a very large disaster, the scale of events in New York was highlylocalized, with primary impacts concentrated in a small geographic area. Theneed to coordinate the response for an event of this magnitude, in a dense yetrelatively small area, made the combination of imagery and data mapsparticularly useful.
As an emerging technology in emergency response, a thorough evaluation ofthe value added by remote sensing data is warranted. However, the value ofthis data can be partially established by its use. Many top officials worked withthe detailed images and maps of Ground Zero. Mayor Guliani visited theEmergency Mapping and Data Center (EMDC) on a daily basis to examine theimages and map products. Chief Phiefer and Chief Werner from the New YorkFire Department (FDNY) were also frequently at the EMDC, gathering imageryfor planning purposes. Standing before the United States Congress Committeeon Science, the role played by remote sensing technology during the initialresponse was formally acknowledged by Robert Shea, representing the FederalEmergency Management Agency (FEMA, 2002). President Bush and DonaldRumsfeld, Secretary of Defense are featured on the front cover of GeospatialSolutions (April 2002) examining high-resolution images of damage at thePentagon. Across the world, newspapers published IKONOS images thatillustrated the magnitude of devastation. It is clear that remote sensing playeda vital role in communication during the months that followed September 11th.
Remote sensing data is most valuable for emergency responders when integratedinto a Geographic Information System (GIS). The capabilities of GIS units tospatially analyze multivariate data is almost endless. The GIS analyst needs toknow which combination of data, processed in what manner, would be mostvaluable to the response teams. Modeling, geospatial analysis, regressionanalysis, image processing, change detection, data mining, damage assessment
2
and other advanced forms of analysis may be factored into the process, but to alimited extent.
As with any information systems product, communication, input, and feedbackfrom end users is essential. The end user may not utilize GIS units to the fullestextent, as they are not aware of all potential capabilities. After a disaster, boththe end user and GIS personnel are extremely busy, stressed, and sometimesemotionally volatile. This is not the best time to assess needs, or learn newmaterial. The data sources and tools should be presented to emergencymanagement personnel before the incident so that they know what will be mostuseful. The concepts, as well as the end products, need to be documented. Forexample, it is clear to many that the GIS and remote sensing response wouldhave been more effective after September 11th had there been onsite mobileunits. Also, it is clear the primary responders, the FDNY, were able to maketremendous use of maps and remote sensing data during this disaster. Thismay be due in part to the influence of the remote sensing unit within thedepartment (Phoenix Photography and Imagery Group).
The purpose of this report is to document the use of remote sensing in responseto the World Trade Center attack. Approaches that worked should not beforgotten, such as overlaying the building footprints onto images of rubble tolocate elevator shafts, where bodies were later found. Problems that wereencountered should not be dismissed, such as the need for absolute temperatures,rather than arbitrary digital numbers. There are technologies such as LightDetection and Ranging (LIDAR) imagery that some found useful, while othersquestioned their value. There were also ideas that analysts had no time toinvestigate during emergency response, because they were overwhelmed withmap requests. Through interviewing, and in a sense "brain-storming" with keyGIS personnel that were involved, this report will address how each remotesensing data set was used, and how it might have been used if there had beenmore time dedicated to processing the data. New ideas are also presented forusing the data collected. The general lack of experience with remote sensingtechnology as a tool in emergency management and threat of further disasters,especially from terrorism, underscores the need to harness the knowledge ofthose who responded to the World Trade Center incident, and to the extentpossible, create a script for future events.
Although this report does not present a general timeline of events as theyunfolded, specific occurrences after the incident are valuable for establishingthe ways in which remotely sensed data can be used after a disaster. Section 2of this report therefore documents the sequence of key events, including thetiming of data acquisition and release of map-based products that proved pivotalto the integration of remote sensing data in emergency operations.
3
While Global Positioning System (GPS) technology, certain surveying equipment,and hand-held electronic devices can be considered remote sensing devices, thecurrent emphasis is on airborne and satellite data with a resolution greater than20 meters. These data sets are generally delivered in, or converted to a rasterenvironment, which forms a two- or three-dimensional surface over the entirearea analyzed. Because of this spatial ubiquity and multi-temporal acquisition,these types of remote sensing data are very useful for assessing emergencyresponse requirements, especially in conjunction with other data. Given thelocalized scale of events, it is unlikely that lower resolution data, from systemssuch as Landsat TM, ERS and MODIS, would have been useful. The catalog ofprimary remote sensing data used to support emergency operations is describedfully in Section 3. Each sensor is accompanied with a brief description for laymen,a discussion of how the data was used, problems that were encountered usingthe data, and how such data might be used in future events. While the focus isshifted away from organizational, GIS, database, or other issues that impactedthe use of advanced technologies, problems in these areas that directly impededthe use of, or were addressed using remote sensing data, are briefly discussed.
Although highly valued and of widespread use following September 11th, it isimportant to recognize that with better planning and preparedness, remotesensing and GIS could have played an even greater role. Based upon informationgathered from interviews with key individuals involved in the emergencyresponse, Section 4 considers lessons learned with respect to data acquisition,processing and logistical aspects of integrating remote sensing and GIS intoemergency operations. Working with post-event imagery, new methods of datavisualization are also presented, which may have proved useful for responseand recovery teams. These findings establish the basis for a series ofrecommendations for future applications of remote sensing in disastermanagement, which are presented in Section 5. Interviews undertaken withkey emergency management and GIS personnel constitute the main source ofinformation for this document. Coupled with ImageCat’s knowledge of remotesensing and emergency response, these accounts underpin the evaluation ofthe role played by advanced spatial technologies following September 11th.

5
2.0 Historical Overview
The following section provides a historical view of the role played by remotesensing data and GIS technology in the first critical weeks after September 11th.First, a summary of key events is provided, which was produced usinginformation from published documents, written accounts (see, for example,Geoplace.com, 2001b), and interviews conducted by ImageCat with personnelinvolved in emergency operations. Details are then given of the remote sensingdatasets acquired at the World Trade Center, including the data source orplatform, type of imagery, and date of release to response and recovery workers.Table 2-1 provides a timeline of the acquisition of remote sensing data.
Tuesday 11th September 2001
• The World Trade Center is attacked.
• Commercial air traffic ban instituted.
• SPOT sensor acquires satellite coverage of Ground Zero, and images areposted on the Internet.
• Collapsed buildings include 7 World Trade Center, where the New YorkCity map and municipal geographic database were housed.
• Hard-copy maps of World Trade Center are delivered by Alan Leidner(Department of Information Technology and Telecommunications(DOITT)) to the new emergency center at the New York (NY) City PoliceAcademy.
Wednesday 12th September 2001
• NY State Office of Technology (OFT) coordinates with Alan Leidner andSean Ahearn (Professor of Geography at Hunter College), to develop alist of remote sensing needs. This includes orthophotography, LIDARand thermal data.
• OFT investigates the logistics of gathering data, including gettingpermission to fly.
• IKONOS sensor acquires satellite coverage of Ground Zero, and imagesare posted on the Internet and published in newspapers around the world.
• A backup copy of the New York City GIS database (comprising digitalorthophotographs of the city, and vector attributes including streets,building footprints, transport networks, rivers and waterways) is set up

6
as a base map for GIS operations, by Al Leidner and Sean Ahearn, at thetemporary Emergency Mapping Center at the NY Police Academy.
Thursday 13th September 2001
• The Federal Aviation Authority lifts the air traffic ban for approvedaircraft.
• Digital photographs are obtained by the Fire Department PhoenixPhotography and Imagery Group, by holding a digital camera out of thewindow of a police helicopter.
• Vertical aerial photographs are flown by Keystone Aerial Surveys for theNY State Emergency Management Office (SEMO).
Friday 14th September 2001
• The OFT awards the contract for remote sensing data to EarthDataInternational.
• The EMDC is moved from the NY Police Academy to Pier 92 on theHudson River. The center houses organizations with remote sensing andGIS expertise, from the DOITT, the Deep Infrastructure Group, the NewYork Parks Department, ESRI and Plangraphics.
• EarthData sets up a centralized data collection and processing facility inAlbany.
Saturday 15th September 2001
• EarthData flies the first round of aerial photography, LIDAR and thermalimagery. The data is received on removable disk and processed in Albany.
• Three centers for GIS are up and running: (1) EMDC on Pier 92, dealingboth with Ground Zero and the wider New York area; (2) FEMA DisasterField Office on Pier 90; and (3) Urban Search and Rescue at the Jacob K.Javits Convention Center, focusing on Ground Zero alone.
Sunday 16th September 2001
• AVIRIS hyperspectral sensor is first deployed by the Jet PropulsionLaboratory (JPL) and the National Aeronautical and Space Administration(NASA) to acquire visible and thermal imagery of Ground Zero.
Monday 17th September 2001
• The State police and Metropolitan Transit Authority police deliver theremotely sensed EarthData images on CD-ROM to emergency responseworkers. The data circulation list includes: the FDNY; FEMA;

7
Environmental Protection Agency (EPA); US Army Corps of Engineers;and the State Office of Emergency Management (OEM). For data securityand confidentiality, new users require approval from Al Leidner.
September/October 2001
• Remote sensing data became available on-line at the OFT and EROS datacenter. Initially this was limited to the processed imagery. Later,information was added concerning the flight history, data specificationsand remotes sensing devices.
• 50 standard maps are produced at the EMDC and revised every one ortwo days. In total, more than 2,000 requests are made and 10,000 mapsproduced. In terms of accuracy, all maps satisfy the national mappingstandards of +/- 2ft.
• FEMA sets up a separate data acquisition contract with EarthDataAviation, to map the debris disposal ground on Staten Island.
Table 2.1. Timeline showing the acquisition of remote sensing data for Ground Zero.
Continued on next page
Date Source Type of Data Comments
9/11/2001 SPOT Multispectral andpanchromatic imagery
Data available on Internet
9/12/2001 IKONOS Multispectral andpanchromatic imagery
Data available on Internet
9/13/2001 Fire Department Digital photographs(oblique)
Keystone Digital photographs(vertical)
9/14/2001
9/15/2001 EarthData Digital aerial photographs(vertical)LIDAR imagery
IKONOS Multispectral andpanchromatic imagery
9/16/2001 AVIRISEarthData
Hyperspectral imageryThermal imagery
9/17/2001 EarthData Digital aerial photographs(vertical)LIDAR imageryThermal imagery
EarthData releases orthophotos andthermal imagery of Ground Zero
9/18/2001 AVIRISEarthData
Hyperspectral imageryThermal imagery
EarthData releases LIDAR imagery;AVIRIS thermal data released
9/19/2001 EarthData Digital aerial photographs(vertical)LIDAR imageryThermal imagery

8
Table 2.1. Timeline showing the acquisition of remote sensing datafor Ground Zero (Continued).
Date Source Type of Data Comments
9/20/2001 EarthData LIDAR imageryThermal imagery
EarthData releases orthophotos andLIDAR imagery of Lower Manhattan
9/21/2001 EarthData Digital aerial photographs(vertical)LIDAR imagery
Thermal imagery
Poor photography and thermal data due tocloud coverEarthData releases orthophotos andLIDAR imagery of Staten Island
9/22/2001 AVIRISEarthData
Hyperspectral imageryDigital aerial photographs(vertical)LIDAR imagery
Thermal imagery
9/23/2001 EarthData LIDAR imageryThermal imagery
AVIRIS Hyperspectral imagery
NOAA LIDAR imageryAerial photography(vertical)
9/24/2001 Poor weather conditions
9/25/2001 EarthData LIDAR imagery
Thermal imagery
9/26/2001 EarthData Digital aerial photographs(vertical)LIDAR imageryThermal imagery
NOAA LIDAR imageryAerial photography(vertical)
9/27/2001 EarthData
Pictometry
LIDAR imageryThermal imageryDigital aerial photographs(oblique)
9/28/2001 EarthData LIDAR imageryThermal imagery
9/29/2001 EarthData Digital aerial photographs(vertical)LIDAR imageryThermal imagery
Poor data due to turbulence
9/30/2001 EarthData Digital aerial photographs(vertical)LIDAR imageryThermal imagery
October2001
EarthData Digital aerial photographs(vertical)LIDAR imageryFLIR imagery
EarthData continues acquiring data. FLIRsystem is used from 10/17/2002 to10/22/2002.

9
3.0 Evaluation of Remote Sensing Data
The historical overview in Section 2 outlines the remote sensing data collectedfor emergency operations following the World Trade Center attack. This sectionof the report provides details of the datasets that were acquired (see also Table2-1), including: aerial photographs and multispectral imagery, thermal, LIDAR,and hyperspectral systems. In each case, the equipment specification isconsidered. Its usefulness in rescue, response and recovery is also discussed,based upon a series of conversations with key individuals involved in emergencyoperations (sources are noted in parenthesis, and their full name and affiliationis listed in the Acknowledgments section of this report), together with publishedreports and articles (see, for example, Geoplace.com, 2001a; New York StateSenate, 2001). The evaluation goes on to consider problems that emerged, andpotential data sources and uses that could prove critical in future emergencysituations. Finally, methods of geospatial cross-referencing are described, whichcombine remote sensing and GIS analysis in supporting emergency operations.
3.1 Aerial Photography
Aerial photographs are images of the earth’s surface, taken from an airplane orhelicopter. There are two main types of air photographs discussed below –vertical, which look straight down, and oblique shots that are taken from oneside. The amount of detail shown by the photography depends on the height ofthe aircraft, the type of digital or film-based camera, and whether the shot istaken in color or black and white.
As shown by the schedule in Table 2-1, several organizations were involvedwith the acquisition of aerial photographic coverage for the World Trade Centersite. Initially, Keystone Aerial Surveys acquired black and white vertical imagesfor the NY State Emergency Management Office (SEMO), and the photographygroup of the Fire Department of New York (FDNY) took digital photographs ofGround Zero from police helicopters, on an intermittent basis. However, onceremote sensing data was formally requested to aid response and recovery, theorganization EarthData collected high-resolution vertical digital photographson a regular basis. Later on during the recovery operations, supplementaryvertical scenes were obtained by the National Oceanic and AtmosphericAdministration (NOAA), and oblique shots by Pictometry International.
3.1.1 Specification
Vertical aerial photography was initially flown by Keystone on 13th September,by a Cessna 320 aircraft carrying a Leica RC30 camera. EarthData then acquired

10
coverage (EarthData, 2001) on 19 occasions between 15th September and 22ndOctober 2002, using a Navajo Chieftain aircraft equipped with a Kodak MegaplusModel 16.8i panchromatic digital camera. Flights were timed to coincide withmidday, in order to minimize shadowing effects. The output is a 256 grayscaleimage. During all flights, precise changes in the position and orientation of thecamera were recorded using an Applanix POS/DG Inertia Measurement Unit(IMU), and coordinates of a known control point measured using a GPS receiver.Since the flying height ranged from 3000-5000 ft, the imagery has a spatialresolution of 0.3-0.5ft. Image rectification and processing procedures (seeEarthData, 2001) were completed on these raw scenes, and data released forgeneral circulation 12 hours later.
Additional vertical scenes were acquired by NOAA on five occasions between23rd September and 15th October 2002 (NOAA, 2001). The Cessna Citation jetwas flown at 3,300 ft with a film-based Leica/LH systems RC30 camera. In thisinstance, the output is a detailed color photograph.
The potential value of high-resolution oblique photographs was demonstratedby the single dataset acquired by Pictometry International, on 27th September2002. However, limited information is available concerning this mission.Specifications for the numerous digital photographs taken on a daily basis bythe FDNY are unknown. The uses and usefulness of these images are describedin the next subsection.
3.1.2 Uses and Usefulness
The value of remote sensing coverage for Ground Zero was immediatelyapparent from the digital photographs taken from the police helicopter.Although these were merely photographs taken out of a window, they helpedfire chiefs assess damage, and accessibility (A. Leidner) and locate hazards suchas hanging debris and unstable ground.
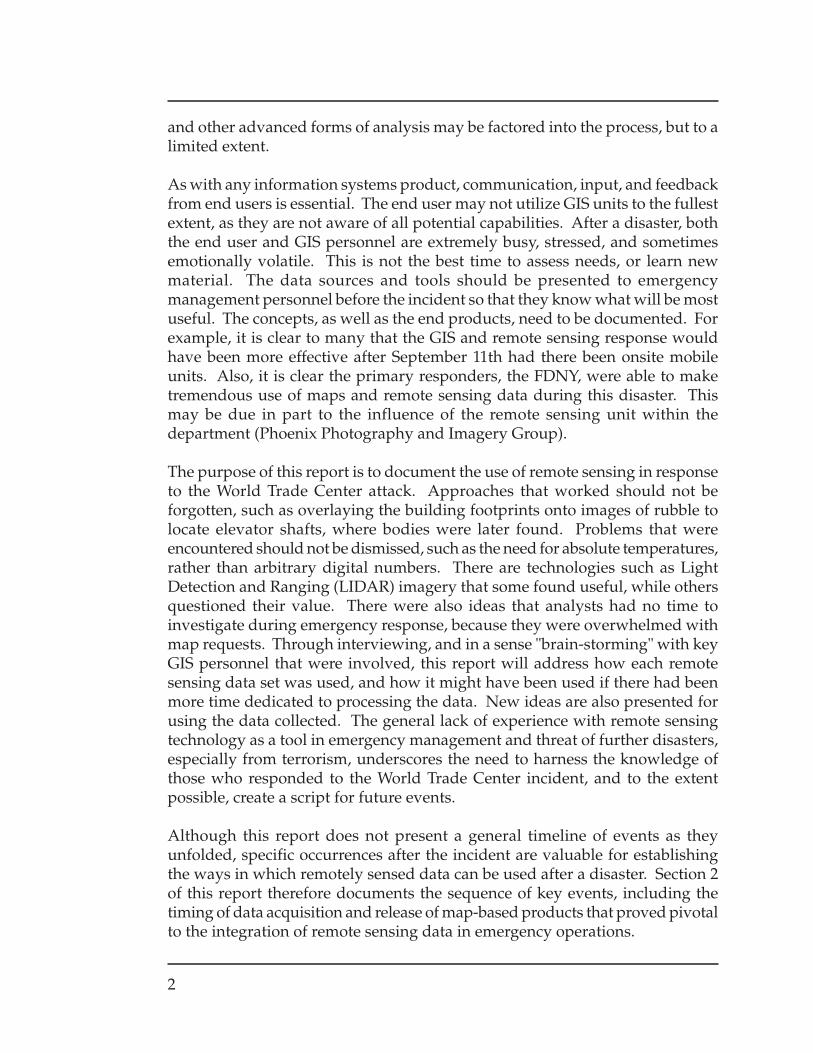
The high-resolution digital coverage collected by EarthData (see Figure 3-1) wasthe most widely used source of aerial data. In particular, orthophotographsproved to be extremely valuable. Orthophotographs are processed so that theyhave the same properties as a map (i.e., distances and orientations are correct),but look like a photograph. For non-specialists, they offered an aerial view thatwas easy to interpret. Initial optical coverage enabled rescue teams to orientthemselves, and gave a clear indication of the magnitude of damage and extentof debris on the site (B. Oswald). Overlaid with Computer Aided design (CAD)models of the twin towers floor plan, they enabled workers to pin point specificlocations of infrastructure, such as stairwells and elevator shafts (J. Tu). Thiscomposite of data was also used for logistical planning, when it was necessary

11
Note: Although much of the smoke arising from the debris pile has abated, part of the imageremains obscured by the plume.
Figure 3.1. High-resolution vertical aerial photograph acquired by EarthData,showing Ground Zero on the 15th September 2001.
to identify a safe and stable position within the Ground Zero site, for craneslifting and clearing debris. Identifying potentially dangerous areas on the debrispile around voids and depressions also helped, by reducing the risk of injury torecovery teams (A. Leidner). The photographs aided orientation for membersof the emergency task force who were unfamiliar with the Lower Manhattanarea. Presented alongside optical data of the World Trade Center prior to itscollapse, the orthophotographs were widely distributed and used extensivelyfor comparative purposes.
12
In view of these factors, it is hardly surprising that orthophotographs were themost requested product at the Javits GIS center (D. Shreve). In subsequent stagesof the recovery, these optical images were used monitor the shrinking ‘red zone’(zone of restricted access), catalogue evidence, coordinate building inspectionsand show damage states for buildings and utilities.
The orthophotographs were widely employed as a base map, on which datacollected for ground zero was overlaid. For firefighters, thermal and opticaldata was a useful combination. The two-dimensional 75 ft square, numbered,transparent grid established by the FDNY for logistical purposes, was alsosuperimposed on the images. This provided a common reference system fortracking objects found amongst the debris. It also enabled recovery workers todiscuss activities and locations on the site. This was particularly important,since the GPS devices were not working due to interference. One can imagine aconversation between tired firefighters, trying to discuss the location associatedwith a clean up task. Thousands of conversations just like these were significantlyshortened through using this data.
The oblique photography captured several weeks after the attacks by Pictometry,provided a valuable indication of damage to buildings surrounding GroundZero. Like the initial photographs taken from helicopters by the fire department,they showed the sides of buildings, the extent of debris on rooftops and thelevel of damage sustained by facades. These images may have enabled firefighters to assess the hazards associated with hanging debris. GIS managerswho examined this trial dataset identified it as a potentially useful tool foremergency situations.
3.1.3 Problems
Although aerial photography was widely used at Ground Zero, there are anumber of problems, which if resolved, could improve its role in emergencyoperations. First, it is important to note that optical coverage is of limited usewhen the scene is obscured by smoke. This was a major limitation of the earliestvertical coverage acquired by Keystone on 13th September. If fires are burningduring the early phases of a disaster, this is not the optimal source of data.Shadowing is also a problem associated with aerial coverage of dense urbanenvironments with a concentration of high-rise buildings. Unless data is acquiredat midday, when the sun is at nadir, shadows can impair visual interpretation,by obscuring areas of interest.
Second, digital images were collected by EarthData in black and white. However,color datasets are generally easier for non-specialists to interpret, since featuresare distinguished by color, in addition to shape and contrast. Ideally, color

13
photographs, like those acquired later by NOAA, should have been availableimmediately after the event. The spatial resolution of these scenes is also anissue. The Phoenix Photography and Imagery Group of the NYFD identified apixel size of ~3 inches as ideal for the identification of individual girders (NewYork State Office for Technology, 2002).
Third, the usefulness of orthophotographs to response teams was limited bythe 12 hour lag between data acquisition and release, during which timeconditions at Ground Zero had changed. Although this was the stipulatedrequirement on which EarthData acted, turnaround time was identified by theFDNY as a major obstacle to use (D. Schiavo, C. Chang, D. Shreve). Finally,oblique photographs are not suitable for GIS programs, thereby limiting theirusefulness for developing map-based products.
3.1.4 Potential Uses
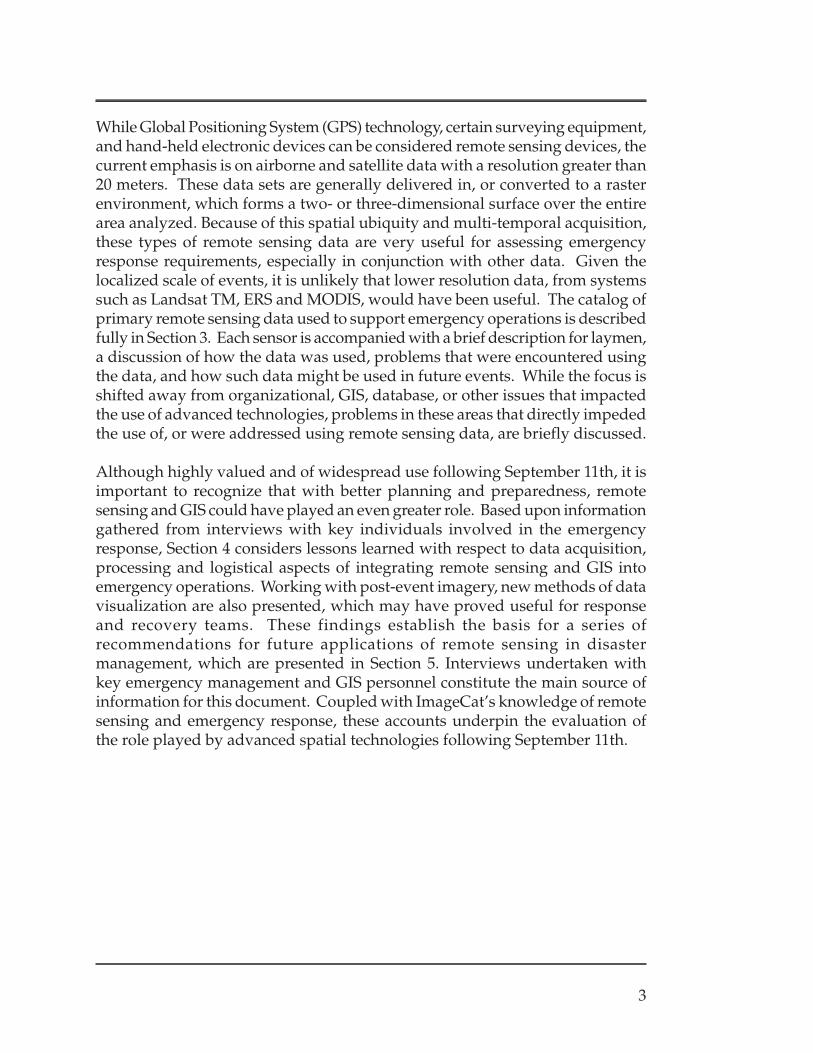
Learning from World Trade Center events, color rather than grayscale aerialphotography would greatly assist response and recovery operations, enablingcrews to distinguish features by their color. In Figure 3-2, on the left hand side,it is possible to visualize the progress of covering the surrounding buildingswith protective material. It is difficult to discern this information from the sameresolution imagery in the black and white version on the right. Several of thecranes and cars in the color image are difficult to see in the black and whiteimage. Furthermore, it is not possible to discern in black and white that thewindows are boarded up on the first floor. Perhaps most importantly, the colorprovides a tie between the image and the world around the person viewing theimage on site, allowing them to quickly orient themselves.
Feedback from response crews further suggests that oblique coverage, such asthat acquired by Pictometry, could prove useful if acquired immediately afterthe event. This perspective could also aid 3D visualization. Using architecturalrendering software, oblique shots could be draped on high resolution DEMs as‘wallpaper,’ providing a side view of building facades that is absent from theorthophotography.
Image processing techniques could generate additional information from high-resolution aerial photographs. Enhancing the visual representation could reduceshading effects. Procedures such as edge enhancement would be useful formapping the locations of girders. Multi-temporal change detection could beused to monitor clean-up operations in an automated manner. Density splicingand classification techniques could also be used to categorize debris for planningpurposes. Once images are brought into image processing software packages,they become much easier to interpret.

14
3.2 Multispectral Satellite Imagery
Satellite imagery of Ground Zero was acquired by the SPOT and IKONOS earthorbiting systems, several days before the high-resolution aerial photographiccoverage. Whereas the aerial photographs from EarthData (see Section 3.1) aresimple black and white or color scenes, these satellite sensors collect digitalmultispectral imagery, which spans a wider range of the electromagnetic (light)spectrum. Data is acquired in a series of ‘bands’, which are sensitive to blue,green and red reflectance, and may also extend beyond visible wavelengths,into infrared regions of the spectrum.
3.2.1 Specification
At 11:55 am of September 11th 2002, only three hours after the terrorist attacks,SPOT 4 acquired a multispectral scene of Ground Zero. Operated by the Frenchorganization SPOT Image (SPOT, 2002), this system has been sending backimages of the earth since its launch on 3/24/1998. The satellite has two sensors:
Note: On the left hand side, it is possible to discern the progress of protecting buildings, the locationsof cranes, and the locations of boarded up windows. It is much more difficult to discern this
information in the black and white image on the right, created by ImageCat for illustrative purposes.
a) b)
Figure 3.2. High-resolution aerial photography acquired by NOAA, showingGround Zero on the 23rd September 2001.

15
a multispectral device with a spatial resolution of 20 meters (m) and a finerresolution panchromatic device that can record objects of 10m. Fourmultispectral bands occupy blue (0.5-0.59 µm), green (0.61-0.68 µm), red (0.79-0.89 µm) and infrared (1.58-1.75 µm) wavelengths. The panchromatic bandoccupies a single range in the visible (0.61-0.68 µm) region of the spectrum.
The IKONOS system, operated by Space Imaging (Space Imaging, 2002), alsoincludes multispectral and panchromatic devices. Multispectral bands includeblue (0.45-0.52 µm), green (0.52-0.6 µm), red (0.63-0.69 µm) and near infrared(0.76-0.90 µm) bands. The panchromatic spans the visible part of the spectrum(0.45-0.9 µm). Compared with SPOT 4, this newer system, launched on9/24/1999, displays the Earth’s surface in much greater detail. Acquired on12th September – one day after the terrorist attacks, IKONOS coverage of theWorld Trade Center has a resolution of 4 m, while the panchromatic band showsdetails of ~1 m.
3.2.2 Uses and Usefulness
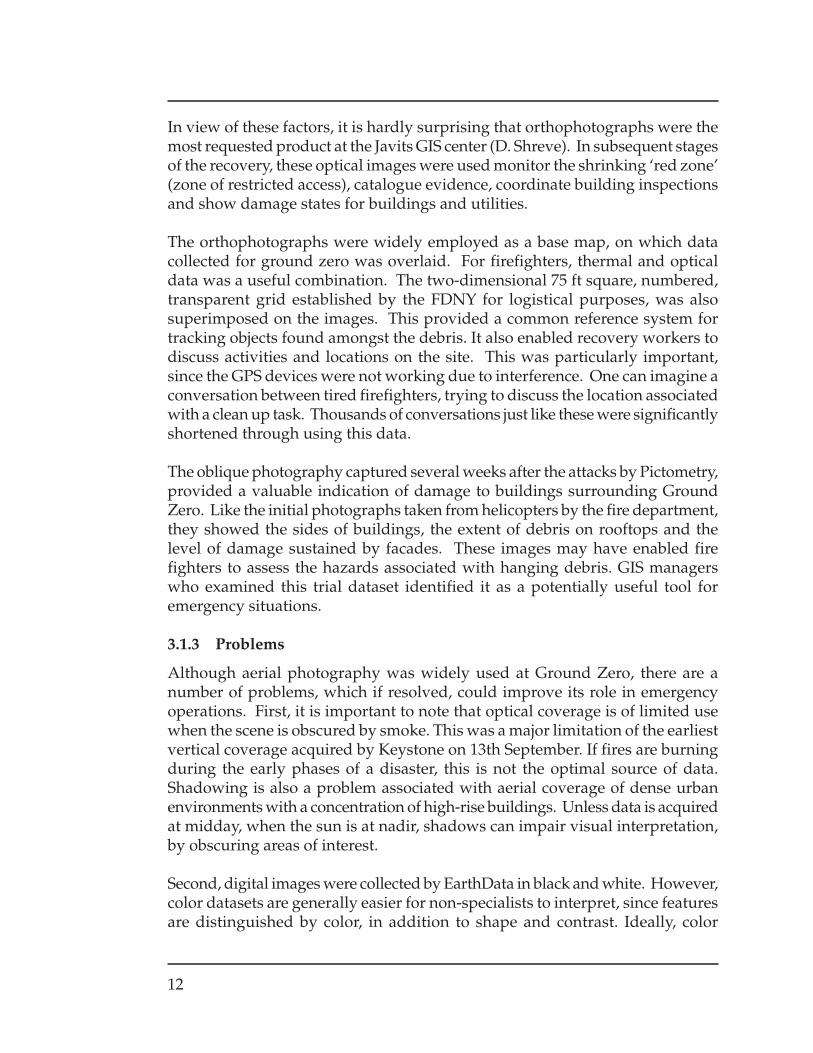
Following the World Trade Center Attack, multispectral IKONOS and SPOTdata were quickly made available on the Internet. Thus, it was employed inemergency efforts several days before the aerial photography. As shown inFigure 3-3, IKONOS imagery gave the general public a view of Ground Zero,with the extent of damage published on the front page of newspapers aroundthe world. For non-specialists, the realistic color format is easy to understandand the 1 m spatial resolution provides a detailed representation of the groundsurface below. For visualization purposes, IKONOS imagery was used as abase-map, and presented as a before/after sequence. These images were veryuseful for visualizing the area as it once stood, as it was difficult for the reliefworkers from out of town to discern on site.
Although useful as an overview of Ground Zero in the wider context of lowerManhattan, the SPOT 4 data in Figure 3-4 played a limited role in emergencyoperations, due to poor spatial resolution (S. Ahearn).
3.2.3 Problems
Many of the subsequent IKONOS images were acquired off-nadir. With off-nadir acquisition, the sensor is tilted away from directly below the satellite toacquire a specific region. Due to the offset sensor position relative to the studysite, features of interest at Ground Zero were obscured by other tall buildings inlower Manhattan.
In addition, visibility was limited in the IKONOS images by smoke obscuringthe ground surface immediately after the terrorist attacks. This is a limitation

16
of visible sensors, and points towards the value of sensors operating in otherregions of the electromagnetic spectrum, such as Synthetic Aperture Radar (SAR).The revisit frequency is also an issue for earth orbiting satellites such as these.For 1 m data captured near nadir, this is 2.9 days. In the case of SPOT, itsusefulness was severely limited by the coarse spatial resolution, where onlyobjects larger than 10 m could be distinguished.
Note: Copyright ©Space Imaging. All rights reserved. Online and news media distribution orpublishing requires permission from Space Imaging.
Figure 3.3. Multispectral IKONOS satellite coverage of Ground Zero, acquired onthe 15th September 2001.

17
3.2.4 Potential Uses
In future disasters, high-resolution data from sensors such as IKONOS andQuickbird (which was launched in October 2001) will provide a useful alternativeto aerial photography, particularly when data acquisition by aircraft andhelicopters is prevented due to air traffic bans. For widespread disasters, thisdata would be useful for the same operations as the aerial photography listedabove. The extensive coverage provided by satellite data is useful for monitoringevents where damage is sustained at a regional rather than localized scale,especially when change detection algorithms are used. Infrared data can beparticularly useful for monitoring heat and detecting damage. For analyticalpurposes, multispectral imagery has the potential to yield additionalinformation, compared with grayscale or color aerial photography. Classificationis an image processing technique that assigns features to groups or ‘classes’depending on their spectral characteristics in different bands of theelectromagnetic spectrum. For example, classification of high-resolution imagerycould distinguish between ground surface materials and debris.
Note: Hotspots associated with fires raging at Ground Zero appear in red.
Figure 3.4. Infrared SPOT image, acquired three hours after theWorld Trade Center Attack on the 11th September 2001.

18
3.3 LIDAR Altimetry
Light detection and ranging instruments collect information about the elevationof the earth’s surface, by measuring the amount of time taken for beams of lightto strike the ground and return to the sensor. Devices are generally mounted onan aircraft platform, and a high density of point samples recorded along adesignated path or swath. LIDAR data is usually interpolated onto a raster gridor a Triangulated Irregular Network (TIN) is used to produce terrain models,which present topographic variations as a basic 3D map. During the early stagesof emergency operations, EarthData acquired LIDAR coverage of Ground Zeroon a daily basis (see Table 2-1). Toward the end of the program, NOAA acquiredadditional scenes and the frequency of collection by EarthData was reduced toa three to four day interval.
3.3.1 Specification
EarthData first acquired LIDAR coverage on 15th September, using an AeroScanmultiple return sensor carried aboard a Navajo Chieftain aircraft (see EarthData,2001; also Section 3.1). During all flights, precise changes in the position andorientation of the LIDAR unit were recorded using an Applanix POS/DG IMU,and coordinates of a known control point measured using a GPS receiver.Although the measurement frequency varies with the elevation and speed ofthe aircraft, spatial resolution was in the range 6-15 ft (EarthData, 2001). In thiscase, spatial resolution refers to the average distance between elevation readings,rather than the pixel size. Following image registration and processing, the firstLIDAR surface models were available to response teams on 17th September.Difference images (created by subtracting two images from different dates) wereperceived to have an accuracy of +/- 9 cm (S. Ahearn).
NOAA acquired five additional scenes between 23rd September and 15thOctober (NOAA, 2001), using an Optech LIDAR unit carried aboard a CessnaCitation jet. Flown at an altitude of 5,000-6,000 feet, the resolution of these modelsis coarser than the EarthData scenes.
3.3.2 Uses and Usefulness
The LIDAR imagery flown by EarthData (Figure 3-5) was particularly usefulduring the early stages of emergency operations when, on 17th September, itwas used to visualize Ground Zero through the smoke (S. Ahearn). The basic3D models were employed by fire chiefs as a planning and visualization tool.They would use the resulting maps to discuss events as they correlated with thedebris (S. Ahearn). They were also widely used by response teams and theFederal Emergency Management Acency (FEMA), for assessing the extent of

19
damage, together with the shape, volume and depth of depressions in the debrispile. Later on during emergency operations, LIDAR difference images wereused to track debris removal, and to explore subsidence in the debris pile (D.Kaplan, S. Ahearn), which if significant could have posed a considerable risk toemergency crews.
In terms of map-products, overlaying of the 3D LIDAR model with a map ofhazardous materials and fuel sources was particularly useful for ascertainingwhat was happening underneath the ground. (A. Leidner). The correlationbetween voids and the position of fuel and freon tanks provided a focus for firefighters (N. Visconti), possibly preventing explosions that would have releasedtoxic gases.
Note: This is a photograph of the map from the exhibit "Charting Ground Zero Before andAfter" at the Woodard Gallery (see Woodward Gallery, 2002).
Figure 3.5. Map of LIDAR 3D terrain model for Ground Zero, acquired byEarthData on the 19th September.

20
3.3.3 Problems
The value of LIDAR data for visualizing ground surface features in the red zoneand distinguishing between changes due to debris removal and subsidence couldbe improved by increasing the point sampling density. Its usefulness was alsolimited by the processing time between acquisition and delivery. Althoughimagery was delivered the following morning, the debris pile had often changedduring this interim period. For similar reasons, response and recovery teamscontinued to rely on the real time monitoring of subsidence levels offered by anonsite laser altimeter (D. Kehrlein). Data processing issues may have affectedthe accuracy of LIDAR coverage. The highest elevations appeared to change,suggesting that interpolation algorithms were used to derive a trend rather thana precise elevation surface (C. Rigeway).
3.3.4 Potential Uses
When LIDAR collects elevation readings, often the intensity of the response isalso captured. As with optical data or radar data, intensity changes with material.This data can be mapped, and the result resembles a black and white image,with metal objects standing out as the most reflective. The sensor used byEarthData was apparently unable to capture intensity, and many individualsworking with the LIDAR coverage were unfamiliar with the concept of thisdataset. During the early stages of events, when Ground Zero was obscured bysmoke, intensity readings captured by the LIDAR sensor may have provided auseful indication of damage levels. However, in view of the general lack offamiliarity with this dataset, remote sensing specialists would require trainingin the processing and interpretation.
Additional analysis could be undertaken and new composite images producedusing LIDAR coverage. For example, a difference image could be created, bysubtracting a temporal sequence of the 3D terrain models. This would providea visual indication of the changing shape (see the illustrative example in Figure3-10), and a numerical value of volumetric changes in the debris pile. The fusionof orthophotography and thermal imagery to this composite would clarify therelationship between depressions in the debris, hotspots and hazardous objects.Draping thermal difference maps with the LIDAR imagery (see, for example,Figure 3-9) could provide a more robust indication of successful fire fightingstrategies and cool-down rates.
3.4 Thermal Imagery
In simple terms, thermal imagery records the temperature of a designatedsurface, in this instance the debris pile at Ground Zero. The ‘temperature’ isactually a calibrated measure of emitance in the thermal region of the

21
electromagnetic spectrum, which falls just above the visible wavelengths thatwere studied using multispectral sensors (see Section 3.2). For the World TradeCenter, data was collected using both airborne and satellite sensors. The SPOT4 coverage was acquired soon after the terrorist attacks, with airborne imageryfrom EarthData Aviation and AVIRIS delayed until the 16th September, due tothe ban on air traffic.
3.4.1 Specification
During the initial phase of response and recovery, flights by EarthData(EarthData 2001) provided thermal imagery every other day. Commencing on16th September, data were acquired using a tripod mounted Raytheon NightsightPalm IR 250 thermal camera, carried aboard a Navajo Chieftain aircraft. Flightswere undertaken just after daybreak, to minimize the effects of solar heating onthe scene. The resulting thermal data (see Figure 3-6) has a spatial resolution of2ft and was captured on a video format. Individual scenes were obtained by"frame grabbing". This is a process of pausing the video, creating an imagefrom the paused video that is transferable to image processing software, andregistering the resulting still. Two stills were often required. It is important tonote that output shows the relative (hot versus cold), rather than absolute (interms of degrees Kelvin) magnitude of temperatures on the ground surface.
From October 17th to October 22nd, EarthData thermal imagery was alsoobtained using a FLIR ThermaCAM SC2000 radiometric camera. This logsindividual frames on a PCMCIA card, rather than recording continuously onvideotape. The resulting data is in 8-bit (256 level) format. Since neither of thesethermal data sources were GPS referenced, both required registration relativeto a baseline orthophotograph.
The first round of thermal data acquisition by JPL/NASA (Clark et al., 2001)coincided with that of EarthData. In this instance, thermal imagery was obtainedas part of the hyperspectral Airborne Visible/Infrared Imaging Spectrometer(AVIRIS) coverage, which is described fully in Section 3.5. The output (see, forexample, Figure 3-7) is absolute temperature values in degrees Kelvin.
The SPOT 4 satellite coverage obtained on 12th September by SPOT Image (SPOT,2002) precedes both the EarthData and AVIRIS datasets. Recording emitancebetween wavelengths of 1.58-1.75 µm, this data has a spatial resolution of 15 m.Further details of the platform and sensor are provided in Section 3.2.1.
3.4.2 Uses and Usefulness
The most frequently used thermal infrared data was flown by EarthData (seeFigure 3-6). As with all of the data collected by this company, imagery was

22
Note: Thermal data are overlaid on an orthophotograph obtained on October 8th. Variationsin temperature are evident across the site. However, these values were acquired (and are
therefore displayed) using an 8-bit radiometric scale, rather than an absolute calibration suchas degrees Fahrenheit
Figure 3.6. Thermal image of Ground Zero acquired by EarthData on the 7th October2001, using a Raytheon airborne sensor.

23
widely distributed and well publicized. In contrast, AVIRIS imagery was notcirculated among the GIS units. Consequently, a key source of absolute temperatevalues was excluded from the mapping process. SPOT 4 data proved to be oflimited value due to the coarse spatial resolution.
With fires raging at Ground Zero, the thermal data was used in a number ofways. Overlaid with orthophotographs, it was used for planning fire-fightingstrategies, which needed to consider the location of hot spots in the pile. It wasalso used to evaluate firefighting strategies (B. Oswald). For example, where
Note: This data was not integrated into GIS products produced in New York
Figure 3.7. AVIRIS thermal image showing hotspots at Ground Zero on the 16thSeptember 2001 (Clark et al., 2001).

24
various chemicals were being used to tackle hotspots, chiefs assessed the successof fire-fighting techniques by visually noting the difference between a time seriesof the images (B. Oswald). However, there is no indication that this subtractionwas performed digitally, or numerically.
Integrating thermal and attribute data also assisted operations. Superimposingthe thermal data on GIS locations of transformers, and undergroundinfrastructure highlighted potential hazards to the response teams (D. Kaplan).For fire fighters, building plans and maps showing hazardous materials andfuel sources provided a focal point for wetting down the areas around fuel andfreon tanks (A. Leidner). From visual examination, firefighters also noted acorrelation between hot spots and depressions in the terrain model (N. Visconti).They also attempted to track occurrences of ‘flash-over,’ when hot areas jumpor migrate from one location to the other (D. Kehrlein).
3.4.3 Problems
Considerable debate surrounds the use of this data in emergency response. Thereis no question that the data were used extensively. However, a number ofsignificant problems were identified. Timeliness was a key concern, since thedistribution of heat was changing constantly. The EarthData processing routinehad a turnaround time of 4-6 hours.
Response crews called the usefulness of EarthData thermal imagery intoquestion, since heat and fire locations were not always correlated. Fire fightersused the thermal scenes for reference and crosschecking, but mainly relied ononsite sensors (D. Kehrlein). Offset between remote sensing imagery andobservations appear to result from the method of data acquisition – videotapingand screen capture, coupled with inaccurate image registration relative to theorthophotographs. It is not clear that this actually was a problem, but it is clearthat it could not be ruled out. Some observed changes were most likely linkedto actual heat migration because of the fire fighting efforts and the highconductivity of the material. However, there was also speculation that themovement of hot spots was due to misregistration. When lives are at stake, theaccurate positioning of hotspots is of pivotal importance. The value of thermaldata was also questioned, because the EarthData imagery failed to displayabsolute temperatures. Ideally, fire fighters require a scale of values in degreesFahrenheit, rather than a relative scale of 8-bit values.
Although correctly scaled, the AVIRIS data were not delivered in a GIS formatto people at ground zero. Indeed, many of the top-level GIS responders wereunaware that AVIRIS was collected. The SPOT imagery was widely distributed,but it was not delivered in a georeferenced format and therefore was not easily

25
read into a GIS program. Although this was the infrared data delivered, thereare no examples of maps that overlaid infrastructure onto this data, perhapsdue to the resolution.
3.4.4 Potential Uses
In the extensive gallery of maps produced at Hunter College, there is no analysisof the hot spots. It was assumed from looking at the images that the deepestholes were the hottest (N. Visconti). Through data integration, plotting thethermal infrared response by the depth is a simple task, which will establishwhether or not this is the case. Correctly registered Raytheon, FLIR or AVIRISthermal data could be draped onto the LIDAR coverage to assess the relationshipbetween the depth and the hotspots and through multi-temporal analysisinvestigate other issues such as cool-down rates.
The AVIRIS thermal scenes could be brought into a GIS system, and integratedwith optical, LIDAR and CAD data. A composite map showing hotspots,depressions in the pile, the locations of fuel and freon tanks, hazardous materials,and other features of specific concern, could provide a holistic view of the hazardsfaced by rescue teams and a focus for firefighting efforts.
3.5 Hyperspectral Data
In response to requests by the EPA through the US Geological Survey (USGS),the AVIRIS hyperspectral instrument was deployed by JPL/NASA soon afterthe terrorist attacks. The term ‘hyperspectral’ (as opposed to multispectral, asdescribed in Section 3.2) reflects the large number of bands over which data isacquired. In the case of AVIRIS, radiance measurements span visible and infraredregions of the electromagnetic spectrum. The spectral characteristics of eachpixel are recorded across this entire range of wavelengths.
3.5.1 Specification
Commencing on the 16th September, AVIRIS coverage of Ground Zero wasacquired on five occasions (see Clark et al., 2001). The hyperspectral sensor wasdeployed aboard a De Havilland Twin Otter aircraft at altitudes of 6500-12500ft, resulting in a spatial resolution of 2-4 m. The spectral resolution is also high,with 224 bands spanning a range of 0.37-2.5 µm. Despite the wide choice ofbands, for the World Trade Center, studies focused on the thermal infrared regionof the spectrum (see Section 3.4) and the reflectance characteristics of atmosphericparticulate matter, with an emphasis on asbestos. After acquisition, data werecalibrated and georeferenced at JPL. Imaging Spectroscopy Groups at the USGSapplied atmospheric and ground calibrations to generate surface reflectanceand absolute temperatures.

26
3.5.2 Uses and Usefulness
Hyperspectral AVIRIS data were used by scientists at the USGS to analyzecontents of the smoke plume emanating from Ground Zero. It was also used totrack particulate asbestos, which posed a considerable risk to response andrecovery crews. Results from these studies were published several weeks afterthe terrorist attacks (Clark et al., 2001).
3.5.3 Problems
Although the first AVIRIS hyperspectral dataset was rapidly processed andreleased on 18th September, this information, which included useful maps ofhotspots, was not generally available. The value of results showing atmosphericpollutants was limited by considerable time delays. These compositional resultswere not released until the 27th September, by which time the risk posed toresponse crews by airborne contaminants had abated. Many confided that itwas very difficult to obtain any environmental information.
3.5.4 Potential Uses
During the early stages of emergency operations, many fire fighters experiencedrespiratory problems (D. Kehrlein). Clearly, AVIRIS data has the potential toprovide key information about dangerous airborne contaminants. However,the turnaround time between data acquisition and release requires significantimprovement.
Multi-temporal sequences of thermal data could be used to monitor changinghotspots and generate cool down rates, by mapping shifts in location andquantifying their diminishing extent. With proper training algorithms in place,this sensor could be absolutely critical in future events. This may proveparticularly useful for tracking airborne contaminates which are far more deadlythan asbestos.
3.6 SAR Imagery
RADARSAT1 is a commercial satellite (Canadian Space Agency, 2002) thatacquires high-resolution imagery using synthetic aperture radar (SAR) sensors.Rather than passive devices, such as the multispectral and hyperspectral sensorsdescribed previously, these are active sensors, which emit and receive lowfrequency signals in the microwave region of the electromagnetic spectrum.SAR sensors collect information about the material of the ground surface basedupon texture. It is particularly sensitive to manmade features, which are oftenmetallic or contain right angles (referred to as corner reflectors). This data hasbeen used extensively in the military. Interpreting this data takes practice, but

27
there are many advantages to this data source, including the ability to see throughsmoke or at night. Where multiple images are captured, they can be used togenerate terrain models. SAR can also be collected by aircraft, which produceshigher resolution imagery.
Note: Backscatter from the Manhattan urban fabric highlights corner reflectors such asbuildings, together with highly reflective metal surfaces.
(Image courtesy of the Canadian Space Agency)
Figure 3.8. RADARSAT1 SAR imagery of Ground Zero, acquired on the 13thSeptember 2001 using the sensor operating in ‘Standard’ mode.

28
3.6.1 Specification
RADARSAT coverage of the World Trade Center was acquired on 13thSeptember. The sensor operates in the radio wave regions of the spectrum at5.6 cm, emitting and receiving a beam from a 15 m x 1.5 m antenna. The sensormay be set to ‘fine’ imagining mode, which results in a spatial resolution of 8 m.However, in this instance, the ‘standard’ mode produced imagery (see Figure3-8) with a resolution of 30 m.
3.6.2 Uses and Usefulness
Although timely, little information was yielded by RADARSAT data, due to thelimited spatial scale of Standard mode imagery compared with the localizedscale of damage. Although the Manhattan area is clearly depicted (Figure 3-8),and a change in intensity is apparent, few features can be distinguished atGround Zero.
3.6.3 Problems
In general terms, SAR technology is less widely used in remote sensing and GIScommunities than optical data. Consequently, there were few users with thenecessary expertise to incorporate this data into response and recovery efforts.Its usefulness was also fundamentally limited by the poor spatial resolutionand the complexity of the built environment around Ground Zero.
3.6.4 Potential Uses
The change in intensity between before and after scenes acquired by RADARSATsuggests that SAR data may offer important insights into damage sustained.Active sensors, which operate at these longer wavelengths, are particularlyversatile since they can be deployed at night, see through heavy smoke or cloudsand operate during adverse weather conditions.
High-resolution imagery acquired by airborne sensors, or RADARSAT1 in ‘fine’mode, would be particularly useful in regional emergency situations. It is alsovaluable for imaging manmade objects, since it is sensitive to ‘corner reflectors’,or 90-degree edges associated with buildings, and a much higher return isassociated with metallic objects. However, SAR data is arguably more difficultto interpret than optical imagery. For SAR to play a more significant role inemergency operations, trained remote sensing experts would be required toanalyze and evaluate results.

29
3.7 Geospatial Cross-Referencing and GIS
GIS technology provided the platform for integrating a diverse range of spatialdatasets that were acquired during emergency operations at the World TradeCenter site. The following section describes advanced methods of geospatialcross-referencing using remote sensing imagery, vector and raster datasets. TheNew York City GIS database was a particularly useful resource, providing bothhigh-resolution orthophotographs of the World Trade Center prior to the terroristattacks, and key attribute data. For illustrative purposes, examples of theresulting composite scenes for Ground Zero are described. Issues raised by endusers are also discussed, together with ways of improving procedures for futureevents.
3.7.1 Methods
Once pre-processed and geo-referenced, remotely sensed images were importedinto an Environmental Systems Research Institute (ESRI) environment, oftenusing ArcView. These images would then be combined with GIS data and mapswould be produced. In addition to a number of standardized map productsthat were produced on a daily basis, individuals requested customized maps atthe Emergency Mapping and Data Center (EMDC). Initially, requests wereaddressed on an ad hoc basis. However, a system was later put in place, wherebyrequests were logged at a formal ‘Map Request Desk.’ The remote sensing datawas subsequently posted on-line at the NY Office of Technology (OFT) and EarthResources Observation System (EROS) data centers. Initially, this was limitedto processed imagery and GIS files. Later, a summary of the flight history, dataspecifications and remote sensing devices was added.
3.7.2 Uses and Usefulness
In many cases, the process of integration significantly enhanced the informationcontent of the datasets described in Sections 3.1 - 3.4. In simple terms, integrationinvolves draping and overlaying series to produce composite scenes. A numberof datasets were superimposed with base-maps, such as orthophotographs fromEarthData and the New York City GIS database, oblique images, 3D LIDARterrain models. These included (J. Hall, J. Tu):
• Response and recovery: thermal images showing hot spots, maps ofunderground fuel and freon tanks, maps showing command posts, facilitiesand food stations
• Rescue support: CAD floor plans showing the location of elevator shaftsand pillars

30
• Deep infrastructure: Maps of subsurface structures and hot spots
• Inventory: location of items/evidence removed from the debris pile
• General orientation: street maps, maps of buildings and addresses, locationof restricted zones
• Transport status: maps showing the closure status of roads, subways, bridgesand tunnels, and routing information
• Utility outage: maps showing electricity, telephone, gas, steam and wateroutages
• Services: maps showing hospitals, mortuaries, vacant land
• Building status: maps of damage status and government office closures.
At the map request desk, a standardized catalogue of maps proved particularlyuseful, since it enabled non-specialists to select the most appropriate product.The widespread use of these standard maps (2,000 requests were made and10,000 maps produced during September and October), visits to the EMDC byChief Pfeiffer of the FDNY, and use of maps by Mayor Giuliani, highlights thesuccess of this effort.
3.7.3 Problems
Lack of familiarity with geospatial data was one of the greatest challenges facedby GIS and remote sensing experts. Since most firefighters and responsepersonnel were non-specialists, it was important to present the information in aformat that was easy to understand and interpret. There was a steep learningcurve, and requests were made for on-site educators.
The turnaround time between data acquisition and map production was on theorder of 12 hours. Although this improved to 4-6 hours for FLIR imagery, tomaximize the usefulness of remote sensing thermal data for firefighting efforts,a much shorter lag (on the order of three hours) is preferred. Until rapidregistration, correction and automated image processing techniques becomeavailable, achieving this level of timeliness would incur costs in terms of accuracy.However, given the comments concerning misregistration of thermal data andsteps taken by the EMDC to ensure that all map products adhered to strictstandards, reduced accuracy may not be acceptable.
From a technical perspective, the use of GIS programs for image processingwas problematic. ER Mapper, ERDAS Imagine and ENVI were not widely used.

31
It is difficult to extract values from the scenes, since data was manipulated as‘images’ rather than converted to ‘grids.’ Poor performance of interpolationalgorithms within MapInfo and ArcView also resulted in a distorted view of theLIDAR coverage, yielding different values for the maximum height of buildingsand depth of depressions in the debris pile.
3.7.4 Potential Uses and Improvements
From a logistical viewpoint, a number of improvements can be made that impactthe usefulness of remote sensing data. Since timeliness is a key concern in anyemergency situation, data acquisition should be streamlined. First, key sourcesof remote sensing data should be identified. In preparation for future disasters,the necessary contracts and clearances for acquiring airborne imagery need tobe established. Pre-processing issues delaying data release should also beaddressed. An automated method of correcting and registering images to apredetermined coordinate system would significantly improve the turnaroundtime (B. Logan).
Spatial data will be used more effectively if emergency management personnelare familiar with the tools and their capabilities. For map requests, acomprehensive catalogue of useful images and composite scenes is invaluable.However improved data visualization, such as virtual representations usingVRML or other 3D modeling software, would allow emergency personnel tointeractively explore the data for rapid planning and decision making purposes.Mobile map production units would aid the distribution of data, while on-sitetechnical consultants are needed to assist non-specialists with interpretation.This would provide a feedback mechanism between mapping operations andend users, which would quickly identify issues that could limit usefulness, suchas data visualization or turn around time.
Clearly, a wide range of very useful composite images was produced at theEMDC, FEMA and Urban Search and Rescue GIS and mapping centers.However, additional composite scenes may have further assisted response andrecovery teams. The following examples generated by ImageCat reinforce thepower of this geospatial information as an aid to disaster response.
(a) LIDAR 3D model overlaid with orthophotography and thermal data
As shown by the sequence of models in Figure 3-9, this composite scene providesa three dimensional representation of conditions at Ground Zero. Combiningthe terrain model and orthophotography aids general orientation within thesite. The thermal data, although relative values, provides an indication of wherethe hot spots lie in relation to buildings and debris piles, as represented in three

32
Note: The yellow and red zones represent hot spots. Smoke is still present in the images,affecting visibility. The data represented here were all collected on September 17th by
EarthData.
(a) Oblique view
(b) Near vertical view
Figure 3.9. Visualization of Ground Zero, with orthophotography and thermal datadraped over a LIDAR 3D terrain model.

33
dimensions. The data represented here were all collected on September 17th byEarthData. Although there are two frames represented here, this is part of aVirtual Reality Modeling Language (VRML) file, which can be uploaded ontothe internet and visualized with Internet Explorer. The end user then has theability to rotate and position the data so that they can see the hot spots from anylocation. The advanced user can then manipulate the model to take the guesswork out of assessing the location of the hot spots. Rescue workers could referto the location of debris piles, visible objects in the debris, and one’s ownperspective view to pinpoint exactly what should be hot, and this file could beaccessed from many locations without difficulty.
This model could be improved further with a higher LIDAR point samplingdensity and color imagery. Absolute thermal readings would make the modelmuch more meaningful, first for assessing the level of hazard, and laterestablishing the degree of success in extinguishing the fire. Although CADmodels showing floor plans and the location of fuel and freon tanks wereunavailable for the present evaluation, the addition of building footprints, streets,and labels would enhance the information content. Additionally, smoke is stillpresent in the imagery.
(b) Temporal pairing of 3D LIDAR terrain models, showing elevation changeswithin the debris pile.
Remotely monitoring changes in topographic characteristics of the debris pilecould provide an early warning of emerging hazards due to subsidence. InFigure 3-10, the zones highlighted in red correspond with a decrease of 5-10 ftbetween the LIDAR elevation datasets from September 17th and September 19th.The largest of these areas covers 1,500 sq ft.
To perform these calculations, elevations falling within a 5-foot grid mesh wereaveraged. Cells without values were populated by taking the value of the nearestpopulated cell. After subtracting the grids, the data were grouped, based uponthe range of the difference. Areas with less than five contiguous cells wereeliminated. This minimized the effect of arbitrary differences between thetemporal pairing of LIDAR grids, which arise from creating a surface from pointdata. The results were converted to a vector file. The method of image analysisdiffers from a similar manipulation of the 3D terrain models undertaken bySean Ahearn at Hunter College, inasmuch that it focuses on regional differencesbetween the scenes that might be consistent with subsidence. The aim here is todistinguish persistent regional differences, whereas a subtraction of interpolateddata would capture all differences.

34
(c) Temperature data and thermal subtraction showing cool down rates atGround Zero
Firefighting teams identified the lack of absolute temperature data as a significantlimitation of the thermal datasets initially available to response teams. Thesequence of temperature readings, shown in the top row of Figure 3-11 wereacquired by EarthData between 18th-22nd October, using the FLIR thermal
Note: The red zones show a decrease of 5-10ft between these dates. To enhancevisualization, results are overlaid on an orthophotograph acquired on September 17.
Figure 3.10. Changes in elevation on the debris pile at Ground Zero recorded using3D LIDAR terrain models for the 17th September and the 19th September 2001.

35
Not
e: A
bsol
ute
read
ings
are
in d
egre
es F
ahre
nhei
t, w
ith re
d ar
eas
exce
edin
g 12
5º F
and
yel
low
are
as b
etw
een
75º F
and
125
º F.
Diff
eren
ce v
alue
s re
flect
the
chan
ge in
tem
pera
ture
bet
wee
n se
quen
tial d
ays,
dem
onst
ratin
g th
e su
cces
s of
fire
fight
ing
stra
tegi
es a
ndpr
ovid
ing
a fo
cus
for r
espo
nse
team
s th
e fo
llow
ing
day.
Yel
low,
red
and
oran
ge c
lass
es re
late
to n
ew o
r exp
ande
d ho
t spo
rts, w
here
the
tem
pera
ture
has
incr
ease
d by
at l
east
25º
F. B
lue
and
purp
le a
reas
are
ass
ocia
ted
with
coo
ling
of a
t lea
st 2
5º F
.
Figu
re 3
.11.
Tem
pera
ture
dat
a, a
cqui
red
by E
arth
Dat
a us
ing
the
FLIR
ther
mal
dev
ice
duri
ng O
ctob
er 2
001.
abso
lute
tem
eper
-at
ure
(ºF)
chan
ge in
tem
pera
ture
(ºF)
10/1
810
/19
10/2
010
/21
10/2
2
10/1
8 - 1
0/19
10/1
9 - 1
0/20
10/2
0 - 1
0/21
10/2
1 - 1
0/22

36
imagining device. These are overlaid with the aerial orthophotography fromOctober 7th. Notably, the thermal data are calibrated to record temperature indegrees Fahrenheit, thereby addressing the limitations of relative magnitudesacquired using the Raytheon sensor (see Section 3.4.2). The red areas correspondwith temperatures exceeding 125º F and the yellow class equates withtemperatures from 75 - 125º F. Values less than 75º F are omitted.
The difference images on the second row of Figure 3-11 were calculated bysubtracting temperature values for sequential days. They show day-to-daychanges in thermal emitance at Ground Zero. Yellow, orange and red classesrelate to new or expanded hot spots, representing areas where the ground, whichcan be far from the locations of the fires, is at least 25º F hotter than the previousday. Blue and purple areas are associated with appreciable cooling, where adecrease of at least 25º F has occurred. Although this method of analyzing andpresenting the results may have proved useful for assessing the success ofdifferent firefighting strategies in terms of the reduction in heat intensity andextent of hot spots it apparently was not attempted by the EMDC or the GISteams in New York. 'Flashover' was identified as a possible cause for themovement and resurgence of hotspots. Using difference maps to chart dailychanges in the hotspots would help track this effect. If overlaid with otherdatasets, including LIDAR terrain data and CAD plans showing fuel tanks, thisinformation could help to explain hotspot migration and predict future patternsof change.

37
4.0 Lessons Learned
The following section summarizes key lessons learned concerning the role ofremote sensing and GIS in emergency response.
4.1 Remote Sensing Data
• Data is critical to managing emergencies. If an investment is made in remotesensing, as with the imagery collected by EarthData, the data will be usedand referenced continually.
• The pre-existing New York City database of orthophotography and GIS dataprovided for a common base map and georeferencing system. These datawere essential, underpinning the entire mapping operation.
• The resolution of remote sensing is a key concern in response efforts. In termsof temporal resolution, a short processing time is critical. The turnaroundon the EarthData optical imagery was 12 hours. For a standard remote sensingproject, this schedule is impressive. However, it is generally acknowledgedthat real time data is optimal, with a maximum lag of three hours.
• In terms of spectral resolution, firemen expressed a strong preference forcolor photographs. Orthophotos should therefore be taken in color. Ideally,supplementary images would extend beyond this visible region of thespectrum to infrared wavelengths.
• Optimal spatial resolution is largely dependant upon the scale of the disaster.For the site specific analysis at the World Trade Center, there was a strongpreference for very high resolution data. Airborne imagery should be 1 footor greater, and LIDAR samples should average every foot. Optical satelliteresolution should be 1 meter or greater. SAR was not used, due to the poorresolution of the data available. High resolution SAR of 1 meter or greateralso has the potential to aid disaster response and homeland security.
• Almost all processing occurred in an ESRI environment. Wider use shouldbe made of programs such as ER Mapper, ERDAS and ENVI, which arespecifically designed for the processing and analysis of remote sensing data.

38
4.2 Geospatial Cross-Referencing
• It is much more powerful to examine data sets in combination, rather thanalone.
• Remote sensing data are often used as background pictures, and theinformation content within the digital numbers are overlooked. The manyuses and analytical potential of this data need to be promoted.
• Responders at the site found 3D dimensional representations very useful.LIDAR data should have been used more frequently, both for assessingchanges in debris volume and in conjunction with other datasets.
• Keep it simple. Although maps may convey a complex idea, the presentationmust be straightforward and simple to understand. End users in anemergency should be able to interpret a map in ~30 seconds (S. Ahearn).Analysts should be trained in basic cartographic principles and the mosteffective visual presentation of quantitative information. As with all formsof communication, presentation is equally, if not more important, thancontent.
4.3 GIS Operations
• Given the many agencies with GIS personnel that were present,communicating between and managing mapping operations proved difficult.GIS personnel were generally unaware of activities at the other mappingcenters. Arguably, operations would have run more smoothly, with lessduplication of effort, had the GIS units been centrally located under acommon command structure. As with all disasters, local, state, and federalagencies need to work together for the common good.
• GIS analysts who are primary responders need to know how to transferfrom program to program and fuse vector and raster data to producemeaningful statistical results. Training should be provided before hand.
• Analysts should be tasked according to expertise. Remote sensing expertsshould concentrate on image processing, manipulation and analytical duties,while GIS analysts focus on geospatial cross-referencing and map production.There was a need for more technical consultants to guide data use and makeanalytical recommendations.

39
4.4 Feedback
• Remote sensing imagery and map products were given to the Fire Chiefs fordistribution. Frequently, analysts did not hear whether the data was useful,or how improvements could be made. In the case of thermal data, some GISanalysts were not informed about the need for absolute temperatures until alessons learned debriefing.
• Communication is also important to ensure that GIS teams have access to allspatial datasets. Although AVIRIS temperature readings were released tothe FDNY, this key information was not received by any of the mappingcenters.
• There were devices onsite measuring real time building movement andtemperatures (D Kehrlein). Had this data been made available to the EMDC,it could have been overlaid with a basemap and used to aid planning anddecision making.
• Mobile GIS units would encourage better communication. An on-site GISunit, set up to assist with the Rockaway Beach the airplane crash, provedvery useful (A. Leidner).
4.5 Education
• Emergency managers need to be versed in GIS and remote sensingcapabilities. It is difficult to assimilate new ideas and analytical techniquesduring a disaster. Training does not need to be technical, and should besoftware independent.
• Emergency managers should be made aware of different types of imagery,its uses and usefulness, image processing techniques, geospatial cross-referencing and outputs from statistical analysis. Knowing the capabilitiesof these datasets, personnel will be able to make informed map requests infuture disaster situations.
• Equally, GIS personnel need to understand capabilities and limitations ofthe data, so that they can give advice to emergency teams. This aprioriknowledge should improve data quality, since analysts would be familiarwith problems such as misregistration.

41
5.0 Recommendations
Now that the usefulness of remote sensing data is acknowledged, a summaryshould be prepared for emergency managers, which clearly explains the entiresuite of remote sensing devices and their capabilities/applications. Along withthis remote sensing ‘menu,’ there needs to be a ‘remote sensing emergencyresponse directory,’ which includes information such as: access to sensors; names,expertise and contact details for analytical teams; and details of existingdatabases. Ideally, these planning provisions would be coordinated by a federalbody, such as FEMA (A. Leidner).
To enable rapid response, acquisition and delivery needs to be streamlined.Unmanned vehicles would be ideal for collecting data more frequently, withoutconcerns about clearance. Sensor specific problems, such as the misregistrationissue associated with thermal data, need to be resolved and standard proceduresestablished for tasks such as temperature calibration.
Image processing algorithms designed specifically for damage detection andlocating hazardous materials, or other search and rescue tasks, need to bedeveloped in preparation for future emergency events. It is difficult to performresearch in a disaster response environment.
Future geospatial cross referencing efforts should transcend the boundaries ofvector attribute data, into image processing software and 3D rendering tools.Research targeting the seamless transfer of data between database, GIS, CAD,and image processing programs would significantly improve the efficiency ofmapping operations.
Remote sensing data and map-based products will prove to be even moreeffective in future emergency situations if personnel are trained in the use ofremote sensing data. On-site GIS units are recommended for future events,with experts available to advise and assist response teams with data requestsand image interpretation.


43
6.0 ReferencesCanadian Space Agency, (2002), “Radarsat1 Specifications,” http://www.space.gc.ca/csa_sectors/earth_environment/radarsat/radarsat_info/description/specifications.asp.
Clark, Roger N., Robert O. Green, Gregg A. Swayze, Todd M. Hoefen, K. EricLivo, Betina Pavi, Chuck Sarcher, Joe Boardman, and J. Sam Vance, (2001),“Images of the World Trade Center Site Show Thermal Hot Spots on September16 and 23, 2001,” Open File Report OF-01-405, U.S. Geological Survey.
EarthData, (2001), “World Trade Center Site – Manhattan, New York 15September 22-October 2001,” (Project Deliverable to the New York State Officeof Technology).
Federal Emergency Management Agency, (2002), “Statement of Mr. Robert F.Shea Acting Administrator Federal Insurance and Mitigation AdministrationFederal Emergency Management Agency Before The Committee on ScienceHouse of Representatives United States Congress,” http://www.fema.gov/library/rfs030602.htm.
Geoplace.com, (2001a), “Key Activities, Products and Lesson Learned from NewYork City’s Emergency Mapping and Data Center,” Online Interview with JimHall, http://www.geoplace.com/gr/groundzero/lessons.asp.
Geoplace.com, (2001b), “Bruce Oswald, Assistant Director, New YorkState Office for Technology,” Online Interview with Bruce Oswald, http://www.geoplace.com/gr/groundzero/lessons.asp.
Geospatial Solutions, (2001), April, pg. 1.
New York State Office for Technology, (2002), “WTC Emergency Response AerialMeeting Debriefing,” (Notes from internal meeting at the New York CityEmergency Operations Center), November 20, 2001.
New York State Senate, (2001), “Subcommittee Hearing onTechnology in Times of Crisis, December 5, 2001,” NewYork State Congressional Testimony by Will Pelgrin, http://www.senate.gov/~commerce/hearings/120501Pelgrin.pdf.
44
NOAA, (2001), “NOAA Conducts More Flights Over WorldTrade Center Site,” NOAA News V. 796, http://www.noaanews.noaa.gov/stories/s798.htm.
Space Imaging, (2002), “IKONOS Statistics,” http://www.spaceimaging.com/aboutus/satellites/IKONOS/ikonos.html.
SPOT, (2002), “SPOT System Technical Data,” http://www.spot.com/HOME/SYSTEM/INTROSAT/seltec/welcome.htm.
Woodward Gallery, (2002), “Charting Ground Zero: Before and After,” BroomeStreet, New York City, February 1 –28, 2002 (gallery exhibit).

AcknowledgementsThis report was prepared by the Multidisciplinary Center for Earthquake Engineering Research through
a grant from the Earthquake Engineering Research Centers Program of the National Science Founda-tion (supplement to award number EEC-9701471), funding from New York State, and other sponsors.
The material herein is based upon work supported in whole or in part by the National ScienceFoundation, New York State and other sponsors. Opinions, findings, conclusions or recommendationsexpressed in this publication do not necessarily reflect the views of these sponsors or the ResearchFoundation of the State University of New York.

H e a d q u a r t e r e d a t t h e U n i v e r s i t y a t B u f f a l o