Embed Size (px)
Citation preview

Express, an International Journal of Multi Disciplinary ResearchISSN: 2348 – 2052 , Vol. 1, Issue 12, Dec 2014Available at: www.express-journal.com
ACCA/ Oxford Brookes Research and Analysis Project1
McDonald’s CorporationAnalysis of Financial Statements
By: Mohammad Assad Siddiqi.
ACCA registration number: 0843999.
Total word count: 6,498.

Express, an International Journal of Multi Disciplinary ResearchISSN: 2348 – 2052 , Vol. 1, Issue 12, Dec 2014Available at: www.express-journal.com
ACCA/ Oxford Brookes Research and Analysis Project2
Table of Contents
1. Project objective and overall research approach .......................................................................................... 3
1.1 Introduction........................................................................................................................................... 3
1.2 Reasons for Choosing the Topic and Organization .............................................................................. 3
1.3 Project Objectives ................................................................................................................................. 3
1.4 Research Questions............................................................................................................................... 4
1.5 Research Approach ............................................................................................................................... 4
2. Information Gathering................................................................................................................................... 6
2.1 Sources of Information.......................................................................................................................... 6
2.2 Methods of Information Gathering ....................................................................................................... 6
2.3 Limitations of information gathering .................................................................................................... 7
2.4 Ethical Issues faced during information gathering ............................................................................... 7
2.5 Accounting and Business Techniques used and their Limitations......................................................... 8
Ratio Analysis..................................................................................................................................................... 8
Limitations of Ratio Analysis ............................................................................................................................. 8
SWOT Analysis................................................................................................................................................... 9
Limitations of SWOT Analysis............................................................................................................................ 9
3. Business and Financial Analysis.................................................................................................................. 10
Company Overview .......................................................................................................................................... 10
3.1 McDonald’s SWOT Analysis ............................................................................................................... 10
Strengths........................................................................................................................................................... 11
Weaknesses....................................................................................................................................................... 11
Opportunities.................................................................................................................................................... 11
Threats ............................................................................................................................................................. 12
3.2 Ratio Analysis ..................................................................................................................................... 13
Revenue Growth ............................................................................................................................................... 13
Profitability Ratios ........................................................................................................................................... 14
Liquidity Ratios ................................................................................................................................................ 19
Debt Management Ratios ................................................................................................................................. 22
Asset Management Ratios ................................................................................................................................ 23
McDonald’s Market Value Summary ............................................................................................................... 26
Conclusion ....................................................................................................................................................... 28
Skills and Learning Statement............................................................................Error! Bookmark not defined.
Express, an International Journal of Multi Disciplinary ResearchISSN: 2348 – 2052 , Vol. 1, Issue 12, Dec 2014Available at: www.express-journal.com
ACCA/ Oxford Brookes Research and Analysis Project3
Refrences and Biblography............................................................................................................................. 32
Appendices....................................................................................................................................................... 38
1. Project objective and overall research approach
1.1 Introduction
The topic which I have chosen for my research and analysis report is Topic No: 8
“The business and financial performance of an organization over a three year period”
The organization on which this RAP would be conducted is McDonald’s Corporation.
1.2 Reasons for Choosing the Topic and OrganizationThe most important aspect when choosing the topic is one’s personal interest. I was always interestedin finding out the success factors of different businesses and to get an insight into its business andfinancial performance. The topic was also important for me as it is somewhat part of my work.Through completing this RAP I wanted to develop my analysis and reporting skills which are vital formy career progression. Gaining the complete understanding, knowledge and skills to execute theproject is of utmost importance. The knowledge which I gained through my ACCA studies and workassignments gave me an extra comfort towards choosing this topic.
The chosen company for this purpose is McDonald’s Corporation. That has demonstrated significantgrowth and sustainability as the Market Leader in Fast Food Industry. The purpose of the analysis isto find out the trend that McDonald’s has demonstrated in the key areas where they have excelled.
1.3 Project ObjectivesThis report aims to analyze the financial results of McDonald’s over a five year period and to compareit with its competitor Burger King. They represent two big names in the Food Industry. They are verymuch related to each other. The types of food they serve are somewhat similar. This analysis willmainly be accomplished by conducting a detailed ratio analysis on the financial data available for thelast five year period.
The financial analysis of McDonald’s should give us a peek into the future not just of the company butalso as to what lies in store for us at the stock exchanges and on the economic front. Such is the broadand dimensional measure of McDonald’s.
Express, an International Journal of Multi Disciplinary ResearchISSN: 2348 – 2052 , Vol. 1, Issue 12, Dec 2014Available at: www.express-journal.com
ACCA/ Oxford Brookes Research and Analysis Project4
Looking on the financial aspect alone will not provide a comprehensive analysis of its performance.Therefore, this report will also focus on the non-financial aspects using a strategic planning tool calledSWOT analysis which will look into the strength, weaknesses, opportunities and threats inherent inthe company or faced by it.
1.4 Research QuestionsThe aims and objectives of the report on which my research questions were based are as follows:
1. To gather, present and analyze the financial information of McDonald’s for the last 5 years ina form which can assist an investor to assess the overall financial performance and prospectsof the organization.
2. To analyze the strengths, weakness, opportunities and threats which have resulted from thecurrent strategy and their impact on the company as a whole?
3. What are the key financial drivers, business strengths and strategies that led to McDonald’ssignificant growth and sustainability as the Market Leader in Fast Food Industry?
4. To develop analytical skills and to apply gained financial knowledge to the businessenvironment.
For the execution and completion of this project following questions were to be answered:
1. Identify the sources from where the information will be gathered about the topic i.e. whichsources would be used to access the data and information?
2. Which technical issues would arise and how to address them?
3. What mechanism should be followed in execution of the analysis?
4. What sort of IT and Communication skills would be required?
1.5 Research ApproachThe first step before execution of any project is to plan. Planning is the core for gaining success in anytask. My objective was to complete the RAP before the submission deadline for this I set a target datebefore which I should complete each task and set mile stones. This helped me in visualizing the issueswhich I might face during my work and possible solutions for each. If I don’t have a solution for aproblem then from where I can seek help for resolving this issue. I selected the techniques that couldbe used to work on the RAP. I used different sources to gather information and summarize data. Mostof the time I relied on the Internet, moreover I got knowledge from books, newspapers and businessarticles. The critical question which I had to answer all the time during gathering information was to

Express, an International Journal of Multi Disciplinary ResearchISSN: 2348 – 2052 , Vol. 1, Issue 12, Dec 2014Available at: www.express-journal.com
ACCA/ Oxford Brookes Research and Analysis Project5
differentiate what information is most important, relevant and must be mentioned or not to bedisclosed.
The approach was to analyze the last 5 years financial statements of both the companies and trendanalysis that will show the growth in the business of two companies and will compare the results. Forthis purpose I have gathered the information from the annual reports and other data available in thepublic domain. I read wide variety of news articles, analysis, companies press briefs, various reportsand commentaries from various different sources. For the purpose of this report I relied on secondarydata, few attempts were made to gather primary data but to no avail. Various sources were used tofind reliable, accurate and unbiased information. I then collected information on the methods andsources that I could use for effective secondary research.
The next phase was the most important one as I required me to carry out actual, target orientedresearch on the topic The methodology was to analyze the financial ratios which are classified intofollowing categorize:
Profitability Ratios. Liquidity & Debt Management Ratios.
Asset Management Ratios.
Market Value analysis would be carried out in which following indicators will be analyzed:
Market price (by New York stock exchange, closing price) Cash flow per share Price / Cash flow per share (P/CF)
Book value per share (BVPS)
In the end a SWOT analysis of McDonald’s was carried out and a conclusion is drawn. I made acheck list and ticked off each of my project objectives and research questions that I felt had beenanswered upon the completion of the project.
Express, an International Journal of Multi Disciplinary ResearchISSN: 2348 – 2052 , Vol. 1, Issue 12, Dec 2014Available at: www.express-journal.com
ACCA/ Oxford Brookes Research and Analysis Project6
2. Information Gathering
2.1 Sources of InformationFollowing sources of information were used due to the mentioned reasons.
Source Reason
Internet Easily accessible Reliability (E-Journals) Citable and verifiable Access to multiple & differing opinions Easily searchable Up to date information Access to extensive analysis & comments.
Annual Report Audited accounts which are reliable. Extensive information about company
performance. All financial reports available in single
report.Personal communicationthrough meetings and telephone
Efficiency Effectiveness in getting desired
information Cost effective primary source of
information, when directed at appropriatesources
Books Detailed guidance Citable and authentic theoretical concepts.
Investor reports, Newspapers &Magazines
Analysis and comments Up to date information.
2.2 Methods of Information Gathering
InternetOne of the most popular software which helped me most in searching through the websites was the“Google Toolbar”, sitting under my internet explorer address bar providing me immediate searches,whenever I needed them.
Apart from gathering information from McDonald’s and Burger King Websites, I also extractedinformation and enhanced my understanding from website such as www.investopedia.com andwww.ventureline.com as in their own words they say it is:
Express, an International Journal of Multi Disciplinary ResearchISSN: 2348 – 2052 , Vol. 1, Issue 12, Dec 2014Available at: www.express-journal.com
ACCA/ Oxford Brookes Research and Analysis Project7
“for professionals and students alike to find MBA-level tools and current data with which to conductnear instantaneous fundamental financial ratios analysis on any business entity and the industries inwhich they compete.”(Ventureline, 2012)
I used these tools more often when I was reading around my topic. Later on, I essentially leeched onto a few other websites as they provided me with most of the relevant information.
Additionally, I used to McDonald’s and Burger King Websites to get their Annual Report andcommentaries.
Personal CommunicationIt was also possible for me to benefit from the valuable time of my highly qualified colleagues,manager and lecturers. They were not acting as my mentors but we had general conversations overvarious topics related to my project in which they specialized individually by arranging meetings withthem. Whenever I faced any difficulty or required some information they were only a phone callaway.
BooksI faced some problems in referring to books as the public libraries in Jeddah, Saudi Arabia do not holdrelevant books. So I had to rely on my academic books of ACCA and CMA. I also borrowed somebooks from friends and colleagues at work, further more I downloaded e-books from the internet.
Investor reports, Newspapers & MagazinesThese were a useful source of commentaries, analysis and reviews. I didn’t really have to dig intomicro-fiches as I was working on rather recent reports. I had done my homework as to which articles Iwas looking for by looking up in the investor’s database and websites. All I had to do was locate theissue I needed and make notes.
2.3 Limitations of information gatheringInformation gathering was the lengthiest and most time consuming process of all as the informationgathered was either difficult to classify as relevant to RAP or reliable and authentic. Most of thefinancial information was collected from McDonald’s and Burger King Websites which may befavorably biased towards the company. Some sources of information may contain research carried outwith different objectives than this Report. It is difficult to judge whether such information should besued for the purposes of this Report or not. The financial statements of the company may be a bitfavorably biased towards the company as through these the company aims to present itself in the bestpossible manner. Searching the information from the internet was difficult to say as reliable and ittook too long to have access to most appropriate and relevant information.
2.4 Ethical Issues faced during information gathering
The issue of plagiarism was the one which I faced. As nearly all my research is based on secondarydata, there was a risk of plagiarism if any information that was used was not properly referenced. I
Express, an International Journal of Multi Disciplinary ResearchISSN: 2348 – 2052 , Vol. 1, Issue 12, Dec 2014Available at: www.express-journal.com
ACCA/ Oxford Brookes Research and Analysis Project8
took special care by properly referencing the data, information and quotations which were not myown, I used the Harvard Referencing System to eliminate beyond any possible doubt any chance ofplagiarism. I also followed the IFAC code of ethics adopted by ACCA, ensuring that I am followingthe guidelines and taking appropriate measures such as: competence and due care, professionalbehavior and confidentiality.
2.5 Accounting and Business Techniques used and theirLimitations
Ratio AnalysisA tool used by individuals to conduct a quantitative analysis of information in a company's financialstatements. Ratios are calculated from current year numbers and are then compared to previous years,other companies, the industry, or even the economy to judge the performance of the company. Ratioanalysis is predominately used by proponents of fundamental analysis. (Investopedia, 2012)
Ratio analysis is more than comparing different numbers from the balance sheet, income statement,and cash flow statement. It includes comparing the numbers against previous years, other companies,the industry and the economy in general. Ratios look at the relationships between individual valuesand relate them to how a company has performed in the past, and might perform in the future.
Ratio analysis helps in the following ways:
It helps in making investment decisions by looking at various ratios.
It simplifies the comprehension of financial statements. It provides a fairly complete picture
of the various changes in the financial condition of a business.
It facilitates in making inter-company comparison and highlights the factors which are
commonly associated with successful and unsuccessful firms.
The details of each of these ratios are mentioned in the Analysis segment of this Report and theircalculation formulas are provided in the Appendix 3.
Limitations of Ratio AnalysisRatio analysis has a number of limitations which are as follows:
No single ratio, or measure, is capable of capturing all relevant or important information
about a particular company.
The calculation of various ratios is merely the starting point. Analysis requires thinking about
these ratios, forming expectations and understanding the reasons of variances from those
expectations. There is no overarching rule of what a ratio ought to be, and it depends on the
particular industry as well as the business model.
Express, an International Journal of Multi Disciplinary ResearchISSN: 2348 – 2052 , Vol. 1, Issue 12, Dec 2014Available at: www.express-journal.com
ACCA/ Oxford Brookes Research and Analysis Project9
The validity of ratios also depends on the validity of the numbers used in the calculations. If
the business’s accounting system cannot be relied upon to produce reliable figures, ratios are
also unreliable.
In addition to internal factors that affect ratios, it is essential to understand the status of
external conditions, such as business conditions, and industry position.
Uses of different accounting methods (depreciation, inventory valuation method, etc.) make
comparability difficult. Seasonal fluctuations should be considered.
The possibility that the firm has engaged in “window dressing” also can present a challenge.
An internal accountant may be motivated to increase net income and to use decisions at their
discretion (depreciation, etc.) to affect the results of the firm’s financial statements.
(CMA Learning System Part 2: Financial Decision Making, 2010, p.48, 49)
SWOT AnalysisSWOT is an acronym for Strengths, Weaknesses, Opportunities and Threats. By definition, Strengths(S) and Weaknesses (W) are considered to be internal factors over which you have some measure ofcontrol. Also, by definition, Opportunities (O) and Threats (T) are considered to be external factorsover which you have essentially no control. (Management Study Guide, 2012)
A SWOT analysis is carried out in this Report as the main business technique used to analyze internaland external factors which have an impact on the company. It looks into the internal businessstrategies and business decisions made my management. The external factors are also analyzed suchas the economic environment and the industry structure etc.
Limitations of SWOT AnalysisSWOT analysis is not free from its limitations. A truly successful SWOT analysis should extendbeyond a simple list of strengths, weaknesses, opportunities and threats. A detailed SWOT analysisshould also look at an opportunity or threat’s size in order to see how it is related with the company’sstrength and weaknesses.
While useful for reducing a large quantity of situational factors into a more manageable profile, theSWOT framework has a tendency to oversimplify the situation by classifying the firm's environmentalfactors into categories in which they may not always fit. The classification of some factors asstrengths or weaknesses, or as opportunities or threats is somewhat arbitrary. For example, a particularcompany culture can be either a strength or a weakness. A technological change can be a either athreat or an opportunity. Perhaps what is more important than the superficial classification of thesefactors is the firm's awareness of them and its development of a strategic plan to use them to itsadvantage. (Net MBA, 2012)
Express, an International Journal of Multi Disciplinary ResearchISSN: 2348 – 2052 , Vol. 1, Issue 12, Dec 2014Available at: www.express-journal.com
ACCA/ Oxford Brookes Research and Analysis Project10
Although SWOT analysis is considered to be a simple and straight forward, more research andanalysis is usually needed in order to obtain a comprehensive picture.
3. Business and Financial Analysis
Company Overview
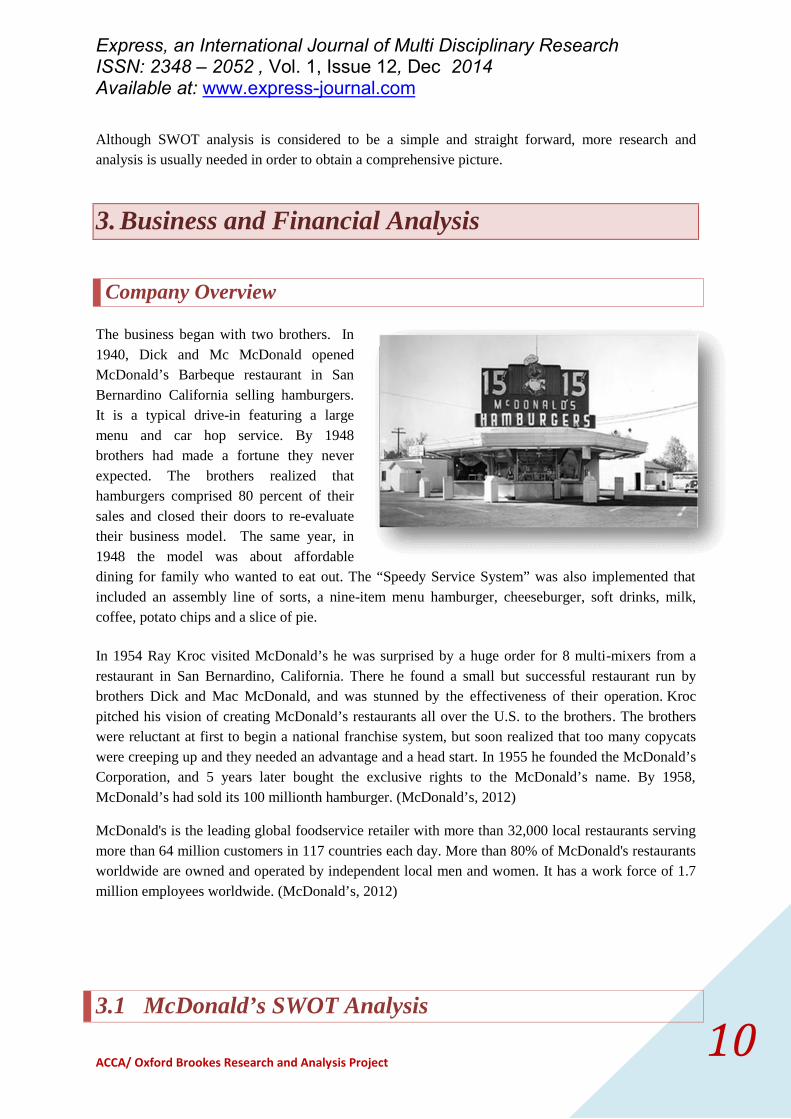
The business began with two brothers. In1940, Dick and Mc McDonald openedMcDonald’s Barbeque restaurant in SanBernardino California selling hamburgers.It is a typical drive-in featuring a largemenu and car hop service. By 1948brothers had made a fortune they neverexpected. The brothers realized thathamburgers comprised 80 percent of theirsales and closed their doors to re-evaluatetheir business model. The same year, in1948 the model was about affordabledining for family who wanted to eat out. The “Speedy Service System” was also implemented thatincluded an assembly line of sorts, a nine-item menu hamburger, cheeseburger, soft drinks, milk,coffee, potato chips and a slice of pie.
In 1954 Ray Kroc visited McDonald’s he was surprised by a huge order for 8 multi-mixers from arestaurant in San Bernardino, California. There he found a small but successful restaurant run bybrothers Dick and Mac McDonald, and was stunned by the effectiveness of their operation. Krocpitched his vision of creating McDonald’s restaurants all over the U.S. to the brothers. The brotherswere reluctant at first to begin a national franchise system, but soon realized that too many copycatswere creeping up and they needed an advantage and a head start. In 1955 he founded the McDonald’sCorporation, and 5 years later bought the exclusive rights to the McDonald’s name. By 1958,McDonald’s had sold its 100 millionth hamburger. (McDonald’s, 2012)
McDonald's is the leading global foodservice retailer with more than 32,000 local restaurants servingmore than 64 million customers in 117 countries each day. More than 80% of McDonald's restaurantsworldwide are owned and operated by independent local men and women. It has a work force of 1.7million employees worldwide. (McDonald’s, 2012)
3.1 McDonald’s SWOT Analysis
Express, an International Journal of Multi Disciplinary ResearchISSN: 2348 – 2052 , Vol. 1, Issue 12, Dec 2014Available at: www.express-journal.com
ACCA/ Oxford Brookes Research and Analysis Project11
StrengthsThe business is ranked number one in Fortune Magazine’s 2011 list of most admired food servicecompanies. (CNN Money, 2011)
One of the best brand recognition in the world, the golden arches and Ronald McDonald. McDonaldsis a community oriented, socially responsible company. They run Ronald McDonald House Charities(RMHC) helping more than 4 million families a year (RMHC, 2012).
McDonald’s believe in empowering its staff with the best knowledge and skills. In 1961 McDonald’sestablished Hamburger University; today more than 5,000 students attend Hamburger University eachyear. Since 1961, more than 80,000 restaurant managers, mid-managers and owner/operators havegraduated from this facility. (McDonald’s, 2012)
McDonald’s has an efficient, assembly line style of food preparation. In addition they have asystemization and duplication of all their food prep processes in every restaurant. McDonald's usesonly 100% pure USDA inspected beef, no fillers or additives. Additionally the produce is farm fresh.McDonald's serves 100% farm raised chicken no fillers or additives and only grade-A eggs.McDonald's foods are purchased from only certified and inspected suppliers. McDonalds worksclosely with ranchers, growers and suppliers to ensure food quality and freshness. (McDonald’s,2012)
WeaknessesTheir test marketing for pizza failed to yield a substantial product. Leaving them much less able tocompete with fast food pizza chains.
High employee turnover in their restaurants leads to more money being spent on training. (Novak, J.2009)
Most of their employees working in their restaurants are either student or part-timers, they don’t seeworking in McDonald’s as there carrier.
McDonald’s might be reaching its saturation point where it won’t be possible to grow even furtherwhich could be a potential risk.
The company faces many risks, such as interest rates, inflation, foreign exchange rates and industryregulations, In addition, slowing economies, rising unemployment, current economic conditions,declining wages, constrained credit and volatile financial markets make it even harder to compete inthe marketplace.
Opportunities

Express, an International Journal of Multi Disciplinary ResearchISSN: 2348 – 2052 , Vol. 1, Issue 12, Dec 2014Available at: www.express-journal.com
ACCA/ Oxford Brookes Research and Analysis Project12
The introduction of a healthy hamburger is a great opportunity in today's health conscious societies.They would be the first QSR (Quick Service Restaurant) to have FDA approval on marketing a lowfat low calorie hamburger with low calorie combo alternatives. They could also provide optionalallergen free food items, such as gluten free and peanut free.
They have industrial, Formica restaurant settings; they could provide more upscale restaurant settings,like the one they have in New York City on Broadway, to appeal to a more upscale target market.(Novak, J. 2009)
There is a huge market for HALLAL Food (Lawful food for Muslims according to Islamic Laws)especially in UK and most of the European countries with large Muslim population. For exampleKFC has restaurants in UK serving HALLAL Food.
Changing trends in eating habits toward more healthy eating, seen as a threat to McDonald’s can alsobe seen as an opportunity. McDonald’s introduced new premium salads and Fruit n’ Yogurt Parfaitsin the US which lead to growth in 2004 and the same products will probably bring some more growthin foreign markets. (Anne, O et al., 2005)
ThreatsMcDonald's franchise remains at the forefront of child-directed marketing, a source of concern forboth consumer groups and parents who believe that McDonald'spurposely markets unhealthy food to children. They entice childrenas young as one year old into their restaurants with special meals,toys, playgrounds and popular movie character tie-ins. Childrengrow up eating and enjoying McDonalds and then continue intoadulthood.
Health conscious consumers demanding better quality andhealthier menu items. All fast-food chains expected to struggle tomeet new consumer health expectations. This shows an overallweaker industry.
They have been sued multiple times for having "unhealthy" food, allegedly with addictive additives,contributing to the obesity epidemic in America. (Novak, J. 2009) Any new legislation or law whichmay ban any restaurant from serving unhealthy food could be a potential threat to McDonald’s.
Increased competition among rival sellers, including price wars, product innovation, and growth.Down turn in economy is affecting the ability to eat out as much. Especially in countries where thereis a poor economy.

Express, an International Journal of Multi Disciplinary ResearchISSN: 2348 – 2052 , Vol. 1, Issue 12, Dec 2014Available at: www.express-journal.com
ACCA/ Oxford Brookes Research and Analysis Project13
3.2 Ratio Analysis
Revenue Growth
Years 2007 2008 2009 2010 2011
McDonald's Revenue $22,787 $23,522 $22,745 $24,075 $27,006
Increase/(Decrease) in Revenue 9% 3% -3% 6% 12%
Burger King Revenue $2,234 $2,455 $2,537 $2,502 $2,336
Increase/(Decrease) in Revenue 9% 10% 3% -1% -8%
Revenue Growth
(Data Extracted from McDonald’s Corporation Annual Report 07, 08, 09, 10 & 11. Burger King Annual Report07, 08, 09, 10 & 11. For Ratio Calculation and Formulas Please see Appendix-2)
McDonald’s is showing a strong growth trend. “This was achieved by introducing new menu itemslike Chicken McNuggets that featured new sauces, breakfast products including new Fruit & MapleOatmeal and limited-time offering such as the McRib sandwich. In US the National launch of theMcCafe’ Frozen Strawberry Lemonade and Mango Pineapple real-fruit smoothie provided an extraboost in revenues. Apart from that the extended opening hours and customer-focused Plan to Win.The execution of multiple initiatives surrounding the five elements of Plan to Win- People, Products,Place, Price and Promotion – have enhanced the restaurant experience for customers worldwide andgrown comparable sales and customer visits in each of the last eight years. This Plan, combined withfinancial discipline, has delivered strong results”. (McDonald’s, 2011)
2007 2008 2009 2010 2011MCD 9.1% 3.2% -3.3% 5.8% 12.2%BKC 9.1% 9.9% 3.4% -1.4% -8.0%
9.1%
3.2%
-3.3%
5.8%
12.2%9.1% 9.9%
3.4%
-1.4%
-8.0%-10.0%
-5.0%
0.0%
5.0%
10.0%
15.0%
Perc
enta
ge
Revenue Growth McDonal's Vs Burger King
(Data Extracted from McDonald’s Corporation Annual Report 07, 08, 09, 10 & 11. Burger King Annual Report07, 08, 09, 10 & 11. For Ratio Calculation and Formulas Please see Appendix-2)

Express, an International Journal of Multi Disciplinary ResearchISSN: 2348 – 2052 , Vol. 1, Issue 12, Dec 2014Available at: www.express-journal.com
ACCA/ Oxford Brookes Research and Analysis Project14
The Burger King revenues are showing a healthy growth during 2007, 2008 and 2009 of 9%, 10% and3% respectively. In 2010 and 2011 it has decreased by 1% and 8% respectively.
“In 2011 Company restaurant revenues decreased primarily due to the reduction in refranchising of 38Company restaurants and the effects of negative company comparable sales growth”. (Burger King,2011).
Profitability Ratios
Net Profit Margin
“A ratio of profitability calculated as net income divided by revenues, or net profits divided by sales.It measures how much out of every dollar of sales a company actually keeps inearnings.”(Investopedia, 2012)
2007 2008 2009 2010 2011Mc D 10.51% 18.34% 20.01% 20.54% 20.38%BK 6.62% 7.72% 7.89% 7.47% 4.65%
10.51%
18.34%20.01%
20.54%20.38%
6.62%
7.72% 7.89%7.47%
4.65%
0.00%
5.00%
10.00%
15.00%
20.00%
25.00%
Perc
enta
ge
Net Profit Margin McDonald's Vs Burger King
(Data Extracted from McDonald’s Corporation Annual Report 07, 08, 09, 10 & 11. Burger King Annual Report07, 08, 09, 10 & 11. For Ratio Calculation and Formulas Please see Appendix-2)
McDonald’s is demonstrating significant growth in profitability especially during the last 3 years thegrowth is above 20% on average. This performance is achieved because the franchised revenue hasincreased from $7842m in 2010 to $8713m in 2011 and as it is evident from the financial statementthat McDonald’s Corporation directly does not bears any expenses of the franchised restaurants butenjoys the revenue and profits from it.
As we see that the net profit margin is 20% but the gross profit margin is 45% (difference 25%) whichindicates that there are heavy non-operating expenses and in my view the reasons for these expensesinclude the following factors:
o Staff training expenses
Express, an International Journal of Multi Disciplinary ResearchISSN: 2348 – 2052 , Vol. 1, Issue 12, Dec 2014Available at: www.express-journal.com
ACCA/ Oxford Brookes Research and Analysis Project15
o Cost of moving towards green environment. (McDonald’s, Corporate socialresponsibility)
The net profit of Burger King is poor due to following reason:
o Due to the acquisition of Burger King the revenue has declined which might be because ofrestructuring of key managerial positions and change in the strategy.
o The assets of Burger king could also be another reason as evident from the financialstatements of Burger King the assets have increased 121% from 2007 to 2011, whereas thenet income has not increased in line with the increase in assets.
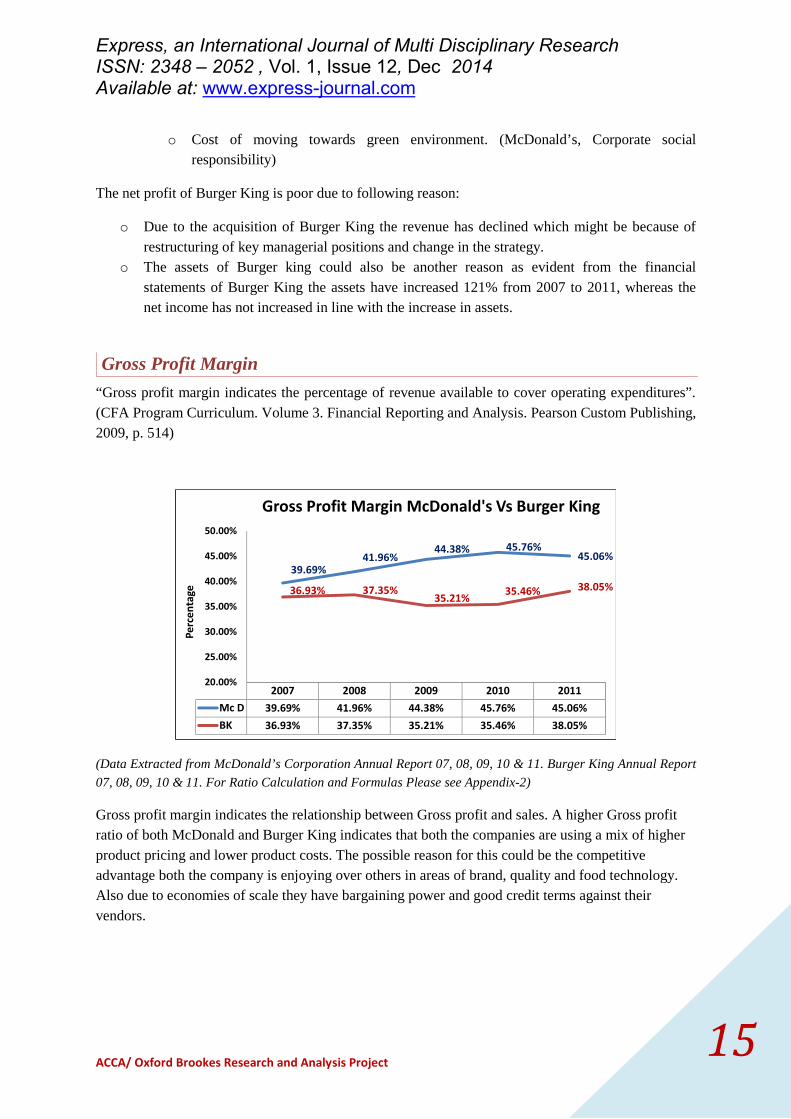
Gross Profit Margin
“Gross profit margin indicates the percentage of revenue available to cover operating expenditures”.(CFA Program Curriculum. Volume 3. Financial Reporting and Analysis. Pearson Custom Publishing,2009, p. 514)
2007 2008 2009 2010 2011Mc D 39.69% 41.96% 44.38% 45.76% 45.06%BK 36.93% 37.35% 35.21% 35.46% 38.05%
39.69%41.96%
44.38% 45.76%45.06%
36.93% 37.35%35.21% 35.46% 38.05%
20.00%
25.00%
30.00%
35.00%
40.00%
45.00%
50.00%
Perc
enta
ge
Gross Profit Margin McDonald's Vs Burger King
(Data Extracted from McDonald’s Corporation Annual Report 07, 08, 09, 10 & 11. Burger King Annual Report
07, 08, 09, 10 & 11. For Ratio Calculation and Formulas Please see Appendix-2)
Gross profit margin indicates the relationship between Gross profit and sales. A higher Gross profitratio of both McDonald and Burger King indicates that both the companies are using a mix of higherproduct pricing and lower product costs. The possible reason for this could be the competitiveadvantage both the company is enjoying over others in areas of brand, quality and food technology.Also due to economies of scale they have bargaining power and good credit terms against theirvendors.
Express, an International Journal of Multi Disciplinary ResearchISSN: 2348 – 2052 , Vol. 1, Issue 12, Dec 2014Available at: www.express-journal.com
ACCA/ Oxford Brookes Research and Analysis Project16
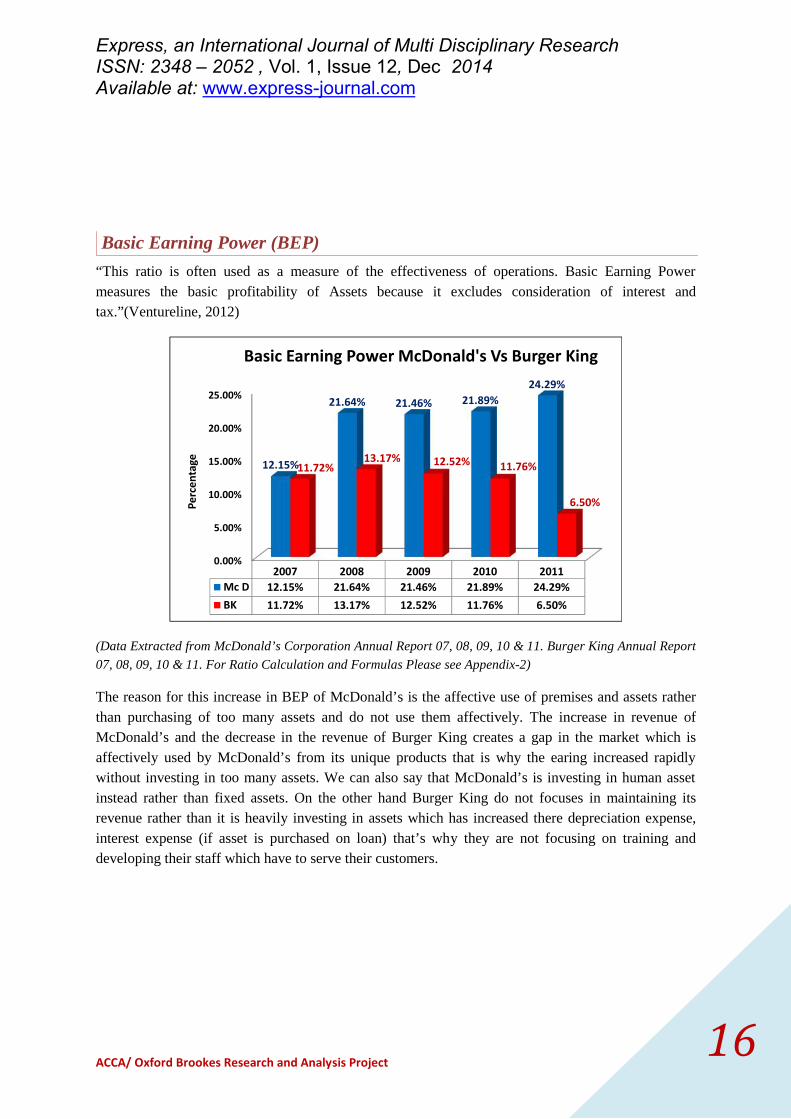
Basic Earning Power (BEP)
“This ratio is often used as a measure of the effectiveness of operations. Basic Earning Powermeasures the basic profitability of Assets because it excludes consideration of interest andtax.”(Ventureline, 2012)
0.00%
5.00%
10.00%
15.00%
20.00%
25.00%
2007 2008 2009 2010 2011Mc D 12.15% 21.64% 21.46% 21.89% 24.29%BK 11.72% 13.17% 12.52% 11.76% 6.50%
12.15%
21.64% 21.46% 21.89%24.29%
11.72%13.17% 12.52% 11.76%
6.50%Perc
enta
ge
Basic Earning Power McDonald's Vs Burger King
(Data Extracted from McDonald’s Corporation Annual Report 07, 08, 09, 10 & 11. Burger King Annual Report07, 08, 09, 10 & 11. For Ratio Calculation and Formulas Please see Appendix-2)
The reason for this increase in BEP of McDonald’s is the affective use of premises and assets ratherthan purchasing of too many assets and do not use them affectively. The increase in revenue ofMcDonald’s and the decrease in the revenue of Burger King creates a gap in the market which isaffectively used by McDonald’s from its unique products that is why the earing increased rapidlywithout investing in too many assets. We can also say that McDonald’s is investing in human assetinstead rather than fixed assets. On the other hand Burger King do not focuses in maintaining itsrevenue rather than it is heavily investing in assets which has increased there depreciation expense,interest expense (if asset is purchased on loan) that’s why they are not focusing on training anddeveloping their staff which have to serve their customers.
Express, an International Journal of Multi Disciplinary ResearchISSN: 2348 – 2052 , Vol. 1, Issue 12, Dec 2014Available at: www.express-journal.com
ACCA/ Oxford Brookes Research and Analysis Project17
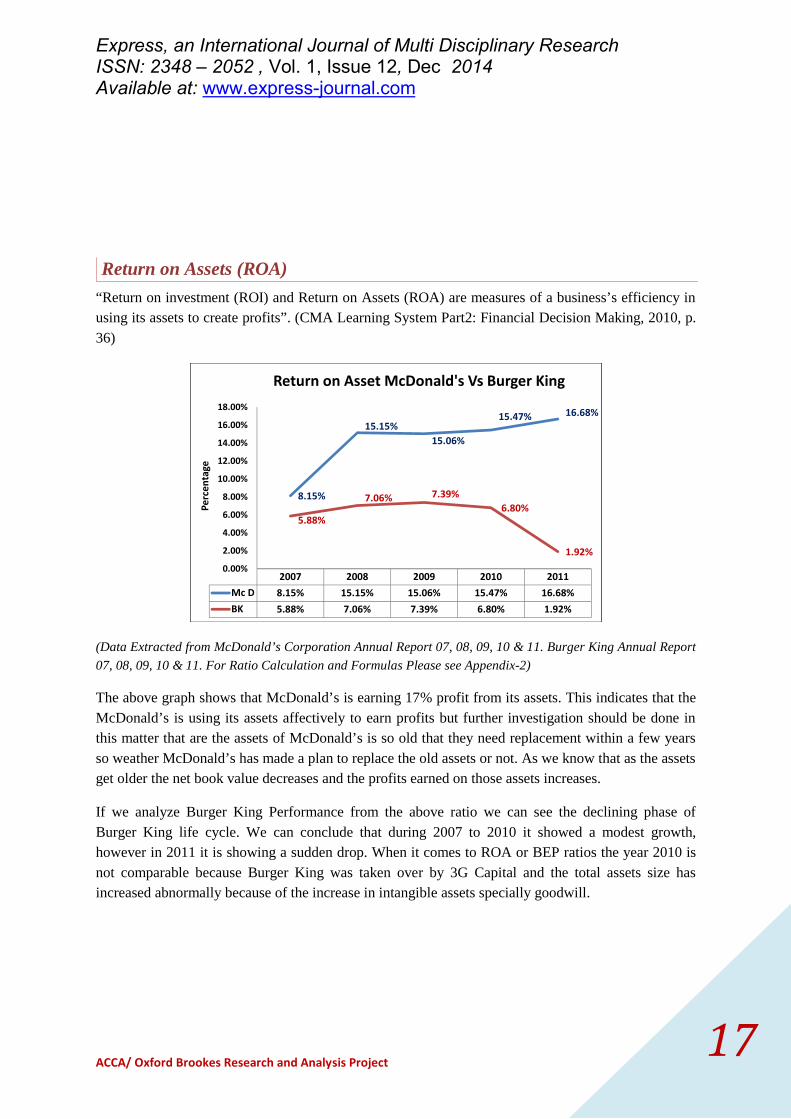
Return on Assets (ROA)
“Return on investment (ROI) and Return on Assets (ROA) are measures of a business’s efficiency inusing its assets to create profits”. (CMA Learning System Part2: Financial Decision Making, 2010, p.36)
2007 2008 2009 2010 2011Mc D 8.15% 15.15% 15.06% 15.47% 16.68%BK 5.88% 7.06% 7.39% 6.80% 1.92%
8.15%
15.15%15.06%
15.47% 16.68%
5.88%
7.06% 7.39%6.80%
1.92%0.00%
2.00%
4.00%
6.00%
8.00%
10.00%
12.00%
14.00%
16.00%
18.00%
Perc
enta
ge
Return on Asset McDonald's Vs Burger King
(Data Extracted from McDonald’s Corporation Annual Report 07, 08, 09, 10 & 11. Burger King Annual Report07, 08, 09, 10 & 11. For Ratio Calculation and Formulas Please see Appendix-2)
The above graph shows that McDonald’s is earning 17% profit from its assets. This indicates that theMcDonald’s is using its assets affectively to earn profits but further investigation should be done inthis matter that are the assets of McDonald’s is so old that they need replacement within a few yearsso weather McDonald’s has made a plan to replace the old assets or not. As we know that as the assetsget older the net book value decreases and the profits earned on those assets increases.
If we analyze Burger King Performance from the above ratio we can see the declining phase ofBurger King life cycle. We can conclude that during 2007 to 2010 it showed a modest growth,however in 2011 it is showing a sudden drop. When it comes to ROA or BEP ratios the year 2010 isnot comparable because Burger King was taken over by 3G Capital and the total assets size hasincreased abnormally because of the increase in intangible assets specially goodwill.
Express, an International Journal of Multi Disciplinary ResearchISSN: 2348 – 2052 , Vol. 1, Issue 12, Dec 2014Available at: www.express-journal.com
ACCA/ Oxford Brookes Research and Analysis Project18
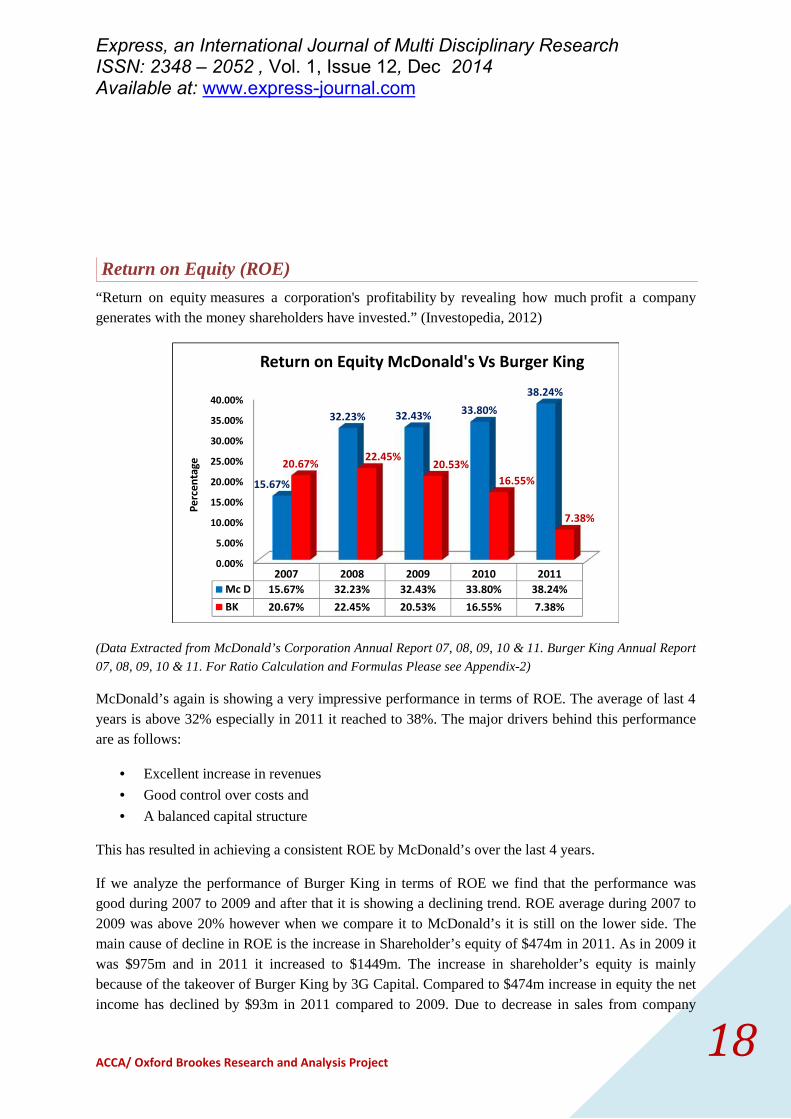
Return on Equity (ROE)
“Return on equity measures a corporation's profitability by revealing how much profit a companygenerates with the money shareholders have invested.” (Investopedia, 2012)
0.00%
5.00%
10.00%
15.00%
20.00%
25.00%
30.00%
35.00%
40.00%
2007 2008 2009 2010 2011Mc D 15.67% 32.23% 32.43% 33.80% 38.24%BK 20.67% 22.45% 20.53% 16.55% 7.38%
15.67%
32.23% 32.43% 33.80%38.24%
20.67% 22.45% 20.53%16.55%
7.38%
Perc
enta
ge
Return on Equity McDonald's Vs Burger King
(Data Extracted from McDonald’s Corporation Annual Report 07, 08, 09, 10 & 11. Burger King Annual Report07, 08, 09, 10 & 11. For Ratio Calculation and Formulas Please see Appendix-2)
McDonald’s again is showing a very impressive performance in terms of ROE. The average of last 4years is above 32% especially in 2011 it reached to 38%. The major drivers behind this performanceare as follows:
Excellent increase in revenues
Good control over costs and
A balanced capital structure
This has resulted in achieving a consistent ROE by McDonald’s over the last 4 years.
If we analyze the performance of Burger King in terms of ROE we find that the performance wasgood during 2007 to 2009 and after that it is showing a declining trend. ROE average during 2007 to2009 was above 20% however when we compare it to McDonald’s it is still on the lower side. Themain cause of decline in ROE is the increase in Shareholder’s equity of $474m in 2011. As in 2009 itwas $975m and in 2011 it increased to $1449m. The increase in shareholder’s equity is mainlybecause of the takeover of Burger King by 3G Capital. Compared to $474m increase in equity the netincome has declined by $93m in 2011 compared to 2009. Due to decrease in sales from company

Express, an International Journal of Multi Disciplinary ResearchISSN: 2348 – 2052 , Vol. 1, Issue 12, Dec 2014Available at: www.express-journal.com
ACCA/ Oxford Brookes Research and Analysis Project19
operated restaurant as evident from its financial statements as well as increase in Shareholder’s equityof $474m in 2011 from 2009 due to takeover of Burger King by 3G Capital in 2010.
Liquidity Ratios
Current Ratio
“The current ratio measures the adequacy of current assets to meet the company’s short termliabilities. It reflects weather the company is in a position to meet its liabilities as they fall due.”(ACCA Paper F7 Financial Reporting (FR) INT. Kaplan Publishing, p. 431)
0.80
1.39
1.14
1.49
1.25
0.93
0.89
0.77
0.921.53
0.00 0.50 1.00 1.50 2.00
2007
2008
2009
2010
2011
2007 2008 2009 2010 2011BKC 0.93 0.89 0.77 0.92 1.53MCD 0.80 1.39 1.14 1.49 1.25
Current Ratio McDonald's Vs Burger King
(Data Extracted from McDonald’s Corporation Annual Report 07, 08, 09, 10 & 11. Burger King Annual Report07, 08, 09, 10 & 11. For Ratio Calculation and Formulas Please see Appendix-2)
In the last 5 years the average is above 1 and since McDonald’s is in cash retail business therefore aratio above 1 is healthy in this industry. This reflects a good working capital management byMcDonald’s. The performance of Burger King in terms of current ratio is inconsistent and does notcorrespond with McDonald and even the benchmark of 1:1.

Express, an International Journal of Multi Disciplinary ResearchISSN: 2348 – 2052 , Vol. 1, Issue 12, Dec 2014Available at: www.express-journal.com
ACCA/ Oxford Brookes Research and Analysis Project20
Quick Ratio
“The quick ratio, or acid-test ratio, examines liquidity from a more immediate aspect then does thecurrent ratio by eliminating inventory from current assets.” (CMA Learning System Part2: FinancialDecision Making, 2010, p.17)
0.77
1.34
1.11
1.46
1.22
0.90
0.85
0.74
0.88
1.50
0.00 0.20 0.40 0.60 0.80 1.00 1.20 1.40 1.60
2007
2008
2009
2010
2011
2007 2008 2009 2010 2011BKC 0.90 0.85 0.74 0.88 1.50MCD 0.77 1.34 1.11 1.46 1.22
Quick Ratio McDonald's Vs Burger King
(Data Extracted from McDonald’s Corporation Annual Report 07, 08, 09, 10 & 11. Burger King Annual Report07, 08, 09, 10 & 11. For Ratio Calculation and Formulas Please see Appendix-2)
McDonald’s is showing a better performance in terms of quick ratio during the years 2008 to 2010and since last 4 years the ratio is above 1 which is a good indicator of having liquidity. Theperformance of Burger King in terms of quick ratio reflects that except for 2011 in all the years it wasbelow 1 and it was almost in the same range. McDonald’s has more liquidity compared to BurgerKing. The interesting point is that the inventory levels are not significant in total composition ofcurrent assets for both the companies because the difference between current ratio and quick ratio isnot significant.
Express, an International Journal of Multi Disciplinary ResearchISSN: 2348 – 2052 , Vol. 1, Issue 12, Dec 2014Available at: www.express-journal.com
ACCA/ Oxford Brookes Research and Analysis Project21
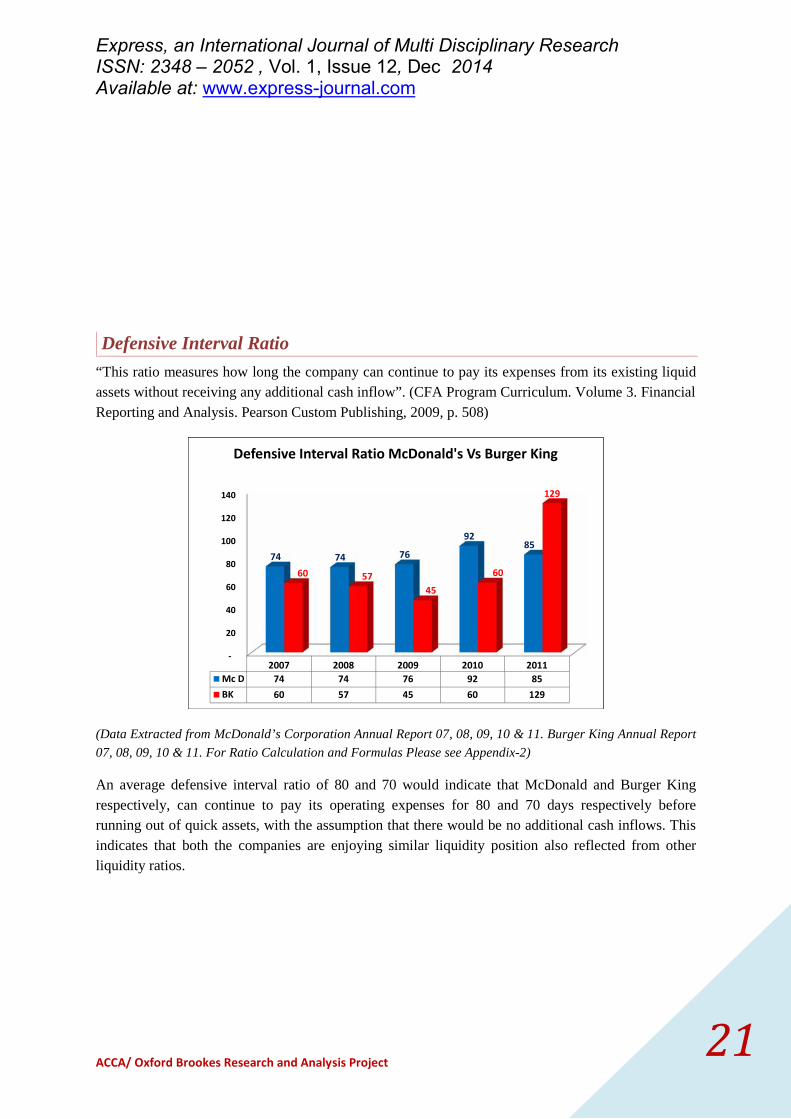
Defensive Interval Ratio
“This ratio measures how long the company can continue to pay its expenses from its existing liquidassets without receiving any additional cash inflow”. (CFA Program Curriculum. Volume 3. FinancialReporting and Analysis. Pearson Custom Publishing, 2009, p. 508)
-
20
40
60
80
100
120
140
2007 2008 2009 2010 2011Mc D 74 74 76 92 85BK 60 57 45 60 129
74 74 76
9285
60 5745
60
129
Defensive Interval Ratio McDonald's Vs Burger King
(Data Extracted from McDonald’s Corporation Annual Report 07, 08, 09, 10 & 11. Burger King Annual Report
07, 08, 09, 10 & 11. For Ratio Calculation and Formulas Please see Appendix-2)
An average defensive interval ratio of 80 and 70 would indicate that McDonald and Burger Kingrespectively, can continue to pay its operating expenses for 80 and 70 days respectively beforerunning out of quick assets, with the assumption that there would be no additional cash inflows. Thisindicates that both the companies are enjoying similar liquidity position also reflected from otherliquidity ratios.
Express, an International Journal of Multi Disciplinary ResearchISSN: 2348 – 2052 , Vol. 1, Issue 12, Dec 2014Available at: www.express-journal.com
ACCA/ Oxford Brookes Research and Analysis Project22
Debt Management Ratios
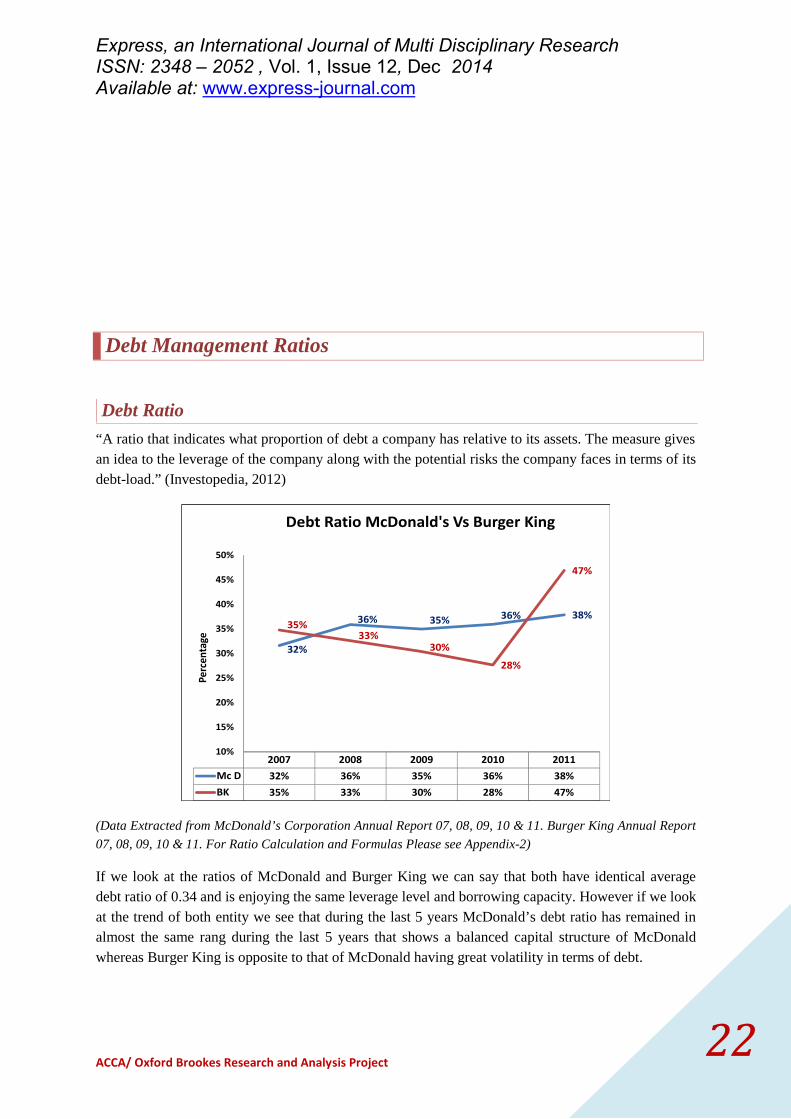
Debt Ratio
“A ratio that indicates what proportion of debt a company has relative to its assets. The measure givesan idea to the leverage of the company along with the potential risks the company faces in terms of itsdebt-load.” (Investopedia, 2012)
2007 2008 2009 2010 2011Mc D 32% 36% 35% 36% 38%BK 35% 33% 30% 28% 47%
32%
36% 35% 36% 38%35%
33%30%
28%
47%
10%
15%
20%
25%
30%
35%
40%
45%
50%
Perc
enta
ge
Debt Ratio McDonald's Vs Burger King
(Data Extracted from McDonald’s Corporation Annual Report 07, 08, 09, 10 & 11. Burger King Annual Report07, 08, 09, 10 & 11. For Ratio Calculation and Formulas Please see Appendix-2)
If we look at the ratios of McDonald and Burger King we can say that both have identical averagedebt ratio of 0.34 and is enjoying the same leverage level and borrowing capacity. However if we lookat the trend of both entity we see that during the last 5 years McDonald’s debt ratio has remained inalmost the same rang during the last 5 years that shows a balanced capital structure of McDonaldwhereas Burger King is opposite to that of McDonald having great volatility in terms of debt.
Express, an International Journal of Multi Disciplinary ResearchISSN: 2348 – 2052 , Vol. 1, Issue 12, Dec 2014Available at: www.express-journal.com
ACCA/ Oxford Brookes Research and Analysis Project23
Asset Management Ratios
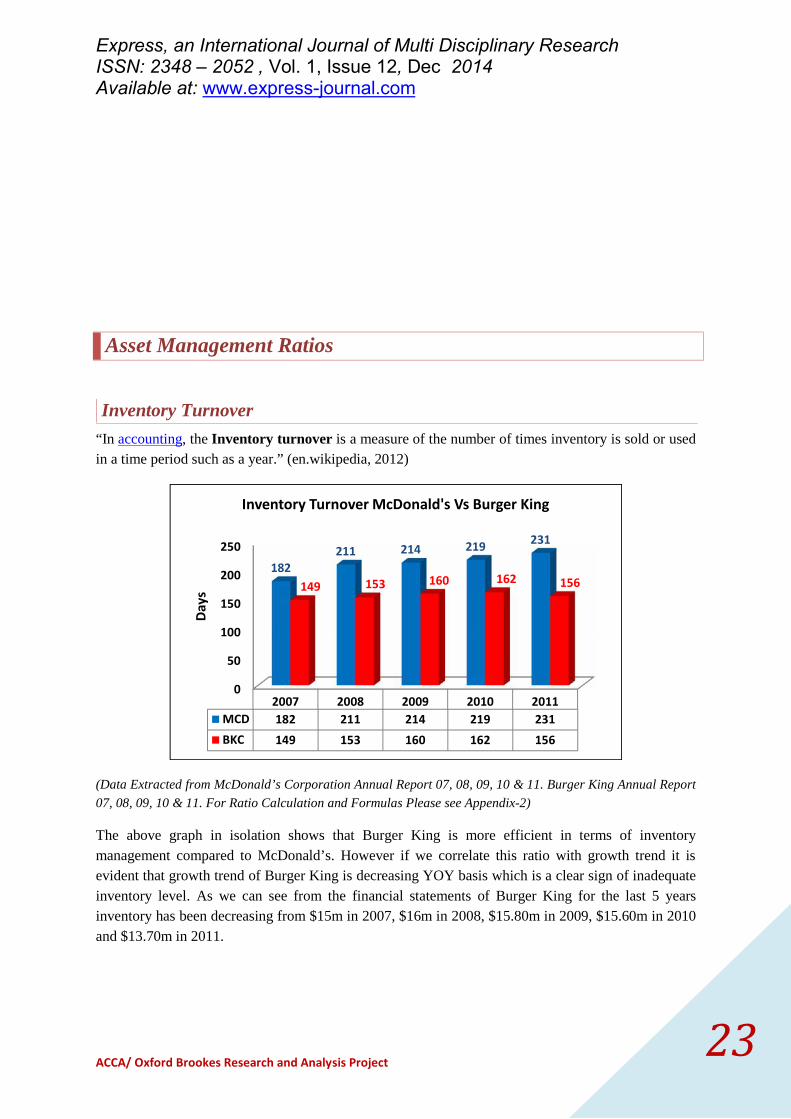
Inventory Turnover
“In accounting, the Inventory turnover is a measure of the number of times inventory is sold or usedin a time period such as a year.” (en.wikipedia, 2012)
0
50
100
150
200
250
2007 2008 2009 2010 2011MCD 182 211 214 219 231BKC 149 153 160 162 156
182211 214 219 231
149 153 160 162 156
Days
Inventory Turnover McDonald's Vs Burger King
(Data Extracted from McDonald’s Corporation Annual Report 07, 08, 09, 10 & 11. Burger King Annual Report07, 08, 09, 10 & 11. For Ratio Calculation and Formulas Please see Appendix-2)
The above graph in isolation shows that Burger King is more efficient in terms of inventorymanagement compared to McDonald’s. However if we correlate this ratio with growth trend it isevident that growth trend of Burger King is decreasing YOY basis which is a clear sign of inadequateinventory level. As we can see from the financial statements of Burger King for the last 5 yearsinventory has been decreasing from $15m in 2007, $16m in 2008, $15.80m in 2009, $15.60m in 2010and $13.70m in 2011.
Express, an International Journal of Multi Disciplinary ResearchISSN: 2348 – 2052 , Vol. 1, Issue 12, Dec 2014Available at: www.express-journal.com
ACCA/ Oxford Brookes Research and Analysis Project24
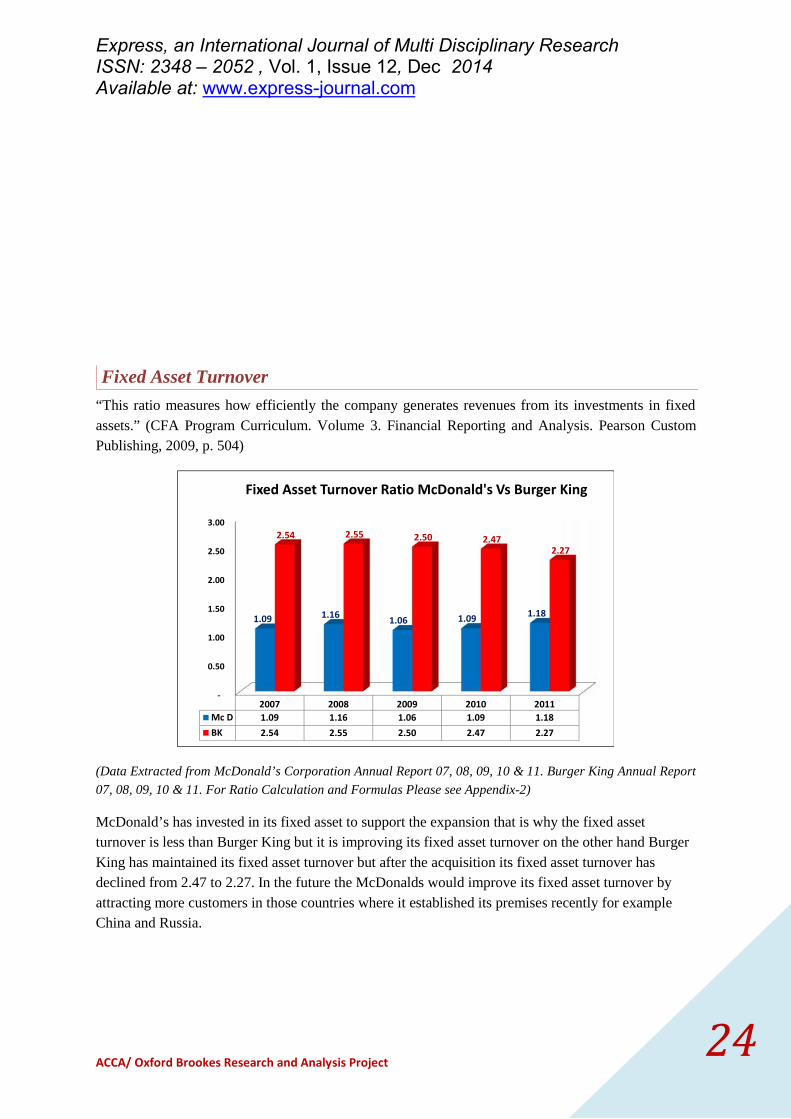
Fixed Asset Turnover
“This ratio measures how efficiently the company generates revenues from its investments in fixedassets.” (CFA Program Curriculum. Volume 3. Financial Reporting and Analysis. Pearson CustomPublishing, 2009, p. 504)
-
0.50
1.00
1.50
2.00
2.50
3.00
2007 2008 2009 2010 2011Mc D 1.09 1.16 1.06 1.09 1.18BK 2.54 2.55 2.50 2.47 2.27
1.09 1.16 1.06 1.09 1.18
2.54 2.55 2.50 2.472.27
Fixed Asset Turnover Ratio McDonald's Vs Burger King
(Data Extracted from McDonald’s Corporation Annual Report 07, 08, 09, 10 & 11. Burger King Annual Report07, 08, 09, 10 & 11. For Ratio Calculation and Formulas Please see Appendix-2)
McDonald’s has invested in its fixed asset to support the expansion that is why the fixed assetturnover is less than Burger King but it is improving its fixed asset turnover on the other hand BurgerKing has maintained its fixed asset turnover but after the acquisition its fixed asset turnover hasdeclined from 2.47 to 2.27. In the future the McDonalds would improve its fixed asset turnover byattracting more customers in those countries where it established its premises recently for exampleChina and Russia.
Express, an International Journal of Multi Disciplinary ResearchISSN: 2348 – 2052 , Vol. 1, Issue 12, Dec 2014Available at: www.express-journal.com
ACCA/ Oxford Brookes Research and Analysis Project25
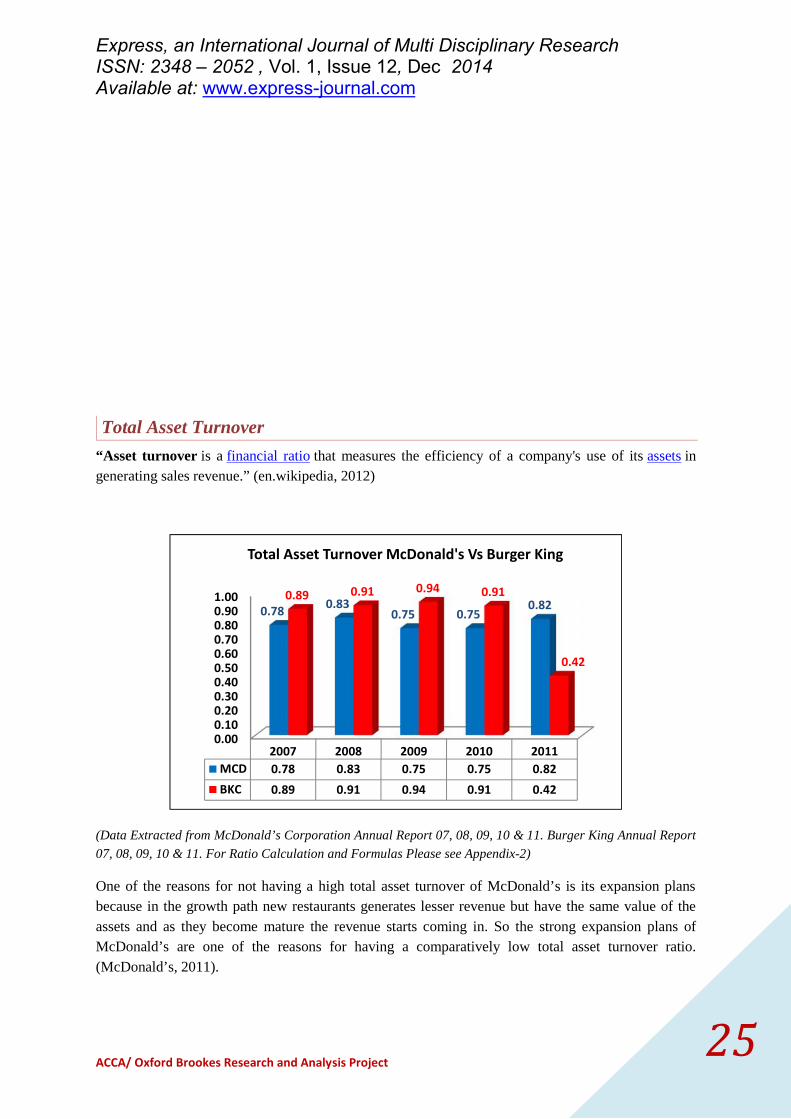
Total Asset Turnover
“Asset turnover is a financial ratio that measures the efficiency of a company's use of its assets ingenerating sales revenue.” (en.wikipedia, 2012)
0.000.100.200.300.400.500.600.700.800.901.00
2007 2008 2009 2010 2011MCD 0.78 0.83 0.75 0.75 0.82BKC 0.89 0.91 0.94 0.91 0.42
0.78 0.830.75 0.75
0.820.89 0.91 0.94 0.91
0.42
Total Asset Turnover McDonald's Vs Burger King
(Data Extracted from McDonald’s Corporation Annual Report 07, 08, 09, 10 & 11. Burger King Annual Report07, 08, 09, 10 & 11. For Ratio Calculation and Formulas Please see Appendix-2)
One of the reasons for not having a high total asset turnover of McDonald’s is its expansion plansbecause in the growth path new restaurants generates lesser revenue but have the same value of theassets and as they become mature the revenue starts coming in. So the strong expansion plans ofMcDonald’s are one of the reasons for having a comparatively low total asset turnover ratio.(McDonald’s, 2011).
Express, an International Journal of Multi Disciplinary ResearchISSN: 2348 – 2052 , Vol. 1, Issue 12, Dec 2014Available at: www.express-journal.com
ACCA/ Oxford Brookes Research and Analysis Project26
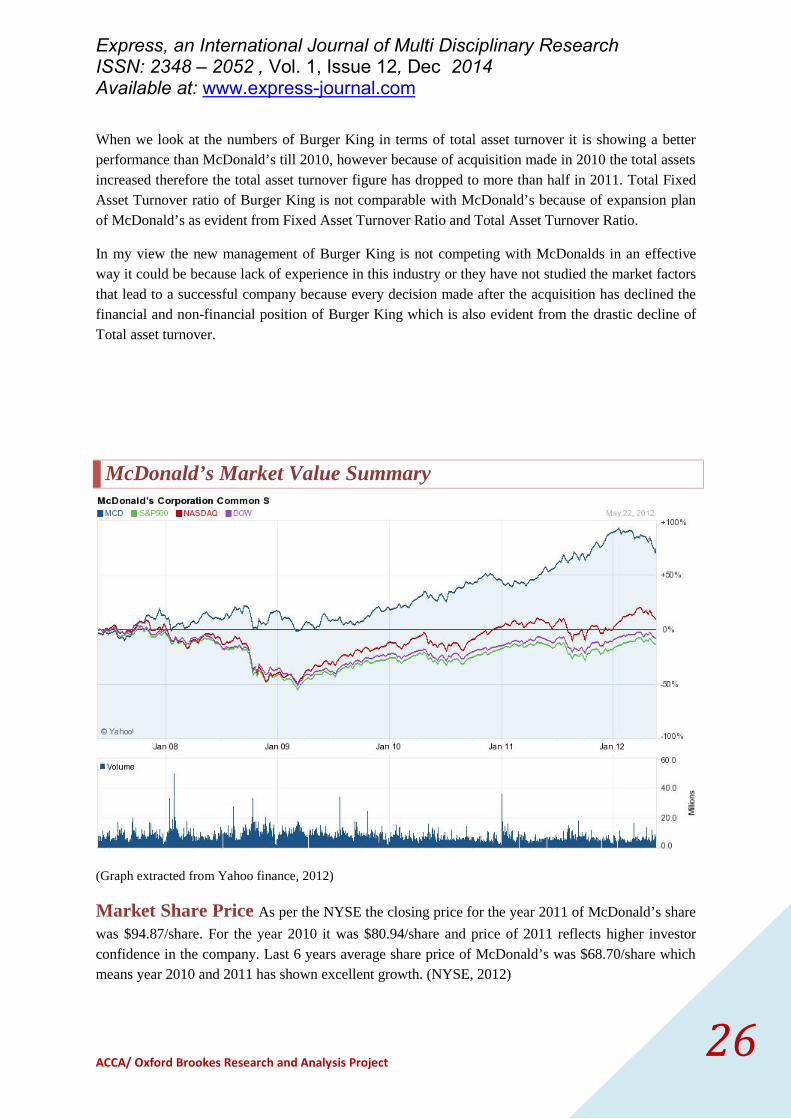
When we look at the numbers of Burger King in terms of total asset turnover it is showing a betterperformance than McDonald’s till 2010, however because of acquisition made in 2010 the total assetsincreased therefore the total asset turnover figure has dropped to more than half in 2011. Total FixedAsset Turnover ratio of Burger King is not comparable with McDonald’s because of expansion planof McDonald’s as evident from Fixed Asset Turnover Ratio and Total Asset Turnover Ratio.
In my view the new management of Burger King is not competing with McDonalds in an effectiveway it could be because lack of experience in this industry or they have not studied the market factorsthat lead to a successful company because every decision made after the acquisition has declined thefinancial and non-financial position of Burger King which is also evident from the drastic decline ofTotal asset turnover.
McDonald’s Market Value Summary
(Graph extracted from Yahoo finance, 2012)
Market Share Price As per the NYSE the closing price for the year 2011 of McDonald’s sharewas $94.87/share. For the year 2010 it was $80.94/share and price of 2011 reflects higher investorconfidence in the company. Last 6 years average share price of McDonald’s was $68.70/share whichmeans year 2010 and 2011 has shown excellent growth. (NYSE, 2012)
Express, an International Journal of Multi Disciplinary ResearchISSN: 2348 – 2052 , Vol. 1, Issue 12, Dec 2014Available at: www.express-journal.com
ACCA/ Oxford Brookes Research and Analysis Project27
As per the NYSE the closing price for the year 2011 of Burger King Share was $24/share. For theyear 2010 it was $24.00/share which is not a very good indicator if we compare the share price with2007 and 2008 it was $28.71 and $24.12 respectively which shows that the shares of Burger King areperforming badly in the market. If we compare the share price of McDonald’s then we can see thatthere is a difference of $71.00 which shows that McDonald’s shares are trading way higher than thatof Burger King. (Advfn, 2012)
Earnings Per Share (EPS) of McDonald’s is showing high value i.e. $5.39/share (165mshares) in 2011. Compared to last year 2010 it was $4.69/share. If we see the historical EPS ofMcDonald’s it is showing a $3.86 as an average in last 6 years which indicates that EPS is improvingfor McDonald’s strong earnings growth of 20% plus is the main driver for this growth.
EPS of Burger King has declined to $0.79/share in 2011 compared to 2010 which was $1.37/share.The historical EPS of Burger King for last 6 years is showing $1.07 as an average which indicates thatBurger King is also paying back to its shareholder but compared to McDonald’s it’s quite less.
Price Earning Per Share (P/E) of McDonald’s in year 2011 was $17.60/share and$17.25/share in year 2010 respectively which is an increase of $0.35/share. If we see the historicaldata of McDonald’s PE the average comes around $18.79/share in the last 6 years. This means adeclining trend in 2011.
Burger King’s Price Earning is showing an upward trend in 2010 and 2011 this is mainly because ofthe acquisition that happened. The average P/E of Burger King is around $20.79 for the last 5 yearscompared to McDonald’s that has an average of $19.51.
Cash Flow per share of McDonald’s for the year 2011, 2010 & 2009 per share was $6.78,
$5.90, and $5.35 respectively. It reflects the strength of McDonald’s and sustainability of its businessmodel. The average Cash flow per share for the last 5 years is $5.22 which shows the strength ofMcDonald’s in its cash flow per share.
Cash flow per share of Burger King for the year 2011, 2010 & 2009 per share was $1.79, $2.20 and$2.21 respectively. The average for the last 5 years is $2.02/share. The decline in 2011 is a cause ofconcern for the investors and would negatively affect the company’s ability to raise capital for itsfuture expansion plans.
Price/ Cash flow per share of McDonald’s for the year 2009, 2010 & 2011 per share was
$11.96, $13.71 and $14.00 respectively. It shows the investment attractiveness to the investors as thismetric compares the stock's market price to the amount of cash flow the company generates on a per-share basis. The average of last 5 years is also standing at an impressive $14.63.
Price/ Cash flow per share of Burger King for the year 2009, 2010 & 2011 per share was $8.65,$10.93 and $13.38 respectively an improvement of $2.45 per share in 2011. Last 5 years average is$12.12/per share. Although it has showing an increasing trend in the last 3 years but it is still lowerthan McDonald’s which is $14.00/per share.

Express, an International Journal of Multi Disciplinary ResearchISSN: 2348 – 2052 , Vol. 1, Issue 12, Dec 2014Available at: www.express-journal.com
ACCA/ Oxford Brookes Research and Analysis Project28
Book Value per share of McDonald’s for the year 2009, 2010 & 2011 per share was
$13.03, $13.88 and $14.09 respectively. It shows that the market price of McDonald’s is growing thereasons behind this are maintaining good cash flows, market strategies and shareholders’ equity. Theaverage of last 5 years is $13.23.
Book value per share of Burger King in 2011 is $10.67/share which has increased compared to 2010which was $8.30/per share. For the 5 years the average is $7.56/share. Although the BVPS isconstantly increasing each year but still it is less than McDonald’s which is enjoying a BVPS of$14.09 per share.
Conclusion
Express, an International Journal of Multi Disciplinary ResearchISSN: 2348 – 2052 , Vol. 1, Issue 12, Dec 2014Available at: www.express-journal.com
ACCA/ Oxford Brookes Research and Analysis Project29
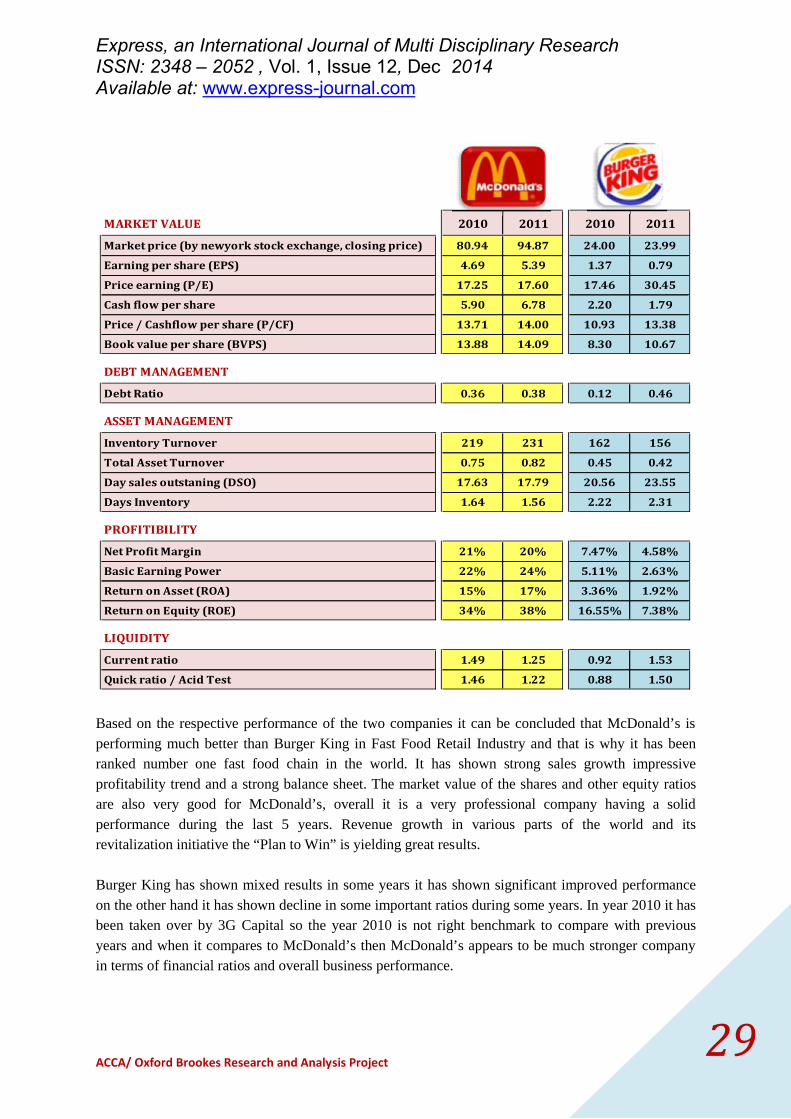
MARKET VALUE 2010 2011 2010 2011
Market price (by newyork stock exchange, closing price) 80.94 94.87 24.00 23.99
Earning per share (EPS) 4.69 5.39 1.37 0.79
Price earning (P/E) 17.25 17.60 17.46 30.45
Cash flow per share 5.90 6.78 2.20 1.79
Price / Cashflow per share (P/CF) 13.71 14.00 10.93 13.38
Book value per share (BVPS) 13.88 14.09 8.30 10.67
DEBT MANAGEMENT
Debt Ratio 0.36 0.38 0.12 0.46
ASSET MANAGEMENT
Inventory Turnover 219 231 162 156
Total Asset Turnover 0.75 0.82 0.45 0.42
Day sales outstaning (DSO) 17.63 17.79 20.56 23.55
Days Inventory 1.64 1.56 2.22 2.31
PROFITIBILITY
Net Profit Margin 21% 20% 7.47% 4.58%
Basic Earning Power 22% 24% 5.11% 2.63%
Return on Asset (ROA) 15% 17% 3.36% 1.92%
Return on Equity (ROE) 34% 38% 16.55% 7.38%
LIQUIDITY
Current ratio 1.49 1.25 0.92 1.53
Quick ratio / Acid Test 1.46 1.22 0.88 1.50
Based on the respective performance of the two companies it can be concluded that McDonald’s isperforming much better than Burger King in Fast Food Retail Industry and that is why it has beenranked number one fast food chain in the world. It has shown strong sales growth impressiveprofitability trend and a strong balance sheet. The market value of the shares and other equity ratiosare also very good for McDonald’s, overall it is a very professional company having a solidperformance during the last 5 years. Revenue growth in various parts of the world and itsrevitalization initiative the “Plan to Win” is yielding great results.
Burger King has shown mixed results in some years it has shown significant improved performanceon the other hand it has shown decline in some important ratios during some years. In year 2010 it hasbeen taken over by 3G Capital so the year 2010 is not right benchmark to compare with previousyears and when it compares to McDonald’s then McDonald’s appears to be much stronger companyin terms of financial ratios and overall business performance.