Embed Size (px)
Citation preview
1
M&C SAATCHI PLC
PRELIMINARY RESULTS
YEAR ENDED 31 DECEMBER 2010
24 MARCH 2011
2
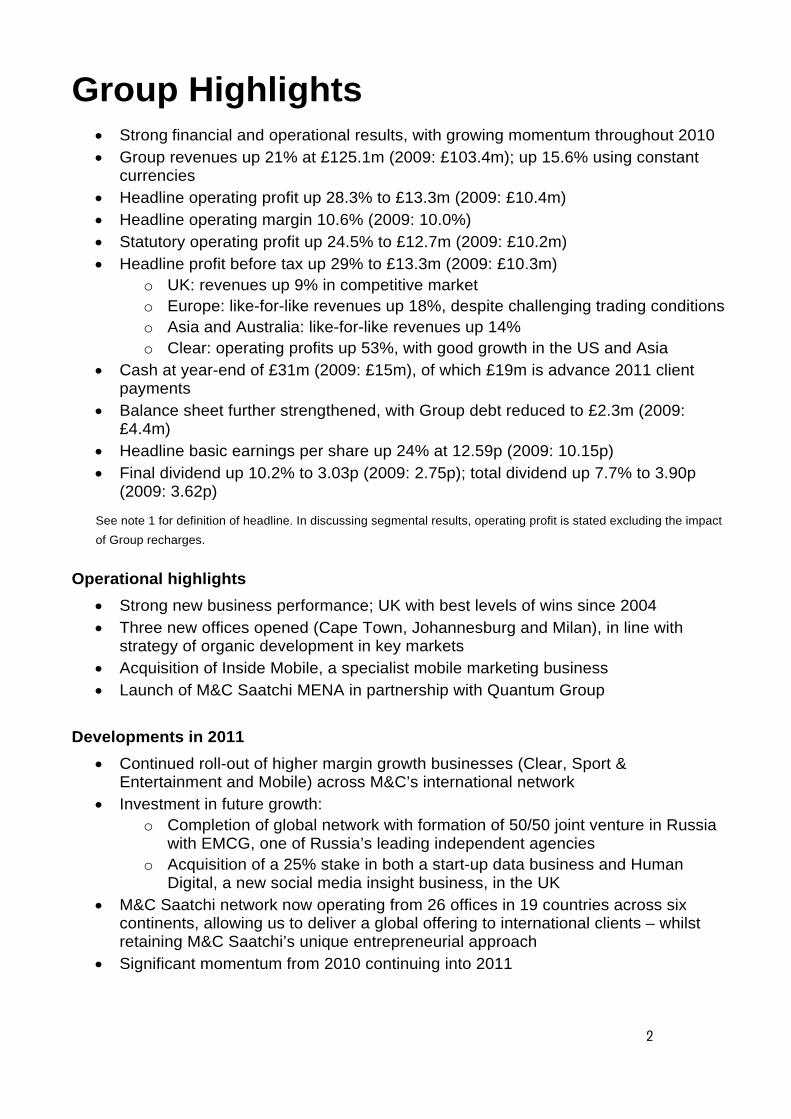
Group Highlights • Strong financial and operational results, with growing momentum throughout 2010 • Group revenues up 21% at £125.1m (2009: £103.4m); up 15.6% using constant
currencies • Headline operating profit up 28.3% to £13.3m (2009: £10.4m) • Headline operating margin 10.6% (2009: 10.0%) • Statutory operating profit up 24.5% to £12.7m (2009: £10.2m) • Headline profit before tax up 29% to £13.3m (2009: £10.3m)
o UK: revenues up 9% in competitive market o Europe: like-for-like revenues up 18%, despite challenging trading conditions o Asia and Australia: like-for-like revenues up 14% o Clear: operating profits up 53%, with good growth in the US and Asia
• Cash at year-end of £31m (2009: £15m), of which £19m is advance 2011 client payments
• Balance sheet further strengthened, with Group debt reduced to £2.3m (2009: £4.4m)
• Headline basic earnings per share up 24% at 12.59p (2009: 10.15p) • Final dividend up 10.2% to 3.03p (2009: 2.75p); total dividend up 7.7% to 3.90p
(2009: 3.62p)
See note 1 for definition of headline. In discussing segmental results, operating profit is stated excluding the impact of Group recharges.
Operational highlights • Strong new business performance; UK with best levels of wins since 2004 • Three new offices opened (Cape Town, Johannesburg and Milan), in line with
strategy of organic development in key markets • Acquisition of Inside Mobile, a specialist mobile marketing business • Launch of M&C Saatchi MENA in partnership with Quantum Group
Developments in 2011
• Continued roll-out of higher margin growth businesses (Clear, Sport & Entertainment and Mobile) across M&C’s international network
• Investment in future growth: o Completion of global network with formation of 50/50 joint venture in Russia
with EMCG, one of Russia’s leading independent agencies o Acquisition of a 25% stake in both a start-up data business and Human
Digital, a new social media insight business, in the UK • M&C Saatchi network now operating from 26 offices in 19 countries across six
continents, allowing us to deliver a global offering to international clients – whilst retaining M&C Saatchi’s unique entrepreneurial approach
• Significant momentum from 2010 continuing into 2011
3
Commenting on the results, David Kershaw, Chief Executive, said: “M&C Saatchi made excellent progress in 2010 – delivering strong growth in revenues and profitability against a backdrop of competitive markets. At the same time, we continued to invest for future growth, expanding into more geographies and taking our brands into new market segments. “That success leaves us well placed to make further progress and winning more global new business is a key focus. With the formation of a joint venture in Russia, our global network is complete - operating from 26 offices in 19 countries across six continents – meaning we are better placed than ever before to drive international revenue growth. M&C Saatchi has grown internationally by backing owner managers starting up agencies, rather than through acquisition. This ensures that our clients have the benefit of the best and most entrepreneurial operators in each market. At the same time, we are also exporting our newer businesses such as Clear, Sport & Entertainment and Mobile, across our unique international network. “2011 has started well with the good revenue momentum built through 2010 continuing into the new year. Given this backdrop, while we remain cautious about the macro environment, the Board is confident that we will continue to make progress in 2011 and beyond.” For further information please call: M&C Saatchi +44 (0)20-7543-4500 David Kershaw Tulchan Communications +44 (0)20-7353-4200 Susanna Voyle Tom Murray Numis Securities +44 (0)20-7260-1000 Richard Thomas, NOMAD Charles Farquhar, Corporate Broking
4
SUMMARY OF RESULTS 2010 was a year of healthy progress for M&C Saatchi. We ended the year with significant momentum having delivered good growth in both revenue and profits. The overall figures were excellent: revenue was up 21%, with like-for-like (excluding exchange movements) revenues increasing by 16%, the headline operating margin was up from 10.0% to 10.6%, while the headline profit before tax advanced 29% to £13.3m and headline net earnings rose 25%. Cash flow continued to be strong and our balance sheet remains in good shape. We have been closely managing our working capital so debt has been reduced and cash materially increased. UK We enjoyed a strong year in the UK, delivering the best annual new business performance since we listed in 2004. UK revenues advanced 9% year on year. This performance came in spite of the continued highly competitive nature of the market. Key new clients included iShares, BlackRock, the Mail on Sunday, the Olympic Delivery Authority, Bathstore, IKEA, Netjets, Memega and the Government’s Cancer Awareness campaign for the COI. Importantly, several of the larger wins were integrated mandates, with a number of Group companies benefiting.We retain a close focus on margin and cost control, but continue to experience pressure on media buying remuneration. This resulted in the headline operating margin dipping from 21.3% to 20.5%. The UK operating profit improved 5% on 2009. Europe We made good progress in our offices in Continental Europe, with our offices growing well in a market that proved to be no easier. Like-for-like revenues rose 18%, the headline operating margin increased from 11.5% to 15.1% and operating profits were up 49% year on year. Germany delivered a particularly impressive performance, whilst in France we benefited from our expansion into direct marketing, digital and PR as the core advertising market remains tough. Asia and Australasia There was improvement from our operations in Asia and Australasia. Like-for-like revenue increased 14%, headline operating margin was up from 6.8% to 8.2% and operating profits rose a notable 59% to £3.6m. New accounts in Australia included Brand Australia, David Jones, ING, Woolworths hardware and Georg Jensen. Malaysia also turned in a strong new business performance, winning Volkswagen, Bursa Malaysia and MAB. Elsewhere in the region, Japan and New Zealand are growing and made good progress. China and India’s clients remain project based and relatively small; both markets are currently working to secure larger retained clients.
5
Americas We continued to make progress in the US, albeit with our operations that remain modest. We have explored alliances in New York and are currently establishing a hub for our growing non-advertising businesses. Los Angeles was successful on the new business front in the second half, winning Trafalgar Travel, Proximo Spirits (Three Olives Vodka) and Ugg boots. Brazil has found it hard to compete through lack of scale, leading to a portfolio reliant on project-based work. To rectify this we are acquiring 60% of a larger agency and merging this into our Sao Paulo operation. Global Network One of the key focuses last year was the continued work to complete the M&C Saatchi global network. This has been developed in line with our strategy of organically developing offerings in key markets. In 2010 we opened three new offices; in South Africa (Cape Town in February and Johannesburg in October) and Italy (Milan in June) in line with our strategy of organically developing offerings in key markets. These moves meant that by the year end we were operating in 18 countries across 6 continents with 25 offices, allowing us to deliver a global offering to international clients – whilst retaining M&C Saatchi’s unique entrepreneurial approach, based on incorporating Brutal Simplicity of Thought. In 2010, the new offices contributed £1.2m of new revenues and £0.8m of operating losses. We generally expect our new offices to incur two years of operating losses and were delighted that Milan managed to break even in its first year. Since the year end, we have announced plans to open in Russia – a move which completes our global network - via the formation of a 50/50 joint venture with EMCG, one of Russia’s leading independent agencies. They will now work under the M&C Saatchi name, giving us access to another key growth market. In June we acquired Inside Mobile, the leading mobile marketing specialist, and are delighted with the progress they are making as part of the Group. We continue to add new businesses, investing for future growth. Clear Clear maintained a strong first half performance, with good growth in the US and Asia. Like-for-like revenue was up 29% on 2009, the headline operating margin advanced from 15.2% to 17.9% and operating profits increased by 53%. New clients in the UK were BSkyB, Coors and Skandia, whilst the Netherlands added Philips and TomTom, the USA Pizza Hut and Celgene and Asia Pepsi, Celcom and Colgate. There was a healthy referral of clients across the Clear network and all offices now handle assignments from Unilever. We opened a new Clear office in Australia at the start of 2010 and are just adding a further office in Singapore to attract regionally based multinationals.

6
Outlook 2011 has started well. Despite caution regarding the macro environment, we are currently enjoying good revenue momentum. We believe the Network is now in place with offices in all the key regions. Winning global new business is a key focus. In this respect, already in 2011 we have won Visit Britain, FTI Consulting, Kaspersky, BAE Systems and Garmin. We are also exporting our newer businesses; we have been rolling out Clear, Sport & Entertainment and Mobile across international markets. Lastly, we continue to invest for future growth. In the UK, we are taking a 25% minority in both a start up data business and Human Digital, a new social media insight business. The Board is confident that we will continue to make progress in 2011 and beyond.
7
M&C SAATCHI PLC
AUDITED CONSOLIDATED INCOME STATEMENT
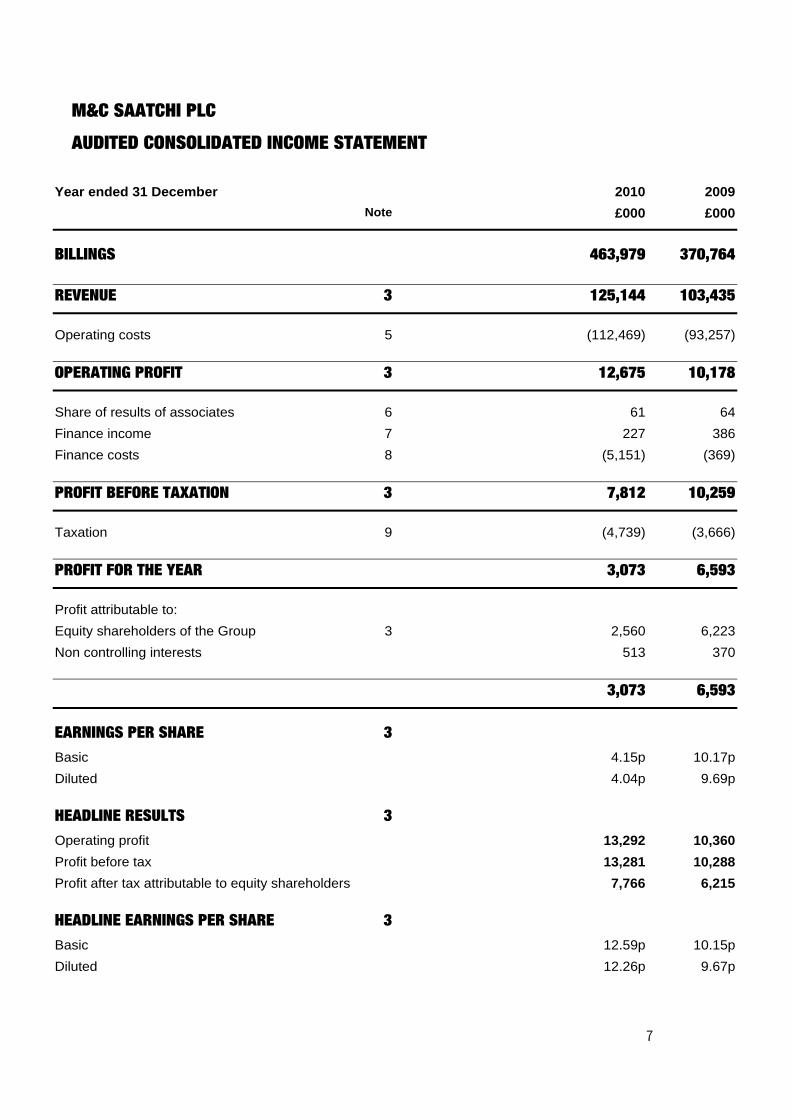
Year ended 31 December 2010 2009 Note £000 £000
BILLINGS 463,979 370,764
REVENUE 3 125,144 103,435
Operating costs 5 (112,469) (93,257)
OPERATING PROFIT 3 12,675 10,178
Share of results of associates 6 61 64Finance income 7 227 386Finance costs 8 (5,151) (369)
PROFIT BEFORE TAXATION 3 7,812 10,259
Taxation 9 (4,739) (3,666)
PROFIT FOR THE YEAR 3,073 6,593
Profit attributable to: Equity shareholders of the Group 3 2,560 6,223Non controlling interests 513 370
3,073 6,593
EARNINGS PER SHARE 3 Basic 4.15p 10.17pDiluted 4.04p 9.69p
HEADLINE RESULTS 3 Operating profit 13,292 10,360Profit before tax 13,281 10,288Profit after tax attributable to equity shareholders 7,766 6,215
HEADLINE EARNINGS PER SHARE 3 Basic 12.59p 10.15pDiluted 12.26p 9.67p
8
M&C SAATCHI PLC
AUDITED CONSOLIDATED STATEMENT OF COMPREHENSIVE INCOME
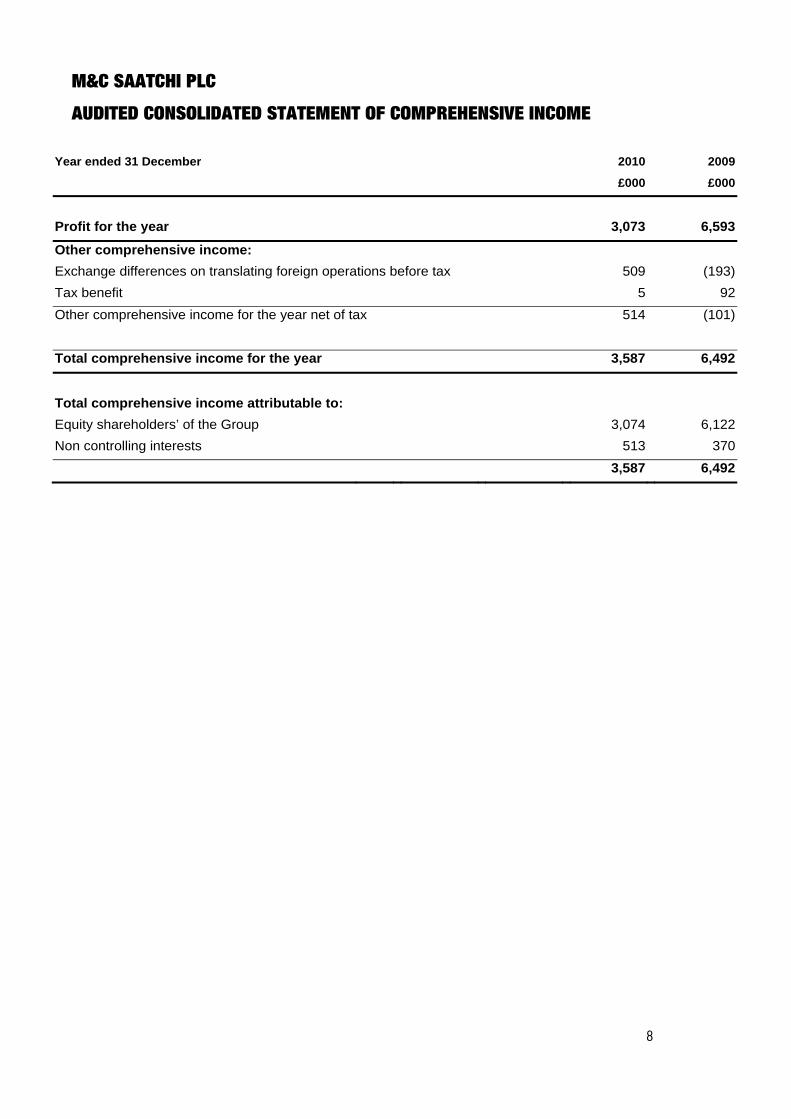
Year ended 31 December 2010 2009 £000 £000
Profit for the year
3,073
6,593
Other comprehensive income: Exchange differences on translating foreign operations before tax 509 (193)Tax benefit 5 92Other comprehensive income for the year net of tax 514 (101) Total comprehensive income for the year 3,587 6,492
Total comprehensive income attributable to:
Equity shareholders’ of the Group 3,074 6,122Non controlling interests 513 370
3,587 6,492
9
M&C SAATCHI PLC
AUDITED CONSOLIDATED BALANCE SHEET
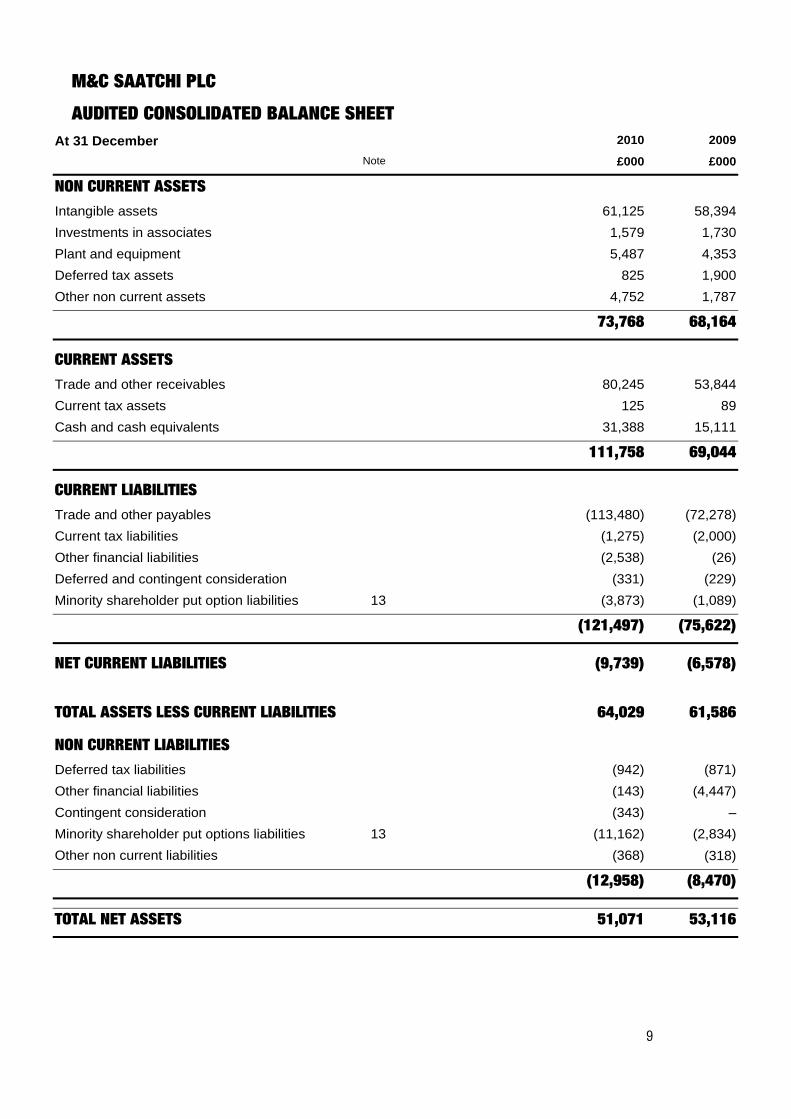
At 31 December 2010 2009 Note £000 £000
NON CURRENT ASSETS Intangible assets 61,125 58,394Investments in associates 1,579 1,730Plant and equipment 5,487 4,353Deferred tax assets 825 1,900Other non current assets 4,752 1,787
73,768 68,164
CURRENT ASSETS Trade and other receivables 80,245 53,844Current tax assets 125 89Cash and cash equivalents 31,388 15,111
111,758 69,044
CURRENT LIABILITIES Trade and other payables (113,480) (72,278)Current tax liabilities (1,275) (2,000)Other financial liabilities (2,538) (26)Deferred and contingent consideration (331) (229)Minority shareholder put option liabilities 13 (3,873) (1,089)
(121,497) (75,622)
NET CURRENT LIABILITIES (9,739) (6,578)
TOTAL ASSETS LESS CURRENT LIABILITIES 64,029 61,586
NON CURRENT LIABILITIES Deferred tax liabilities (942) (871)Other financial liabilities (143) (4,447)Contingent consideration (343) –Minority shareholder put options liabilities 13 (11,162) (2,834)Other non current liabilities (368) (318)
(12,958) (8,470)
TOTAL NET ASSETS 51,071 53,116
10
M&C SAATCHI PLC
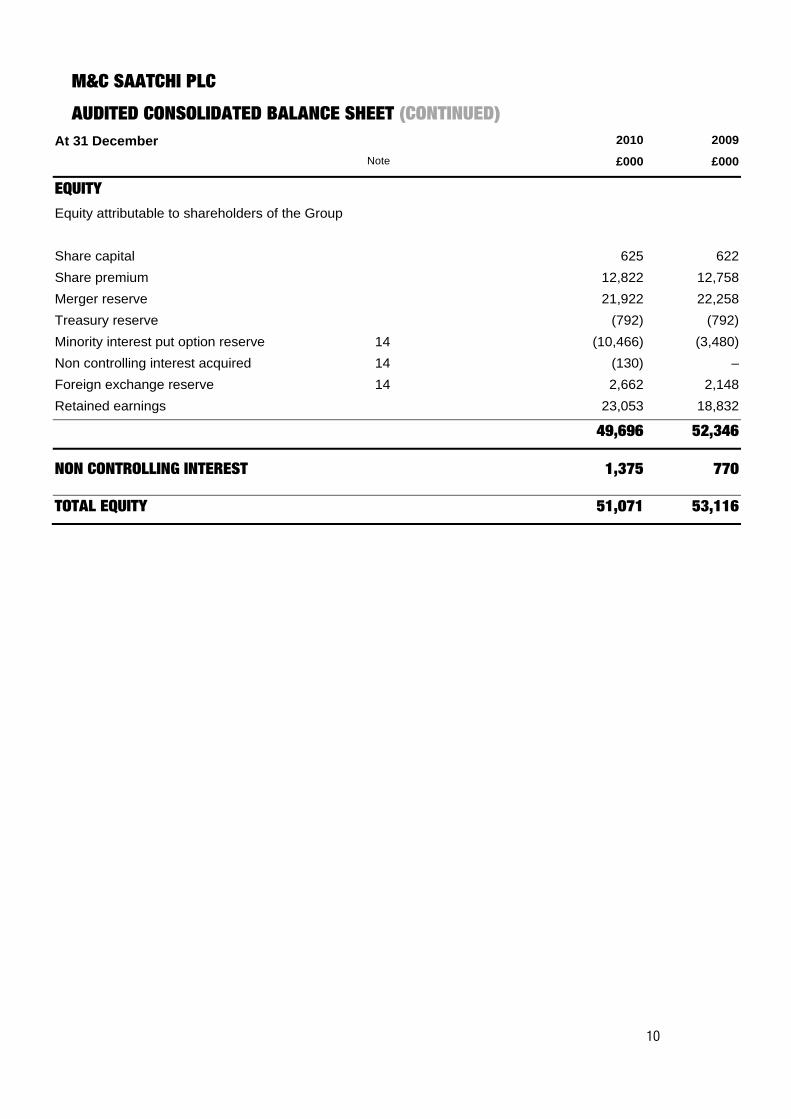
AUDITED CONSOLIDATED BALANCE SHEET (CONTINUED) At 31 December 2010 2009
Note £000 £000
EQUITY Equity attributable to shareholders of the Group Share capital 625 622Share premium 12,822 12,758Merger reserve 21,922 22,258Treasury reserve (792) (792)Minority interest put option reserve 14 (10,466) (3,480)Non controlling interest acquired 14 (130) –Foreign exchange reserve 14 2,662 2,148Retained earnings 23,053 18,832
49,696 52,346
NON CONTROLLING INTEREST 1,375 770
TOTAL EQUITY 51,071 53,116
11
M&C SAATCHI PLC
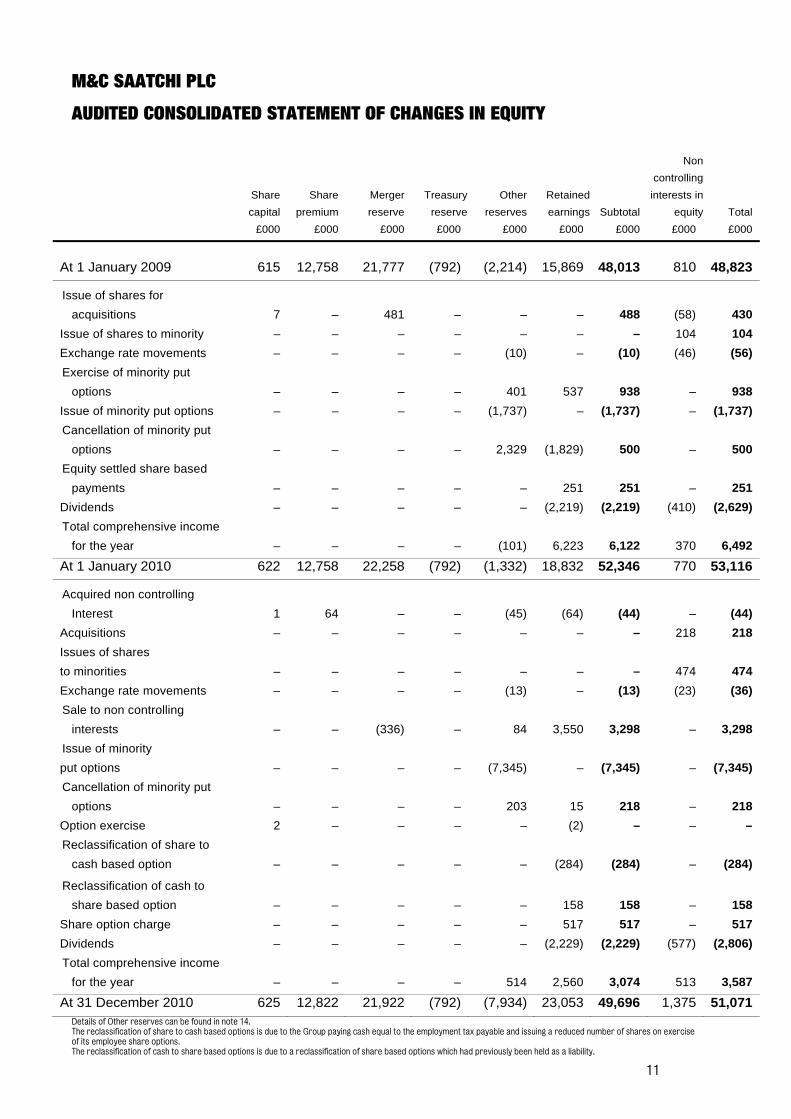
AUDITED CONSOLIDATED STATEMENT OF CHANGES IN EQUITY
Share capital
Share premium
Merger reserve
Treasury reserve
Other reserves
Retained earnings Subtotal
Non controlling
interests in equity Total
£000 £000 £000 £000 £000 £000 £000 £000 £000
At 1 January 2009 615 12,758 21,777 (792) (2,214) 15,869 48,013 810 48,823
Issue of shares for acquisitions 7 – 481 – – – 488 (58) 430
Issue of shares to minority – – – – – – – 104 104Exchange rate movements – – – – (10) – (10) (46) (56)Exercise of minority put
options – – – – 401 537 938 – 938 Issue of minority put options – – – – (1,737) – (1,737) – (1,737)Cancellation of minority put
options – – – – 2,329 (1,829) 500 – 500 Equity settled share based
payments – – – – – 251 251 – 251 Dividends – – – – – (2,219) (2,219) (410) (2,629)Total comprehensive income
for the year – – – – (101) 6,223 6,122 370 6,492
At 1 January 2010 622 12,758 22,258 (792) (1,332) 18,832 52,346 770 53,116
Acquired non controlling Interest 1 64 – – (45) (64) (44) – (44)
Acquisitions – – – – – – – 218 218Issues of shares to minorities – – – – – – – 474 474Exchange rate movements – – – – (13) – (13) (23) (36)Sale to non controlling
interests – – (336) – 84 3,550 3,298 – 3,298 Issue of minority put options – – – – (7,345) – (7,345) – (7,345)Cancellation of minority put
options – – – – 203 15 218 – 218 Option exercise 2 – – – – (2) – – –Reclassification of share to
cash based option – – – – – (284) (284) – (284)
Reclassification of cash to share based option – – – – – 158 158 – 158
Share option charge – – – – – 517 517 – 517Dividends – – – – – (2,229) (2,229) (577) (2,806)Total comprehensive income
for the year – – – – 514 2,560 3,074 513 3,587
At 31 December 2010 625 12,822 21,922 (792) (7,934) 23,053 49,696 1,375 51,071Details of Other reserves can be found in note 14. The reclassification of share to cash based options is due to the Group paying cash equal to the employment tax payable and issuing a reduced number of shares on exercise of its employee share options. The reclassification of cash to share based options is due to a reclassification of share based options which had previously been held as a liability.
12
M&C SAATCHI PLC
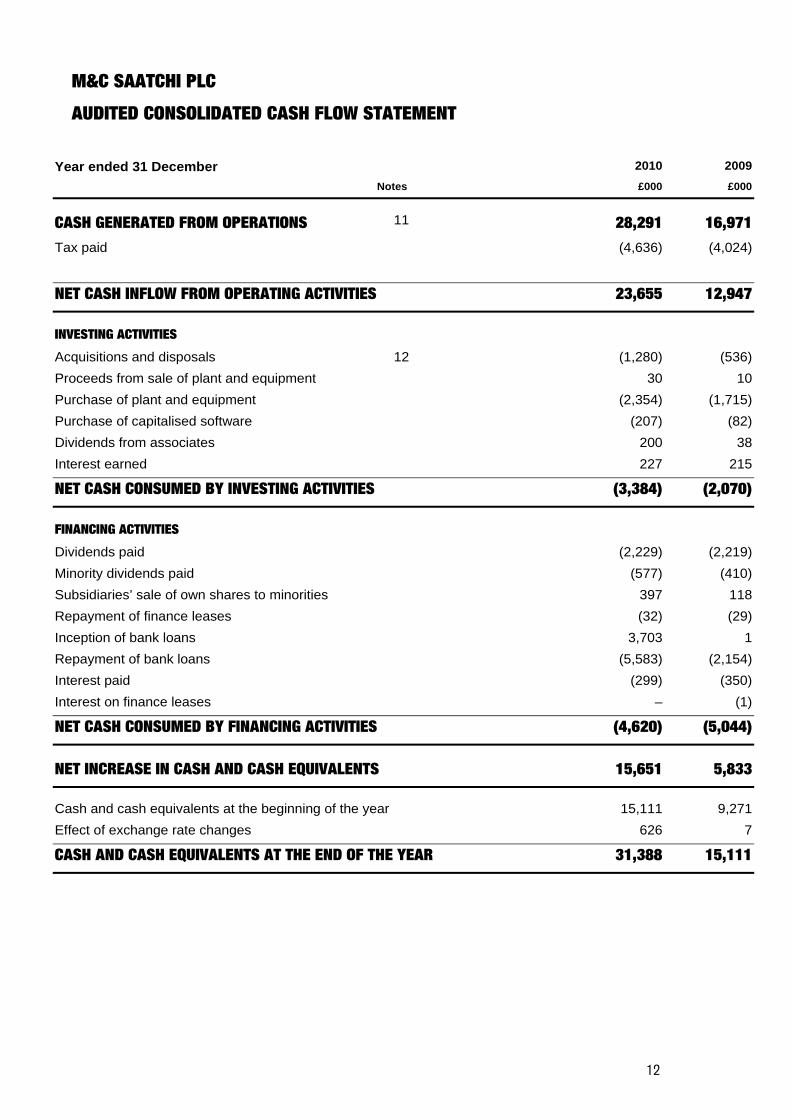
AUDITED CONSOLIDATED CASH FLOW STATEMENT
Year ended 31 December 2010 2009 Notes £000 £000
CASH GENERATED FROM OPERATIONS 11 28,291 16,971Tax paid
(4,636) (4,024)
NET CASH INFLOW FROM OPERATING ACTIVITIES 23,655 12,947
INVESTING ACTIVITIES
Acquisitions and disposals 12 (1,280) (536)Proceeds from sale of plant and equipment 30 10Purchase of plant and equipment (2,354) (1,715)Purchase of capitalised software (207) (82)Dividends from associates 200 38Interest earned 227 215
NET CASH CONSUMED BY INVESTING ACTIVITIES (3,384) (2,070)
FINANCING ACTIVITIES
Dividends paid (2,229) (2,219)Minority dividends paid (577) (410)Subsidiaries’ sale of own shares to minorities 397 118Repayment of finance leases (32) (29)Inception of bank loans 3,703 1Repayment of bank loans (5,583) (2,154)Interest paid (299) (350)Interest on finance leases – (1)
NET CASH CONSUMED BY FINANCING ACTIVITIES (4,620) (5,044)
NET INCREASE IN CASH AND CASH EQUIVALENTS 15,651 5,833
Cash and cash equivalents at the beginning of the year 15,111 9,271Effect of exchange rate changes 626 7
CASH AND CASH EQUIVALENTS AT THE END OF THE YEAR 31,388 15,111
M&C SAATCHI PLC NOTES TO THE PRELIMINARY STATEMENTS
YEAR ENDED 31 DECEMBER 2010
13
M&C SAATCHI PLC
NOTES TO THE PRELIMINARY STATEMENTS
YEAR ENDED 31 DECEMBER 2010
1. GENERAL INFORMATION
The Company is a public limited company incorporated and domiciled in the UK. The address of its registered office is 36 Golden Square, London W1F 9EE.
The Company has its primary listing on the AIM market of the London Stock Exchange.
These 2010 audited preliminary financial statements were approved for issue on 23 March 2011.
The financial information set out below does not constitute the company's statutory accounts for 2009 or 2010. Statutory accounts for the years ended 31 December 2009 and 31 December 2010 have been reported on by the Independent Auditors. The Independent Auditors' Reports on the Annual Report and Financial Statements for 2009 and 2010 were unqualified, did not draw attention to any matters by way of emphasis, and did not contain a statement under 498(2) or 498(3) of the Companies Act 2006.
Statutory accounts for the year ended 31 December 2009 have been filed with the Registrar of Companies. The statutory accounts for the year ended 31 December 2010 will be delivered to the Registrar in due course.
Headline results The directors believe that the headline results and headline earnings per share provide additional useful information on the underlying performance of the business. In addition, the headline results are used for internal performance management, the calculation of rewards in the Group’s Long Term Incentive Plan (LTIP) scheme and minority shareholder put option liabilities. The term headline is not a defined term in IFRS.
Our segmental reporting reflects our headline results in accordance with IFRS8.
The items that are excluded from headline results are the amortisation or impairment of intangible assets (including goodwill) acquired in business combinations, impairment of investment in associates, and fair value gains and losses on liabilities caused by our put and call option agreements.
M&C SAATCHI PLC NOTES TO THE PRELIMINARY STATEMENTS
YEAR ENDED 31 DECEMBER 2010
14
Basis of preparation The financial information set out in these preliminary results does not constitute the company's statutory accounts for 2009 or 2010. Statutory accounts for the years ended 31 December 2010 and 31 December 2009 have been reported on by the Independent Auditors. The Independent Auditors' Report on the Annual Report and Financial Statements for 2010 and 2009 was unqualified, did not draw attention to any matters by way of emphasis, and did not contain a statement under 498(2) or 498(3) of the Companies Act 2006. Statutory accounts for the year ended 31 December 2009 have been filed with the Registrar of Companies. The statutory accounts for the year ended 31 December 2010 will be delivered to the Registrar in due course.
2. ACCOUNTING POLICIES The financial information set out in these final results has been prepared using the recognition and measurement principles of International Accounting Standards, International Financial Reporting Standards and Interpretations adopted for use in the European Union (collectively Adopted IFRSs). The accounting policies adopted in these final results have been consistently applied to all the years presented and are consistent with the policies used in the preparation of the statutory accounts for the period ended 31 December 2010. The principal accounting policies adopted are unchanged from those used in the preparation of the statutory accounts for the period ended 31 December 2009, except as described below.
A number of new and amended standards become effective for periods beginning on or after 1 January 2010. The principal changes that are relevant to the Group are:
IFRS 3 Business Combinations (revised): apart from no longer capitalising acquisition expenses, there has been no effect on the reported results or previous financial position of the Group.
IAS 27 Consolidated and separate financial statements (as amended) has had no effect on the previous financial position of the Group. Acquisition and disposals without a change in control do not have an effect on the income statement. It has affected the reported results of the Group in the following ways:-
a) Non controlling interests. Where we have a loss making subsidiary with net liabilities, whose losses are funded by the Group, previously and as stated in 2009 results, 100% of those losses would be attributable to Equity holders of the Group. In 2010 the losses are shared between the Group and the non controlling interest, in proportion to the interests in the subsidiary. This change has resulted in the 2010 profits attributable to equity shareholders of the Group being £570k higher that they would have been under the old standard.
M&C SAATCHI PLC NOTES TO THE PRELIMINARY STATEMENTS
YEAR ENDED 31 DECEMBER 2010
15
b) Disposals of subsidiaries equity that do not affect control no longer affect the value of goodwill or create a profit / loss on disposal in the income statement. Proceeds less transfer to non controlling interests are credited directly to retained earnings. In the event that equity had previously been acquired under this revised standard then such a disposal will result in a release from non controlling interest acquired reserve to retained earnings. This change has resulted in the 2010 profits attributable to equity shareholders of the Group being £2,540k lower, and goodwill £757k higher that they would have been under the old standard.
c) Acquisitions of subsidiaries’ equity that do not affect control no longer change the value of goodwill. If a minority interest put option exists then the amount paid is provided by the minority shareholder put option liability, and its related minority interest put option reserve is taken to non controlling interest acquired reserve. If no minority interest put option exists then the amount paid is taken to non controlling interest acquired reserve. In both cases the share of net assets in non controlling interest reserve, is transferred to the non controlling interest acquired reserve. This change has no impact on the income statement, and has resulted in goodwill being £64k lower than it would have been under the old standard.
None of the other new standards and amendments affect the Group.
M&C SAATCHI PLC NOTES TO THE PRELIMINARY STATEMENTS
YEAR ENDED 31 DECEMBER 2010
16
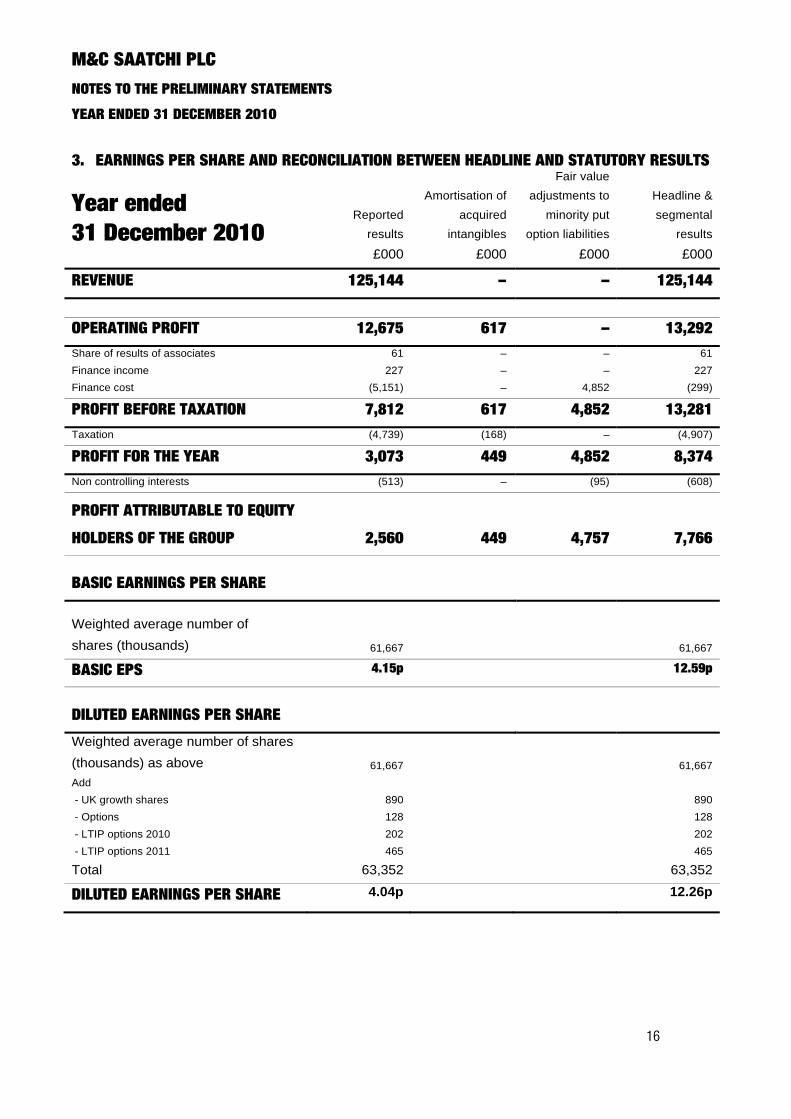
3. EARNINGS PER SHARE AND RECONCILIATION BETWEEN HEADLINE AND STATUTORY RESULTS
Year ended 31 December 2010
Reported results
Amortisation of acquired
intangibles
Fair value adjustments to
minority put option liabilities
Headline & segmental
results
£000 £000 £000 £000
REVENUE
125,144 – – 125,144
OPERATING PROFIT
12,675 617 – 13,292Share of results of associates 61 – – 61 Finance income
227 – – 227 Finance cost
(5,151) – 4,852 (299)
PROFIT BEFORE TAXATION
7,812 617 4,852 13,281Taxation
(4,739) (168) – (4,907)
PROFIT FOR THE YEAR
3,073 449 4,852 8,374Non controlling interests
(513) – (95) (608)
PROFIT ATTRIBUTABLE TO EQUITY
HOLDERS OF THE GROUP 2,560 449 4,757 7,766
BASIC EARNINGS PER SHARE
Weighted average number of shares (thousands)
61,667 61,667
BASIC EPS
4.15p 12.59p
DILUTED EARNINGS PER SHARE Weighted average number of shares (thousands) as above
61,667 61,667 Add
- UK growth shares
890 890 - Options
128 128 - LTIP options 2010
202 202 - LTIP options 2011
465 465
Total
63,352 63,352
DILUTED EARNINGS PER SHARE 4.04p 12.26p
M&C SAATCHI PLC NOTES TO THE PRELIMINARY STATEMENTS
YEAR ENDED 31 DECEMBER 2010
17
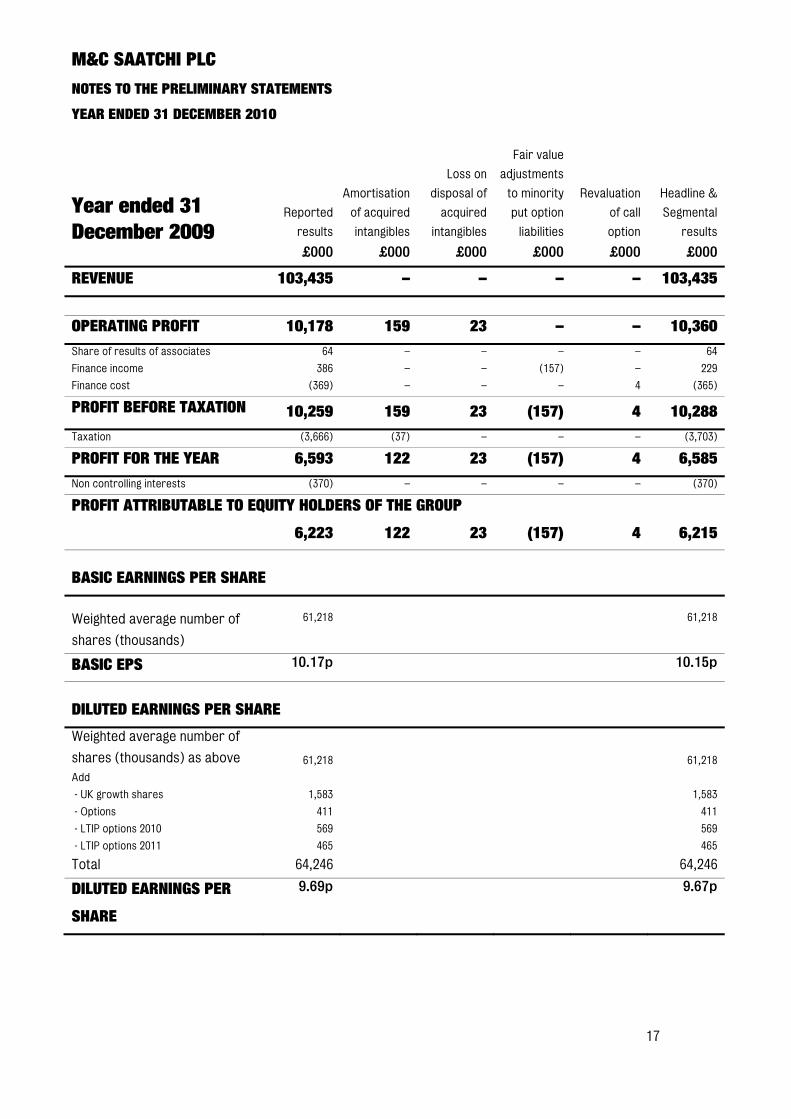
Year ended 31 December 2009
Reported
results
Amortisation
of acquired
intangibles
Loss on
disposal of
acquired
intangibles
Fair value
adjustments
to minority
put option
liabilities
Revaluation
of call
option
Headline &
Segmental
results
£000 £000 £000 £000 £000 £000
REVENUE
103,435 – – – – 103,435
OPERATING PROFIT
10,178 159 23 – – 10,360Share of results of associates 64 – – – – 64
Finance income
386 – – (157) – 229
Finance cost
(369) – – – 4 (365)
PROFIT BEFORE TAXATION
10,259 159 23 (157) 4 10,288Taxation
(3,666) (37) – – – (3,703)
PROFIT FOR THE YEAR
6,593 122 23 (157) 4 6,585Non controlling interests
(370) – – – – (370)
PROFIT ATTRIBUTABLE TO EQUITY HOLDERS OF THE GROUP
6,223 122 23 (157) 4 6,215
BASIC EARNINGS PER SHARE
Weighted average number of
shares (thousands)
61,218
61,218
BASIC EPS
10.17p 10.15p
DILUTED EARNINGS PER SHARE
Weighted average number of
shares (thousands) as above
61,218 61,218
Add
- UK growth shares
1,583 1,583
- Options
411 411
- LTIP options 2010
569 569
- LTIP options 2011
465 465
Total
64,246 64,246
DILUTED EARNINGS PER
SHARE
9.69p 9.67p
M&C SAATCHI PLC NOTES TO THE PRELIMINARY STATEMENTS
YEAR ENDED 31 DECEMBER 2010
18
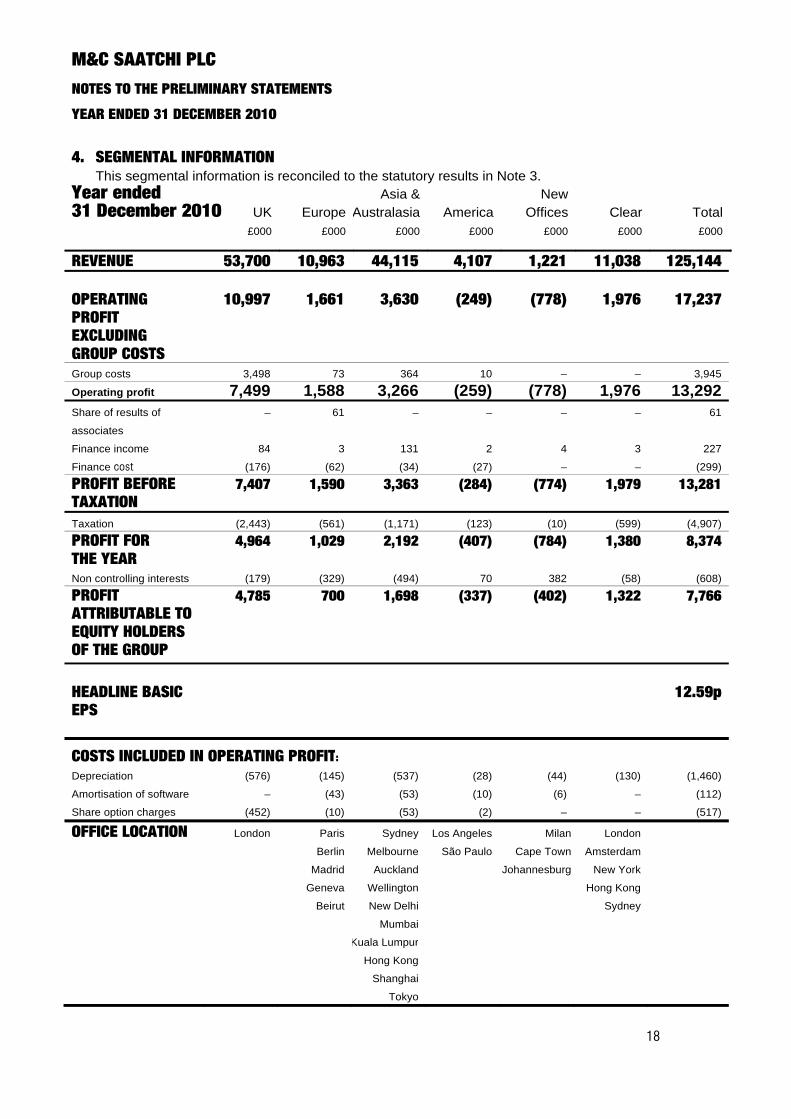
4. SEGMENTAL INFORMATION
This segmental information is reconciled to the statutory results in Note 3. Year ended 31 December 2010 UK Europe
Asia &Australasia America
New Offices Clear Total
£000 £000 £000 £000 £000 £000 £000
REVENUE 53,700 10,963 44,115 4,107 1,221 11,038 125,144 OPERATING PROFIT EXCLUDING GROUP COSTS
10,997 1,661 3,630 (249) (778) 1,976 17,237
Group costs 3,498 73 364 10 – – 3,945
Operating profit 7,499 1,588 3,266 (259) (778) 1,976 13,292
Share of results of
associates
– 61 – – – – 61
Finance income 84 3 131 2 4 3 227
Finance cost (176) (62) (34) (27) – – (299)
PROFIT BEFORE TAXATION
7,407 1,590 3,363 (284) (774) 1,979 13,281
Taxation (2,443) (561) (1,171) (123) (10) (599) (4,907)
PROFIT FOR THE YEAR
4,964 1,029 2,192 (407) (784) 1,380 8,374
Non controlling interests (179) (329) (494) 70 382 (58) (608)
PROFIT ATTRIBUTABLE TO EQUITY HOLDERS OF THE GROUP
4,785 700 1,698 (337) (402) 1,322 7,766
HEADLINE BASIC EPS
12.59p
COSTS INCLUDED IN OPERATING PROFIT:
Depreciation (576) (145) (537) (28) (44) (130) (1,460)
Amortisation of software – (43) (53) (10) (6) – (112)
Share option charges (452) (10) (53) (2) – – (517)
OFFICE LOCATION London Paris
Berlin
Madrid
Geneva
Beirut
Sydney
Melbourne
Auckland
Wellington
New Delhi
Mumbai
Kuala Lumpur
Hong Kong
Shanghai
Tokyo
Los Angeles
São Paulo
Milan
Cape Town
Johannesburg
London
Amsterdam
New York
Hong Kong
Sydney
M&C SAATCHI PLC NOTES TO THE PRELIMINARY STATEMENTS
YEAR ENDED 31 DECEMBER 2010
19
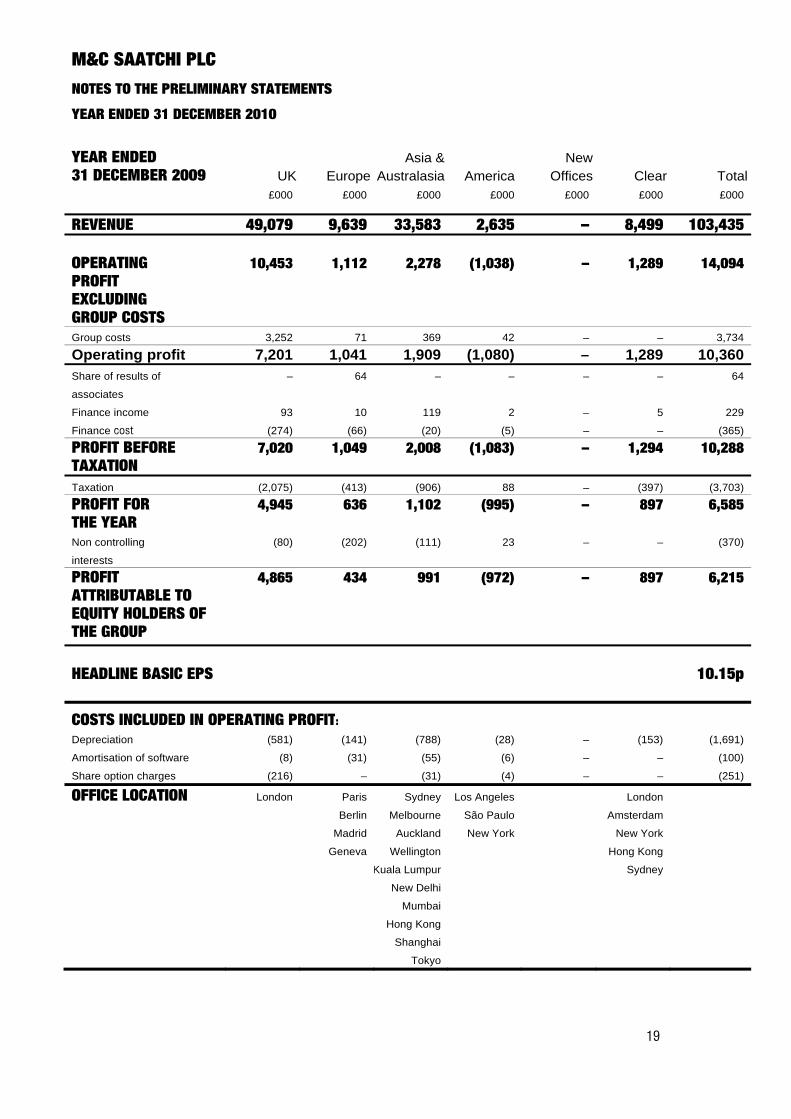
YEAR ENDED 31 DECEMBER 2009 UK Europe
Asia & Australasia America
New Offices Clear Total
£000 £000 £000 £000 £000 £000 £000
REVENUE 49,079 9,639 33,583 2,635 – 8,499 103,435 OPERATING PROFIT EXCLUDING GROUP COSTS
10,453 1,112 2,278 (1,038) – 1,289 14,094
Group costs 3,252 71 369 42 – – 3,734
Operating profit 7,201 1,041 1,909 (1,080) – 1,289 10,360
Share of results of
associates
– 64 – – – – 64
Finance income 93 10 119 2 – 5 229
Finance cost (274) (66) (20) (5) – – (365)
PROFIT BEFORE TAXATION
7,020 1,049 2,008 (1,083) – 1,294 10,288
Taxation (2,075) (413) (906) 88 – (397) (3,703)
PROFIT FOR THE YEAR
4,945 636 1,102 (995) – 897 6,585
Non controlling
interests
(80) (202) (111) 23 – – (370)
PROFIT ATTRIBUTABLE TO EQUITY HOLDERS OF THE GROUP
4,865 434 991 (972) – 897 6,215
HEADLINE BASIC EPS 10.15p
COSTS INCLUDED IN OPERATING PROFIT:
Depreciation (581) (141) (788) (28) – (153) (1,691)
Amortisation of software (8) (31) (55) (6) – – (100)
Share option charges (216) – (31) (4) – – (251)
OFFICE LOCATION London Paris
Berlin
Madrid
Geneva
Sydney
Melbourne
Auckland
Wellington
Kuala Lumpur
New Delhi
Mumbai
Hong Kong
Shanghai
Tokyo
Los Angeles
São Paulo
New York
London
Amsterdam
New York
Hong Kong
Sydney
M&C SAATCHI PLC NOTES TO THE PRELIMINARY STATEMENTS
YEAR ENDED 31 DECEMBER 2010
20
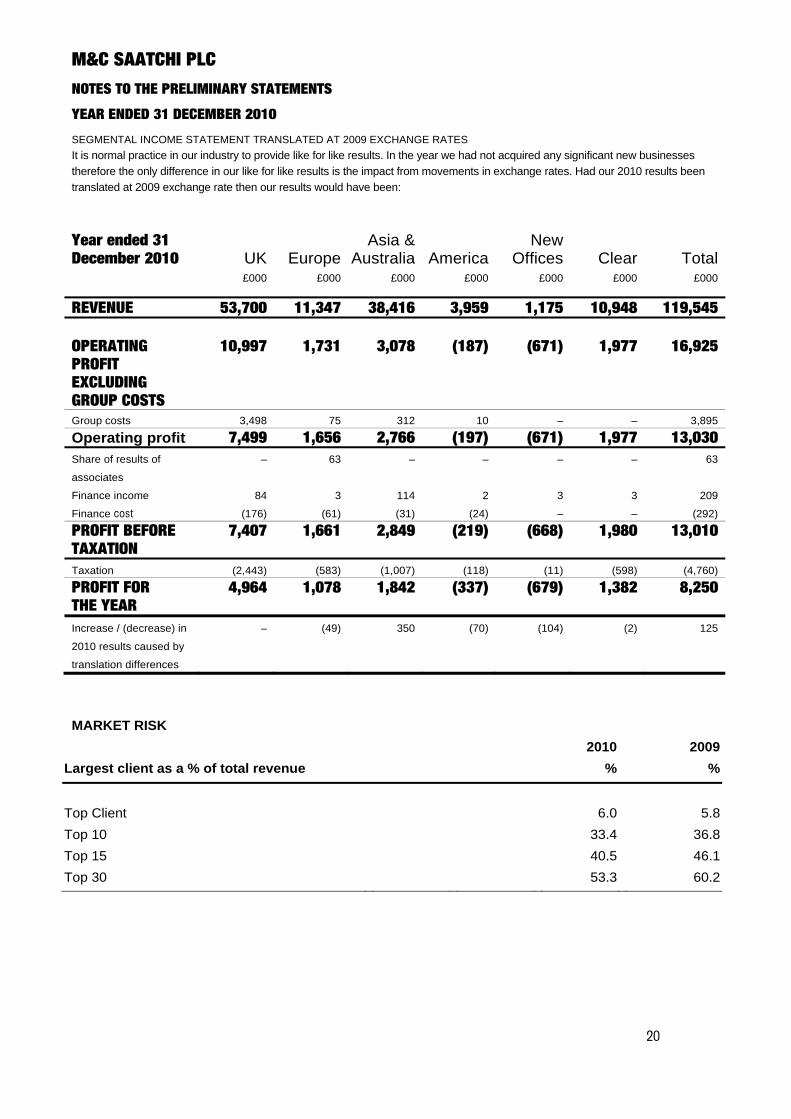
SEGMENTAL INCOME STATEMENT TRANSLATED AT 2009 EXCHANGE RATES It is normal practice in our industry to provide like for like results. In the year we had not acquired any significant new businesses therefore the only difference in our like for like results is the impact from movements in exchange rates. Had our 2010 results been translated at 2009 exchange rate then our results would have been:
Year ended 31 December 2010 UK Europe
Asia & Australia America
New Offices Clear Total
£000 £000 £000 £000 £000 £000 £000
REVENUE 53,700 11,347 38,416 3,959 1,175 10,948 119,545 OPERATING PROFIT EXCLUDING GROUP COSTS
10,997 1,731 3,078 (187) (671) 1,977 16,925
Group costs 3,498 75 312 10 – – 3,895
Operating profit 7,499 1,656 2,766 (197) (671) 1,977 13,030Share of results of
associates
– 63 – – – – 63
Finance income 84 3 114 2 3 3 209
Finance cost (176) (61) (31) (24) – – (292)
PROFIT BEFORE TAXATION
7,407 1,661 2,849 (219) (668) 1,980 13,010
Taxation (2,443) (583) (1,007) (118) (11) (598) (4,760)
PROFIT FOR THE YEAR
4,964 1,078 1,842 (337) (679) 1,382 8,250
Increase / (decrease) in
2010 results caused by
translation differences
– (49) 350 (70) (104) (2) 125
MARKET RISK
2010 2009Largest client as a % of total revenue % %
Top Client 6.0 5.8Top 10 33.4 36.8Top 15 40.5 46.1Top 30 53.3 60.2
M&C SAATCHI PLC NOTES TO THE PRELIMINARY STATEMENTS
YEAR ENDED 31 DECEMBER 2010
21
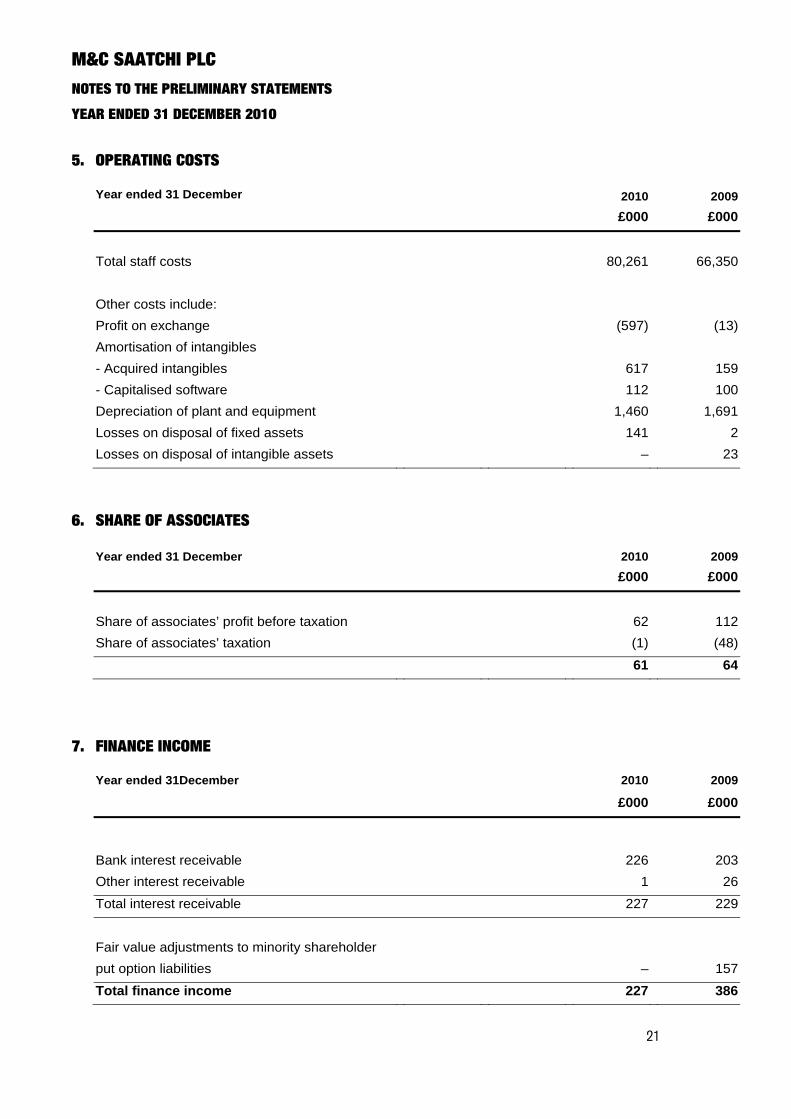
5. OPERATING COSTS Year ended 31 December 2010 2009 £000 £000
Total staff costs 80,261 66,350 Other costs include: Profit on exchange (597) (13)Amortisation of intangibles - Acquired intangibles 617 159- Capitalised software 112 100Depreciation of plant and equipment 1,460 1,691Losses on disposal of fixed assets 141 2Losses on disposal of intangible assets – 23
6. SHARE OF ASSOCIATES Year ended 31 December 2010 2009 £000 £000
Share of associates’ profit before taxation 62 112Share of associates’ taxation (1) (48)
61 64
7. FINANCE INCOME Year ended 31December 2010 2009
£000 £000
Bank interest receivable 226 203Other interest receivable 1 26Total interest receivable 227 229 Fair value adjustments to minority shareholder put option liabilities
– 157
Total finance income 227 386
M&C SAATCHI PLC NOTES TO THE PRELIMINARY STATEMENTS
YEAR ENDED 31 DECEMBER 2010
22
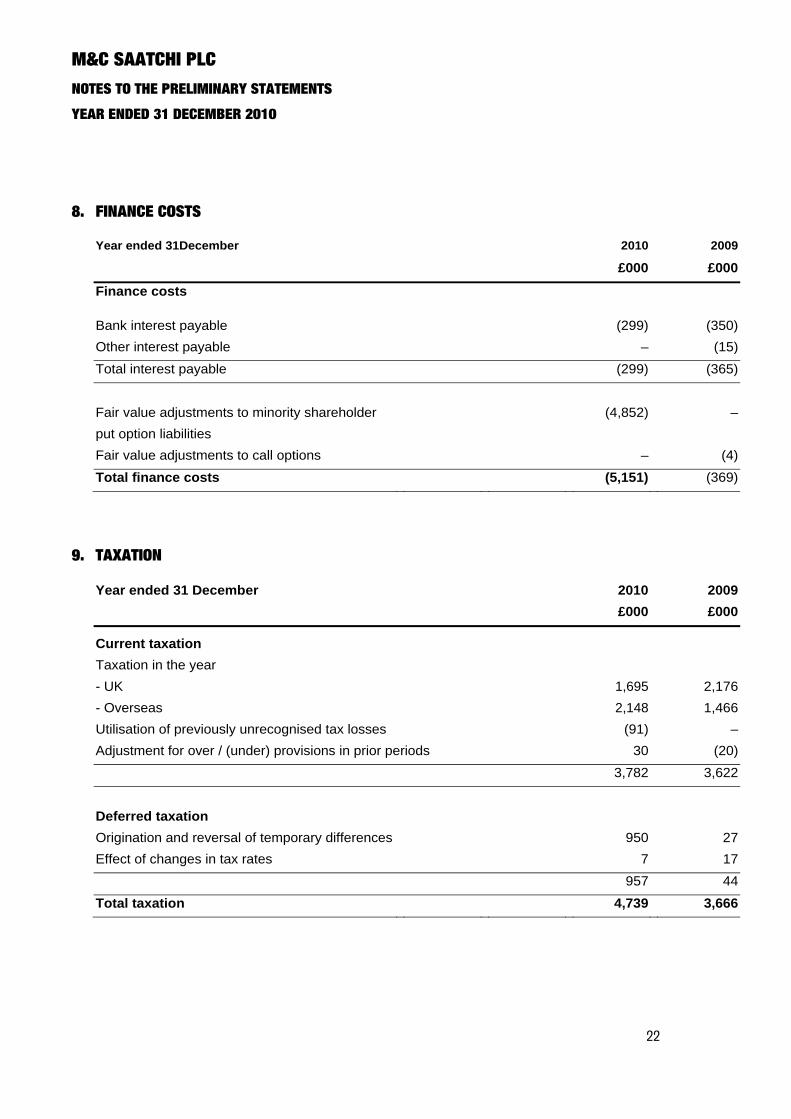
8. FINANCE COSTS
Year ended 31December 2010 2009
£000 £000
Finance costs
Bank interest payable (299) (350)Other interest payable – (15)Total interest payable (299) (365) Fair value adjustments to minority shareholder put option liabilities
(4,852) –
Fair value adjustments to call options – (4)
Total finance costs (5,151) (369)
9. TAXATION
Year ended 31 December 2010 2009 £000 £000
Current taxation Taxation in the year - UK 1,695 2,176- Overseas 2,148 1,466Utilisation of previously unrecognised tax losses (91) –Adjustment for over / (under) provisions in prior periods 30 (20) 3,782 3,622 Deferred taxation Origination and reversal of temporary differences 950 27Effect of changes in tax rates 7 17 957 44
Total taxation 4,739 3,666
M&C SAATCHI PLC NOTES TO THE PRELIMINARY STATEMENTS
YEAR ENDED 31 DECEMBER 2010
23
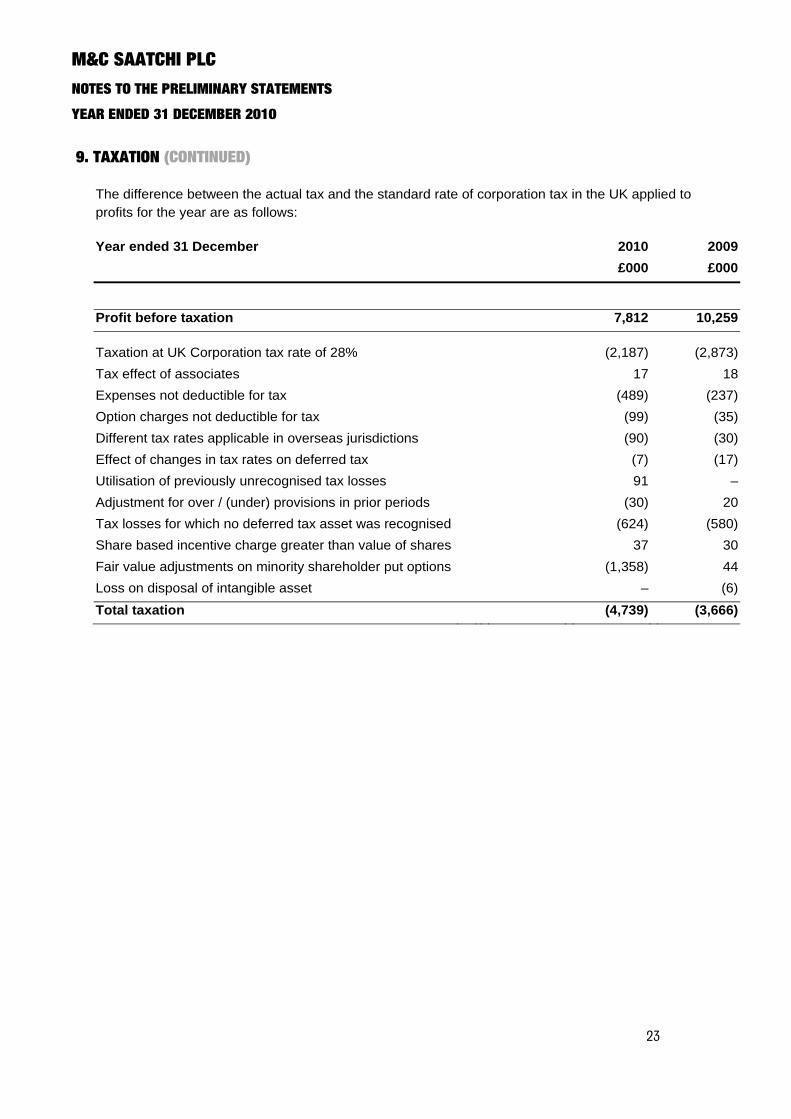
9. TAXATION (CONTINUED)
The difference between the actual tax and the standard rate of corporation tax in the UK applied to profits for the year are as follows: Year ended 31 December 2010 2009 £000 £000
Profit before taxation 7,812 10,259
Taxation at UK Corporation tax rate of 28% (2,187) (2,873)Tax effect of associates 17 18Expenses not deductible for tax (489) (237)Option charges not deductible for tax (99) (35)Different tax rates applicable in overseas jurisdictions (90) (30)Effect of changes in tax rates on deferred tax (7) (17)Utilisation of previously unrecognised tax losses 91 –Adjustment for over / (under) provisions in prior periods (30) 20Tax losses for which no deferred tax asset was recognised (624) (580)Share based incentive charge greater than value of shares 37 30Fair value adjustments on minority shareholder put options (1,358) 44Loss on disposal of intangible asset – (6)Total taxation (4,739) (3,666)
M&C SAATCHI PLC NOTES TO THE PRELIMINARY STATEMENTS
YEAR ENDED 31 DECEMBER 2010
24
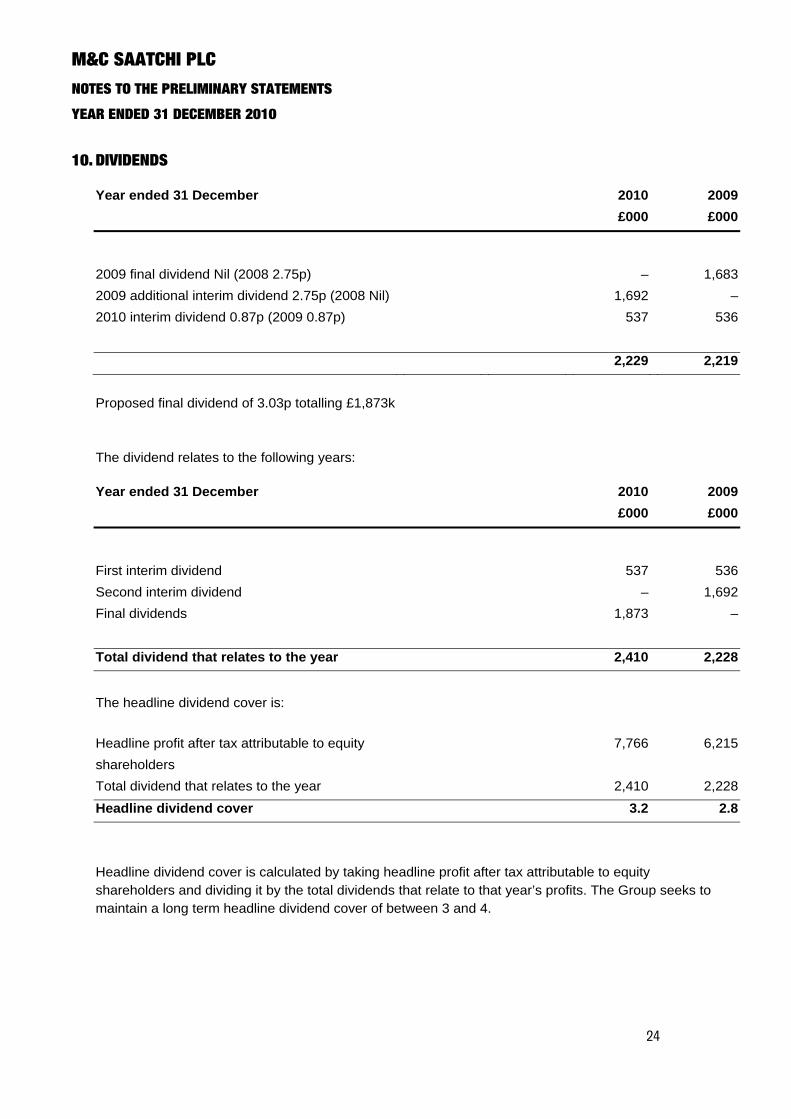
10. DIVIDENDS
Year ended 31 December 2010 2009 £000 £000
2009 final dividend Nil (2008 2.75p) – 1,6832009 additional interim dividend 2.75p (2008 Nil) 1,692 –2010 interim dividend 0.87p (2009 0.87p) 537 536
2,229 2,219
Proposed final dividend of 3.03p totalling £1,873k The dividend relates to the following years: Year ended 31 December 2010 2009 £000 £000
First interim dividend 537 536Second interim dividend – 1,692Final dividends 1,873 –
Total dividend that relates to the year 2,410 2,228
The headline dividend cover is: Headline profit after tax attributable to equity shareholders
7,766 6,215
Total dividend that relates to the year 2,410 2,228
Headline dividend cover 3.2 2.8
Headline dividend cover is calculated by taking headline profit after tax attributable to equity shareholders and dividing it by the total dividends that relate to that year’s profits. The Group seeks to maintain a long term headline dividend cover of between 3 and 4.
M&C SAATCHI PLC NOTES TO THE PRELIMINARY STATEMENTS
YEAR ENDED 31 DECEMBER 2010
25
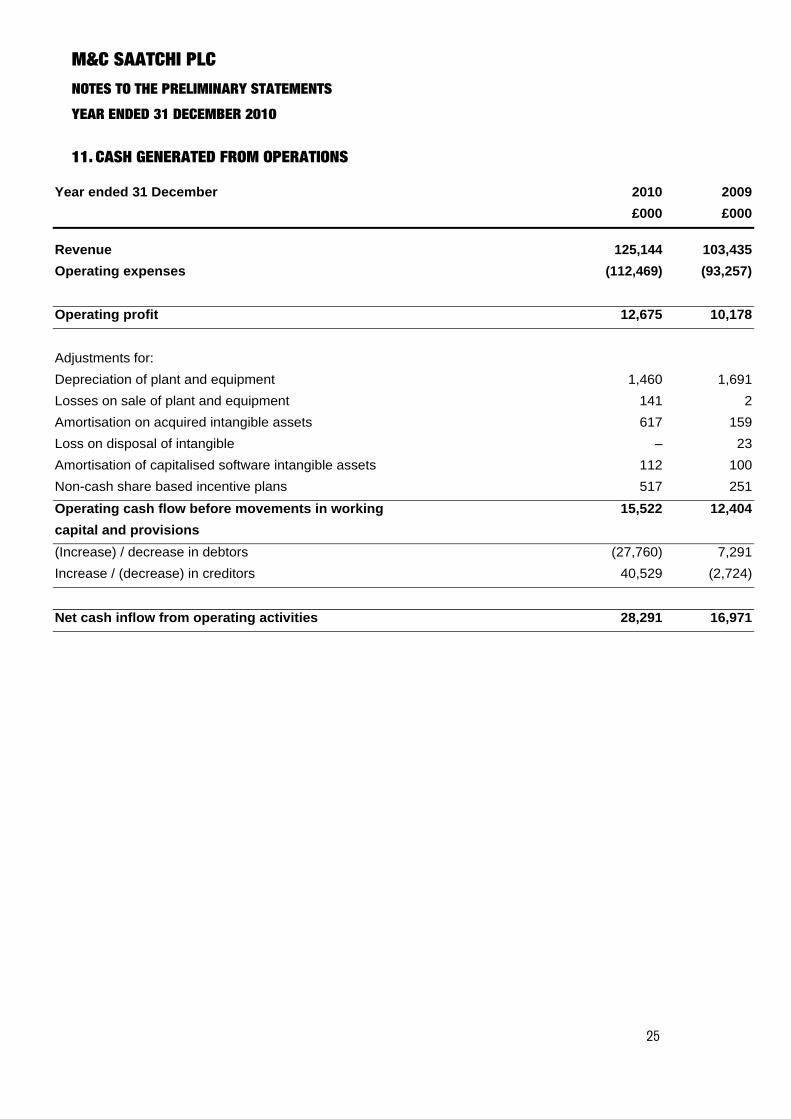
11. CASH GENERATED FROM OPERATIONS
Year ended 31 December 2010 2009 £000 £000
Revenue 125,144 103,435Operating expenses (112,469) (93,257) Operating profit 12,675 10,178 Adjustments for: Depreciation of plant and equipment 1,460 1,691Losses on sale of plant and equipment 141 2Amortisation on acquired intangible assets 617 159Loss on disposal of intangible – 23Amortisation of capitalised software intangible assets 112 100Non-cash share based incentive plans 517 251
Operating cash flow before movements in working capital and provisions
15,522 12,404
(Increase) / decrease in debtors (27,760) 7,291Increase / (decrease) in creditors 40,529 (2,724) Net cash inflow from operating activities 28,291 16,971
M&C SAATCHI PLC NOTES TO THE PRELIMINARY STATEMENTS
YEAR ENDED 31 DECEMBER 2010
26
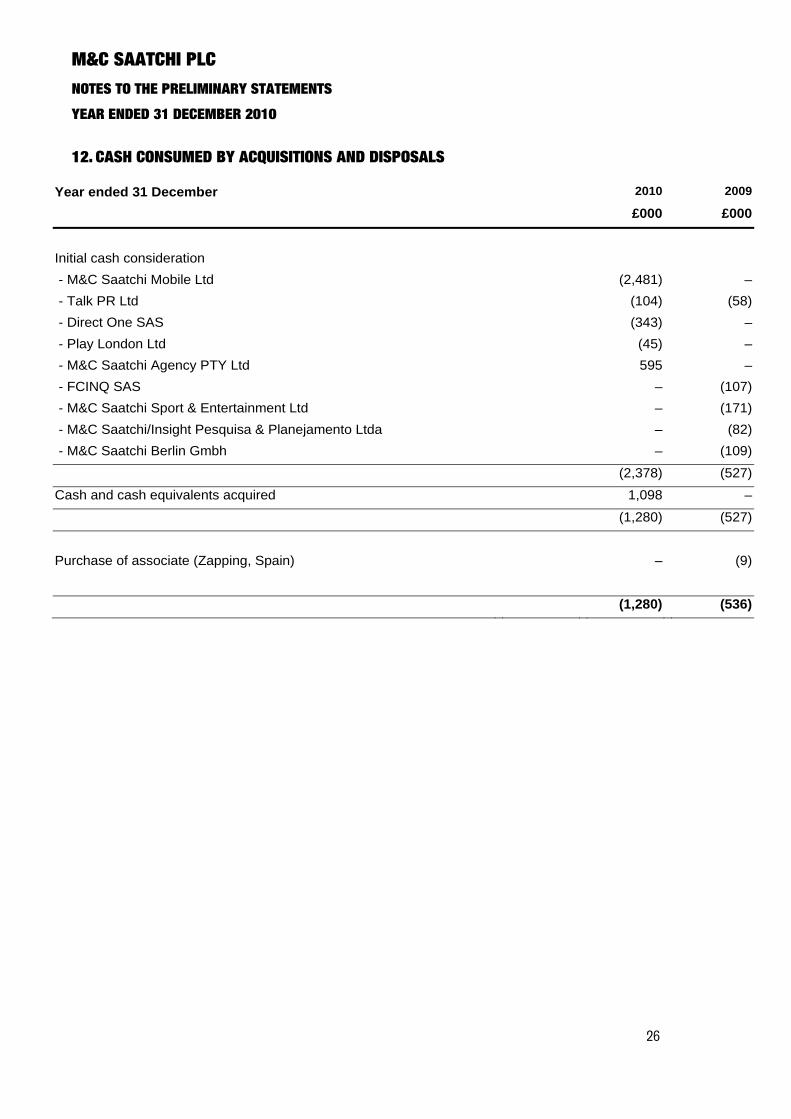
12. CASH CONSUMED BY ACQUISITIONS AND DISPOSALS
Year ended 31 December 2010 2009
£000 £000
Initial cash consideration - M&C Saatchi Mobile Ltd (2,481) – - Talk PR Ltd (104) (58) - Direct One SAS (343) – - Play London Ltd (45) – - M&C Saatchi Agency PTY Ltd 595 – - FCINQ SAS – (107) - M&C Saatchi Sport & Entertainment Ltd – (171) - M&C Saatchi/Insight Pesquisa & Planejamento Ltda – (82) - M&C Saatchi Berlin Gmbh – (109) (2,378) (527)Cash and cash equivalents acquired 1,098 – (1,280) (527) Purchase of associate (Zapping, Spain) – (9) (1,280) (536)
M&C SAATCHI PLC NOTES TO THE PRELIMINARY STATEMENTS
YEAR ENDED 31 DECEMBER 2010
27
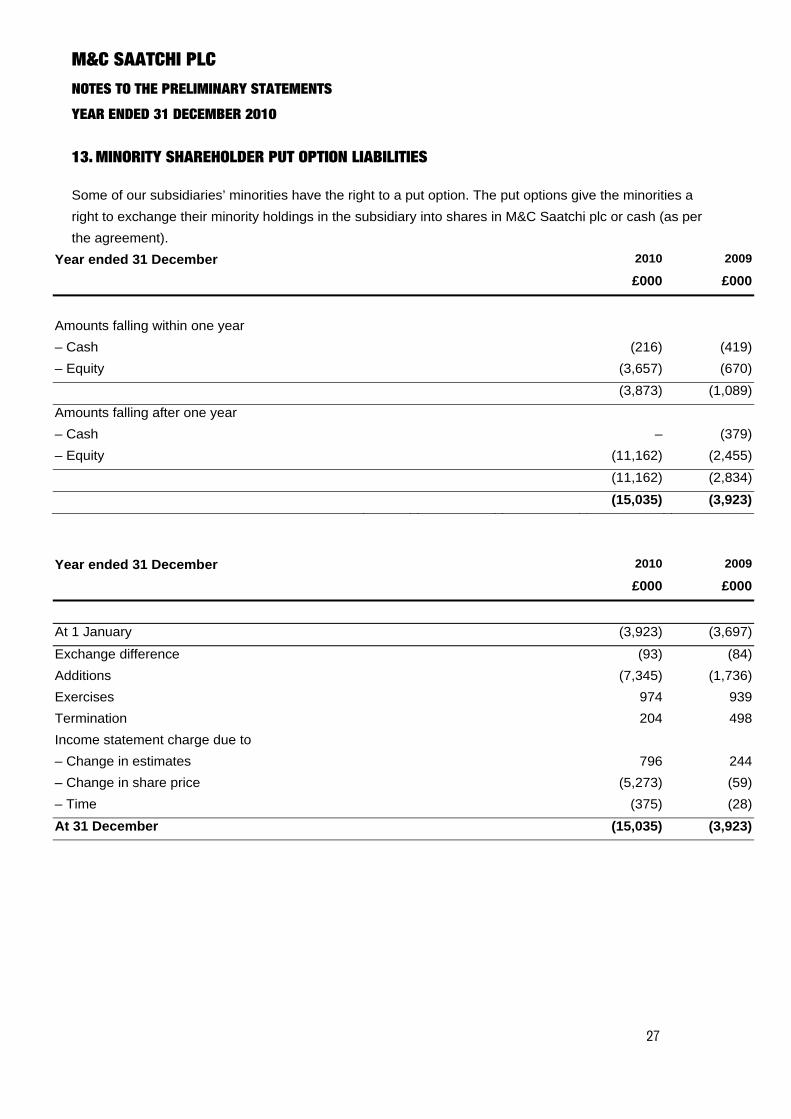
13. MINORITY SHAREHOLDER PUT OPTION LIABILITIES Some of our subsidiaries’ minorities have the right to a put option. The put options give the minorities a right to exchange their minority holdings in the subsidiary into shares in M&C Saatchi plc or cash (as per the agreement).
Year ended 31 December 2010 2009
£000 £000
Amounts falling within one year – Cash (216) (419)– Equity (3,657) (670) (3,873) (1,089)Amounts falling after one year – Cash – (379)– Equity (11,162) (2,455) (11,162) (2,834)
(15,035) (3,923)
Year ended 31 December 2010 2009
£000 £000
At 1 January (3,923) (3,697)
Exchange difference (93) (84)Additions (7,345) (1,736)Exercises 974 939Termination 204 498Income statement charge due to – Change in estimates 796 244– Change in share price (5,273) (59)– Time (375) (28)At 31 December (15,035) (3,923)
M&C SAATCHI PLC NOTES TO THE PRELIMINARY STATEMENTS
YEAR ENDED 31 DECEMBER 2010
28
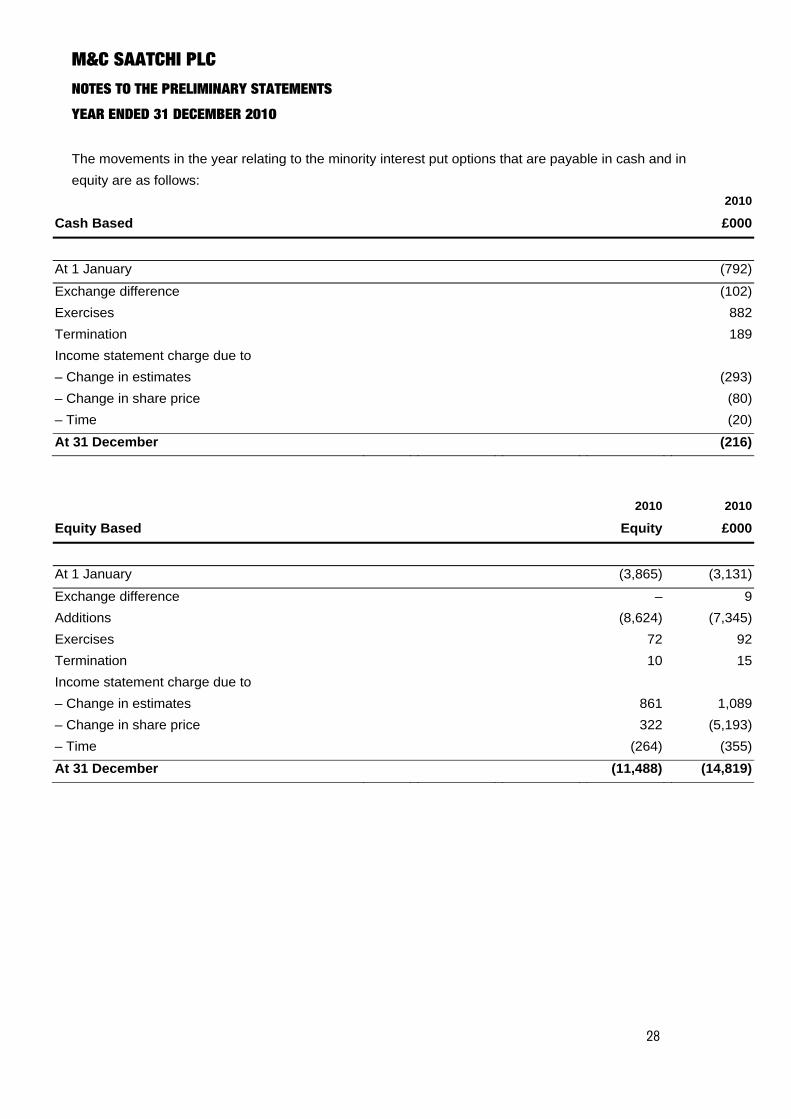
The movements in the year relating to the minority interest put options that are payable in cash and in equity are as follows:
2010
Cash Based £000
At 1 January (792)
Exchange difference (102)Exercises 882Termination 189Income statement charge due to – Change in estimates (293)– Change in share price (80)– Time (20)
At 31 December (216)
2010 2010
Equity Based Equity £000
At 1 January (3,865) (3,131)
Exchange difference – 9Additions (8,624) (7,345)Exercises 72 92Termination 10 15Income statement charge due to – Change in estimates 861 1,089– Change in share price 322 (5,193)– Time (264) (355)
At 31 December (11,488) (14,819)
M&C SAATCHI PLC NOTES TO THE PRELIMINARY STATEMENTS
YEAR ENDED 31 DECEMBER 2010
29
Company
Country of incorporation
Put options are exercisable from
% of Company shares
exchangeable
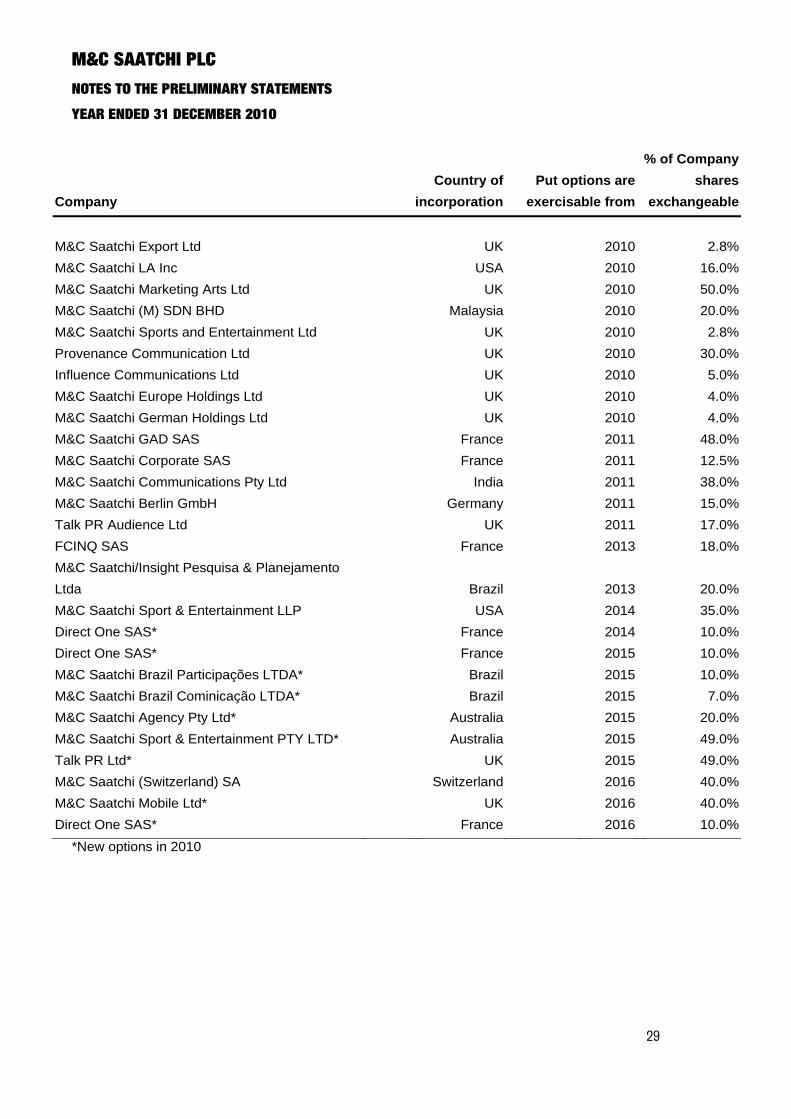
M&C Saatchi Export Ltd UK 2010 2.8%M&C Saatchi LA Inc USA 2010 16.0%M&C Saatchi Marketing Arts Ltd UK 2010 50.0%M&C Saatchi (M) SDN BHD Malaysia 2010 20.0%M&C Saatchi Sports and Entertainment Ltd UK 2010 2.8%Provenance Communication Ltd UK 2010 30.0%Influence Communications Ltd UK 2010 5.0%M&C Saatchi Europe Holdings Ltd UK 2010 4.0%M&C Saatchi German Holdings Ltd UK 2010 4.0%M&C Saatchi GAD SAS France 2011 48.0%M&C Saatchi Corporate SAS France 2011 12.5%M&C Saatchi Communications Pty Ltd India 2011 38.0%M&C Saatchi Berlin GmbH Germany 2011 15.0%Talk PR Audience Ltd UK 2011 17.0%FCINQ SAS France 2013 18.0%M&C Saatchi/Insight Pesquisa & Planejamento Ltda
Brazil
2013
20.0%
M&C Saatchi Sport & Entertainment LLP USA 2014 35.0%Direct One SAS* France 2014 10.0%Direct One SAS* France 2015 10.0%M&C Saatchi Brazil Participações LTDA* Brazil 2015 10.0%M&C Saatchi Brazil Cominicação LTDA* Brazil 2015 7.0%M&C Saatchi Agency Pty Ltd* Australia 2015 20.0%M&C Saatchi Sport & Entertainment PTY LTD* Australia 2015 49.0%Talk PR Ltd* UK 2015 49.0%M&C Saatchi (Switzerland) SA Switzerland 2016 40.0%M&C Saatchi Mobile Ltd* UK 2016 40.0%Direct One SAS* France 2016 10.0%
*New options in 2010

M&C SAATCHI PLC NOTES TO THE PRELIMINARY STATEMENTS
YEAR ENDED 31 DECEMBER 2010
30
14. OTHER RESERVES
MI Put Option Reserve
£000
Non Controlling Interest
Acquired£000
Foreign exchange
reserve £000
Total£000
AT 1 JANUARY 2009 (4,463) – 2,249 (2,214)
Exchange rate movements (10) – – (10)Exercise of minority put options 401 – – 401Issue of minority put options (1,737) – – (1,737)Cancellation of minority put options 2,329 – – 2,329
Total comprehensive income for the year – – (101) (101)AT 1 JANUARY 2010 (3,480) – 2,148 (1,332) Acquired non controlling interest 169 (214) – (45)Exchange rate movements (13) – – (13)Sale to non controlling interests – 84 – 84Issue of minority put options (7,345) – – (7,345)Cancellation of minority put options 203 – – 203Total comprehensive income for the year – – 514 514AT 31 DECEMBER 2010 (10,466) (130) 2,662 (7,934)