Embed Size (px)
Citation preview
MBS ratings and the mortgage credit boom
Adam Ashcraft* Federal Reserve Bank of New York
Paul Goldsmith-Pinkham
Harvard University
James Vickery Federal Reserve Bank of New York*
First version: January 25, 2009 This version: February 17, 2010
Abstract
We study credit ratings on subprime and Alt-A mortgage-backed securities (MBS) deals issued between 2001 and 2007, the period leading up to the subprime crisis. Ratings are found to be correlated with ex-ante credit risk, and with subsequent deal performance, suggesting they contain useful information for investors. However, controlling for risk, we also find evidence of significant time-variation in credit ratings, with ratings becoming progressively less conservative around the MBS market peak between 2005-07. Deals with higher-risk mortgages, measured by a simple model, perform poorly relative to their rating over the entire sample, whether performance is measured as mortgage default rates, losses or rating downgrades. MBS deals with opaque characteristics, in particular with a high concentration of low-documentation mortgages, also underperform their rating, consistent with the predictions of recent theoretical literature.
* Email: [email protected]; [email protected]; [email protected]. For valuable comments and feedback, we thank Effi Benmelech, Richard Cantor, Joshua Coval, Jerry Fons, Amit Seru, Joel Shapiro, Charles Trzcinka, Paolo Volpin and Nancy Wallace, as well as seminar participants at the 2010 AEA meetings, NYU Stern / New York Fed Financial Intermediation conference, the FDIC Annual Reserch Conference, Securities and Exchange Commission, Gerzensee EESFM Corporate Finance meetings, AsRES-AREUEA Joint International Real Estate Conference, NBER Summer Institute, 5th ETS Conference on Financial Markets, WFA Real Estate Symposium, Universidad Carlos III, Chicago Fed Bank Structure Conference, Notre Dame Conference on Securities Market Regulation, Rutgers Economics Department, DePaul University Finance Department and the New York Fed. We also thank Scott Nelson for outstanding research assistance. Views expressed in this paper are those of the authors, and do not reflect the opinions of the Federal Reserve Bank of New York or the Federal Reserve System.
1
Mistakes by credit rating agencies (CRAs) are often cited as one of the causes of the recent financial
crisis, which began with a surge in subprime mortgage defaults in 2007 and 2008. Prior to the crisis, 80-
95% of a typical subprime or Alt-A mortgage-backed-securities (MBS) deal was assigned the highest
possible triple-A rating, making these securities attractive to a wide range of domestic and foreign
investors. Reflecting recent mortgage defaults, however, many MBS originally rated investment-grade
now trade significantly below par, and have experienced large rating downgrades and even losses. Figure
1 plots net rating downgrades on subprime and Alt-A MBS issued since 2001. While rating revisions are
modest for bonds issued early in this period, securities issued since 2005 have experienced historically
large downgrades since issuance, by an average of 3-10 rating notches depending on the vintage.
[INSERT FIGURE 1 HERE]
Critics interpret these facts as evidence of important flaws in the credit rating process, either due
to incentive problems associated with the “issuer-pays” rating model, or simply insufficient diligence or
competence (e.g. White, 2009; Fons, 2008; Coval, Jurek and Stafford, 2009).1 In their defense however,
rating agencies argue that the poor recent performance of MBS ratings primarily reflects a series of large,
unexpected shocks, including unprecedented declines in home prices and a sharp contraction in mortgage
credit supply. These events, while not fully anticipated by rating agencies, were also not predicted by
most other market participants. CRAs also point to warnings made by them before the crisis about
increasing levels of credit risk in the subprime MBS market, and argue that their credit ratings became
accordingly more conservative to reflect this greater risk.2
1 For example, Jerry Fons, a former Moody’s executive, argues in Congressional testimony that “My view is that a large part of the blame can be placed on the inherent conflicts of interest found in the issuer-pays business model and rating shopping by issuers of structured securities. A drive to maintain or expand market share made the rating agencies willing participants in this shopping spree. It was also relatively easy for the major banks to play the agencies off one another because of the opacity of the structured transactions and the high potential fees earned by the winning agency.” (Fons, 2008). 2 In Senate testimony, Michael Kanef, Structured Finance Group Managing Director of Moody’s, states: “In response to the increase in the riskiness of loans made during the last few years and the changing economic environment, Moody’s steadily increased its loss expectations and subsequent levels of credit protection on pools of subprime loans. Our loss expectations and enhancement levels rose by about 30% over the 2003 to 2006 time period.” and also that “We provided early warnings to the market, commenting frequently and pointedly over an extended period on the deterioration in origination standards and inflated housing prices.” (Kanef, 2007). Kanef cites aggressive underwriting standards, a decline in national home prices, and a worsening of mortgage credit

2
In light of this debate, the goal of our paper is to analyze the quality of credit ratings on subprime
and Alt-A MBS securities issued between 2001 and 2007, the period leading up to the crisis. According to
CRAs, credit ratings represent an objective opinion of the relative default risk of a fixed-income security.
Ratings have a consistent meaning regardless of the type of security being rated, or the time the rating
opinion is issued. (See Section 1 for a more detailed discussion). Motivated by these statements, we
investigate how well MBS ratings summarize risks to investors, and whether these ratings do indeed have
a consistent interpretation both through time and across different types of deals. First, we study whether
rating standards appear stable over the sample. Second, we investigate whether ratings efficiently
incorporate the information set available to the CRA at the time the deal was rated.
Our empirical work is based on a novel dataset of 3,144 MBS deals, combined with security-level
and loan-level data. This data includes information on nearly 60,000 securities, and 12.1m individual
loans, representing around 90% of new issuance over this seven year period. The main unit of analysis in
our analysis is an MBS deal, which is a set of bonds linked to on or more pools of residential mortgages.
MBS from a deal differ according to their seniority. More senior bonds are relatively safer, since they
have an earlier claim on payments of mortgage principal, while losses due to mortgage defaults are first
applied to more junior bonds. Credit ratings for a deal are generally quoted in terms of the “subordination
level” or “attachment point” of each rating class, which is the fraction of the deal that is junior to that
class.3 Other things equal, higher subordination implies the deal is rated more conservatively.
The first part of our analysis studies time-series fluctuations in rating standards. Unconditionally
(not adjusting for risk), we document that average subprime subordination levels increase significantly
conditions as the main causes for the poor performance of recent subprime vintages (p.14), and states that “Along with most other market participants, however, we did not anticipate the magnitude and speed of the deterioration in mortgage quality (particularly for certain originators) or the rapid transition to restrictive lending.” (p.17). Devan Sharma, President of Standard and Poors (S&P), also highlights the extreme nature of the events that occurred, writing: “Why did these ratings on mortgage-backed securities perform poorly? Put simply, our assumptions about the housing and mortgage markets in the second half of this decade did not account for the extraordinarily steep declines we have now seen. Although we did assume, based on historical data stretching back to the Great Depression, that these markets would decline to some degree, we and virtually every other market participant and observer did not expect the unprecedented events that occurred. (Sharma, 2009). 3 For example, if a deal consists of $1bn of underlying mortgages, but only the most senior $850m of bonds are rated AAA, the subordination level below AAA is 15%. In this example, the deal could suffer a 15% loss rate amongst the underlying loans without resulting in a loss of principal for the AAA bondholders.
3
over the first part of our sample (2001-04), and then are relatively flat between the start of 2005 and mid-
2007, the period corresponding to the period of peak MBS deal flow. A similar pattern, albeit less
pronounced, is evident for Alt-A deals.
We then estimate a simple model of the relationship between subordination, mortgage credit risk
and other forms of credit enhancement, and study changes in subordination conditional on the model’s
predictions. That is, we study residual changes in subordination after controlling for risk. As expected,
predicted subordination is increasing with a summary measure of default risk on the loans underlying the
deal, and decreasing in the strength of other forms of credit enhancement, such as bond insurance. We
find that, while unconditional subordination remains fairly flat between 2005-07, subordination
conditional on risk as measured by the model declines significantly over the same period. In other words,
average measured riskiness of MBS deals increases significantly over this 2½ year period, but
subordination levels do not become correspondingly more conservative to reflect this greater risk.
Quantitatively, our estimates suggest that between early 2005 and mid-2007, risk-adjusted AAA
subordination falls by nearly half, by approximately 14 percentage points for subprime deals, and 3
percentage points for Alt-A deals. While these magnitudes will be somewhat sensitive to the exact way
our model is specified, our basic directional finding that rating standards become less conservative
between early 2005 and mid-2007 is a robust conclusion. Nearly all measures of mortgage credit risk
suggest that risk was increasing over this period (e.g. early-payment defaults were increasing, house price
appreciation was falling, and projected default based on a historical loan-level model was rising sharply).
MBS ratings do not react to these developments, however, until after the financial crisis begins in mid
2007.
We note that this apparent decline in rating standards is concurrent with the peak of MBS
issuance. This appears roughly consistent with the models of Bolton, Freixas and Shapiro (2009) and
Mathis, McAndrews and Rochet (2009), which predict that rating inflation is more likely to occur when
securities volumes, and therefore current CRA profits, are high relative to future reputational costs of
rating errors.

4
The second part of the paper examines how well credit rating models aggregate available
information to order the relative level of default risk across deals from a given cohort. If subordination is
a good summary statistic for risk to bond investors, then variation in realized performance of the
mortgages in each deal should correspond well to the ordering of risk implied by their initial
subordination levels. Furthermore, credit ratings should incorporate all relevant information about risk in
the information set of the CRA at the time of rating. Therefore, prior data available at issuance should not
be systematically informative in predicting the ordering of relative future performance across deals, after
controlling for subordination.4
To implement this test, we regress deal performance on initial subordination, as well as a set of
proxies for credit risk and deal characteristics. We examine several measures of deal performance,
including the fraction of mortgage defaults at different horizons, the level of realized losses on the deal,
and the frequency of ex-post rating downgrades. In this regression, we control for other forms of credit
enhancement, as well as a set of time dummies. This ensures our results reflect credit rating variation
within cohorts, not due to any common time-series trends or macroeconomic shocks. Amongst our
measures of risk, we estimate a projected mortgage default rate for each deal, based on a logit model
estimated using data available prior to deal issuance.
We also investigate the comparative performance of deals with a high concentration of low-
documentation mortgages, relative to their initial credit ratings. We view this variable as a good indicator
of the relative opacity of the deal, since for low-doc mortgages, the lender and investor has much less
hard information about the true ability of the borrower to repay the loan. Skreta and Veldkamp (2009)
predicts that rating inflation should be greater for “opaque” securities, for which there is more residual
uncertainty about fundamental security value. We view the concentration of interest-only and low-
documentation mortgages in the MBS deal as reasonable proxies for opacity amongst our sample.
4 An analogy from the rational expectations literature is that it is not possible to improve upon a rational forecast based on data in the ex-ante information set of the forecaster (e.g. Sargent, 1987).

5
We find that lower deal subordination is indeed correlated with better ex-post performance of the
mortgages in the deal, as expected if ratings are informative about risk. However, we also find that our
model-projected default rate significantly improves upon the ratings for predicting the ordering of future
performance, even though this statistic is based only on data that is also available to CRAs. Somewhat
surprisingly, in a “horse race” type comparison, this projected default rate is more correlated with future
deal performance than the joint explanatory power of the two credit rating variables (AAA and BBB-
subordination).
Deals with a high fraction of low-documentation loans significantly underperform relative to their
initial subordination levels. This result appears consistent with the opacity prediction of Skreta and
Veldkamp (2009), and also consistent with the findings of Rajan, Seru and Vig (2009) that low-
documentation deals became progressively of worse quality over this period relative to the predictions of
backward-looking statistical models.
As well as defaults and losses, these two variables are also correlated with more severe ex-post
rating downgrades. This is notable, since downgrades in principle should be unforecastable if initial
ratings are formed efficiently. Results are particularly robust amongst Alt-A deals, which have a higher
fraction of non-standard mortgage types, and where downgrades are most pronounced. We also find that
subprime deals rated by a single CRA underperform their ratings, consistent with the findings of
Benmelech and Dlugosz (2009). We note that these single-rater deals make up a small fraction of our
MBS sample, however.
Even though these performance tests are based only on cross-sectional variation across deals in a
given time cohort, one concern is still that our results may be driven by “one off” factors associated with
the financial crisis. To investigate, we estimate regressions cohort-by-cohort. We in fact find evidence of
underperformance, relative to initial subordination, amongst high-risk deals and low-documentation deals
over the entire sample, even during the boom period where the level of defaults and losses are very low.
The evidence in this paper relates to a growing theoretical literature on incentive problems in the
rating process, as well as an active current policy debate about the role of rating agencies in the financial

6
crisis, and appropriate regulation of the rating industry. Congress is considering new legislation to
toughen oversight of rating agencies, while the SEC has announced rules to limit selective disclosure of
ratings opinions by securities issuers. Other commentators have proposed fundamental changes to the
rating process, such as the “platform pays” structure proposed by Mathis, McAndrews and Rochet (2009).
To assess the need for regulatory reform, it is important to have reliable evidence about past rating
performance. Our evidence suggests that credit ratings do provide useful information. However, we also
identify apparent shortcomings of the rating process during this period, particularly during the market
peak in 2005-07, when incentives to produce generous ratings were likely to be the strongest.
The rest of this paper proceeds as follows. Section 1 provides background information about
MBS securitization. (Readers familiar with these details may choose to skip this section). Section 2
presents a selective review of the credit ratings literature. Section 3 describes our main hypotheses.
Section 4 describes our data and presents stylized facts. Section 5 describes the econometric model used
to estimate a model-predicted default rate. Section 6 studies the determinants of ratings, and time-
variation in the level of ratings. Section 7 presents evidence on the relationship between ratings and ex-
post deal performance. Section 8 concludes.
1. Institutional Background
This section provides a short introduction to the non-agency MBS market, and the methodology used by
CRAs to rate non-agency deals. For more details, the reader is referred to Gorton (2008) and Ashcraft and
Schuermann (2008).
1.1 Overview of non-agency MBS
The non-agency market consists of MBS deals that do not carry a credit guarantee from the GSEs Fannie
Mae and Freddie Mac or the government agency Ginnie Mae. Investors in non-agency MBS are exposed
to credit risk relating to fluctuations in default rates on mortgages underlying the deal. The typical
subprime trust has several structural features designed to protect investors from credit losses on the
underlying mortgage loans, including (i) subordination, (ii) excess spread, (iii) shifting interest, (iv)

7
performance triggers, (v) external forms of credit enhancement such as interest rate swaps and bond
insurance. We briefly discuss each of these forms of credit enhancement in turn below.
Subordination. Credit risk in the mortgage pools on a non-agency deal is typically tranched into
different classes. Losses on the mortgage loan pool are applied first to the most junior class of investors
until the principal balance of that class is completely exhausted. At that point, losses are allocated to the
most junior class remaining, and so on. Figure 2 presents a simple schematic of how individual mortgages
are pooled into a tax-advantaged special purpose vehicle known as a REMIC trust, and then tranched into
a senior-subordinated structure.
[INSERT FIGURE 2 HERE]
The most junior class of claims is referred to as the equity tranche. For subprime deals, the equity tranche
is typically created through over-collateralization, which means that the principal balance of the mortgage
loans exceeds the sum of principal balances of all the debt issued by the trust. This is an important form
of credit enhancement that is funded by the arranger in part through the premium it receives on offered
securities. Overcollateralization is used to reduce the exposure of debt investors to loss on the pool
mortgage loans.
A small part of the capital structure of the trust is made up of the mezzanine class of debt
securities, which are next in line to absorb losses once the equity tranche is exhausted. This class of
securities typically has several tranches with credit ratings that vary between AA and B. With greater risk
comes greater return, as these securities pay the highest coupon rates to investors. The vast majority of
the capital structure is funded by the senior class of debt securities, which are last in line to absorb losses.
The face value of the senior securities is protected both by the equity tranche, and the width of the
mezzanine class. Senior securities generally have the highest rating, and since they are last in line (to
absorb losses), pay the lowest interest rates to investors.
Reflecting this structure, in our empirical work we measure credit ratings on the deal via
subordination below different rating classes, calculated as follows:
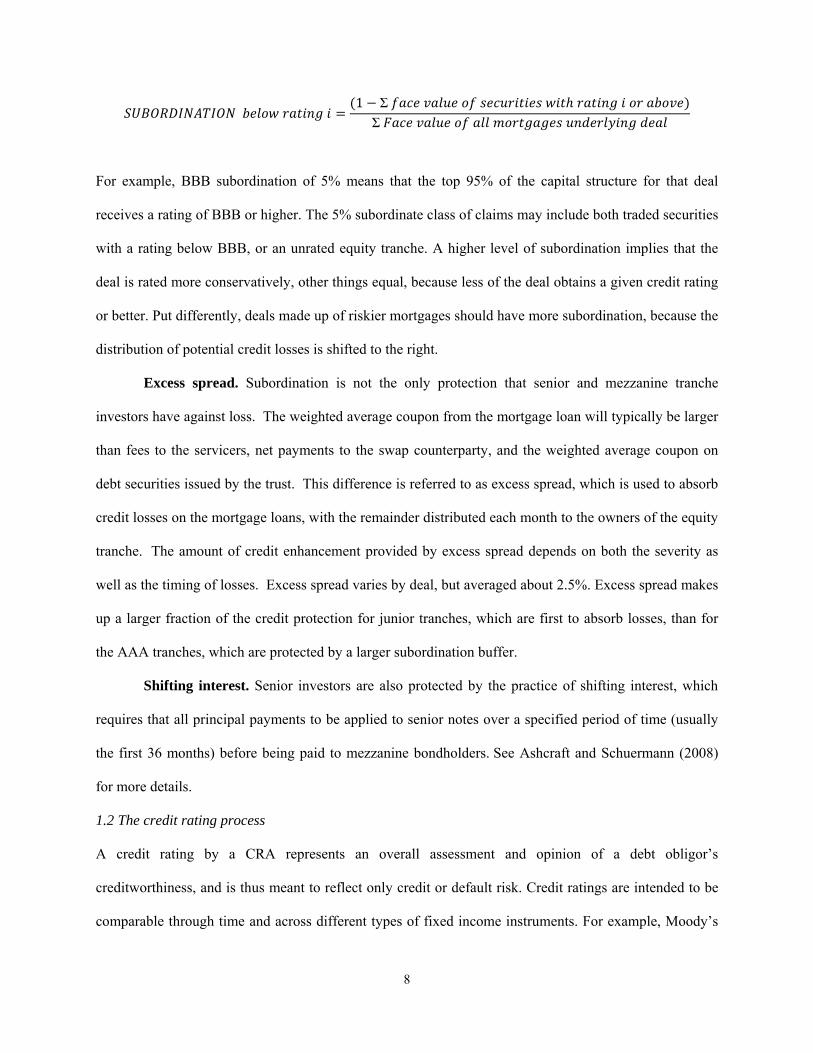
8
1 Σ
Σ
For example, BBB subordination of 5% means that the top 95% of the capital structure for that deal
receives a rating of BBB or higher. The 5% subordinate class of claims may include both traded securities
with a rating below BBB, or an unrated equity tranche. A higher level of subordination implies that the
deal is rated more conservatively, other things equal, because less of the deal obtains a given credit rating
or better. Put differently, deals made up of riskier mortgages should have more subordination, because the
distribution of potential credit losses is shifted to the right.
Excess spread. Subordination is not the only protection that senior and mezzanine tranche
investors have against loss. The weighted average coupon from the mortgage loan will typically be larger
than fees to the servicers, net payments to the swap counterparty, and the weighted average coupon on
debt securities issued by the trust. This difference is referred to as excess spread, which is used to absorb
credit losses on the mortgage loans, with the remainder distributed each month to the owners of the equity
tranche. The amount of credit enhancement provided by excess spread depends on both the severity as
well as the timing of losses. Excess spread varies by deal, but averaged about 2.5%. Excess spread makes
up a larger fraction of the credit protection for junior tranches, which are first to absorb losses, than for
the AAA tranches, which are protected by a larger subordination buffer.
Shifting interest. Senior investors are also protected by the practice of shifting interest, which
requires that all principal payments to be applied to senior notes over a specified period of time (usually
the first 36 months) before being paid to mezzanine bondholders. See Ashcraft and Schuermann (2008)
for more details.
1.2 The credit rating process
A credit rating by a CRA represents an overall assessment and opinion of a debt obligor’s
creditworthiness, and is thus meant to reflect only credit or default risk. Credit ratings are intended to be
comparable through time and across different types of fixed income instruments. For example, Moody’s
9
(2004) states that “[t]he comparability of these opinions holds regardless of the country of the issuer, is
industry, asset class, or type of fixed-income debt.” A recent document from S&P states “[o]ur ratings
represent a uniform measure of credit quality globally and across all types of debt instruments. In other
words, an ‘AAA’ rated corporate bond should exhibit the same degree of credit quality as an ‘AAA’ rated
securitized issue.” (Standard and Poor’s, 2007, p.4). Despite these statements, academic research has
uncovered evidence of significant differences in expected loss rates for AAA securities across different
classes of securities (e.g. Mason and Rosner, 2007, which compares corporate bonds and structured
products).
Rating agencies differ about what exactly is assessed. Whereas Fitch and S&P evaluate an
obligor’s overall capacity to meet its financial obligation, and hence is best through of as an estimate of
probability of default, Moody’s assessment incorporates some judgment of recovery in the event of loss,
and thus comes closer to measuring expected loss. Interestingly, these differences seem to remain for
structured products. In describing their ratings criteria and methodology for structured products, S&P
states: “[w]e base our ratings framework on the likelihood of default rather than expected loss or loss
given default. In other words, our ratings at the rated instrument level don’t incorporate any analysis or
opinion on post-default recovery prospects.” (S&P, 2007, p. 3) By contrast, Fitch incorporates some
measure of expected recovery into their structured product ratings.
The rating process for can be split into two steps: (i) estimation of a loss distribution, based on
characteristics of the deal, and (ii) simulation of cash flows across different realizations for the path of
defaults. With a loss distribution in hand, it is straightforward to measure the amount of credit
enhancement necessary for a tranche to attain a given credit rating. Subordination, or credit enhancement
(CE), is simply the amount of loss on underlying collateral that can be absorbed before the tranche
absorbs any loss. When a credit rating is associated with the probability of default, the amount of credit
enhancement is simply the level of loss CE such that the probability that loss is higher than CE is equal to
the probability of default. Again, see Ashcraft and Schuermann (2008) for more details.
10
2. Literature review
In this section we review theoretical literature on credit ratings, as well as selected empirical evidence
related to our paper. Readers are referred to these papers for links to further research.
2.1 Theoretical literature
Several recent theoretical papers study incentive problems in the credit rating process. Bolton, Freixas and
Shapiro (2008) models a security issuer who obtains ratings from one or more CRAs, each with a private
signal about the security’s value. Each agency can report its signal truthfully, or misreport it.
Exaggerating the security’s value leads to an exogenous reputation cost if detected by investors, but
provides a higher market share and fee income to the CRA in the current period. Bolton et al find that
rating inflation will be greater when there is a larger fraction of “naïve” investors, and when the potential
for current fee income is high relative to the reputation cost of misreporting. The presence of multiple
CRAs also generates more rating inflation, through two channels: (i) competition amongst CRAs causes a
“race to the bottom” as they bid to win market share by inflating ratings; (ii) it allows the issuer to engage
in “shopping”, soliciting multiple ratings but revealing only the most favorable ones.
In related work, Skreta and Veldkamp (2009) study the equilibrium relationship between asset
complexity and rating inflation. Complexity is defined as the residual uncertainty in fundamental asset
value conditional on the signal of the rating agency. Rating bias in equilibrium is minimized either when
complexity is low and CRA reports are very similar, or when complexity is extremely high, and credit
ratings are uninformative. In the intermediate region, however, rating shopping and rating inflation is
generally increasing in the degree of complexity of the security being rated. Sangiorgi, Sokobin and Spatt
(2009) make a similar prediction, that rating bias and selection effects are largest for securities where
there is the greatest degree of heterogeneity in views across CRAs about true security value.
The role of reputation is further explored in Mathis, McAndrews and Rochet (2008), which
studies an infinitely repeated game in which the rating agency at a point in time may be of two types. An
honest agency must always correctly report their signal of the security’s quality, while a dishonest CRA
can choose to give an incorrect report. Mathis et. al. show that when the fraction of CRA revenue from
11
rating opaque securities is large enough, the CRA of dishonest type will always lie with positive
probability in equilibrium. For some parameters an equilibrium with “reputation cycles” is possible.
When the CRA’s reputation is poor, there is no inflation and the CRA builds reputation by truthfully
reporting its signal. Over time, investor optimism increases, and at some point, the CRA starts reporting
an inflated value for the security’s quality. Eventually, following a negative shock, this misreporting is
discovered by investors, who then become more pessimistic.
Also related, Opp and Opp (2009) present a model where rating inflation occurs in equilibrium
not because investors are fooled by misreported ratings, but because ratings are built into capital
requirements and other financial regulation. Other related theoretical work includes Mariano (2008),
which also studies the role of reputation, Faure-Grimaud, Peyrache and Quesada (2007), and Boot,
Milbourn and Schmeits (2006).
2.2 Related empirical work
A large body of empirical research studies credit ratings, nearly always focusing on ratings of corporate
bonds. CRAs follow a “through the cycle” approach to bond ratings, meaning that ratings reflect default
risk over the life of the bond, and do not react to short-run economic conditions beyond their effect on
lifetime default risk. Amato and Furfine (2004) summarizes literature on rating procyclicality, and
concludes that CRAs generally react appropriately to changes in business cycle conditions. While Blume,
Lim and McKinley (1998) argue that corporate bond ratings have become progressively more
conservative over time, Amato and Furfine (2004) argue that this finding largely disappears after
controlling appropriately for firm-level measures of risk.
Turning to structured finance ratings, most similar to our paper in terms of data, Nadauld and
Sherlund (2008) study interactions between MBS primary and secondary markets, also using a matched
dataset of mortgages and MBS for a sample of subprime deals. Their main result is that following the
passage of SEC regulation reducing capital requirements for broker-dealers, these dealers
disproportionately increase mortgage purchases in areas with high price appreciation but lower credit
quality on other dimensions, suggesting a link between secondary market MBS demand and the supply of
12
mortgage finance. These authors also present evidence on credit ratings, finding that MBS deals from
areas with higher past house price growth have more generous ratings. Although the focus of our paper is
different to Nadauld and Sherlund, we do consider past house price appreciation as one of the
determinants of ratings, and confirm their finding that high past appreciation is associated with less
conservative ratings.
Benmelech and Dlugosz (2009) study ratings on asset-backed collateralized debt obligations
(CDOs). These authors document strikingly large CDO rating downgrades amongst recent vintages,
consistent with the evidence presented in Figure 1. Furthermore, these authors find that securities rated by
one agency are more likely to be downgraded, and are downgraded more severely, suggestive of shopping
and selective disclosure of ratings by security issuers. Also studying CDOs, Griffin and Tang (2009) find
that ratings deviate from risk as measured by a rating agency’s quantitative internal credit model,
suggesting that judgemental adjustments were applied to the model estimates. However, these
adjustments do not improve performance; results from the internal model are more informative for
predicting performance than the public credit rating. As described later, we find a similar result for MBS.
Credit risk estimated by a simple model is more informative for predicting deal performance than the
announced ratings.
An important related question is whether credit ratings actually matter for investor decisions or
bond prices. Kliger and Sarig (2000) provide convincing quasi-experimental evidence that the
information in corporate bond ratings affects prices, by studying the introduction by Moody’s of bond
rating modifiers (e.g. an A rating is split into A1, A2 or A3). They find the information revealed by this
refinement of ratings affects the relative pricing of securities which previously had the same rating. In
addition to their informational role, ratings may also matter simply because they are built into financial
regulation and capital requirements. Kisgen and Strahan (2009) present evidence consistent with this
hypothesis. In particular they show that when DBRS is approved by the SEC as a nationally registered
statistical rating organization (NRSRO), prices for corporate securities already rated by DBRS shift based
on their DBRS rating, especially around regulatory rating boundaries.

13
Finally, Adelino (2009) presents evidence that amongst MBS with a given rating, bond prices
have predictive power for future performance. This suggests prices contain useful information on risk,
implying that investor demand reacts to fundamentals as well as the rating. However, notably, this result
does not obtain for triple-A rated securities, suggesting that investors in this class just “buy the rating”.
Together, this evidence in these three papers strongly supports the view that MBS ratings do matter for
security prices and mortgage supply.
3. Data and stylized facts
Our empirical analysis is based on a sample of 3,144 subprime and Alt-A MBS deals issued between
January 2001 and December 2007. This sample is constructed by matching security-level information
from Bloomberg and ABSNet and mortgage-level data from LoanPerformance, and aggregating that
information to the deal level.
From Bloomberg and ABSNet we collect information on the initial characteristics of each
security at the time of issuance, including its face value, coupon rate, position in the seniority structure
and other features. We also record its initial and current credit rating from each of Moody’s, S&P, Fitch
and DBRS. From LoanPerformance we obtain information on the underwriting characteristics of each
mortgage in each deal, such as the loan size, date of origination, borrower credit score, loan-to-valuation
ratio, property zip-code and so on. We also make use of information from LoanPerformance on the ex-
post performance of each mortgage at different horizons after the deal was issued (i.e., whether the loan is
prepaid, current, delinquent, in foreclosure etc.).
We classify deals as subprime or Alt-A based on their assignment in LoanPerformance. In our
empirical work we generally analyze these two subgroups separately. For comparability reasons, we drop
deals backed by negative amortization mortgages (also known as option ARMs), a type of mortgage
where borrowers make very low initial monthly payments, and the loan balance increases over time.
Appendix B provides more information on our Bloomberg, ABSNet and LoanPerformance data, as well
as a more detailed description of how our final sample is constructed.
14
Figure 3 plots the time-series of total securitization activity for our sample. We also plot total
securitization volume in these two sectors as reported by the mortgage industry newsletter Inside
Mortgage Finance. Comparing the two sets of figures, the Figure shows our data represents a high
fraction of total nonprime securitization volume over this period. (Our sample covers a higher fraction of
subprime volume relative to Alt-A, because we drop negative amortization deals, which are nearly always
classified as Alt-A.) In total, our sample represents an underlying total flow of $2.4tr in nonprime
securitized mortgages over this seven year period.
[INSERT FIGURE 3 HERE]
Figure 3 highlights the striking growth and subsequent collapse of deal flow in the nonprime
MBS market. Issuance grew rapidly between 2001 and 2005. At the market peak from early 2005 to mid
2007, around 250 new deals were being issued each quarter in subprime and Alt-A combined, or around
$200bn of volume. This issuance declined rapidly beginning in the second half of 2007, with no new
deals being issued in 2008.
3.1 Measuring credit enhancement
For each deal, we calculate the level of subordination below different credit rating levels, also known as
the “attachment point” of the rating class. As described in Section 1, we measure subordination below
rating i as the fraction of claims on the mortgage collateral in the deal that are junior to bonds with a
rating of i or higher. These junior claims include both traded securities with a rating lower than i, and the
face value of the overcollateralization or equity tranche. When calculating these subordination levels we
take care to avoid double counting by excluding tranches that are reported in ABSNet with a nominal face
value but do not have a claim on mortgage principal, such as interest only and exchangeable tranches. See
Appendix A for more details.
We also construct several variables to measure other types of credit enhancement on each deal.
We first construct a measure of the correlation of mortgage losses. The primary source of loss correlation
in MBS deals comes from common macroeconomic shocks, particularly home price appreciation and
economic conditions. The less diversified the deal against these shocks, the greater the risk of losses to
15
bond investors high in the capital structure. To measure the extent of diversification, we construct a
variable that measures the sum of the squared share of mortgages in the deal originated from each US
state. This variable is increasing in the geographic concentration of the deal, and is bounded between 0.02
and 1. A value of 1 means all the mortgages in the deal were originated in a single state, and thus are least
diversified against idiosyncratic local housing or economic shocks.
In addition, we record whether the deal has external bond insurance, and the face value of this
insurance as a fraction of the deal size. We also calculate both the average mortgage interest rate for the
deal, and the average interest rate paid to bondholders. Net of servicing fees, the difference between these
two reflects the excess spread of the deal at origination. As discussed in Section 1, the accumulation of
excess spread over time provides additional credit protection to MBS security-holders.
3.2 Stylized facts
Summary statistics for the deals in our sample are summarized in Table 1. The average deal has face
value of $749m, with the subprime deals on average being somewhat larger than Alt-A deals. Alt-A deals
are generally backed by higher-quality collateral than subprime deals (i.e. mortgages with a lower
expected probability of default). Reflecting this, a larger fraction of the claims issued in Alt-A deals
receive the highest possible triple-A rating; 93.1% compared to 82.4% for the subprime deals. These
figures match closely with average subordination rates reported from other sources (e.g. Ashcraft and
Schuermann, 2008; Gorton, 2008), suggesting our approach for calculating subordination works well.
Table 1 also presents information about the distribution of the number of CRAs that rated each
deal. Nearly all deals are rated by two or three rating agencies, amongst four rating agencies that are
active in this market over our sample period, Moody’s, Standard and Poor’s, Fitch and DBRS. Amongst
this group, Moody’s and S&P have dominant market shares. We note that almost no deals are rated by a
single CRA, only 0.3% of subprime deals and 0.4% of Alt-A deals.
[INSERT TABLE 1 HERE]
Table 2 presents summary statistics for the mortgage collateral underlying these deals. On
average, each subprime deal is backed by 5,506 individual mortgages, while each Alt-A deal is backed by

16
2,114 loans. This difference reflects the larger principal values for Alt-A loans and the larger number of
junior-lien mortgages in the subprime deals. Consistent with conventional industry wisdom, Table 2
shows that Alt-A deals are made up of mortgages to borrowers with higher average FICO scores and
lower loan-to-valuation ratios, but have a higher fraction of non-standard mortgages, such as interest only
mortgages and low- or no-documentation mortgages.
[INSERT TABLE 2 HERE]
Table 3 presents time-series patterns in the key variables. Notably, the fraction of interest only
and low- or no-documentation loans increases significantly over the sample period. For example, the
fraction of interest-only mortgages increases from only 0.0% and 0.4% in subprime and Alt-A deals
respectively in 2001, to 17.4% and 54.0% respectively by 2007. Table 3 also documents trends in other
types of credit enhancement; for example, the fraction of deals with bond insurance declines significantly
over the sample period, both in subprime and Alt-A.
[INSERT TABLE 3 HERE]
3.3 Trends in credit enhancement
Trends in subordination are presented in Table 3, and also documented graphically in Figure 4. This
Figure plots time-series trends in subprime and Alt-A subordination at different attachment points over
the period 2000-2008, measured on a quarterly basis. The figure also marks with two vertical lines the
period of peak MBS issuance, between Q1:2005 to Q2:2007.
[INSERT FIGURE 4 HERE]
Notably, in the first part of the sample, up to the start of 2005, the rating of subprime RMBS deals
become more conservative, not less. A similar trend, albeit less pronounced, is evident in the Alt-A
market. As shown in Table 3, this increased subordination is partially offset by declining levels of credit
enhancement, namely insurance and excess spread. In the peak period between the start of 2005 and the
middle of 2007, subprime ratings are close to stable, while Alt-A subordination declines somewhat.
Finally, subordination increases sharply, especially in the subprime market, in the last two quarters of our
sample, after the onset of the crisis.

17
These trends in subordination should be interpreted with caution, given that the characteristics of
MBS deals and the quality of the underlying collateral evolved significantly over this seven year period.
In the next part of our analysis, we construct a simple measure of credit risk, and adjust these
unconditional estimates to reflect changes in collateral quality and other deal characteristics, such as
geographic concentration and credit enhancement.
4. Loan-level model
As a precursor to our evaluation of MBS ratings, in this section, we present estimates of a loan level
econometric model of mortgage defaults. This model is used to construct a summary statistic for the level
of credit risk in each deal, based only on data available to rating agencies at the time the deal was rated.
Our main steps are as follows:
1. We split our sample of deals into six-month subsamples (first half 2001, second half 2001 etc.).
We then estimate the model separately for each subsample, using only mortgage and
macroeconomic data that was available at the start of the six-month period.
2. For each deal issued during the six month period, we substitute each mortgage in the deal into the
econometric default model, and calculate its projected default probability.
3. We aggregate this model-projected default rate up to the deal level, weighting by the face value
of each mortgage.
The default model is a simple logit regression based on a 10% LoanPerformance sample. We use
all the LoanPerformance data, not just data from mortgages in our sample of MBS deals. This data is
merged with FHFA house price data at either the state or MSA level (depending on whether the property
underlying the loan is located in an MSA), as well as the state unemployment rate. The dependent
variable in our loan level regressions is a dummy equal to 1 if the mortgage is 90+ days delinquent, REO
or prepaid with loss one year after origination, and zero otherwise.

18
Explanatory variables included in the model include macroeconomic data and the key
underwriting variables supplied in the LoanPerformance database. Key underwriting variables included in
the model include the borrower’s FICO score, the combined loan-to-valuation ratio summing all mortgage
liens, dummies for the type of loan (FRM, ARM, interest only, balloon loan), the borrower debt-payments
to income ratio (DTI), level of documentation of borrower income (full, partial or none), a dummy for
whether the borrower is an investor rather than an owner occupier. We also control for the level of past
local house price appreciation, measured by the trailing percent change in the MSA-level FHFA home
price index. We examined a number of methodology documents from Moody’s and S&P in the early part
of our sample, and verify that each of these underwriting variables was amongst the deal characteristics
considered by the rating agencies when estimating ratings. Thus, it is not the case that our measure of
credit risk exploits data that we consider but CRAs at the time did not.
[INSERT TABLE 4 HERE]
Table 4 presents estimates of the logit model over the full sample period. Robust standard errors
are clustered at the level of the issuer of the deal. Results in the Table are consistent with other literature
estimating the determinants of default over this period, such as Demyanyk and Van Hemert (2009),
Haughwout, Peach and Tracy (2008), and Bhardwaj and Sengupta (2009). Most notably, 12-month
trailing home price appreciation (HPA) is significantly negatively correlated with subsequent mortgage
default. Note, unlike most other papers, this is a measure of HPA over the previous 12 months, not
realized HPA after the deal is issued. However, HPA is highly positively autocorrelated (Case and Shiller,
1987); thus, high HPA today in the recent past is also associated with high future HPA, increasing
borrower equity and discouraging default.
Figure 5 plots the projected 12-month post delinquency rate from this baseline model over time.
The x-axis of this figure is the year-quarter that the deal was issued. Also plotted on this figure is the ex-
post realized 12-month average deal default rate by year-quarter. The logit model generally does a good
job of projecting mortgage defaults over time, although it significantly lags the actual increase in
subprime mortgage delinquencies observed beginning in 2006. Unsurprisingly, this suggests that it was
19
not possible to fully predict the magnitude of defaults using a mechanical backward-looking model,
unsurprising given the sharp deterioration in the US housing market and credit conditions observed
leading up to the crisis.
[INSERT FIGURE 5 HERE]
Sections 6 and 7 present our evidence on credit ratings, which make use of the model-projected
default rate estimated via this model. We emphasize that this logit model is not intended to be a
comprehensive or “best practice” model of credit risk. To the contrary, we choose an intentionally simple
model structure, and only variables that CRAs also claim to consider, minimizing concerns that our
modeling decisions are influenced by our knowledge of the ex-post evolution of defaults. While ratings
incorporate all the data in our model, at least in principle, our model excludes several features of the
rating process. For example ratings are based on a set of simulated paths for interest rates and house
prices, and explicit transitions between different states of delinquency, and also take into account some
variables not included in the model. Given this more complex approach, ratings at different points in the
capital structure would be expected to be a substantially better indicator of the level of credit risk in the
deal than our model-projected default rate.
5. Empirical predictions
The main goal of our paper is to evaluate the quality of nonprime MBS credit ratings in the period leading
up to the financial crisis. This section describes our main hypotheses.
The first part of our analysis studies time-series trends in average rating standards. Ratings in our
analysis are measured as the level of subordination below different rating classes. We note that it is
difficult to make strong statements about the “correct” absolute level of subordination, and whether
observed ratings are above or below that level. Such judgments would depend critically on views about
the average frequency of future financial crises or sustained house price declines, for example. Instead,
we examine changes in subordination over time, after controlling for measures of default risk. Our

20
approach is analogous to Blume, Lim and MacKinlay (1998), who study time-series trends in risk-
adjusted corporate bond ratings.
Our null hypothesis is that, conditional on risk, the fraction of subordination remains constant
through time. This is consistent with statements by CRAs that the interpretation of a given rating should
be independent of the type of security or the point in the business cycle at which the rating is issued.5
This stability hypothesis is summarized below:
Hypothesis 1 (Rating stability): The fraction of subordination remains constant through time, after
controlling for the level of mortgage credit risk and other forms of credit enhancement.
An alternative to this null hypothesis, as proposed by Mathis, McAndrews and Rochet (2009) is
that credit ratings exhibit reputation-driven cycles. Under this hypothesis, rating standards decline during
periods of high security issuance, when the benefits of increasing current profits by misreporting security
quality are high relative to future reputational costs.
We test the rating stability hypothesis by estimating the relationship between deal subordination
and variables influencing default risk to bond investors, including the riskiness of the mortgages
underlying the deal, and measures of credit enhancement such as the presence of bond insurance and
excess spread. We then study time-series variation in the residual level of subordination after conditioning
on these risk measures. Of independent interest, we also examine whether ratings are correlated with
fundamentals in the expected direction, as would be expected if ratings are well formed.
The second part of our analysis evaluates the quality of the rating process used by CRAs, by
examining the relationship between ratings and ex-post deal performance. If ratings are a good summary
statistic for credit risk, the relative performance of different MBS deals should correspond well to the
ordering of risk implied by their initial subordination levels. Furthermore, data available at issuance
5 For example, a Moody’s rating methodology report published before the start of our sample period states that “while it is impossible to produce constant realized default rates, one of Moody’s goals is to achieve stable expected default rates across rating categories and time.” (Moody’s, 1999).
21
should not be able to systematically predict deal performance, after controlling for ratings, since such
information, if informative for default risk, should already be incorporated into the rating.
Hypothesis 2 (Informational Efficiency): Subordination predicts deal performance. Also, data available
prior to the time of the rating does not systematically predict deal performance, after controlling for
initial subordination.
We test this hypothesis by regressing deal performance on initial subordination below different
rating classes, credit risk measured by the model-projected default rate as well as other deal covariates,
and a set of year x quarter dummy variables. We examine several measures of deal performance:
mortgage defaults, realized investor losses and rating downgrades. Under the null hypothesis, higher
subordination should be strongly correlated with higher mortgage defaults and investor losses. In
addition, the model-projected default rate and other deal covariates should not systematically predict
defaults and losses after conditioning on subordination. Neither initial subordination nor the other deal-
level covariates should predict rating downgrades, which in principle should be unforecastable.
We also test a further hypothesis relating to the particular characteristics of deals that perform
poorly ex-post relative to their ratings. Skreta and Veldkamp (2009) predicts that rating inflation should
be greater for “opaque” securities, for which there is more residual uncertainty about fundamental
security value. As our primary test of the opacity hypothesis, we study the relative performance of deals
with a high concentration of low- and no-documentation mortgages. Such loans are significantly more
opaque than other mortgage types, since investors must rely on a borrower’s report of their income, and
thus their ability to service the loan, rather than verifiable information. This test is summarized in
Hypothesis 3 below.
Hypothesis 3 (Opacity): Deals with a high fraction of low-documentation mortgages do not
systematically underperform other deals relative to their respective initial credit rating.

22
6. Determinants of MBS subordination
We first estimate a regression model of MBS subordination, as a function of variables expected to
influence risk to bond investors. These include most importantly the level of credit risk for mortgages
underlying the deal, which is based on our loan-level model. We also control for different types of
internal and external credit enhancement, which substitute for subordination in protecting bondholders
from default. We then examine residual time-series variation in credit ratings after conditioning on these
fundamentals.
The projected default rate from the loan-level model in Section 4 is used as our primary summary
statistic for mortgage default risk. In some model specifications, we also separately control for a set of
mortgage summary statistics for the deal in question. To measure external credit enhancement, we include
a dummy for whether any part of the deal is insured or “wrapped” by a third party insurer, and a
continuous variable measuring the fraction of the deal that is insured. To measure excess spread at
origination, we control for both the average mortgage coupon rate and the average bond coupon rate.
Excess spread reflects the difference between these two variables. We include the two variables
separately, rather than just the difference, because the mortgage coupon rate may also be another proxy
for the riskiness of the mortgages in the deal.
We also include a measure of the geographic concentration of mortgages in the deal, namely i
(fraction of mortgage balances from state i)2. This variable takes values between 1 (all mortgages are
from a single state) and 0.02 (equal mortgage balances from each state). This variable is intended to
reflect that bondholders are concerned with the joint distribution of losses. Other things equal, a
geographically concentrated deal will have a larger variance of losses, by being more exposed to regional
house price or economic shocks. This creates a higher probability of loss for more senior investment-
grade bonds.
We estimate a simple regression of the relationship between subordination and these variables as
well as a vector of year x quarter dummies. The time dummies ensure that our estimates are based only on
23
cross-sectional variation across deals issued in a given quarter, rather than any time-series trends in rating
standards. The dependent variable is ln(1 + percent subordination below AAA), specified in logarithms so
that time dummies shift subordination proportionately to each deal’s baseline predicted default rate. (Our
estimates are similar however if we specify the model in levels, or use subordination below BBB instead
of AAA; these results are available on request.)
[INSERT TABLE 5 HERE]
Table 5 presents the empirical estimates, which are estimated separately for subprime (Columns 1
and 2) and Alt-A (Columns 3 and 4) deals. Columns 2 and 4 include as additional covariates a set of
value-weighted mortgage summary statistics: average FICO, average CLTV, the fraction of no- or low-
documentation mortgages, investor loans and interest-only loans, and 12-month trailing house price
appreciation (HPA). Although these variables are also included in the loan-level default model, including
them separately in the deal- level regression accounts for any difference between the weight placed on
them by CRAs in the rating process relative to the coefficients in our loan-level default model.
Table 5 shows the main deal characteristics of interest are indeed correlated in the expected
directions with the level of required AAA subordination. Most notably, the two transformations of the
model-projected default rate are highly statistically significant, and imply a positive relationship between
mortgage credit risk and required subordination. Greater geographic dispersion is correlated with lower
subordination, while deals with more bond insurance also have lower average required subordination.
The table also presents “within” R2s that show the fraction of within-quarter variation in
subordination explained by our proxies for deal fundamentals. This fraction is quite high for subprime
deals, around 53%, although substantially lower at 19%-28% for Alt-A deals.
In this model, the coefficients on the year x quarter dummies trace out variation in subordination
that is not explained by the risk and credit enhancement variables shown in Table 5. These time-series
paths for conditional AAA subordination are presented in the two left-hand panels of Figure 6, for
subprime and Alt-A deals respectively. This is simply subordination after controlling for changes in
average mortgage credit quality and credit enhancement of MBS deals. Each line and its standard error
24
bands are constructed directly from the vector of year x quarter time dummy variables. Also plotted is the
path of unconditional AAA subordination shown earlier. For presentation in the figure, we normalize
conditional and unconditional subordination to be equal in 2004:Q4.
[INSERT FIGURE 6 HERE]
The Figure shows that, both unconditionally and controlling for risk, subordination increases over
the first part of the sample, between the start of 2001 and the end of 2004. Unconditionally, credit ratings
then remain approximately constant from the start of 2005 until the end of the mortgage boom in mid-
2007. Conditional on risk and credit enhancement, however, subordination falls significantly between
2005 and mid-2007.
Ignoring our econometric estimates momentarily, this finding can actually be understood quite
easily graphically from examining Figures 4 and 5. Figure 4 shows that projected default from the loan-
level model increases sharply in 2006 and 2007, suggesting that MBS deals had become progressively
riskier. However, Figure 5 shows that during this period, subordination remains constant or even declines
slightly, suggesting that credit ratings on average did not react to this increase in risk. Table 5 presents a
formal econometric test that residual subordination declines between Q1:2005 and Q2:2007. In three of
the four columns we reject the null of stability at the 1% level of significance, while in Column 4 we
reject at the 4% significance level.
The right-hand-side of Figure 6 presents a simple mechanical decomposition of the divergence
between conditional and unconditional subordination. Part of the decline in conditional ratings is
accounted for by falling house price appreciation, which peaks in 2005 and declines thereafter. The
contribution of declining HPA is reflected in the difference between the unconditional subordination
time-series and the line “Model, HPA Fixed”. A second part of the decline in conditional subordination is
explained by rising mortgage risk driven by covariates from the loan-level model other than house price
appreciation (e.g. changes in LTV, FICO etc., as well as changes in the loan-level model coefficients on
these variables). This is the difference between the line “Model, HPA Fixed” and the line “Model, SD
Forecast Fixed”. Finally, a small part of the change in conditional ratings is explained by fluctuations in
25
the strength of other types of credit enhancement including insurance, excess spread and geographic
concentration.
These estimates are economically as well as statistically significant; they imply that conditional
on risk, subordination below the AAA class fell by 14 percentage points between Q1:2005 and Q4:2007
for subprime deals, and by 3 percentage points for Alt-A deals. This is more than half of
We note that the magnitude of these estimates will be sensitive to the exact way our loan-level
default model is specified. However, our basic directional conclusion that deal risk is increasing between
the start of 2005 and mid 2007, while ratings do not adjust, is likely to be robust to almost any alternative
model specification, since almost every type of evidence suggests risk embedded in nonprime MBS deals
was increasing significantly during this 2½ year period. For example, early payment defaults increased
sharply between 2005 and 2007, as documented in Demyanyk and Van Hemert (2009) and in Figure 5.
Secondly, house price appreciation was declining from late 2005 onwards; since HPA is strongly
positively autocorrelated (Case and Shiller, 1989), this also implies higher probabilities of future home
price declines, leading to a higher incidence of defaults and losses. Third, our predicted default rate
shown in Figure 5 implies an increasing path of projected defaults, as does a more complex loan-level
econometric default model in which different underwriting variables like HPA, FICO, LTV etc. are
interacted with each other, and also with time trends. (Results for this more complex model are available
on request).
To summarize, we find significant evidence of time-series variation in rating standards, with
robust evidence that subordination conditional on risk declined between 2005 and 2007. We note that this
apparent decline in standards is concurrent with the peak of MBS issuance. One interpretation of our
results, consistent with the models of Bolton, Freixas and Shapiro (2009) and Mathis, McAndrews and
Rochet (2009), is that rating standards were progressively related due to the high volume of deals during
this period. However, to be clear, this is only one interpretation of our results, and others are also
plausible.
26
6. Subordination as a summary statistic for risk
The second part of our empirical analysis studies the ex-post performance of subprime and Alt-A MBS
deals. Our primary measure of performance is the weighted fraction of mortgages in the deal that are in
default (defined as 90+ days delinquent, prepaid with loss or real-estate owned, REO), 12 months after
deal issuance. Later we also study default at other horizons, as well as realized losses and ex-post rating
downgrade events.
In Tables 6 and 7, we present deal-level regressions of the relationship between ex-post default,
initial credit ratings measured by subordination below AAA, the projected default rate from the loan-level
model, and a set of deal controls. The controls are the same measures of other forms of credit
enhancement and deal structure included in Table 5. Table 6 presents results for subprime deals, and
Table 7 presents results for Alt-A. In Columns 2 through 4, we also include additional aggregated loan-
level characteristics, including the concentration of low-documentation mortgages
[INSERT TABLES 6 AND 7 HERE]
These regressions examine the predictive content of measures of risk after conditioning on the
level of subordination. This provides a test of the informational efficiency hypothesis, that the logit-
model-projected default rate does not systematically predict default after conditioning on the level of
subordination. We find firstly that subordination is statistically positively correlated with mortgage
default on the deal. As expected, and consistent with the “ex-ante” regressions presented earlier, deals
backed by riskier mortgages are rated more conservatively in the cross-section. However, we also find
that riskier deals, as measured by our backward-looking summary statistic, perform significantly
relatively worse that would be predicted by their subordination levels alone.
Consistent with this evidence, in addition, we estimate a simple “horse race” between the model-
projected default rate and subordination on the deal below AAA and BBB-. We find that the model-
projected default measure is significantly more correlated with ex-post performance, as measured by the
R2. For example, amongst subprime deals, including the rating causes the R2 to increase from 0.092 to
0.275, compared to a model that just controls for other types of credit enhancement. However, including
27
instead the model projected default rate causes the R2 to rise by more than twice as much, from 0.092 to
0.483. (See Table 9 for a presentation of these estimates). These findings hold for both subprime and Alt-
A deals, and are economically as well as statistically significant.
We also find that deals with a high concentration of low-documentation mortgages have poorer
ex-post performance than would be predicted from their subordination levels alone. As shown in Column
4 of Tables 6 and 7, this poor performance is particularly concentrated amongst deals issued during the
credit boom period from 2005:Q1 to 2007:Q2. This finding appears consistent with the prediction of
Skreta and Veldkamp (2009) predicts that rating inflation should be greater for “opaque” securities, for
which there is more residual uncertainty about fundamental security value. It is also consistent with
Rajan, Seru and Vig (2008), which presents a model and empirical evidence to argue that the composition
of the pool of low-documentation mortgages became progressively worse over the sample period than
historical models would have predicted, reflecting this change in credit quality. The high ex-post defaults
observed here on low-documentation loans, even conditional on the output of the historical credit loss
model, appears consistent with this view.
Finally, several of the dummies relating to the number of credit rating agencies that provided
ratings for the deal are statistically significant in the specifications presented in Table 6 and 7. However,
the signs of the coefficients are not always consistent across Alt-A and subprime. One striking fact is that
ex-post default is unexpectedly high amongst subprime deals rated by a single rating agency. This result
is consistent with Benmelech and Dlugosz (2009), who find that amongst CDO deals, ex-post
downgrades are more common amongst deals rated by a single CRA. Benmelech and Dlogosz interpret
this finding as evidence of rating shopping. While this is certainly possible, we also note that deals rated
by one rating agency make up a very small fraction (less than 1%) of our sample. Given this, and the
endogeneity associated with the choice of rating agencies, we are reluctant to draw firm conclusions about
the interpretation of the statistical significance of these “rating strategy” variables.
6.1 Rating downgrades

28
Table 8 presents similar analysis, using rating downgrades as an alternative measure of the extent to
which ratings did not incorporate measures of risk. Downgrades are measured in terms of weighted
average downgrades measured in rating notches.
The table shows that, consistent with our earlier analysis, that deals with a high model-projected
default rate, and those with a high concentration of low-documentation mortgages, are more likely to be
downgraded by rating agencies ex-post. This provides further evidence to suggest these deals were not
rated significantly conservatively at origination. Remember that since our regressions include year x
quarter dummies, this statement is made cross-sectionally (i.e. comparing deals issued around the same
time, with different observable levels of credit risk as observed by the econometrician through the lens of
the logistic default model).
[INSERT TABLE 8]
6.2 Vintage-level regressions
Even though these performance tests are based only on cross-sectional variation across deals in a given
time cohort, one concern is still that our results may be driven by “one off” factors associated with the
financial crisis.
To investigate this possibility, we estimate a more parsimonious version of our previous
regressions on a vintage-by-vintage basis (i.e. separately for each cohort of deals issued between 2001
and 2007). Results from this analysis are presented in Table 8. This Table confirms that the model-
projected default rate, and the concentration of low-documentation mortgages, are correlated with higher
ex-post default in every year, While the power of our regressions is understandably much lower than for
our pooled regressions, these coefficients are in general statistically significant also. These results are
important, because they demonstrate that the excessive insensitivity of ratings to credit risk, and the
concentration of high-risk but opaque limited documentation loans, is observable well before the
mortgage credit boom or the onset of the crisis.
The results also present estimates of R2 for different model specifications in each year, and for the
sample as a whole. This confirms our previous finding that the model-predicted default rate is consistently

29
more correlated with ex-post default than is AAA subordination, based on a comparison of the R2s across
the specifications.
[INSERT TABLE 9]
6.3 Other robustness checks
Table 10 studies how the same variables studied earlier are related to default at different horizons (a 24
month horizon, or default to date using as long a history from LoanPerformance as possible), or to
realized losses.
This analysis recognizes that there is no single “perfect” measure of deal performance. For
example, while ultimately ratings are intended to be a measure of security default probabilities, realized
mortgage losses are a sharply lagging indicator, since losses are not recognized until default is certain and
the amount of the shortfall in payments can be measured precisely. Given this, we consider two
alternative measures of performance, namely realized losses to date, and cumulative default rates. As the
table shows, our basic findings are robust to this alternative specification.
[INSERT TABLE 10]
7. Conclusions
We document features of MBS deals and ratings in the period leading up to the subprime crisis, and
present evidence on the quality of credit ratings on these instruments. Our evidence suggests credit ratings
issued on MBS did contain useful information, in the sense that they were correlated with fundamental
measures of credit risk and credit enhancement in expected ways, and also correlated in the cross-section
with ex-post deal performance.
However, we also identify a number of shortcomings in ratings during this period, relative to the
benchmarks we consider. First, ratings exhibit significant time-series variation, in a way that does not
seem easily accounted for by variation in the credit risk facing investors. Most strikingly, we find that at
the peak of MBS issuance, when our model-projected default rate and other measures of credit risk were
increasing significantly, ratings on subprime deals remained flat, while subordination on Alt-A deals
30
actually decreased slightly. That this estimated erosion in ratings occurs during the peak of MBS issuance
appears consistent with theoretical models where rating agencies trade off current profits against the
reputational costs of revealed rating errors. Other interpretations are also possible, however.
Second, we present evidence that MBS ratings did not fully reflect publicly available data on
credit risk. High-risk deals, as measured by our summary measure of credit risk, perform worse relative to
their rating than do observably low-risk deals. These differences are quantitatively important, hold both
cross-sectionally and in the time series, and also hold in vintage-level cross sectional regressions based
only on data available well before the onset of the crisis. These deals experience higher ex-post defaults
and investor losses, and are also more likely to be downgraded ex-post by rating agencies. Surprisingly,
our simple summary statistic is often a more informative metric for ranking future MBS performance than
the combined predictive power of subordination at two key attachment points, in a “horse race” type
comparison. Given the significant body of evidence linking ratings to security prices, this suggests that
these deals may also have been overpriced, leading to a relative oversupply of mortgage finance for loans
with risky underwriting characteristics.
We find significant underperformance (relative to their ratings) amongst deals with a high
fraction of loans which are difficult-to-evaluate, such as low-documentation and interest-only mortgages.
This result is consistent with theoretical predictions from Skreta and Veldkamp (2009), and with previous
evidence about low documentation deals presented by Rajan, Seru and Vig (2009). Finally, we find some
correlations between the number of CRAs who rated the deal and the subsequent performance of the deal
relative to its rating, consistent with Benmelech and Dlugosz (2009). In this paper, we remain agnostic on
whether our findings reflect explicit evidence of rating “shopping”, given the given that issuers’ choice of
rating agencies is endogenous. However, we believe that investigating this question in more detail is an
important topic for future research.

31
References Adelino, Manuel, 2009, How Much Do Investors Rely on Ratings? The Case of Mortgage Backed Securities, Working Paper, Massachusetts Institute of Technology. Ashcraft, Adam and Til Schuermann, 2008, Understanding the Securitization of Subprime Mortgage Credit, Foundations and Trends in Finance, 2(3), 191-309. Becker, Bo and Todd Milbourn, 2008, Reputation and Competition: Evidence from the Credit Rating Industry, Working Paper 09-51, Harvard Business School. Benmelech, Efraim and Jennifer Dlugosz, 2008, The Alchemy of CDO Credit Ratings, Working Paper, Harvard University. Benmelech, Efraim and Dlugosz, Jennifer, 2009, The Credit Rating Crisis. NBER Working Paper 15045. Available at SSRN: http://ssrn.com/abstract=1415208 Bhardwaj, Geetesh and Rajdeep Sengupta, Where's the Smoking Gun? A Study of Underwriting Standards for US Subprime Mortgages (October 1, 2009). Federal Reserve Bank of St. Louis Working Paper No. 2008-036C. Available at SSRN: http://ssrn.com/abstract=1286106 Blume, M.E., Lim, F., MacKinlay, A.C., 1998. The declining credit quality of US corporate debt: Myth or reality? Journal of Finance 53, 1389–1413. Bolton, Patrick, Xavier Freixas and Joel Shapiro, 2008, The Credit Ratings Game, Working Paper, Princeton University. Boot, Arnoud, Todd Milbourn and Anjolein Schmeits, 2006, Credit Ratings as Coordinating Mechanisms, Review of Financial Studies, 19, 81-118. Case, Karl and Robert Shiller, 1989, The Efficiency of the Market for Single-Family Homes, American Economic Review, 79(1): 125-137. Coval, Joshua, Jakub Jurek, and Erik Stafford. 2009. The Economics of Structured Finance. Journal of Economic Perspectives, 23(1): 3–25. Faure-Grimaud, Antoine, Eloic Peyrache and Lucia Quesada, 2007, The Ownership of Ratings, Working Paper, Financial Markets Group, London School of Economics. Fons, Jerry, 2008, White Paper on Rating Competition and Structured Finance, January 10. Gorton, Gary, 2008, The Panic of 2007, NBER Working Paper 14358. Griffin, John and Dragon Tang, 2009, Did Subjectivity Play a Role in CDO Credit Ratings? Working Paper, UT-Austin. Kisgen, Darren J. and Philip E. Strahan, 2009, Do Regulations Based on Credit Ratings Affect a Firm’s Cost of Capital? Working Paper, Boston College. Mason, Joseph and Joshua Rosner, 2007, Where Did the Risk Go? How Misapplied Bond Ratings Cause Mortgage Backed Securities and Collateralized Debt Obligation Market Disruptions, SSRN Working Paper No. 1027475.

32
Mathis, Jerome, Jamie McAndrews and Jean-Charles Rochet, 2008, Rating the Raters: Are Reputation Concerns Powerful Enough to Discipline Rating Agencies? Working Paper, Federal Reserve Bank of New York. Mian, Atif and Amir Sufi, 2007, The Consequences of Mortgage Credit Expansion: Evidence from the 2007 Mortgage Default Crisis, Working Paper, University of Chicago. Moody’s, 1999, The Evolving Meaning Of Moody’s Bond Ratings, Moody’s Investor Services Global Credit Research. Nadauld, Taylor and Shane Sherlund, 2008, The Role of the Securitization Process in the Expansion of Subprime Credit, Working Paper. Rajan, Uday, Seru, Amit and Vig, Vikrant,The Failure of Models that Predict Failure: Distance, Incentives and Defaults(December 15, 2008). Chicago GSB Research Paper No. 08-19; Ross School of Business Paper No. 1122. Available at SSRN: http://ssrn.com/abstract=1296982 Sargent, Thomas J., 1987, Rational Expectations, The New Palgrave: A Dictionary of Economics, 4, 76-79. Skreta, Vasiliki and Laura Veldkamp, 2008, Rating Shopping and Asset Complexity: A Theory of Ratings Inflation, Working Paper. Standard and Poor’s, 2007, Principles-based Rating Methodology for Global Structured Finance Securities, Standard and Poor’s Ratings Direct Research, New York, May. Stanton, Richard and Nancy Wallace, 2009, The Bear’s Lair: Indexed Credit Default Swaps and the Subprime Mortgage Crisis, Working Paper, University of California at Berkeley.
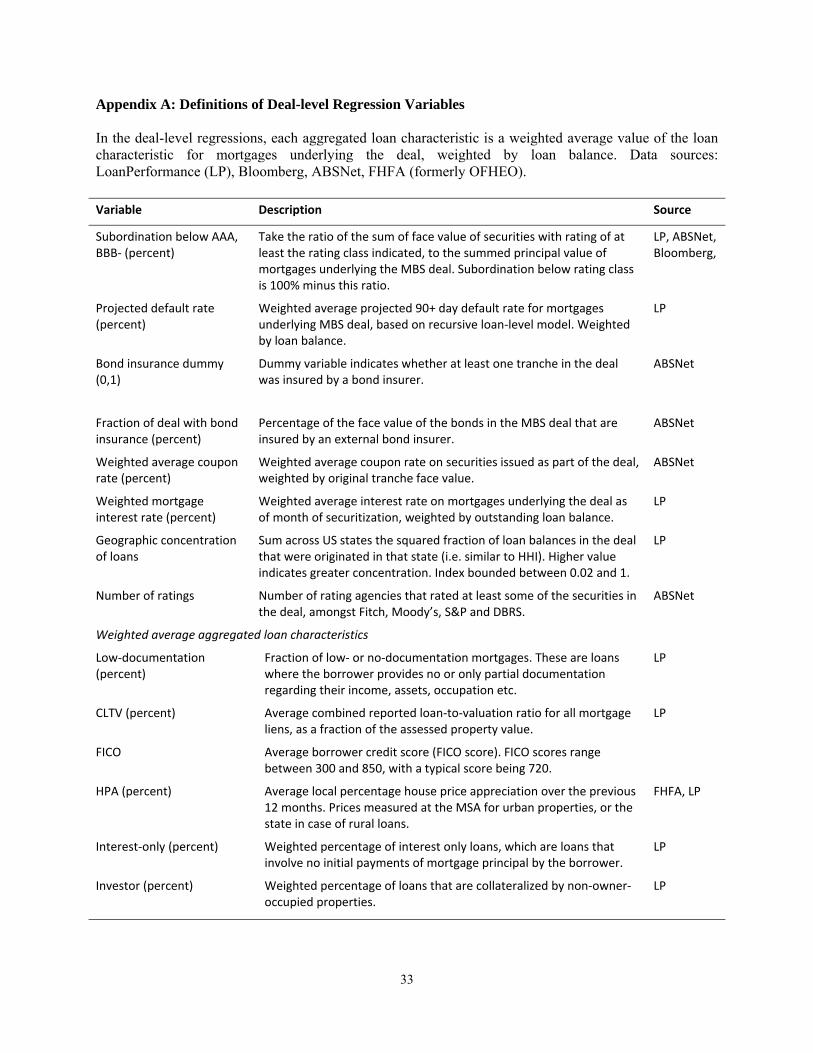
33
Appendix A: Definitions of Deal-level Regression Variables In the deal-level regressions, each aggregated loan characteristic is a weighted average value of the loan characteristic for mortgages underlying the deal, weighted by loan balance. Data sources: LoanPerformance (LP), Bloomberg, ABSNet, FHFA (formerly OFHEO). Variable Description Source
Subordination below AAA, BBB‐ (percent)
Take the ratio of the sum of face value of securities with rating of at least the rating class indicated, to the summed principal value of mortgages underlying the MBS deal. Subordination below rating class is 100% minus this ratio.
LP, ABSNet, Bloomberg,
Projected default rate (percent)
Weighted average projected 90+ day default rate for mortgages underlying MBS deal, based on recursive loan‐level model. Weighted by loan balance.
LP
Bond insurance dummy (0,1)
Dummy variable indicates whether at least one tranche in the deal was insured by a bond insurer.
ABSNet
Fraction of deal with bond insurance (percent)
Percentage of the face value of the bonds in the MBS deal that are insured by an external bond insurer.
ABSNet
Weighted average coupon rate (percent)
Weighted average coupon rate on securities issued as part of the deal, weighted by original tranche face value.
ABSNet
Weighted mortgage interest rate (percent)
Weighted average interest rate on mortgages underlying the deal as of month of securitization, weighted by outstanding loan balance.
LP
Geographic concentration of loans
Sum across US states the squared fraction of loan balances in the deal that were originated in that state (i.e. similar to HHI). Higher value indicates greater concentration. Index bounded between 0.02 and 1.
LP
Number of ratings Number of rating agencies that rated at least some of the securities in the deal, amongst Fitch, Moody’s, S&P and DBRS.
ABSNet
Weighted average aggregated loan characteristics
Low‐documentation (percent)
Fraction of low‐ or no‐documentation mortgages. These are loans where the borrower provides no or only partial documentation regarding their income, assets, occupation etc.
LP
CLTV (percent) Average combined reported loan‐to‐valuation ratio for all mortgage liens, as a fraction of the assessed property value.
LP
FICO Average borrower credit score (FICO score). FICO scores range between 300 and 850, with a typical score being 720.
HPA (percent) Average local percentage house price appreciation over the previous 12 months. Prices measured at the MSA for urban properties, or the state in case of rural loans.
FHFA, LP
Interest‐only (percent) Weighted percentage of interest only loans, which are loans that involve no initial payments of mortgage principal by the borrower.
LP
Investor (percent) Weighted percentage of loans that are collateralized by non‐owner‐occupied properties.
LP

34
Appendix B: Dataset construction Our empirical analysis is based on a novel dataset that combines loan-level and security level information matched with house price and macroeconomic data. It is created by linking data from several sources6: LoanPerformance LoanPerformance (LP) is provided by FirstAmerican CoreLogic and contains loan-level data on the characteristics and ex-post payment performance of securitized subprime and Alt-A mortgages. (A separate dataset contains information on prime jumbo mortgages, although we do not make use of that data in this paper). LP is the leading industry dataset of its type, and is widely used by investors, servicers, regulators and other industry participants. Data is collected from over 20 of the largest non-prime servicers. LoanPerformance claims a market coverage of 93% of active nonprime deals. Coverage is somewhat lower in the earlier part of our sample, as documented in Figure 3 in the main text. As well as loan-level data, LoanPerformance provides a deal identifier which allows us to aggregate the loans by issued deal. We also make use of a concordance provided by LoanPerformance between the LP deal identifiers and security CUSIPs, which permits a one-to-many merge between LP deals and the CUSIPs that make up the deal. ABSNet ABSNet is a product of Lewtan Technologies, a subsidiary of Standard & Poor’s. It provides tranche, deal, ratings and performance data on a wide range of asset-backed securities (ABS). ABSNet’s data on initial security and deal characteristics is predominately drawn from prospectuses filed by issuers. ABSNet has very comprehensive coverage of non-agency Residential Mortgage Backed Securities (RMBS) deals, covering 10,144 deals issued between 1990 and 2008. Bloomberg We supplement our ABSNet security-level data with information from Bloomberg downloads. Most importantly, Bloomberg provides some additional information relative to ABSNet about the cash flow characteristics of individual securities, allowing us to correctly calculate subordination on each deal by screening out cases where we would otherwise double-count securities. This is detailed further below. Macroeconomic data: home prices and unemployment Based on the zip-code identifier in LP, each loan is matched to purchase-only house price index data from the Federal Home Financing Agency (FHFA, formerly OFHEO). We first match to a MSA-level price index. If the zip code is not part of an MSA, it is matched to the state-level purchase only FHFA house price index. In a few cases where neither MSA- or state-level matching is possible, we use the national FHFA index. We also match each loan to state-level unemployment data. Merge Procedure This section describes the main steps involved in cleaning and matching the different datasets to create our final merged security-loan-level dataset. Step 1: Bloomberg preparation
6 The structure of our dataset is in many respects similar to the one independently developed by Nadauld and Sherlund (2009), whose analysis is based on a sample of 1,267 subprime deals from 1997-2007 matched with loan-level data from LoanPerformance.

35
We first extract all security-level from Bloomberg for non-agency RMBS, which we identify as securities which are not flagged as “Agency Backed”, and which have tickers that match either “RES B/C”, “HOMEEQ”, or “HELOC.” We also drop tranches identified as “SC” or “STRUCTURED COLLATERAL”, and deals with trust names ending in “I”, “X”, “A” or “W”. Our advice from Bloomberg and understanding of these deals is that these are duplicates of cash deals, or deals collateralized by structured securities rather than directly by mortgage loans. Consistent with this, none of these deals are linked to cash collateral via the security-level concordance provided to us by LoanPerformance. This produces a dataset with 157,993 tranches and 10,143 deals. (This is an overestimate of our population, because given the way Bloomberg defines security classes, many of these relate to prime-jumbo or agency MBS deals.) Step 2: ABSNet preparation Security-level data is collected from ABSNet for tranches listed in the “Home Equity” or “Residential MBS” asset class. Fields include face value, coupon, CUSIP identifier, and the history of security credit ratings from each of Moody’s, S&P, Fitch and/or DBRS, as available. ABSNet data contains 123,006 tranches and 9,114 deals. We determine the credit ratings at origination by identifying the earliest rating on a tranche within this history. We alWe convert ratings across different CRAs into an equivalent scale using a standard conversion scale also employed in Morgan (2002), Benmelech and Dlugosz (2009) and other papers (e.g. AAA = Aaa = 1, AA+ = Aa1 = 2 and so on). Note that one of our variables of interest is the security coupon rate. Some securities have a fixed coupon rate, but most have a floating rate. Since the coupon rate on these securities is generally quoted as a spread to Libor, we recover the coupon by adding back the six-month Libor rate as of the issuance data. When calculating the coupon rate of each security, in a few cases, the origination tranche coupon is not available in ABSNet. For these tranches, we use the earliest available coupon from ABSNet, so long as the date of the coupon is within two quarters of the origination date. Otherwise, we estimate the margin on the tranche by differencing the six month Libor rate as of the date of the coupon, and then estimate the original coupon by adding the six month Libor at the date of deal origination. Step 3: Estimate loan-level model and estimate projected default probabilities, using LP As described in the text, we use a 10% sample of the LoanPerformance data to recursively estimate the probability that a given loan will be seriously delinquent after a year. We then apply these coefficients to each loan in the LoanPerformance sample. Step 4: Aggregate LP loan-level data to the deal level We now aggregate LP data to the deal level, using the identifiers provided in the dataset. We aggregate the projected default probabilities, as well as summary statistics for characteristics of the mortgages underlying each deal, which are used in our empirical analysis. When collapsing to the deal level, each variable is weighted by the closing loan balance as of the date of securitization, i.e. according to the following formula:
∑ , _
∑ _
Step 5: Merge the data and drop negative amortization deals We then merge the Bloomberg, ABSNet, and aggregated LP together by security identifier (i.e. by CUSIP). We assume that Bloomberg has the maximum coverage of the MBS universe of tranches, and so we first require that any deal in the final dataset has tranche info from Bloomberg. Second, we eliminate
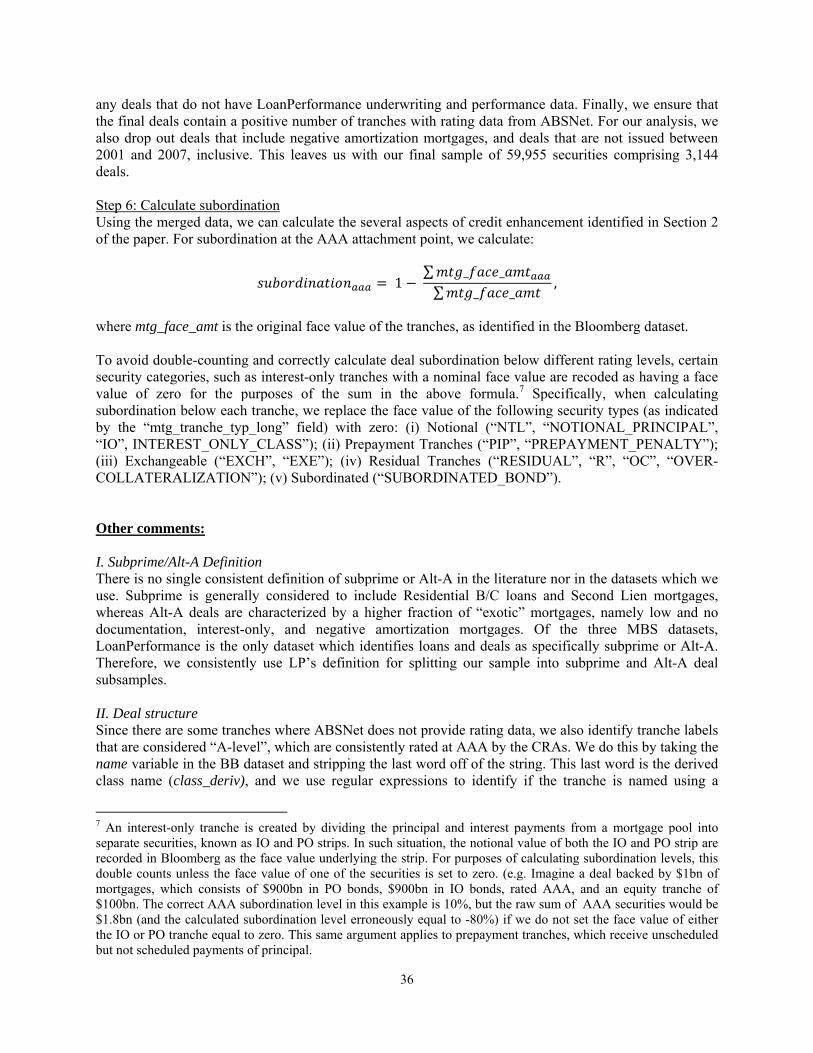
36
any deals that do not have LoanPerformance underwriting and performance data. Finally, we ensure that the final deals contain a positive number of tranches with rating data from ABSNet. For our analysis, we also drop out deals that include negative amortization mortgages, and deals that are not issued between 2001 and 2007, inclusive. This leaves us with our final sample of 59,955 securities comprising 3,144 deals. Step 6: Calculate subordination Using the merged data, we can calculate the several aspects of credit enhancement identified in Section 2 of the paper. For subordination at the AAA attachment point, we calculate:
1 ∑ _ _
∑ _ _,
where mtg_face_amt is the original face value of the tranches, as identified in the Bloomberg dataset. To avoid double-counting and correctly calculate deal subordination below different rating levels, certain security categories, such as interest-only tranches with a nominal face value are recoded as having a face value of zero for the purposes of the sum in the above formula.7 Specifically, when calculating subordination below each tranche, we replace the face value of the following security types (as indicated by the “mtg_tranche_typ_long” field) with zero: (i) Notional (“NTL”, “NOTIONAL_PRINCIPAL”, “IO”, INTEREST_ONLY_CLASS”); (ii) Prepayment Tranches (“PIP”, “PREPAYMENT_PENALTY”); (iii) Exchangeable (“EXCH”, “EXE”); (iv) Residual Tranches (“RESIDUAL”, “R”, “OC”, “OVER-COLLATERALIZATION”); (v) Subordinated (“SUBORDINATED_BOND”). Other comments: I. Subprime/Alt-A Definition There is no single consistent definition of subprime or Alt-A in the literature nor in the datasets which we use. Subprime is generally considered to include Residential B/C loans and Second Lien mortgages, whereas Alt-A deals are characterized by a higher fraction of “exotic” mortgages, namely low and no documentation, interest-only, and negative amortization mortgages. Of the three MBS datasets, LoanPerformance is the only dataset which identifies loans and deals as specifically subprime or Alt-A. Therefore, we consistently use LP’s definition for splitting our sample into subprime and Alt-A deal subsamples. II. Deal structure Since there are some tranches where ABSNet does not provide rating data, we also identify tranche labels that are considered “A-level”, which are consistently rated at AAA by the CRAs. We do this by taking the name variable in the BB dataset and stripping the last word off of the string. This last word is the derived class name (class_deriv), and we use regular expressions to identify if the tranche is named using a
7 An interest-only tranche is created by dividing the principal and interest payments from a mortgage pool into separate securities, known as IO and PO strips. In such situation, the notional value of both the IO and PO strip are recorded in Bloomberg as the face value underlying the strip. For purposes of calculating subordination levels, this double counts unless the face value of one of the securities is set to zero. (e.g. Imagine a deal backed by $1bn of mortgages, which consists of $900bn in PO bonds, $900bn in IO bonds, rated AAA, and an equity tranche of $100bn. The correct AAA subordination level in this example is 10%, but the raw sum of AAA securities would be $1.8bn (and the calculated subordination level erroneously equal to -80%) if we do not set the face value of either the IO or PO tranche equal to zero. This same argument applies to prepayment tranches, which receive unscheduled but not scheduled payments of principal.
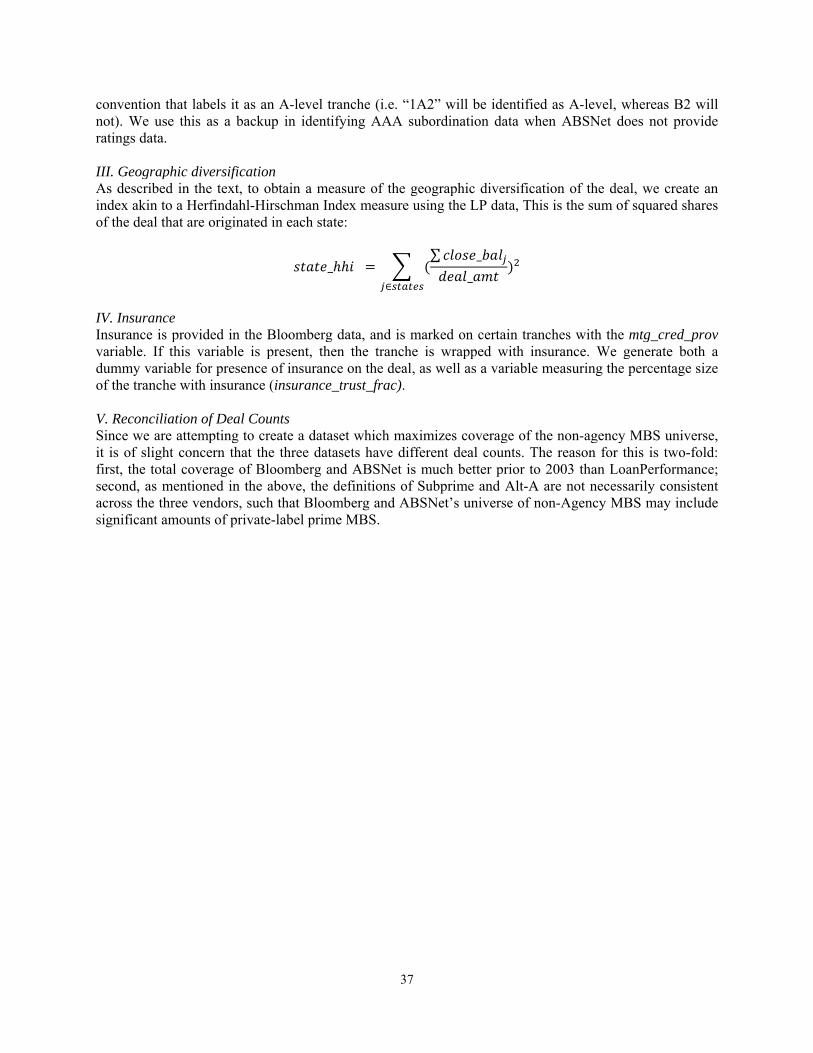
37
convention that labels it as an A-level tranche (i.e. “1A2” will be identified as A-level, whereas B2 will not). We use this as a backup in identifying AAA subordination data when ABSNet does not provide ratings data. III. Geographic diversification As described in the text, to obtain a measure of the geographic diversification of the deal, we create an index akin to a Herfindahl-Hirschman Index measure using the LP data, This is the sum of squared shares of the deal that are originated in each state:
_ ∑ _
_
IV. Insurance Insurance is provided in the Bloomberg data, and is marked on certain tranches with the mtg_cred_prov variable. If this variable is present, then the tranche is wrapped with insurance. We generate both a dummy variable for presence of insurance on the deal, as well as a variable measuring the percentage size of the tranche with insurance (insurance_trust_frac). V. Reconciliation of Deal Counts Since we are attempting to create a dataset which maximizes coverage of the non-agency MBS universe, it is of slight concern that the three datasets have different deal counts. The reason for this is two-fold: first, the total coverage of Bloomberg and ABSNet is much better prior to 2003 than LoanPerformance; second, as mentioned in the above, the definitions of Subprime and Alt-A are not necessarily consistent across the three vendors, such that Bloomberg and ABSNet’s universe of non-Agency MBS may include significant amounts of private-label prime MBS.
38
Figure 1: Credit rating downgrades by vintage Figure plots average net nonprime MBS ratings revisions by calendar quarter of deal issuance. Covers subprime and Alt-A deals in our sample issued between Q1:2001 and Q4:2007. Y-axis measures the average net number of rating notches that securities issued in calendar quarter have been downgraded between issuance and August 2009, weighted by security original face value. [e.g. A security downgraded from AA+ to A- is recorded with a value of +5 since the security has been downgraded by five notches: from AA+ to AA, AA-, A+, A, A-.] A negative value means securities have on average been upgraded since issuance. For securities with multiple ratings, the net rating change is a simple average across ratings. Moody’s ratings are based on a 21-notch scale (Aaa to C), while ratings for S&P, Fitch and DBRS are based on a 22-notch scale (AAA to D). Vertical lines correspond to the period Q1:2005 to Q2:2007, the period of peak MBS deal flow.
05
10
2001q1 2003q1 2005q1 2007q1 2001q1 2003q1 2005q1 2007q1
Alt-A Subprime
Ne
t rat
ing
dow
ngr
ade
(no
tch
es)
Calendar quarter of deal securitization
39
Figure 2: Structure of a non-agency MBS deal In a typical non-agency MBS deal, individual mortgages are combined into one or more pools inside a bankruptcy-remote special purpose vehicle known as a REMIC trust. Mortgage-backed securities are then issued with claims to the cash flows of these mortgage pools. MBS deals have a “senior-subordinated structure” which means securities are ordered in terms of seniority with respect to principal payments on mortgages held in the trust. A deal refers to the set of securities issued against the collateral of a particular REMIC trust, while a tranche or bond refers to an individual security issued by the trust. Although the diagram depicts only a single AAA security, usually there will be multiple AAA tranches, which together form the A-class of the deal. A typical deal contains 15-20 tranches in total.
Source: Moody’s.
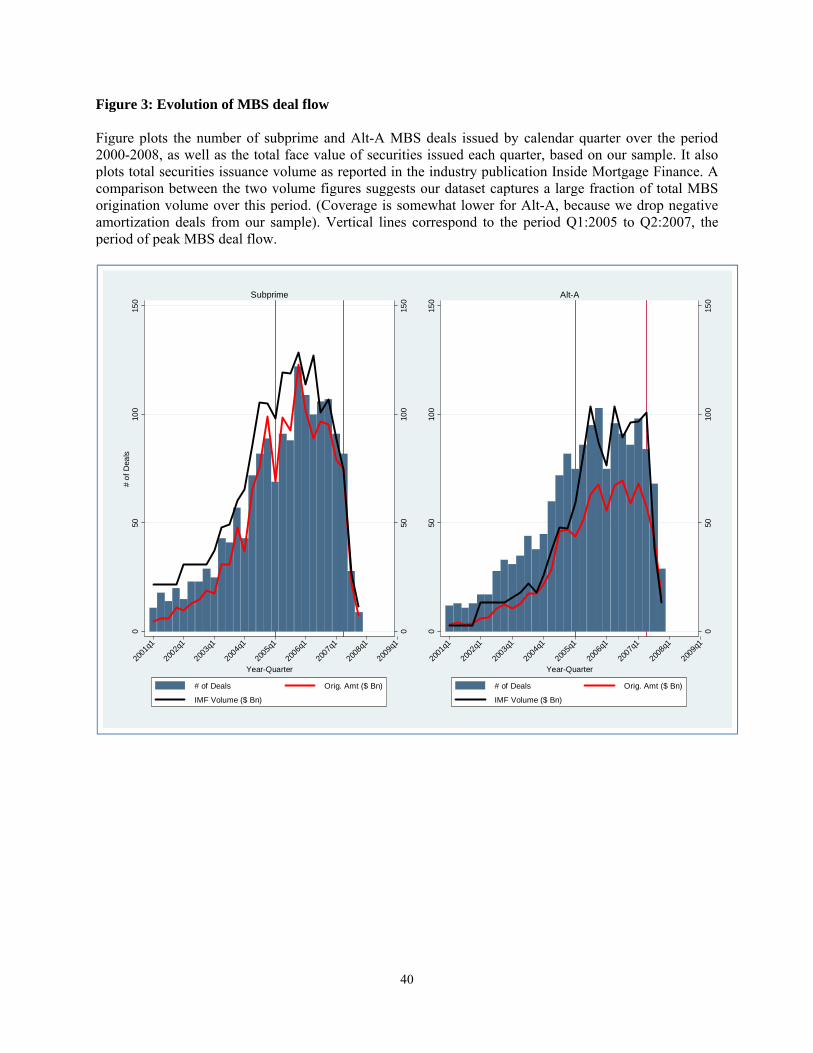
40
Figure 3: Evolution of MBS deal flow Figure plots the number of subprime and Alt-A MBS deals issued by calendar quarter over the period 2000-2008, as well as the total face value of securities issued each quarter, based on our sample. It also plots total securities issuance volume as reported in the industry publication Inside Mortgage Finance. A comparison between the two volume figures suggests our dataset captures a large fraction of total MBS origination volume over this period. (Coverage is somewhat lower for Alt-A, because we drop negative amortization deals from our sample). Vertical lines correspond to the period Q1:2005 to Q2:2007, the period of peak MBS deal flow.
050
100
150
050
100
150
# o
f D
eals
2001
q1
2002
q1
2003
q1
2004
q1
2005
q1
2006
q1
2007
q1
2008
q1
2009
q1
Year-Quarter
# of Deals Orig. Amt ($ Bn)
IMF Volume ($ Bn)
Subprime
050
100
150
050
100
150
2001
q1
2002
q1
2003
q1
2004
q1
2005
q1
2006
q1
2007
q1
2008
q1
2009
q1
Year-Quarter
# of Deals Orig. Amt ($ Bn)
IMF Volume ($ Bn)
Alt-A
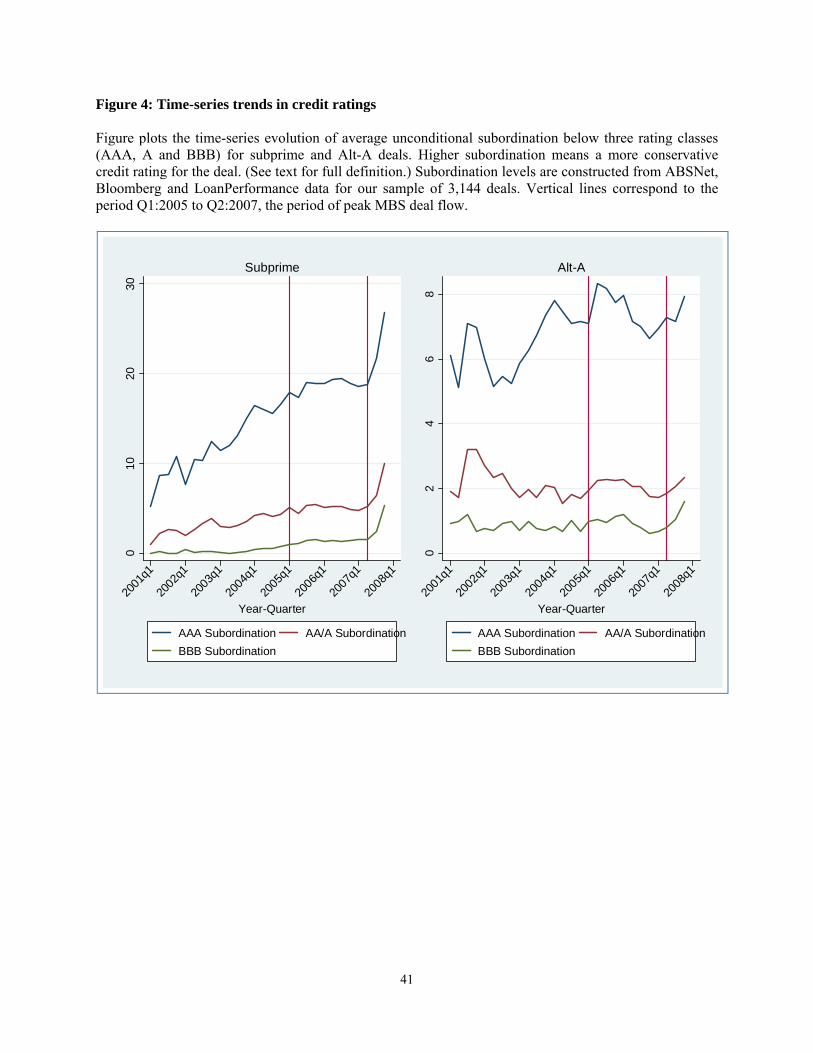
41
Figure 4: Time-series trends in credit ratings Figure plots the time-series evolution of average unconditional subordination below three rating classes (AAA, A and BBB) for subprime and Alt-A deals. Higher subordination means a more conservative credit rating for the deal. (See text for full definition.) Subordination levels are constructed from ABSNet, Bloomberg and LoanPerformance data for our sample of 3,144 deals. Vertical lines correspond to the period Q1:2005 to Q2:2007, the period of peak MBS deal flow.
010
2030
2001
q1
2002
q1
2003
q1
2004
q1
2005
q1
2006
q1
2007
q1
2008
q1
Year-Quarter
AAA Subordination AA/A Subordination
BBB Subordination
Subprime
02
46
8
2001
q1
2002
q1
2003
q1
2004
q1
2005
q1
2006
q1
2007
q1
2008
q1
Year-Quarter
AAA Subordination AA/A Subordination
BBB Subordination
Alt-A
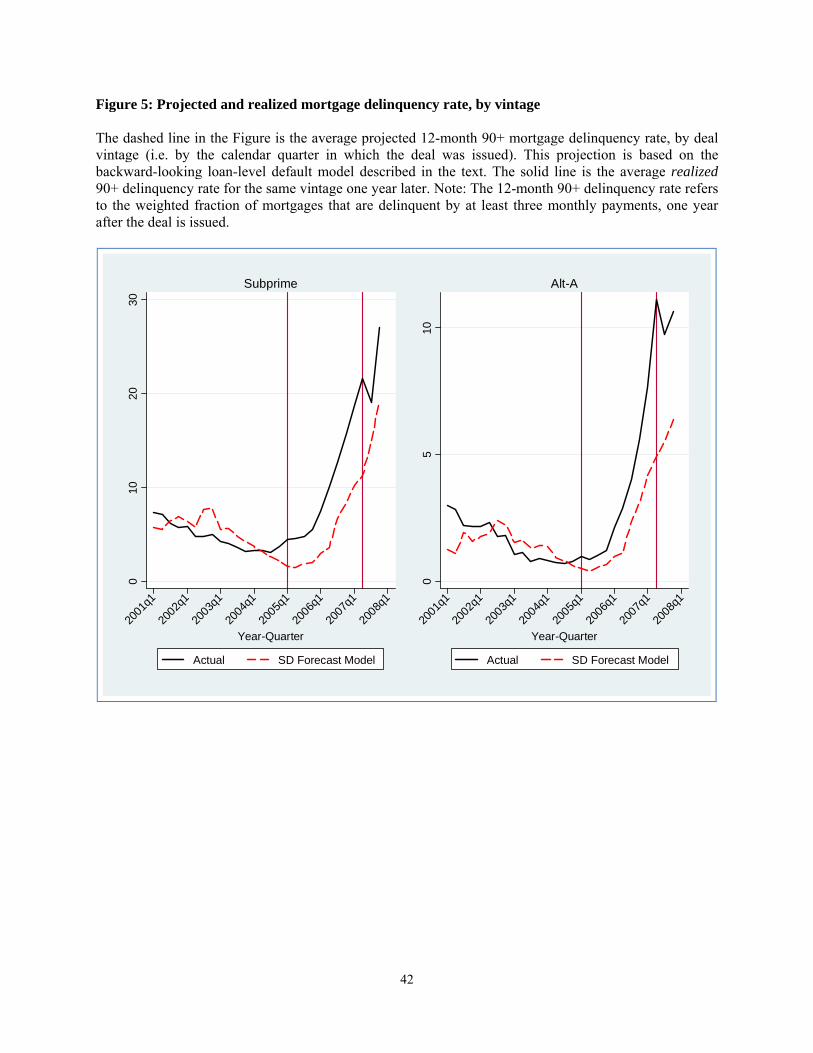
42
Figure 5: Projected and realized mortgage delinquency rate, by vintage The dashed line in the Figure is the average projected 12-month 90+ mortgage delinquency rate, by deal vintage (i.e. by the calendar quarter in which the deal was issued). This projection is based on the backward-looking loan-level default model described in the text. The solid line is the average realized 90+ delinquency rate for the same vintage one year later. Note: The 12-month 90+ delinquency rate refers to the weighted fraction of mortgages that are delinquent by at least three monthly payments, one year after the deal is issued.
010
2030
2001
q1
2002
q1
2003
q1
2004
q1
2005
q1
2006
q1
2007
q1
2008
q1
Year-Quarter
Actual SD Forecast Model
Subprime
05
10
2001
q1
2002
q1
2003
q1
2004
q1
2005
q1
2006
q1
2007
q1
2008
q1
Year-Quarter
Actual SD Forecast Model
Alt-A
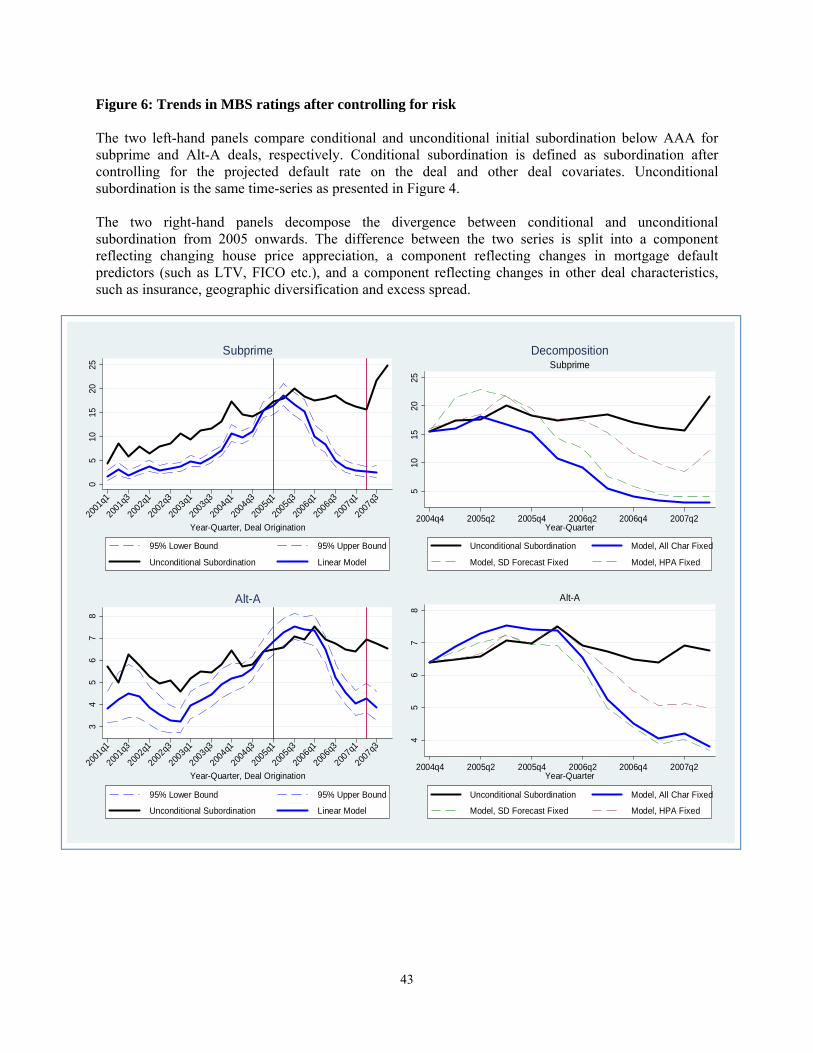
43
Figure 6: Trends in MBS ratings after controlling for risk The two left-hand panels compare conditional and unconditional initial subordination below AAA for subprime and Alt-A deals, respectively. Conditional subordination is defined as subordination after controlling for the projected default rate on the deal and other deal covariates. Unconditional subordination is the same time-series as presented in Figure 4. The two right-hand panels decompose the divergence between conditional and unconditional subordination from 2005 onwards. The difference between the two series is split into a component reflecting changing house price appreciation, a component reflecting changes in mortgage default predictors (such as LTV, FICO etc.), and a component reflecting changes in other deal characteristics, such as insurance, geographic diversification and excess spread.
05
1015
2025
2001q
1
2001q
3
2002
q1
2002
q3
2003q
1
2003q
3
2004
q1
2004
q3
2005q
1
2005q
3
2006
q1
2006
q3
2007q
1
2007q
3
Year-Quarter, Deal Origination
95% Lower Bound 95% Upper Bound
Unconditional Subordination Linear Model
Subprime
510
1520
25
2004q4 2005q2 2005q4 2006q2 2006q4 2007q2Year-Quarter
Unconditional Subordination Model, All Char Fixed
Model, SD Forecast Fixed Model, HPA Fixed
SubprimeDecomposition
34
56
78
2001q
1
2001q
3
2002
q1
2002
q3
2003q
1
2003q
3
2004
q1
2004
q3
2005q
1
2005q
3
2006
q1
2006
q3
2007q
1
2007q
3
Year-Quarter, Deal Origination
95% Lower Bound 95% Upper Bound
Unconditional Subordination Linear Model
Alt-A
45
67
8
2004q4 2005q2 2005q4 2006q2 2006q4 2007q2Year-Quarter
Unconditional Subordination Model, All Char Fixed
Model, SD Forecast Fixed Model, HPA Fixed
Alt-A
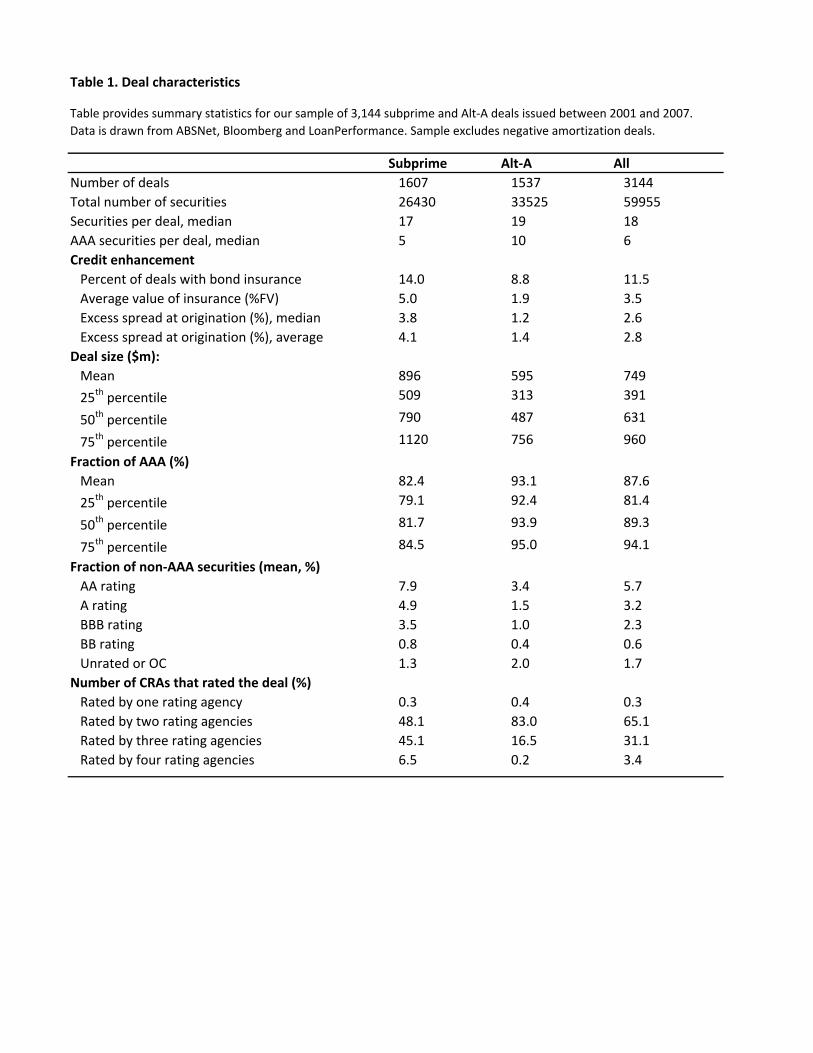
Table 1. Deal characteristics
Subprime Alt‐A All
Number of deals 1607 1537 3144
Total number of securities 26430 33525 59955
Securities per deal, median 17 19 18
AAA securities per deal, median 5 10 6
Credit enhancement
Percent of deals with bond insurance 14.0 8.8 11.5
Average value of insurance (%FV) 5.0 1.9 3.5
Excess spread at origination (%), median 3.8 1.2 2.6
Excess spread at origination (%), average 4.1 1.4 2.8
Deal size ($m):
Mean 896 595 749
25th percentile 509 313 391
50th percentile 790 487 631
75th percentile 1120 756 960
Fraction of AAA (%)
Mean 82.4 93.1 87.6
25th percentile 79.1 92.4 81.4
50th percentile 81.7 93.9 89.3
75th percentile 84.5 95.0 94.1
Fraction of non‐AAA securities (mean, %)
AA rating 7.9 3.4 5.7
A rating 4.9 1.5 3.2
BBB rating 3.5 1.0 2.3
BB rating 0.8 0.4 0.6
Unrated or OC 1.3 2.0 1.7
Number of CRAs that rated the deal (%)
Rated by one rating agency 0.3 0.4 0.3
Rated by two rating agencies 48.1 83.0 65.1
Rated by three rating agencies 45.1 16.5 31.1
Rated by four rating agencies 6.5 0.2 3.4
Table provides summary statistics for our sample of 3,144 subprime and Alt‐A deals issued between 2001 and 2007.
Data is drawn from ABSNet, Bloomberg and LoanPerformance. Sample excludes negative amortization deals.
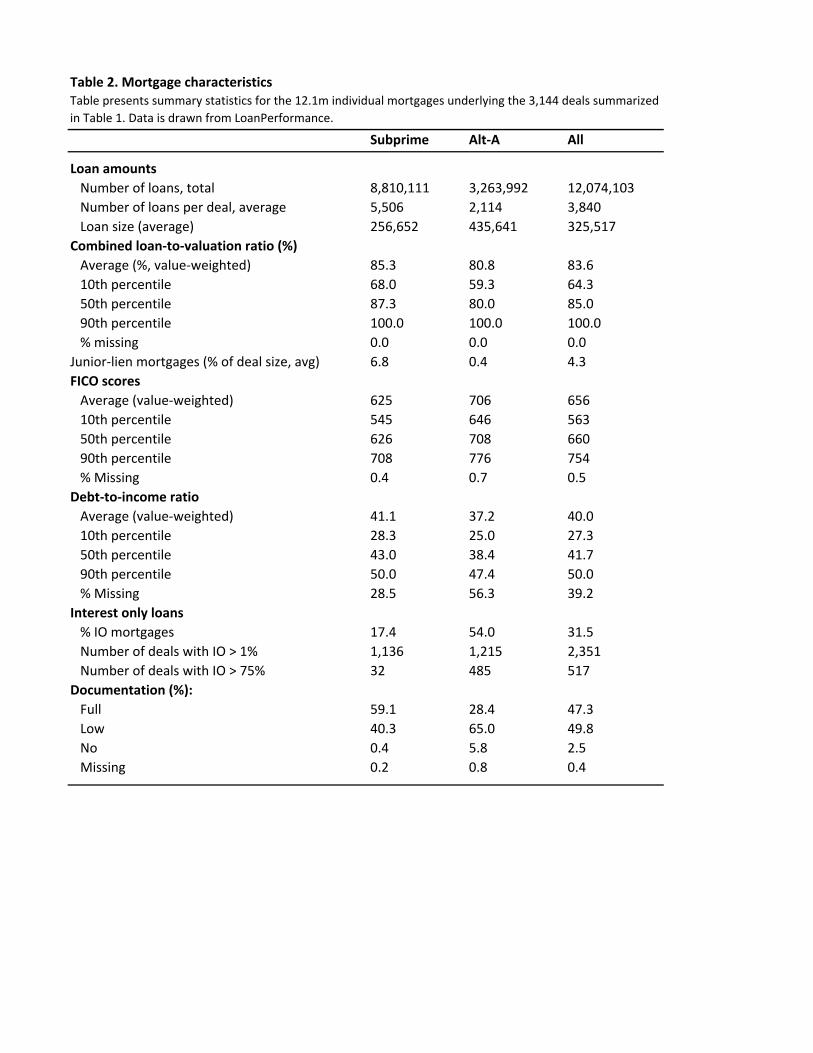
Table 2. Mortgage characteristics
Subprime Alt‐A All
Loan amounts
Number of loans, total 8,810,111 3,263,992 12,074,103
Number of loans per deal, average 5,506 2,114 3,840
Loan size (average) 256,652 435,641 325,517
Combined loan‐to‐valuation ratio (%)
Average (%, value‐weighted) 85.3 80.8 83.6
10th percentile 68.0 59.3 64.3
50th percentile 87.3 80.0 85.0
90th percentile 100.0 100.0 100.0
% missing 0.0 0.0 0.0
Junior‐lien mortgages (% of deal size, avg) 6.8 0.4 4.3
FICO scores
Average (value‐weighted) 625 706 656
10th percentile 545 646 563
50th percentile 626 708 660
90th percentile 708 776 754
% Missing 0.4 0.7 0.5
Debt‐to‐income ratio
Average (value‐weighted) 41.1 37.2 40.0
10th percentile 28.3 25.0 27.3
50th percentile 43.0 38.4 41.7
90th percentile 50.0 47.4 50.0
% Missing 28.5 56.3 39.2
Interest only loans
% IO mortgages 17.4 54.0 31.5
Number of deals with IO > 1% 1,136 1,215 2,351
Number of deals with IO > 75% 32 485 517
Documentation (%):
Full 59.1 28.4 47.3
Low 40.3 65.0 49.8
No 0.4 5.8 2.5
Missing 0.2 0.8 0.4
Table presents summary statistics for the 12.1m individual mortgages underlying the 3,144 deals summarized
in Table 1. Data is drawn from LoanPerformance.
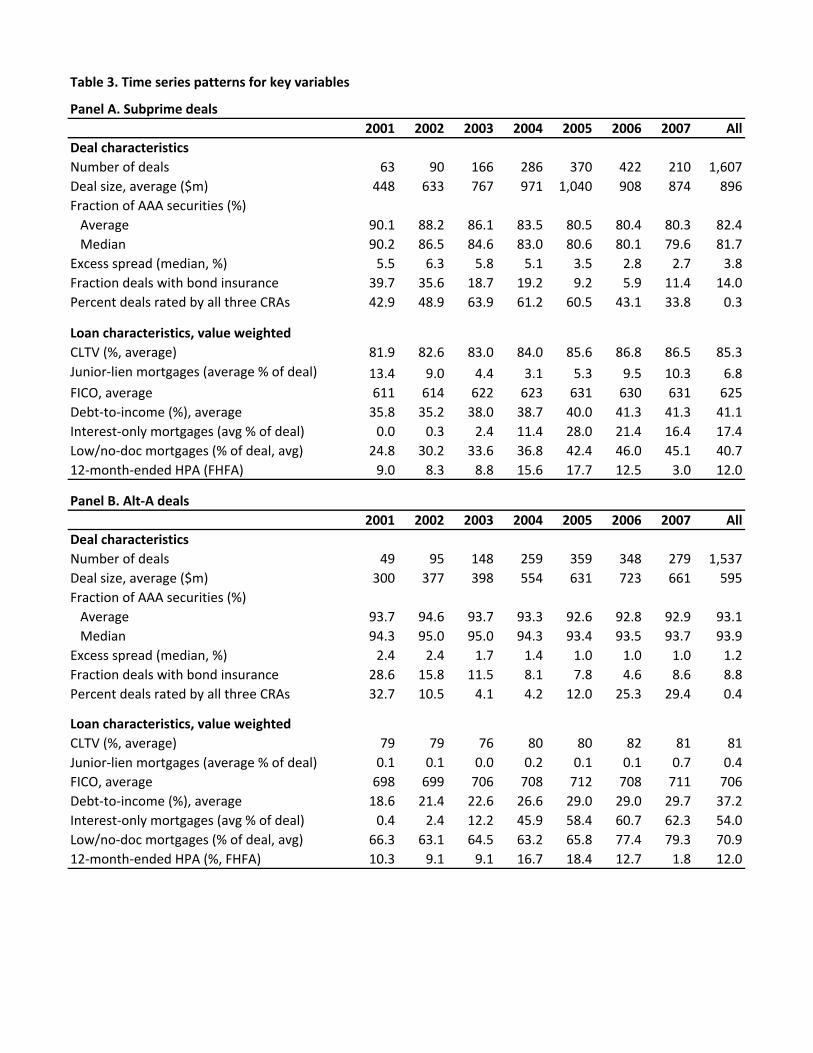
Table 3. Time series patterns for key variables
Panel A. Subprime deals
2001 2002 2003 2004 2005 2006 2007 All
Deal characteristics
Number of deals 63 90 166 286 370 422 210 1,607
Deal size, average ($m) 448 633 767 971 1,040 908 874 896
Fraction of AAA securities (%)
Average 90.1 88.2 86.1 83.5 80.5 80.4 80.3 82.4
Median 90.2 86.5 84.6 83.0 80.6 80.1 79.6 81.7
Excess spread (median, %) 5.5 6.3 5.8 5.1 3.5 2.8 2.7 3.8
Fraction deals with bond insurance 39.7 35.6 18.7 19.2 9.2 5.9 11.4 14.0
Percent deals rated by all three CRAs 42.9 48.9 63.9 61.2 60.5 43.1 33.8 0.3
Loan characteristics, value weighted
CLTV (%, average) 81.9 82.6 83.0 84.0 85.6 86.8 86.5 85.3
Junior‐lien mortgages (average % of deal) 13.4 9.0 4.4 3.1 5.3 9.5 10.3 6.8
FICO, average 611 614 622 623 631 630 631 625
Debt‐to‐income (%), average 35.8 35.2 38.0 38.7 40.0 41.3 41.3 41.1
Interest‐only mortgages (avg % of deal) 0.0 0.3 2.4 11.4 28.0 21.4 16.4 17.4
Low/no‐doc mortgages (% of deal, avg) 24.8 30.2 33.6 36.8 42.4 46.0 45.1 40.7
12‐month‐ended HPA (FHFA) 9.0 8.3 8.8 15.6 17.7 12.5 3.0 12.0
Panel B. Alt‐A deals
2001 2002 2003 2004 2005 2006 2007 All
Deal characteristics
Number of deals 49 95 148 259 359 348 279 1,537
Deal size, average ($m) 300 377 398 554 631 723 661 595
Fraction of AAA securities (%)
Average 93.7 94.6 93.7 93.3 92.6 92.8 92.9 93.1
Median 94.3 95.0 95.0 94.3 93.4 93.5 93.7 93.9
Excess spread (median, %) 2.4 2.4 1.7 1.4 1.0 1.0 1.0 1.2
Fraction deals with bond insurance 28.6 15.8 11.5 8.1 7.8 4.6 8.6 8.8
Percent deals rated by all three CRAs 32.7 10.5 4.1 4.2 12.0 25.3 29.4 0.4
Loan characteristics, value weighted
CLTV (%, average) 79 79 76 80 80 82 81 81
Junior‐lien mortgages (average % of deal) 0.1 0.1 0.0 0.2 0.1 0.1 0.7 0.4
FICO, average 698 699 706 708 712 708 711 706
Debt‐to‐income (%), average 18.6 21.4 22.6 26.6 29.0 29.0 29.7 37.2
Interest‐only mortgages (avg % of deal) 0.4 2.4 12.2 45.9 58.4 60.7 62.3 54.0
Low/no‐doc mortgages (% of deal, avg) 66.3 63.1 64.5 63.2 65.8 77.4 79.3 70.9
12‐month‐ended HPA (%, FHFA) 10.3 9.1 9.1 16.7 18.4 12.7 1.8 12.0
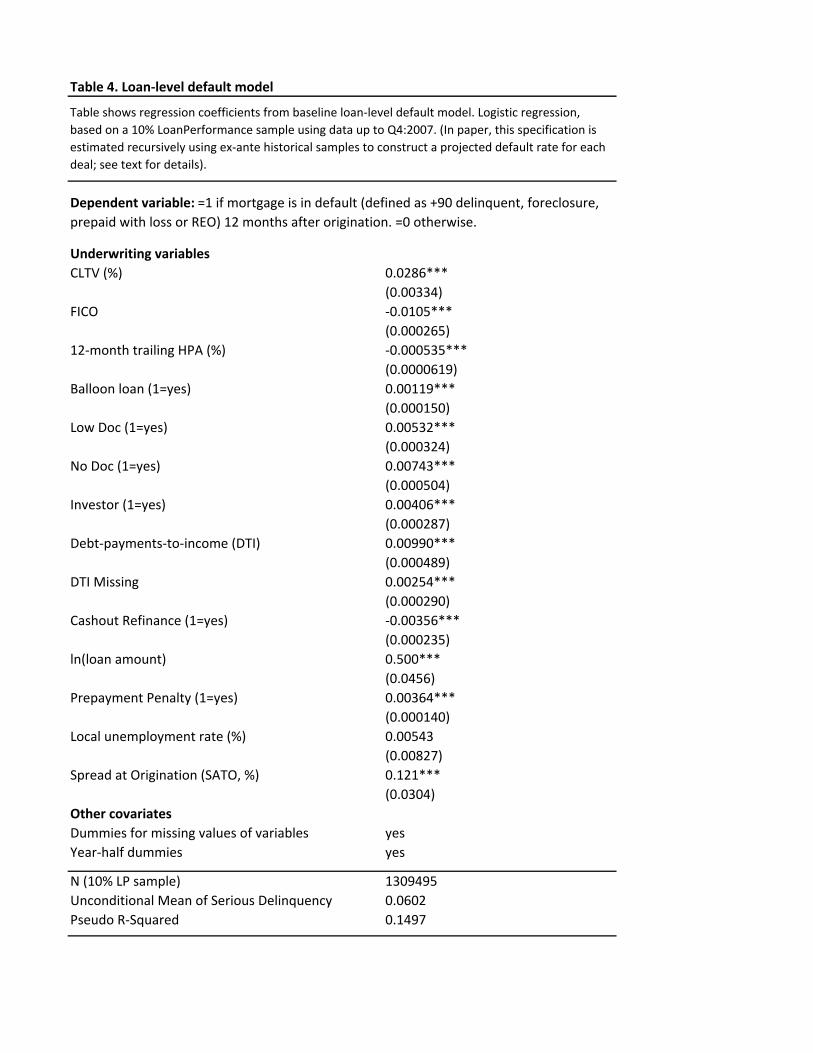
Table 4. Loan‐level default model
Underwriting variables
CLTV (%) 0.0286***
(0.00334)
FICO ‐0.0105***
(0.000265)
12‐month trailing HPA (%) ‐0.000535***
(0.0000619)
Balloon loan (1=yes) 0.00119***
(0.000150)
Low Doc (1=yes) 0.00532***
(0.000324)
No Doc (1=yes) 0.00743***
(0.000504)
Investor (1=yes) 0.00406***
(0.000287)
Debt‐payments‐to‐income (DTI) 0.00990***
(0.000489)
DTI Missing 0.00254***
(0.000290)
Cashout Refinance (1=yes) ‐0.00356***
(0.000235)
ln(loan amount) 0.500***
(0.0456)
Prepayment Penalty (1=yes) 0.00364***
(0.000140)
Local unemployment rate (%) 0.00543
(0.00827)
Spread at Origination (SATO, %) 0.121***
(0.0304)
Other covariates
Dummies for missing values of variables yes
Year‐half dummies yes
N (10% LP sample) 1309495
Unconditional Mean of Serious Delinquency 0.0602
Pseudo R‐Squared 0.1497
Table shows regression coefficients from baseline loan‐level default model. Logistic regression,
based on a 10% LoanPerformance sample using data up to Q4:2007. (In paper, this specification is
estimated recursively using ex‐ante historical samples to construct a projected default rate for each
deal; see text for details).
Dependent variable: =1 if mortgage is in default (defined as +90 delinquent, foreclosure,
prepaid with loss or REO) 12 months after origination. =0 otherwise.
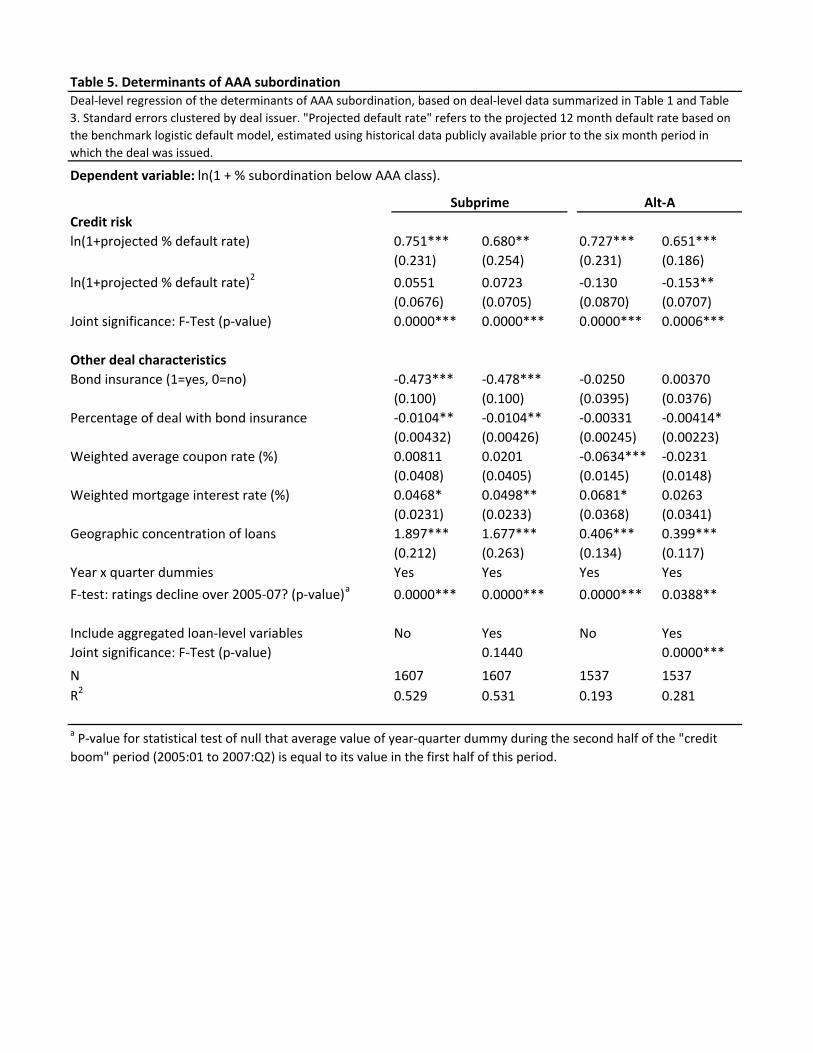
Table 5. Determinants of AAA subordination
Dependent variable: ln(1 + % subordination below AAA class).
Credit risk
ln(1+projected % default rate) 0.751*** 0.680** 0.727*** 0.651***
(0.231) (0.254) (0.231) (0.186)
ln(1+projected % default rate)2 0.0551 0.0723 ‐0.130 ‐0.153**
(0.0676) (0.0705) (0.0870) (0.0707)
Joint significance: F‐Test (p‐value) 0.0000*** 0.0000*** 0.0000*** 0.0006***
Other deal characteristics
Bond insurance (1=yes, 0=no) ‐0.473*** ‐0.478*** ‐0.0250 0.00370
(0.100) (0.100) (0.0395) (0.0376)
Percentage of deal with bond insurance ‐0.0104** ‐0.0104** ‐0.00331 ‐0.00414*
(0.00432) (0.00426) (0.00245) (0.00223)
Weighted average coupon rate (%) 0.00811 0.0201 ‐0.0634*** ‐0.0231
(0.0408) (0.0405) (0.0145) (0.0148)
Weighted mortgage interest rate (%) 0.0468* 0.0498** 0.0681* 0.0263
(0.0231) (0.0233) (0.0368) (0.0341)
Geographic concentration of loans 1.897*** 1.677*** 0.406*** 0.399***
(0.212) (0.263) (0.134) (0.117)
Year x quarter dummies Yes Yes Yes Yes
F‐test: ratings decline over 2005‐07? (p‐value)a
0.0000*** 0.0000*** 0.0000*** 0.0388**
Include aggregated loan‐level variables No Yes No Yes
Joint significance: F‐Test (p‐value) 0.1440 0.0000***
N 1607 1607 1537 1537
R2 0.529 0.531 0.193 0.281
Subprime Alt‐A
a P‐value for statistical test of null that average value of year‐quarter dummy during the second half of the "credit
boom" period (2005:01 to 2007:Q2) is equal to its value in the first half of this period.
Deal‐level regression of the determinants of AAA subordination, based on deal‐level data summarized in Table 1 and Table
3. Standard errors clustered by deal issuer. "Projected default rate" refers to the projected 12 month default rate based on
the benchmark logistic default model, estimated using historical data publicly available prior to the six month period in
which the deal was issued.
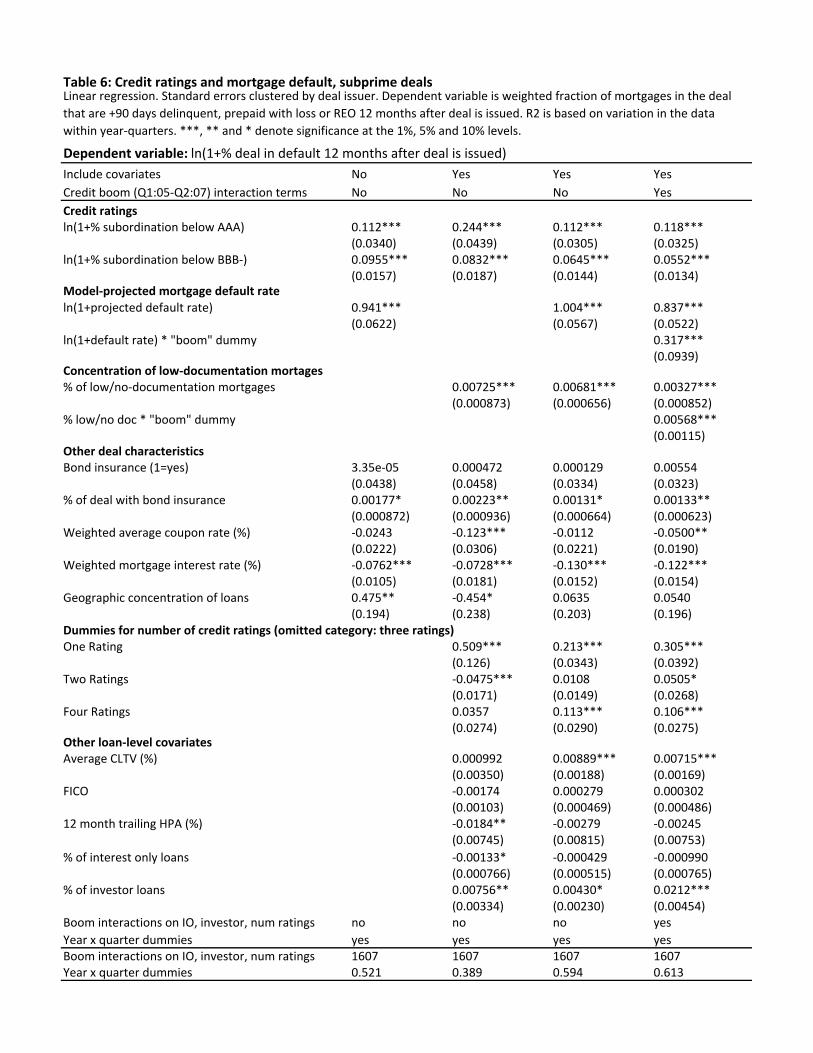
Table 6: Credit ratings and mortgage default, subprime deals
Dependent variable: ln(1+% deal in default 12 months after deal is issued)
Include covariates No Yes Yes Yes
Credit boom (Q1:05‐Q2:07) interaction terms No No No Yes
Credit ratingsln(1+% subordination below AAA) 0.112*** 0.244*** 0.112*** 0.118***
(0.0340) (0.0439) (0.0305) (0.0325)ln(1+% subordination below BBB‐) 0.0955*** 0.0832*** 0.0645*** 0.0552***
(0.0157) (0.0187) (0.0144) (0.0134)
ln(1+projected default rate) 0.941*** 1.004*** 0.837***(0.0622) (0.0567) (0.0522)
ln(1+default rate) * "boom" dummy 0.317***(0.0939)
Concentration of low‐documentation mortages% of low/no‐documentation mortgages 0.00725*** 0.00681*** 0.00327***
(0.000873) (0.000656) (0.000852)% low/no doc * "boom" dummy 0.00568***
(0.00115)Other deal characteristicsBond insurance (1=yes) 3.35e‐05 0.000472 0.000129 0.00554
(0.0438) (0.0458) (0.0334) (0.0323)% of deal with bond insurance 0.00177* 0.00223** 0.00131* 0.00133**
(0.000872) (0.000936) (0.000664) (0.000623)Weighted average coupon rate (%) ‐0.0243 ‐0.123*** ‐0.0112 ‐0.0500**
(0.0222) (0.0306) (0.0221) (0.0190)Weighted mortgage interest rate (%) ‐0.0762*** ‐0.0728*** ‐0.130*** ‐0.122***
(0.0105) (0.0181) (0.0152) (0.0154)Geographic concentration of loans 0.475** ‐0.454* 0.0635 0.0540
(0.194) (0.238) (0.203) (0.196)Dummies for number of credit ratings (omitted category: three ratings)One Rating 0.509*** 0.213*** 0.305***
(0.126) (0.0343) (0.0392)Two Ratings ‐0.0475*** 0.0108 0.0505*
(0.0171) (0.0149) (0.0268)Four Ratings 0.0357 0.113*** 0.106***
(0.0274) (0.0290) (0.0275)Other loan‐level covariatesAverage CLTV (%) 0.000992 0.00889*** 0.00715***
(0.00350) (0.00188) (0.00169)FICO ‐0.00174 0.000279 0.000302
(0.00103) (0.000469) (0.000486)12 month trailing HPA (%) ‐0.0184** ‐0.00279 ‐0.00245
(0.00745) (0.00815) (0.00753)
% of interest only loans ‐0.00133* ‐0.000429 ‐0.000990(0.000766) (0.000515) (0.000765)
% of investor loans 0.00756** 0.00430* 0.0212***(0.00334) (0.00230) (0.00454)
Boom interactions on IO, investor, num ratings no no no yes
Year x quarter dummies yes yes yes yesBoom interactions on IO, investor, num ratings 1607 1607 1607 1607Year x quarter dummies 0.521 0.389 0.594 0.613
Linear regression. Standard errors clustered by deal issuer. Dependent variable is weighted fraction of mortgages in the deal
that are +90 days delinquent, prepaid with loss or REO 12 months after deal is issued. R2 is based on variation in the data
within year‐quarters. ***, ** and * denote significance at the 1%, 5% and 10% levels.
Model‐projected mortgage default rate
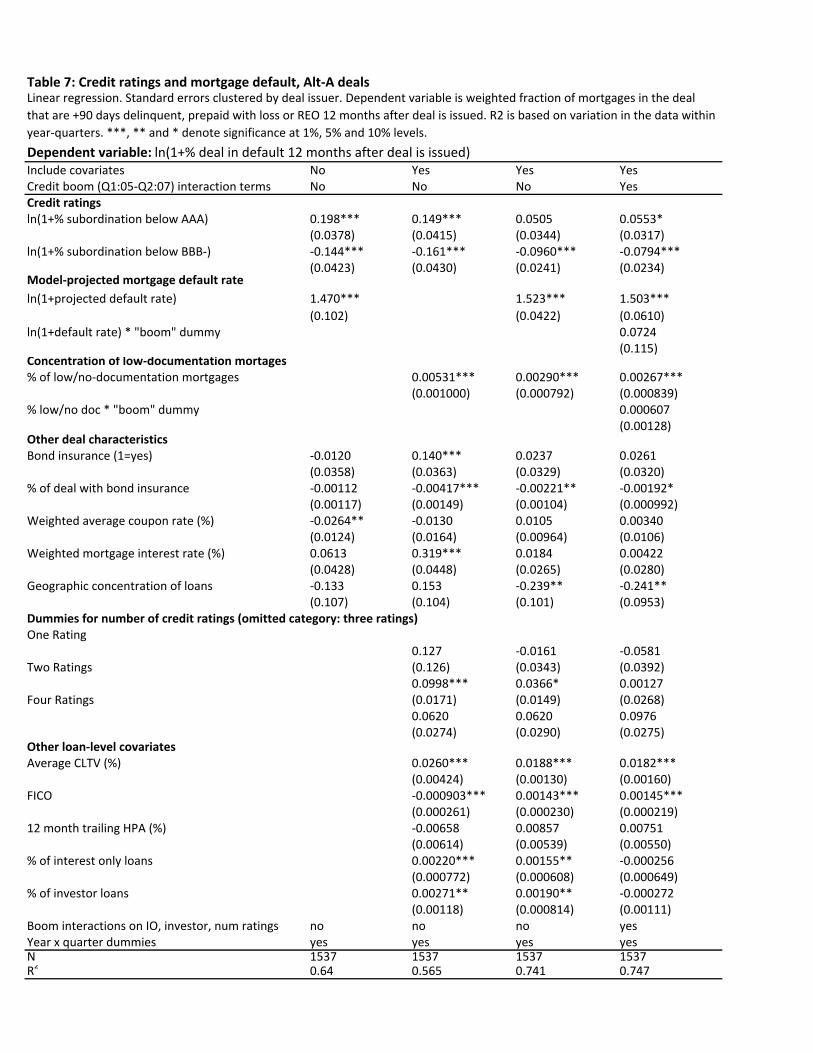
Table 7: Credit ratings and mortgage default, Alt‐A deals
Dependent variable: ln(1+% deal in default 12 months after deal is issued)Include covariates No Yes Yes YesCredit boom (Q1:05‐Q2:07) interaction terms No No No YesCredit ratingsln(1+% subordination below AAA) 0.198*** 0.149*** 0.0505 0.0553*
(0.0378) (0.0415) (0.0344) (0.0317)ln(1+% subordination below BBB‐) ‐0.144*** ‐0.161*** ‐0.0960*** ‐0.0794***
(0.0423) (0.0430) (0.0241) (0.0234)
ln(1+projected default rate) 1.470*** 1.523*** 1.503***
(0.102) (0.0422) (0.0610)ln(1+default rate) * "boom" dummy 0.0724
(0.115)Concentration of low‐documentation mortages% of low/no‐documentation mortgages 0.00531*** 0.00290*** 0.00267***
(0.001000) (0.000792) (0.000839)% low/no doc * "boom" dummy 0.000607
(0.00128)Other deal characteristicsBond insurance (1=yes) ‐0.0120 0.140*** 0.0237 0.0261
(0.0358) (0.0363) (0.0329) (0.0320)% of deal with bond insurance ‐0.00112 ‐0.00417*** ‐0.00221** ‐0.00192*
(0.00117) (0.00149) (0.00104) (0.000992)Weighted average coupon rate (%) ‐0.0264** ‐0.0130 0.0105 0.00340
(0.0124) (0.0164) (0.00964) (0.0106)Weighted mortgage interest rate (%) 0.0613 0.319*** 0.0184 0.00422
(0.0428) (0.0448) (0.0265) (0.0280)Geographic concentration of loans ‐0.133 0.153 ‐0.239** ‐0.241**
(0.107) (0.104) (0.101) (0.0953)Dummies for number of credit ratings (omitted category: three ratings)One Rating
0.127 ‐0.0161 ‐0.0581Two Ratings (0.126) (0.0343) (0.0392)
0.0998*** 0.0366* 0.00127Four Ratings (0.0171) (0.0149) (0.0268)
0.0620 0.0620 0.0976(0.0274) (0.0290) (0.0275)
Other loan‐level covariatesAverage CLTV (%) 0.0260*** 0.0188*** 0.0182***
(0.00424) (0.00130) (0.00160)FICO ‐0.000903*** 0.00143*** 0.00145***
(0.000261) (0.000230) (0.000219)12 month trailing HPA (%) ‐0.00658 0.00857 0.00751
(0.00614) (0.00539) (0.00550)% of interest only loans 0.00220*** 0.00155** ‐0.000256
(0.000772) (0.000608) (0.000649)% of investor loans 0.00271** 0.00190** ‐0.000272
(0.00118) (0.000814) (0.00111)Boom interactions on IO, investor, num ratings no no no yesYear x quarter dummies yes yes yes yesN 1537 1537 1537 1537R2 0.64 0.565 0.741 0.747
Linear regression. Standard errors clustered by deal issuer. Dependent variable is weighted fraction of mortgages in the deal
that are +90 days delinquent, prepaid with loss or REO 12 months after deal is issued. R2 is based on variation in the data within
year‐quarters. ***, ** and * denote significance at 1%, 5% and 10% levels.
Model‐projected mortgage default rate
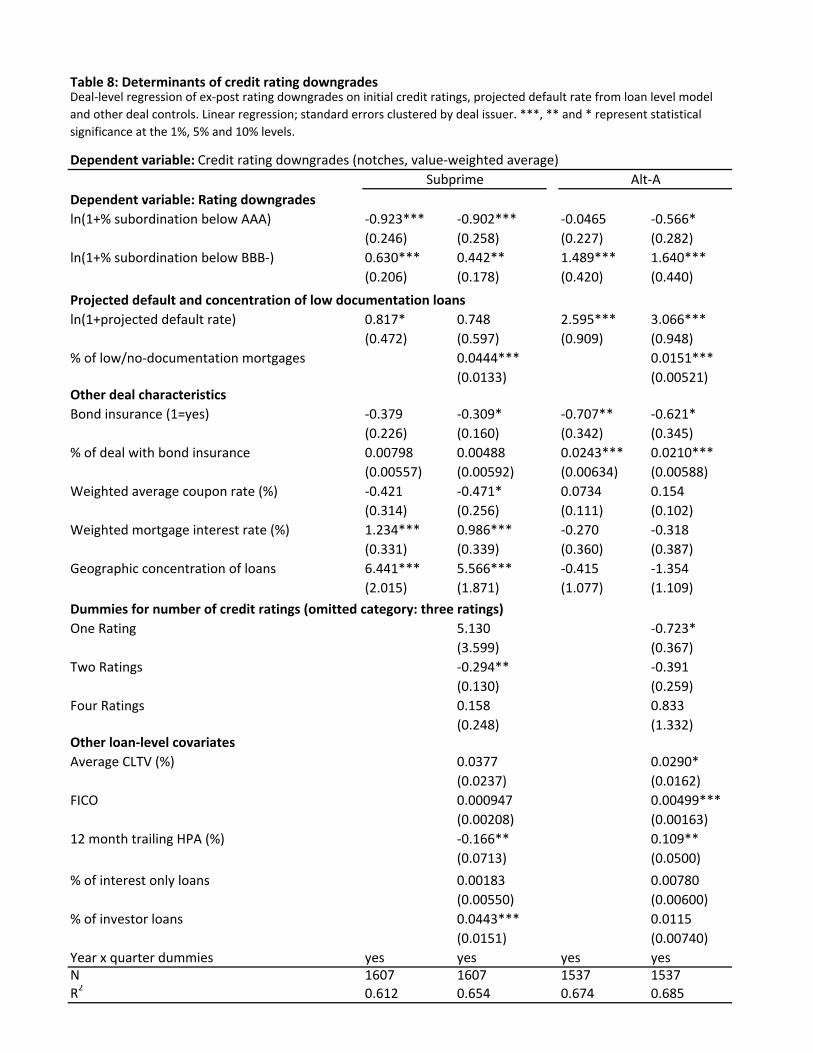
Table 8: Determinants of credit rating downgrades
Dependent variable: Credit rating downgrades (notches, value‐weighted average)
Dependent variable: Rating downgrades
ln(1+% subordination below AAA) ‐0.923*** ‐0.902*** ‐0.0465 ‐0.566*
(0.246) (0.258) (0.227) (0.282)
ln(1+% subordination below BBB‐) 0.630*** 0.442** 1.489*** 1.640***
(0.206) (0.178) (0.420) (0.440)
Projected default and concentration of low documentation loans
ln(1+projected default rate) 0.817* 0.748 2.595*** 3.066***
(0.472) (0.597) (0.909) (0.948)
% of low/no‐documentation mortgages 0.0444*** 0.0151***
(0.0133) (0.00521)Other deal characteristics
Bond insurance (1=yes) ‐0.379 ‐0.309* ‐0.707** ‐0.621*
(0.226) (0.160) (0.342) (0.345)
% of deal with bond insurance 0.00798 0.00488 0.0243*** 0.0210***
(0.00557) (0.00592) (0.00634) (0.00588)
Weighted average coupon rate (%) ‐0.421 ‐0.471* 0.0734 0.154
(0.314) (0.256) (0.111) (0.102)
Weighted mortgage interest rate (%) 1.234*** 0.986*** ‐0.270 ‐0.318
(0.331) (0.339) (0.360) (0.387)
Geographic concentration of loans 6.441*** 5.566*** ‐0.415 ‐1.354
(2.015) (1.871) (1.077) (1.109)
Dummies for number of credit ratings (omitted category: three ratings)
One Rating 5.130 ‐0.723*
(3.599) (0.367)
Two Ratings ‐0.294** ‐0.391
(0.130) (0.259)
Four Ratings 0.158 0.833
(0.248) (1.332)Other loan‐level covariates
Average CLTV (%) 0.0377 0.0290*
(0.0237) (0.0162)
FICO 0.000947 0.00499***
(0.00208) (0.00163)
12 month trailing HPA (%) ‐0.166** 0.109**
(0.0713) (0.0500)
% of interest only loans 0.00183 0.00780
(0.00550) (0.00600)
% of investor loans 0.0443*** 0.0115
(0.0151) (0.00740)
Year x quarter dummies yes yes yes yesN 1607 1607 1537 1537R2 0.612 0.654 0.674 0.685
Subprime Alt‐A
Deal‐level regression of ex‐post rating downgrades on initial credit ratings, projected default rate from loan level model
and other deal controls. Linear regression; standard errors clustered by deal issuer. ***, ** and * represent statistical
significance at the 1%, 5% and 10% levels.
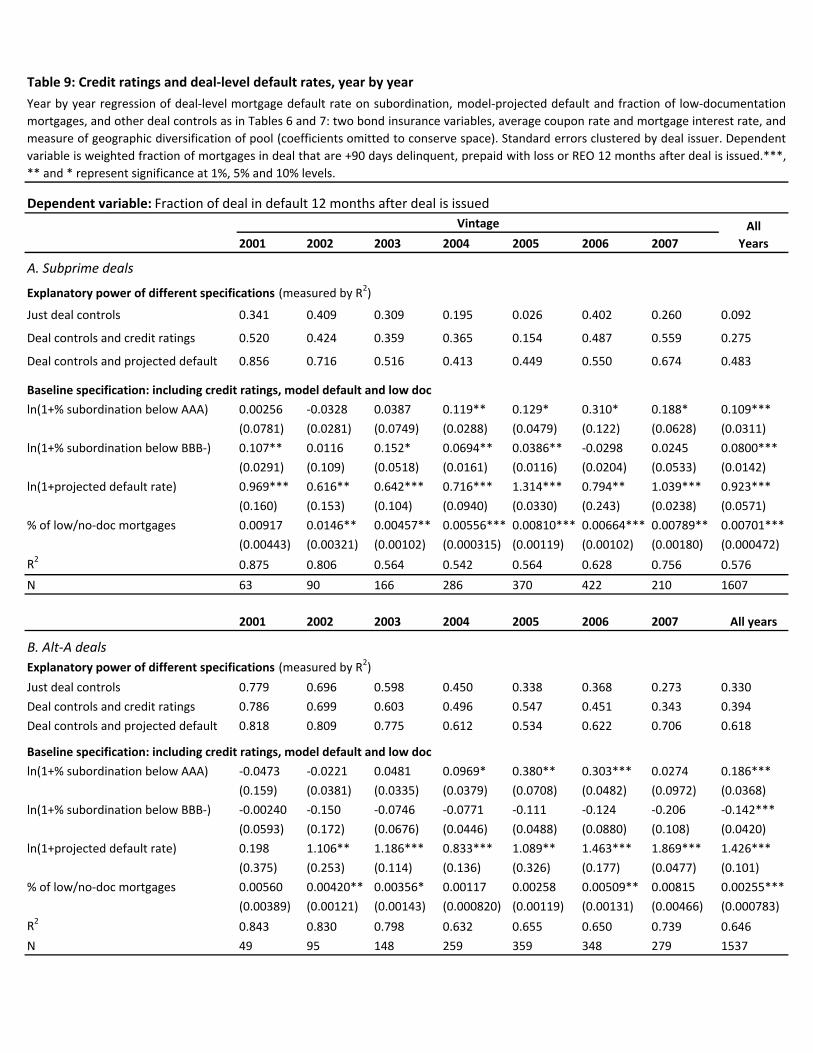
Table 9: Credit ratings and deal‐level default rates, year by year
Dependent variable: Fraction of deal in default 12 months after deal is issued
2001 2002 2003 2004 2005 2006 2007
A. Subprime deals
Explanatory power of different specifications (measured by R2)
Just deal controls 0.341 0.409 0.309 0.195 0.026 0.402 0.260 0.092
Deal controls and credit ratings 0.520 0.424 0.359 0.365 0.154 0.487 0.559 0.275
Deal controls and projected default 0.856 0.716 0.516 0.413 0.449 0.550 0.674 0.483
Baseline specification: including credit ratings, model default and low doc
ln(1+% subordination below AAA) 0.00256 ‐0.0328 0.0387 0.119** 0.129* 0.310* 0.188* 0.109***
(0.0781) (0.0281) (0.0749) (0.0288) (0.0479) (0.122) (0.0628) (0.0311)
ln(1+% subordination below BBB‐) 0.107** 0.0116 0.152* 0.0694** 0.0386** ‐0.0298 0.0245 0.0800***
(0.0291) (0.109) (0.0518) (0.0161) (0.0116) (0.0204) (0.0533) (0.0142)
ln(1+projected default rate) 0.969*** 0.616** 0.642*** 0.716*** 1.314*** 0.794** 1.039*** 0.923***
(0.160) (0.153) (0.104) (0.0940) (0.0330) (0.243) (0.0238) (0.0571)
% of low/no‐doc mortgages 0.00917 0.0146** 0.00457** 0.00556*** 0.00810*** 0.00664*** 0.00789** 0.00701***
(0.00443) (0.00321) (0.00102) (0.000315) (0.00119) (0.00102) (0.00180) (0.000472)
R2 0.875 0.806 0.564 0.542 0.564 0.628 0.756 0.576
N 63 90 166 286 370 422 210 1607
2001 2002 2003 2004 2005 2006 2007
B. Alt‐A deals
Explanatory power of different specifications (measured by R2)
Just deal controls 0.779 0.696 0.598 0.450 0.338 0.368 0.273 0.330
Deal controls and credit ratings 0.786 0.699 0.603 0.496 0.547 0.451 0.343 0.394
Deal controls and projected default 0.818 0.809 0.775 0.612 0.534 0.622 0.706 0.618
Baseline specification: including credit ratings, model default and low doc
ln(1+% subordination below AAA) ‐0.0473 ‐0.0221 0.0481 0.0969* 0.380** 0.303*** 0.0274 0.186***
(0.159) (0.0381) (0.0335) (0.0379) (0.0708) (0.0482) (0.0972) (0.0368)
ln(1+% subordination below BBB‐) ‐0.00240 ‐0.150 ‐0.0746 ‐0.0771 ‐0.111 ‐0.124 ‐0.206 ‐0.142***
(0.0593) (0.172) (0.0676) (0.0446) (0.0488) (0.0880) (0.108) (0.0420)
ln(1+projected default rate) 0.198 1.106** 1.186*** 0.833*** 1.089** 1.463*** 1.869*** 1.426***
(0.375) (0.253) (0.114) (0.136) (0.326) (0.177) (0.0477) (0.101)
% of low/no‐doc mortgages 0.00560 0.00420** 0.00356* 0.00117 0.00258 0.00509** 0.00815 0.00255***
(0.00389) (0.00121) (0.00143) (0.000820) (0.00119) (0.00131) (0.00466) (0.000783)
R2 0.843 0.830 0.798 0.632 0.655 0.650 0.739 0.646
N 49 95 148 259 359 348 279 1537
Vintage All
Years
Year by year regression of deal‐level mortgage default rate on subordination, model‐projected default and fraction of low‐documentation
mortgages, and other deal controls as in Tables 6 and 7: two bond insurance variables, average coupon rate and mortgage interest rate, and
measure of geographic diversification of pool (coefficients omitted to conserve space). Standard errors clustered by deal issuer. Dependent
variable is weighted fraction of mortgages in deal that are +90 days delinquent, prepaid with loss or REO 12 months after deal is issued.***,
** and * represent significance at 1%, 5% and 10% levels.
All years
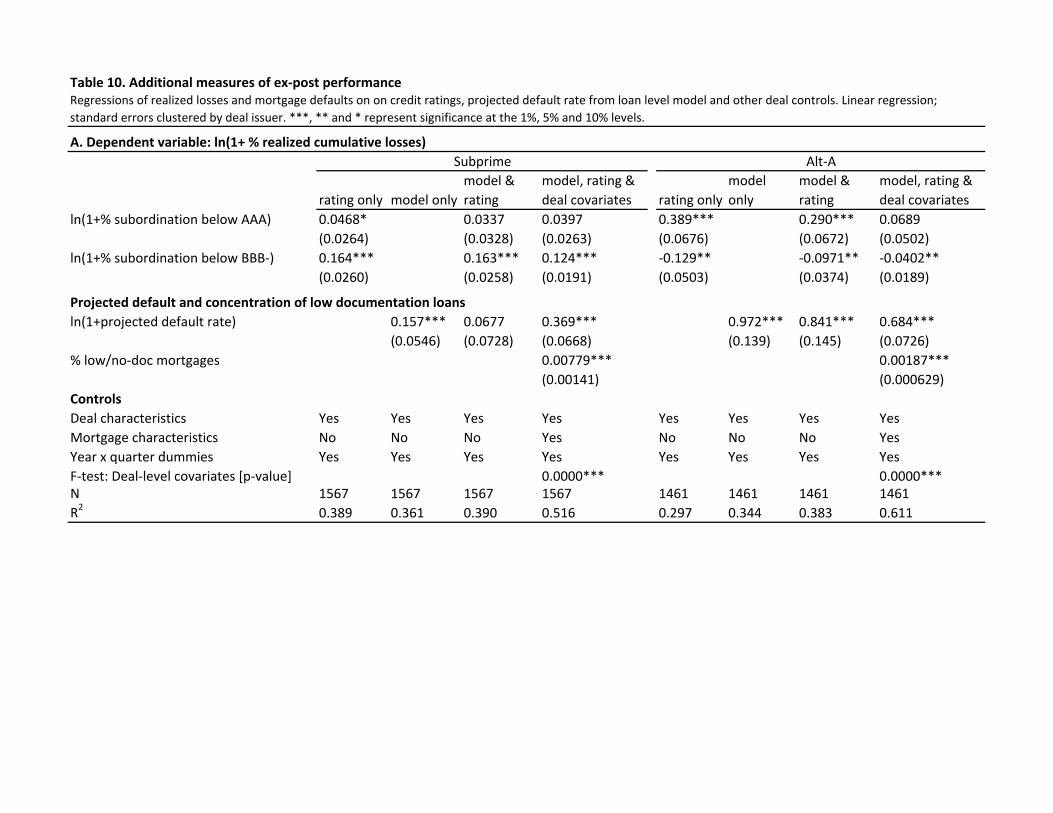
Table 10. Additional measures of ex‐post performance
A. Dependent variable: ln(1+ % realized cumulative losses)
rating only model only
model &
rating
model, rating &
deal covariates rating only
model
only
model &
rating
model, rating &
deal covariates
ln(1+% subordination below AAA) 0.0468* 0.0337 0.0397 0.389*** 0.290*** 0.0689
(0.0264) (0.0328) (0.0263) (0.0676) (0.0672) (0.0502)
ln(1+% subordination below BBB‐) 0.164*** 0.163*** 0.124*** ‐0.129** ‐0.0971** ‐0.0402**
(0.0260) (0.0258) (0.0191) (0.0503) (0.0374) (0.0189)
Projected default and concentration of low documentation loans
ln(1+projected default rate) 0.157*** 0.0677 0.369*** 0.972*** 0.841*** 0.684***
(0.0546) (0.0728) (0.0668) (0.139) (0.145) (0.0726)
% low/no‐doc mortgages 0.00779*** 0.00187***
(0.00141) (0.000629)
Controls
Deal characteristics Yes Yes Yes Yes Yes Yes Yes Yes
Mortgage characteristics No No No Yes No No No Yes
Y t d i Y Y Y Y Y Y Y Y
Regressions of realized losses and mortgage defaults on on credit ratings, projected default rate from loan level model and other deal controls. Linear regression;
standard errors clustered by deal issuer. ***, ** and * represent significance at the 1%, 5% and 10% levels.
Subprime Alt‐A
Year x quarter dummies Yes Yes Yes Yes Yes Yes Yes Yes
F‐test: Deal‐level covariates [p‐value] 0.0000*** 0.0000***N 1567 1567 1567 1567 1461 1461 1461 1461
R2
0.389 0.361 0.390 0.516 0.297 0.344 0.383 0.611
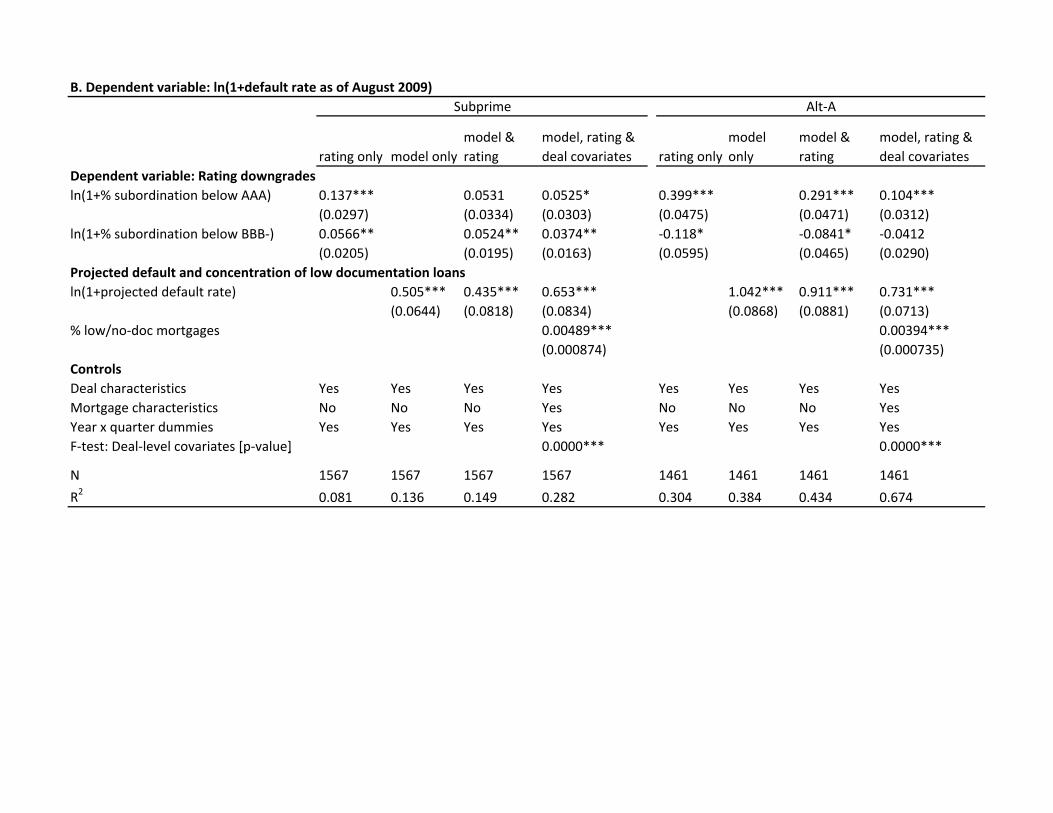
B. Dependent variable: ln(1+default rate as of August 2009)
rating only model only
model &
rating
model, rating &
deal covariates rating only
model
only
model &
rating
model, rating &
deal covariates
Dependent variable: Rating downgrades
ln(1+% subordination below AAA) 0.137*** 0.0531 0.0525* 0.399*** 0.291*** 0.104***
(0.0297) (0.0334) (0.0303) (0.0475) (0.0471) (0.0312)
ln(1+% subordination below BBB‐) 0.0566** 0.0524** 0.0374** ‐0.118* ‐0.0841* ‐0.0412
(0.0205) (0.0195) (0.0163) (0.0595) (0.0465) (0.0290)
Projected default and concentration of low documentation loans
ln(1+projected default rate) 0.505*** 0.435*** 0.653*** 1.042*** 0.911*** 0.731***
(0.0644) (0.0818) (0.0834) (0.0868) (0.0881) (0.0713)
% low/no‐doc mortgages 0.00489*** 0.00394***
(0.000874) (0.000735)
Controls
Deal characteristics Yes Yes Yes Yes Yes Yes Yes Yes
Mortgage characteristics No No No Yes No No No Yes
Year x quarter dummies Yes Yes Yes Yes Yes Yes Yes Yes
F‐test: Deal‐level covariates [p‐value] 0.0000*** 0.0000***
Subprime Alt‐A
F test: eal level covariates [p value] 0.0000 0.0000
N 1567 1567 1567 1567 1461 1461 1461 1461
R2 0.081 0.136 0.149 0.282 0.304 0.384 0.434 0.674