Embed Size (px)
Citation preview
Mazidi, N and Roobottom, C and Masala, G (2019)Automatic Quantificationof Breast Arterial Calcification on Mammographic Images. In: Innovation inMedincine & Heathcare, 17 June 2019 - 19 June 2019, St Julians, Malta.
Downloaded from: http://e-space.mmu.ac.uk/623234/
Version: Accepted Version
Publisher: Springer Nature
DOI: https://doi.org/10.1007/978-981-13-8566-7_28
Please cite the published version
https://e-space.mmu.ac.uk
brought to you by COREView metadata, citation and similar papers at core.ac.uk
provided by E-space: Manchester Metropolitan University's Research Repository
Automatic Quantification of Breast Arterial Calcification
on Mammographic Images
Najim Mazidi 1, Carl Roobottom 2 and Giovanni Masala3
1 University of Plymouth, Plymouth UK 2 Peninsula Schools of Medicine and Dentistry, University of Plymouth, Plymouth UK
3 Manchester Metropolitan University, Manchester, UK
Abstract. This paper describes the research and development of an automatic
computer system that is used to quantify breast arterial calcifications in mam-
mography scans. A few prior studies have attempted to establish a relationship
between breast arterial calcification (BAC) and the rate of coronary artery dis-
ease (CAD) risk factors. The majority of these studies demonstrated a positive
association between BAC and increasing age. Large scale cohort studies and
retrospective studies have almost uniformly suggested a strong association be-
tween BAC and cardiovascular disease related morbidity and mortality. This
strong association of BAC with cardiovascular pathology suggests that BAC
should also be persistently associated with radiographically determined CAD.
A method of image processing, segmentation and quantification used to high-
light and recognise calcified blood vessels in the breast is proposed and de-
scribed in detail. This project aims to introduce a new use for digital Mammog-
raphy, which is currently solely used for diagnosing breast cancer in female pa-
tients.
A method of detecting BAC is introduced at no additional cost, having an
adequate degree of accuracy, around 82%, which means that this type of system
could be used to assist a radiographer in diagnosing BAC by indicating whether
the patient has a high or low severity of calcification.
Keywords: Breast Arterial Calcification, CAD, medical imaging.
1 Introduction
Coronary artery disease (CAD) is a major cause of mortality and morbidity in
women, accounting for over a third of female deaths around the world [1], and it is
often not detected until it is too late. Overall, more American women than men die of
CAD annually, and until the age of 80 years, women who suffer from acute coronary
syndrome suffer higher mortality rates. Various causes postulated to account for the
difference in CAD related mortality include decreased disease detection in women
and gender differences in symptomatology and pathophysiology. Early detection and
treatment of coronary artery disease remain underutilized among women [1-3].
Breast arterial calcification (BAC) is a calcium deposition in the media of the pe-
ripheral arterioles, which is known as Monckeberg medial calcific sclerosis [2], and it
is regularly found in mammography. Mammography is a process of using low-energy
X-rays to examine the human breast and it is a common, and widely accepted, method
of screening for breast cancer. BAC can also be detected in mammograms, but it is
rarely included in final reports because it is considered a benign finding that is not
relevant to the diagnosis of breast cancer.
There is increasing evidence that breast arterial calcification (BAC) is a good indi-
cator of a person being in risk of cardiovascular disease (CVD) [2,4]. However, as
BACs visible in mammograms are usually ignored, these findings are wasted. Mam-
mography equipment and expertise costs a substantial amount of money and by only
having one use for it, it becomes difficult for hospitals and patients to afford this.
A few prior studies have attempted to establish a relationship between BAC and
CAD risk factors. The majority of these studies demonstrated a positive association
between BAC and increasing age [1-3]. Large scale cohort studies, and retrospective
studies, have almost uniformly suggested a strong association between BAC and car-
diovascular disease related morbidity and mortality. This strong association of BAC
with cardiovascular pathology suggests that BAC should also be persistently associat-
ed with radiographically determined CAD. The gold standard of CAD determination
has historically been catheter coronary angiography. Screening mammography is a
widely used diagnostic test to detect breast cancer. If BAC could serve as a marker for
CAD, then screening mammography could yield added value as a single test already
in wide use for the additional detection of CAD, an additional highly prevalent dis-
ease with high morbidity and mortality.
Dual source coronary computed tomography angiography (CTA) has been shown
to be effective for non-invasive diagnosis of CAD based on the demonstration of cal-
cified, and noncalcified, coronary arterial plaque and grading of stenotic disease.
A study on PLoS One [4] was conducted to assess the relationship between mam-
mographic BAC and CAD based on coronary CTA findings. Medical records for 100
patients who received both a mammogram and a coronary CTA were reviewed for
imaging findings and CAD risk factors. Correlation was measured between BAC and
CAD and logistic regression was used to create a classifier for predicting CAD based
on BAC and common risk factors. However, nobody shows results on big dataset and
there are some criticisms on this [5]. There are few works that try to solve the prob-
lem of the calcifications measure in the breast vessel using automatic systems.
Searching in the literature, it is possible to find interest on developing a specific au-
tomatic BAC to measure the vessels calcification, but this is an open issue and few
papers present preliminary results on it [6,7].
The next sections are articulated as follow; in section 2 the related works are pre-
sented, in section 3 the method is explained, in section 4 the dataset is illustrated, in
section 5 the results are discussed and finally the conclusions are made in the last
section.
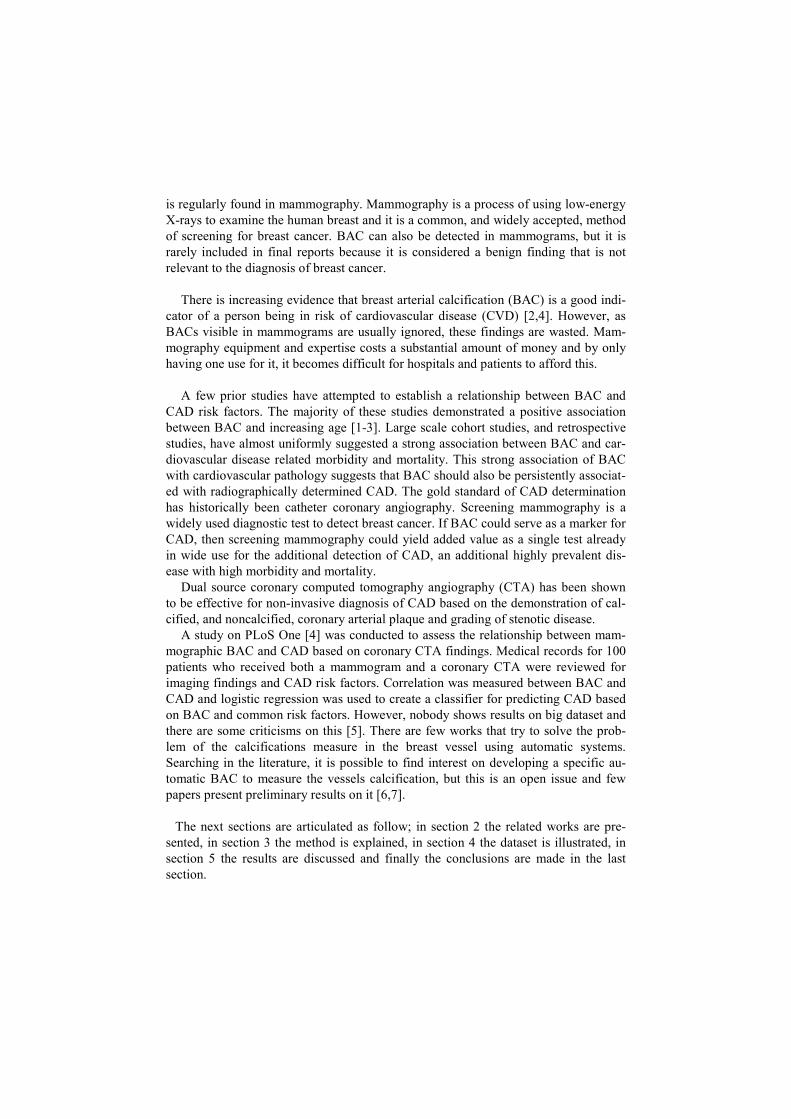
Fig. 1. Mammogram image showing a high grade of calcification. Red arrows indi-
cate the vessels that are calcified and affected by BAC.
2 Previous Research
Some previous research has been done into finding a way to classify and quantify
arterial calcification on digital mammograms and some partial solutions have been
suggested. Although solutions have been put forward for classifying BACs, no solu-
tion has been found to fully quantify them automatically or suggest a correlation be-
tween BAC and CAD.
An important study into this subject was made by Nava et al. [6], which we used as
an initial guidance for this paper. The authors in [6] proposed two steps; edge detec-
tion and image segmentation. A line-strength algorithm is used to process the image
in order to make the vessels more visible and highlighted, removing unnecessary pix-
els. A region growing algorithm is used to highlight pixels that may have been ig-
nored by using line strength; these pixels are usually located inside the walls of the
vessels. The findings show that the methods proposed by Nava et al. can detect and
segment BAC, with enough precision, in order to be able to accurately quantify breast
arterial calcifications in the breast region.
Another study was carried out by Cheng et al.[7], which proposes a random walks
algorithm that could be used to extract calcified vessels from mammograms. The
solution proposed in [7] consists of two steps; a random ’walk’ pixel tracking and a
compiling and linking step. The random-walk step involves tracking of the traversing
direction and jumping distance, and ’vesselness’ value of each pixel when traversing
the image, in order to generate possible paths. The second step involves organising
and grouping all paths into ’calcified vessel tracts’. The result shown in [7] demon-
strated that the performance of the algorithm is close to that of manual human diagno-
sis. Ge et al.[8] have proposed a way of detecting calcified vessels using clues that are
given by calcification. They applied a principle curve clustering method on the mam-
mogram in order detect calcified ’segments’. The main problem with this method is
that if a mammogram has multiple segments, the segments will not be grouped to-
gether. This means that we are not able to see the length of a vessel, which creates a
problem when trying to measure and evaluate severity of calcifications.
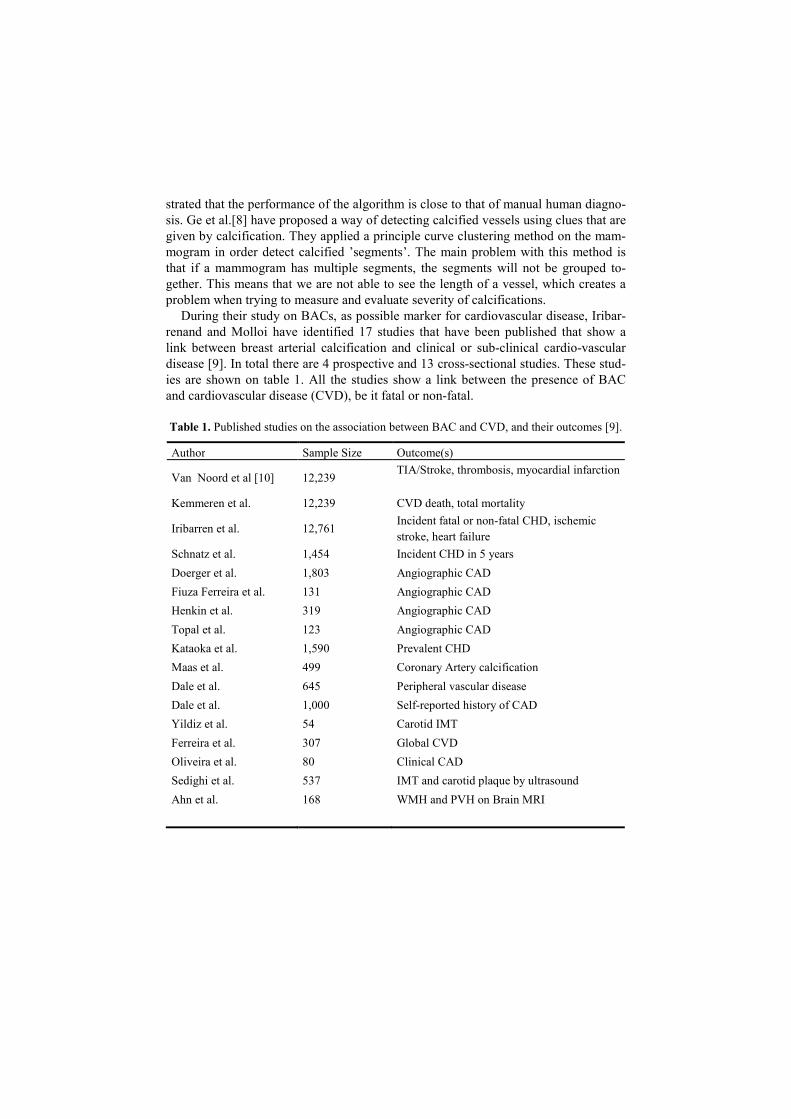
During their study on BACs, as possible marker for cardiovascular disease, Iribar-
renand and Molloi have identified 17 studies that have been published that show a
link between breast arterial calcification and clinical or sub-clinical cardio-vascular
disease [9]. In total there are 4 prospective and 13 cross-sectional studies. These stud-
ies are shown on table 1. All the studies show a link between the presence of BAC
and cardiovascular disease (CVD), be it fatal or non-fatal.
Table 1. Published studies on the association between BAC and CVD, and their outcomes [9].
Author Sample Size Outcome(s)
Van Noord et al [10] 12,239 TIA/Stroke, thrombosis, myocardial infarction
Kemmeren et al. 12,239 CVD death, total mortality
Iribarren et al. 12,761 Incident fatal or non-fatal CHD, ischemic
stroke, heart failure
Schnatz et al. 1,454 Incident CHD in 5 years
Doerger et al. 1,803 Angiographic CAD
Fiuza Ferreira et al. 131 Angiographic CAD
Henkin et al. 319 Angiographic CAD
Topal et al. 123 Angiographic CAD
Kataoka et al. 1,590 Prevalent CHD
Maas et al. 499 Coronary Artery calcification
Dale et al. 645 Peripheral vascular disease
Dale et al. 1,000 Self-reported history of CAD
Yildiz et al. 54 Carotid IMT
Ferreira et al. 307 Global CVD
Oliveira et al. 80 Clinical CAD
Sedighi et al. 537 IMT and carotid plaque by ultrasound
Ahn et al. 168 WMH and PVH on Brain MRI
3 Method
The presented approach starts with the image preparation, removing black space
surrounding breast region from image. The resolution of the image is also lowered,
because the original images are very large. A further Gaussian filter is used to blur
and smooth the image before processing.
The Line Strength algorithm is used to highlight and extract linear features in a
mammogram, in a similar way to the methods proposed by Zwiggelaar et al. [11] and
Nava et al. [6]. A value that reflect the strength of a line S is calculated for each pixel:
S = α(L - N) + (1 - α)(I - G). (1)
where α is a constant between 0 and 1, L is the average pixel grey value for the line
passing through the pixel (in an orientation that produces the highest value), N is the
average pixel grey value inside the specified square neighbourhood around the select-
ed pixel, I is the original pixel grey value of the selected pixel, and G is the resulting
pixel grey value from passing the image through a Gaussian filter. The purpose of this
algorithm is to extract a skeletonized structure of the linear parts of the mammograph-
ic image. The result S of the Line Strength algorithm is then fed into a thresholding
function, which compares each pixel with a given threshold value, in order to extract
the linear structures with the highest intensity. Pixels with high intensity have a higher
probability to be a calcification.
Afterward a region growing algorithm [12] examines a given pixel, and the neigh-
bourhood around it, and determines whether they are similar enough to the seed to be
added to the same region. Region growing is a region-based and pixel-based method
for image segmentation. This approach starts with a seed pixel, examining the neigh-
bourhood around it, and determined whether they are similar enough to the seed to be
added to the same region. It is then iterated until the threshold is met for the grown
region or no more pixels meet the criteria to be added to the region. The pixels, which
are added to the region, are usually located inside the calcified vessels.
Once the image has analysed by the region growing algorithm, an average white
level for the whole image is calculated. In order to obtain this value, a mean of all
pixel grey values of the image is calculated. In addition, a white intensity is calculated
for the whole image by only obtaining the mean grey level of the activated pixels (non
black). The average white level and average white intensity are then multiplied to-
gether. Such white level is then used to estimate the presence and grade of calcifica-
tion. In figure 2 an overview of the steps illustrated is made.
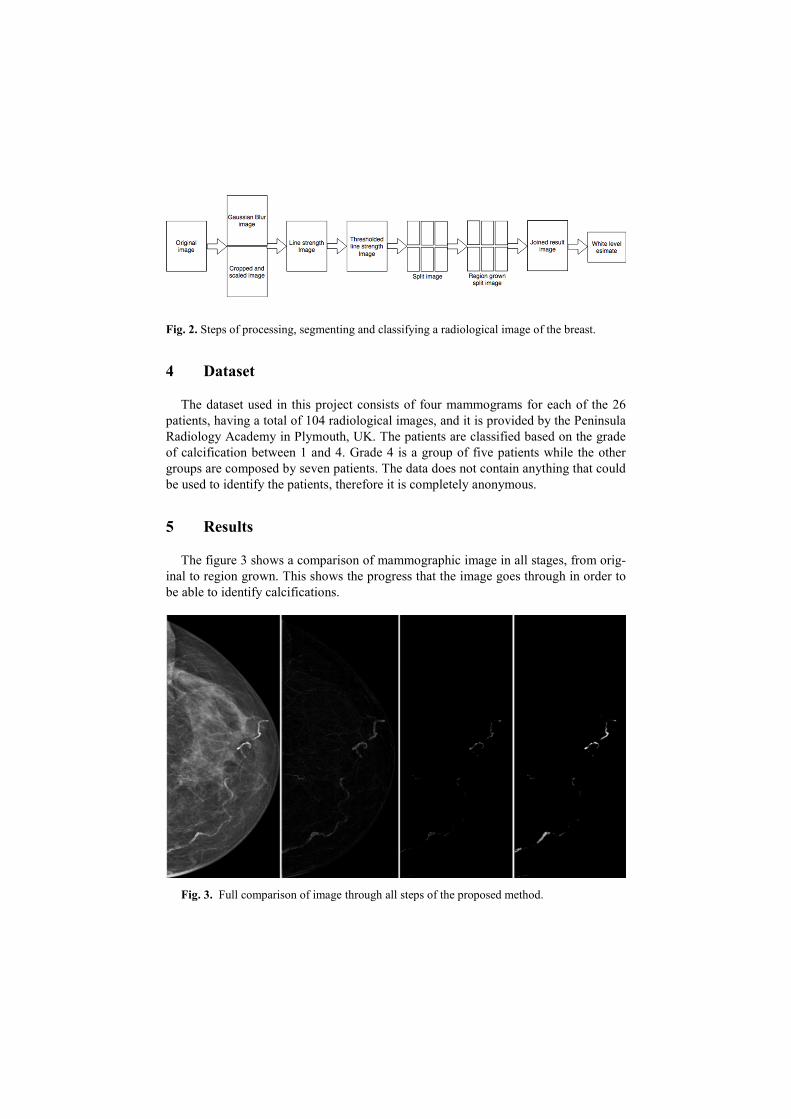
Fig. 2. Steps of processing, segmenting and classifying a radiological image of the breast.
4 Dataset
The dataset used in this project consists of four mammograms for each of the 26
patients, having a total of 104 radiological images, and it is provided by the Peninsula
Radiology Academy in Plymouth, UK. The patients are classified based on the grade
of calcification between 1 and 4. Grade 4 is a group of five patients while the other
groups are composed by seven patients. The data does not contain anything that could
be used to identify the patients, therefore it is completely anonymous.
5 Results
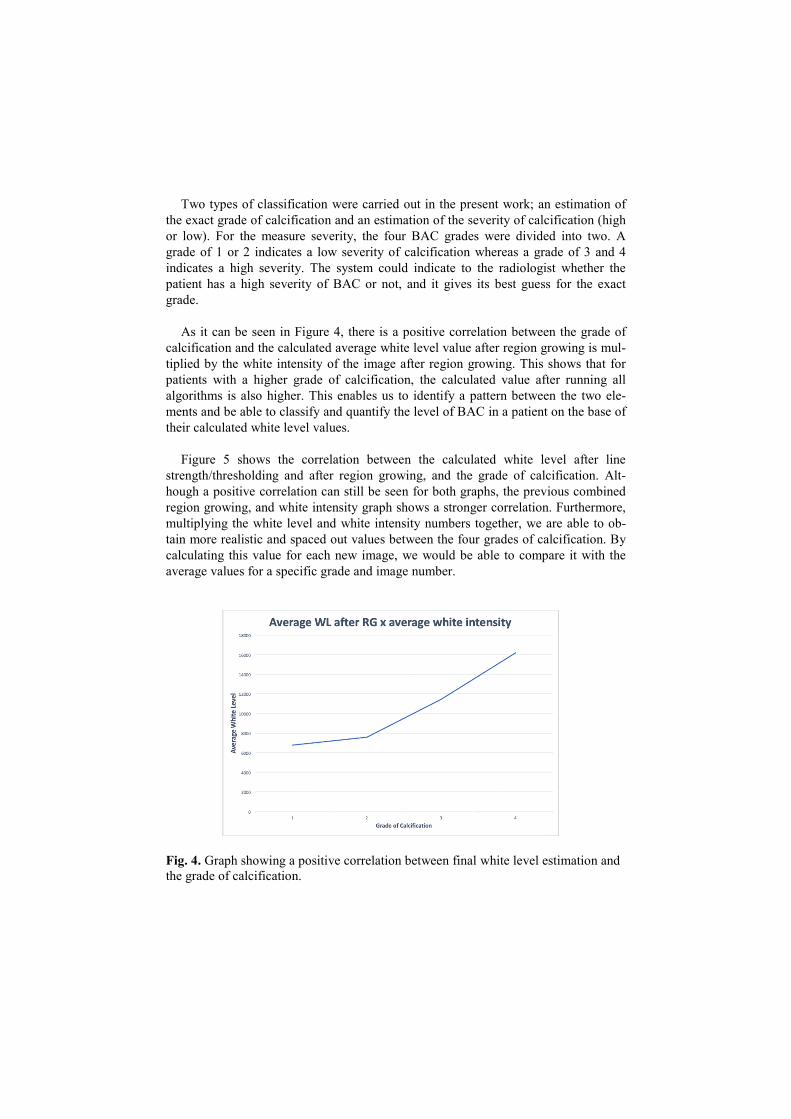
The figure 3 shows a comparison of mammographic image in all stages, from orig-
inal to region grown. This shows the progress that the image goes through in order to
be able to identify calcifications.
Fig. 3. Full comparison of image through all steps of the proposed method.
Two types of classification were carried out in the present work; an estimation of
the exact grade of calcification and an estimation of the severity of calcification (high
or low). For the measure severity, the four BAC grades were divided into two. A
grade of 1 or 2 indicates a low severity of calcification whereas a grade of 3 and 4
indicates a high severity. The system could indicate to the radiologist whether the
patient has a high severity of BAC or not, and it gives its best guess for the exact
grade.
As it can be seen in Figure 4, there is a positive correlation between the grade of
calcification and the calculated average white level value after region growing is mul-
tiplied by the white intensity of the image after region growing. This shows that for
patients with a higher grade of calcification, the calculated value after running all
algorithms is also higher. This enables us to identify a pattern between the two ele-
ments and be able to classify and quantify the level of BAC in a patient on the base of
their calculated white level values.
Figure 5 shows the correlation between the calculated white level after line
strength/thresholding and after region growing, and the grade of calcification. Alt-
hough a positive correlation can still be seen for both graphs, the previous combined
region growing, and white intensity graph shows a stronger correlation. Furthermore,
multiplying the white level and white intensity numbers together, we are able to ob-
tain more realistic and spaced out values between the four grades of calcification. By
calculating this value for each new image, we would be able to compare it with the
average values for a specific grade and image number.
Fig. 4. Graph showing a positive correlation between final white level estimation and
the grade of calcification.
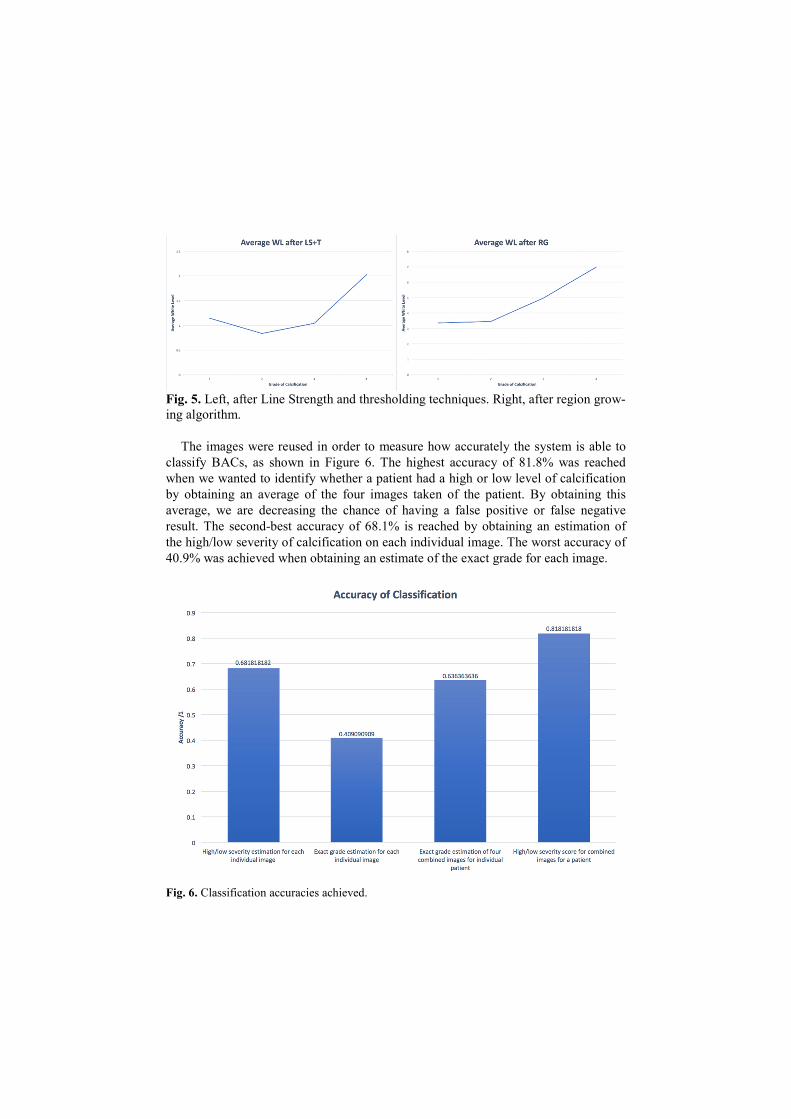
Fig. 5. Left, after Line Strength and thresholding techniques. Right, after region grow-
ing algorithm.
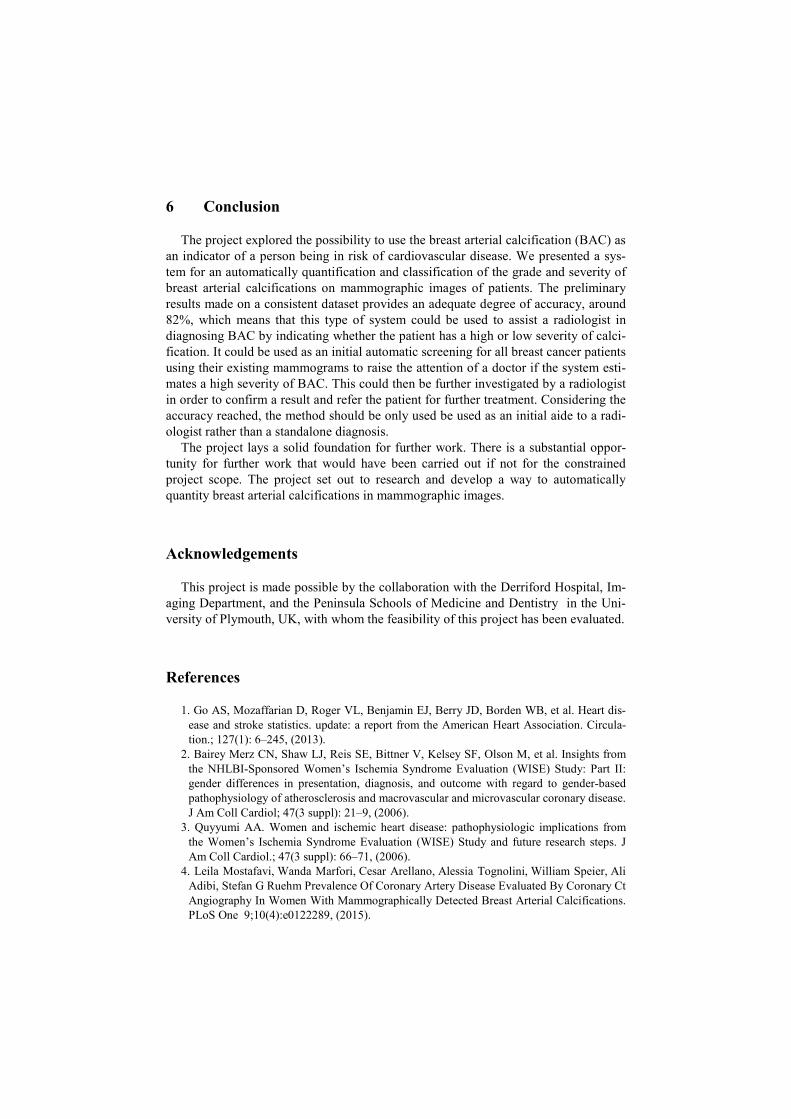
The images were reused in order to measure how accurately the system is able to
classify BACs, as shown in Figure 6. The highest accuracy of 81.8% was reached
when we wanted to identify whether a patient had a high or low level of calcification
by obtaining an average of the four images taken of the patient. By obtaining this
average, we are decreasing the chance of having a false positive or false negative
result. The second-best accuracy of 68.1% is reached by obtaining an estimation of
the high/low severity of calcification on each individual image. The worst accuracy of
40.9% was achieved when obtaining an estimate of the exact grade for each image.
Fig. 6. Classification accuracies achieved.
6 Conclusion
The project explored the possibility to use the breast arterial calcification (BAC) as
an indicator of a person being in risk of cardiovascular disease. We presented a sys-
tem for an automatically quantification and classification of the grade and severity of
breast arterial calcifications on mammographic images of patients. The preliminary
results made on a consistent dataset provides an adequate degree of accuracy, around
82%, which means that this type of system could be used to assist a radiologist in
diagnosing BAC by indicating whether the patient has a high or low severity of calci-
fication. It could be used as an initial automatic screening for all breast cancer patients
using their existing mammograms to raise the attention of a doctor if the system esti-
mates a high severity of BAC. This could then be further investigated by a radiologist
in order to confirm a result and refer the patient for further treatment. Considering the
accuracy reached, the method should be only used be used as an initial aide to a radi-
ologist rather than a standalone diagnosis.
The project lays a solid foundation for further work. There is a substantial oppor-
tunity for further work that would have been carried out if not for the constrained
project scope. The project set out to research and develop a way to automatically
quantity breast arterial calcifications in mammographic images.
Acknowledgements
This project is made possible by the collaboration with the Derriford Hospital, Im-
aging Department, and the Peninsula Schools of Medicine and Dentistry in the Uni-
versity of Plymouth, UK, with whom the feasibility of this project has been evaluated.
References
1. Go AS, Mozaffarian D, Roger VL, Benjamin EJ, Berry JD, Borden WB, et al. Heart dis-
ease and stroke statistics. update: a report from the American Heart Association. Circula-
tion.; 127(1): 6–245, (2013).
2. Bairey Merz CN, Shaw LJ, Reis SE, Bittner V, Kelsey SF, Olson M, et al. Insights from
the NHLBI-Sponsored Women’s Ischemia Syndrome Evaluation (WISE) Study: Part II:
gender differences in presentation, diagnosis, and outcome with regard to gender-based
pathophysiology of atherosclerosis and macrovascular and microvascular coronary disease.
J Am Coll Cardiol; 47(3 suppl): 21–9, (2006).
3. Quyyumi AA. Women and ischemic heart disease: pathophysiologic implications from
the Women’s Ischemia Syndrome Evaluation (WISE) Study and future research steps. J
Am Coll Cardiol.; 47(3 suppl): 66–71, (2006).
4. Leila Mostafavi, Wanda Marfori, Cesar Arellano, Alessia Tognolini, William Speier, Ali
Adibi, Stefan G Ruehm Prevalence Of Coronary Artery Disease Evaluated By Coronary Ct
Angiography In Women With Mammographically Detected Breast Arterial Calcifications.
PLoS One 9;10(4):e0122289, (2015).
5. Moradi, Maryam, Atoosa Adibi, and Mehdi Abedi. "Relationship between breast arterial
calcification on mammography with CT Calcium scoring and coronary CT angiography
results." Advanced biomedical research 3 (2014).
6. Nava, Barba, Sendra, Rebollo, Quantification of Vascular Calcifications on Digitized
Mammograms, Volume 6136 of the series Lecture Notes in Computer Science pp 183-190,
(2010).
7. Cheng, Jie-Zhi, et al. "Detection of arterial calcification in mammograms by random
walks." International Conference on Information Processing in Medical Imaging. Springer
Berlin Heidelberg, (2009).
8. J. Ge, B. Sahiner, Y. Zhang, et al. Automated detection of breast vascular calcification
on full-field digital mammograms. In The International Society for Optical Engineering.
9. C. Iribarren and S. Molloi. Breast arterial calcification: a new marker of cardiovascular
risk? Current Cardiovascular Risk Reports, (2013).
10. P. A. H. Van Noord, D. Beijerinck, et al. Mammograms may convey more than breast
cancer risk: Breast arterial calcification and arterio-sclerotic related diseases in women
of the dom cohort. European Journal of Cancer Prevention, (1997).
11. R. Zwigelaar, S. Astley, et al. Linear structures in mammographic images: Detection
and classification. IEEE Transactions on Medical Imaging, (2004).
12. M. Petrou and P. Bosdogianni, Image Processing the Fundamentals, Wiley, UK, 2004.