Embed Size (px)
Citation preview
SCHOOL DISTRICT OF PHILADELPHIA
MAYFAIR SCHOOL SPECIFIC MEETING
SCHOOL DISTRICT OF PHILADELPHIA
MARCH 2ND, 2019
SCHOOL DISTRICT OF PHILADELPHIA 1
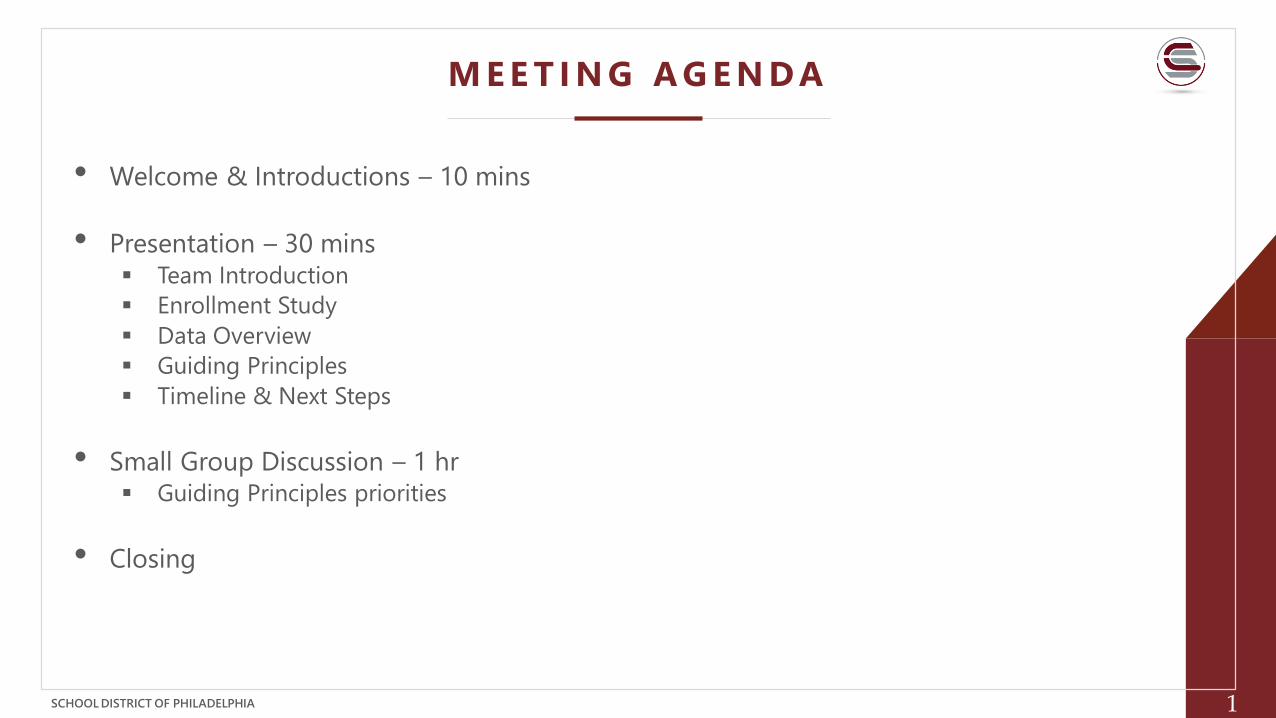
M E E T I N G A G E N D A
• Welcome & Introductions – 10 mins
• Presentation – 30 mins▪ Team Introduction
▪ Enrollment Study
▪ Data Overview
▪ Guiding Principles
▪ Timeline & Next Steps
• Small Group Discussion – 1 hr▪ Guiding Principles priorities
• Closing
SCHOOL DISTRICT OF PHILADELPHIA 2
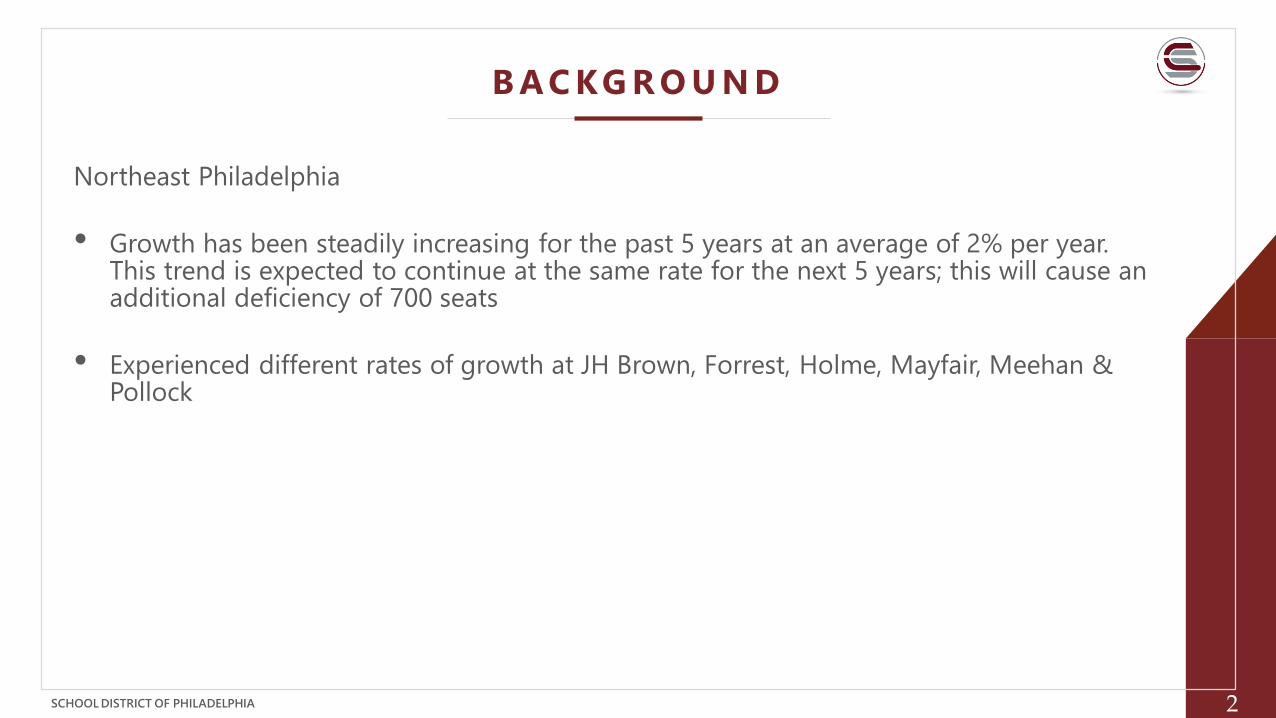
B A C KG R O U N D
Northeast Philadelphia
• Growth has been steadily increasing for the past 5 years at an average of 2% per year. This trend is expected to continue at the same rate for the next 5 years; this will cause an additional deficiency of 700 seats
• Experienced different rates of growth at JH Brown, Forrest, Holme, Mayfair, Meehan & Pollock
SCHOOL DISTRICT OF PHILADELPHIA 3
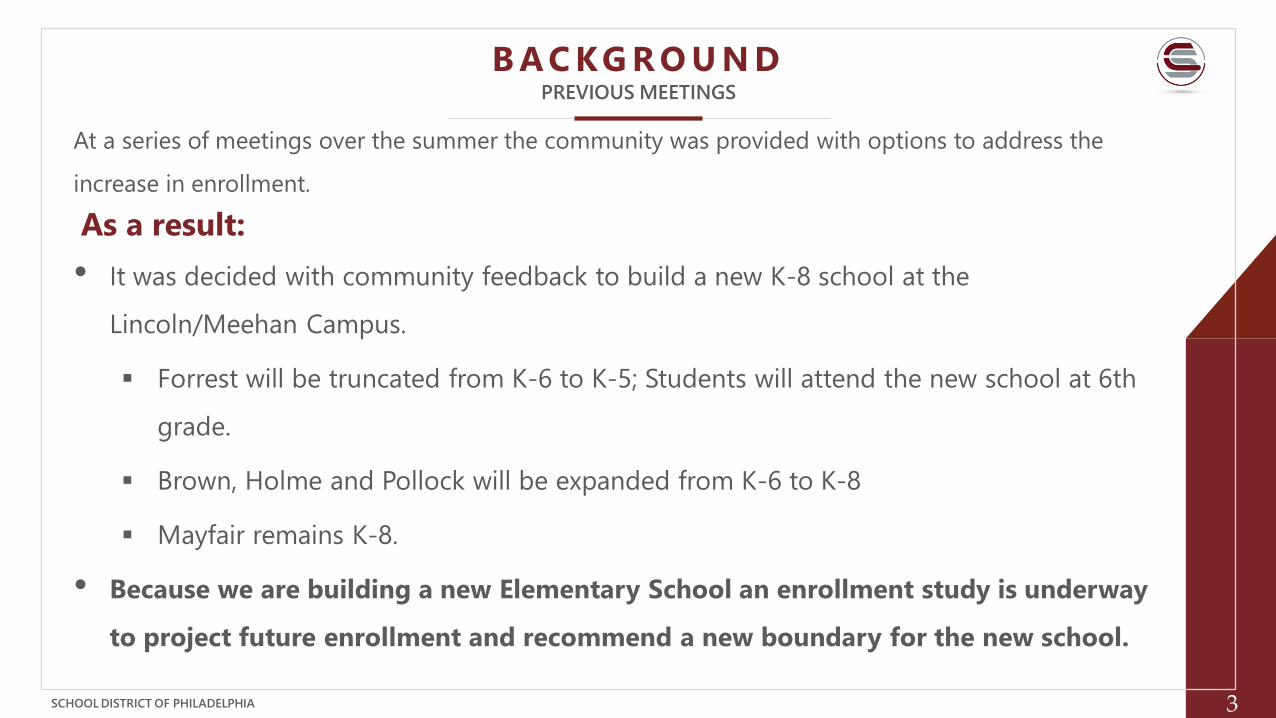
B A C KG R O U N D
At a series of meetings over the summer the community was provided with options to address the
increase in enrollment.
As a result:
• It was decided with community feedback to build a new K-8 school at the
Lincoln/Meehan Campus.
▪ Forrest will be truncated from K-6 to K-5; Students will attend the new school at 6th
grade.
▪ Brown, Holme and Pollock will be expanded from K-6 to K-8
▪ Mayfair remains K-8.
• Because we are building a new Elementary School an enrollment study is underway
to project future enrollment and recommend a new boundary for the new school.
PREVIOUS MEETINGS
SCHOOL DISTRICT OF PHILADELPHIA 4
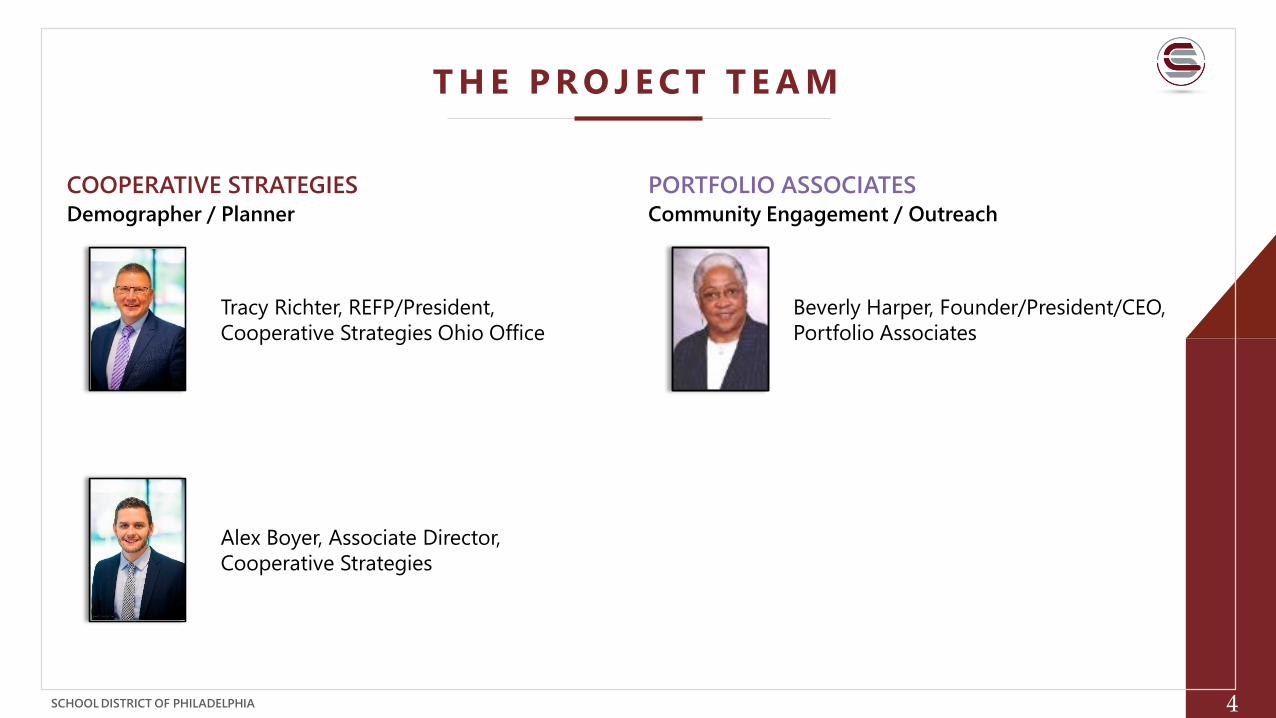
T H E P R O J E C T T E A M
COOPERATIVE STRATEGIES PORTFOLIO ASSOCIATES
Demographer / Planner Community Engagement / Outreach
Tracy Richter, REFP/President,
Cooperative Strategies Ohio Office
Alex Boyer, Associate Director,
Cooperative Strategies
Beverly Harper, Founder/President/CEO,
Portfolio Associates
SCHOOL DISTRICT OF PHILADELPHIA 5
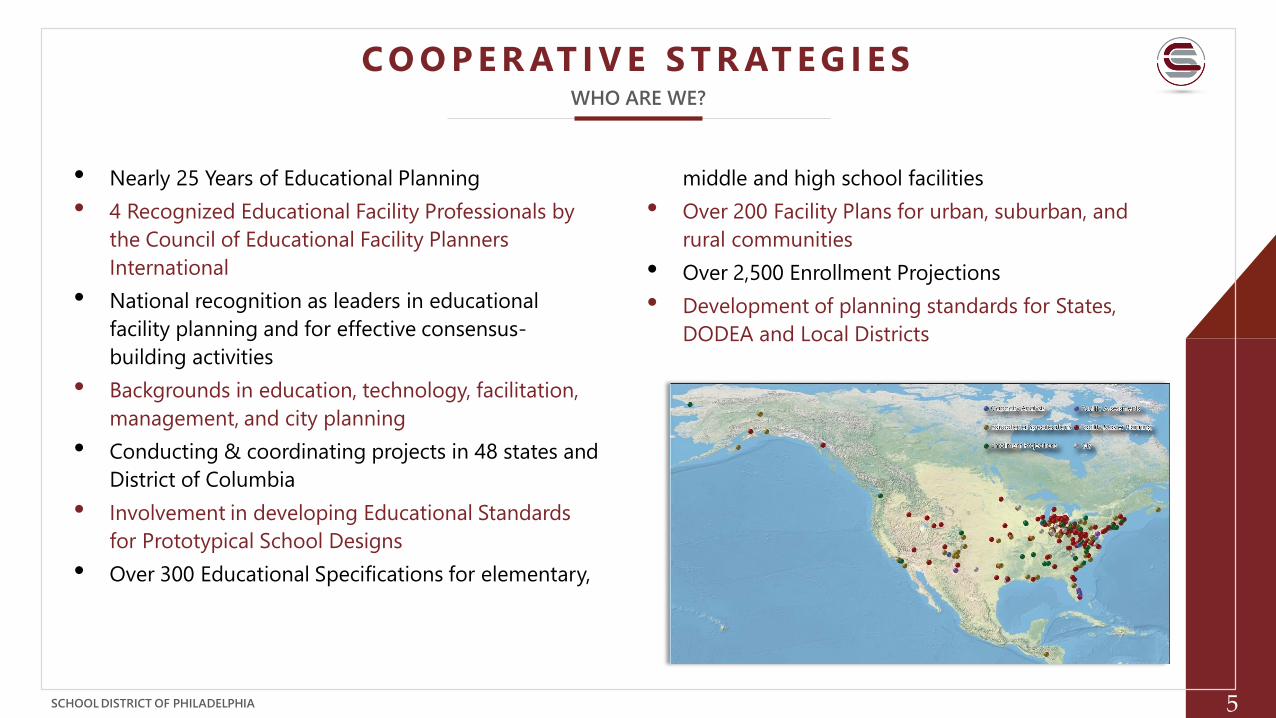
C O O P E R AT I V E S T R AT E G I E SWHO ARE WE?
• Nearly 25 Years of Educational Planning
• 4 Recognized Educational Facility Professionals by
the Council of Educational Facility Planners
International
• National recognition as leaders in educational
facility planning and for effective consensus-
building activities
• Backgrounds in education, technology, facilitation,
management, and city planning
• Conducting & coordinating projects in 48 states and
District of Columbia
• Involvement in developing Educational Standards
for Prototypical School Designs
• Over 300 Educational Specifications for elementary,
middle and high school facilities
• Over 200 Facility Plans for urban, suburban, and
rural communities
• Over 2,500 Enrollment Projections
• Development of planning standards for States,
DODEA and Local Districts
SCHOOL DISTRICT OF PHILADELPHIA 6
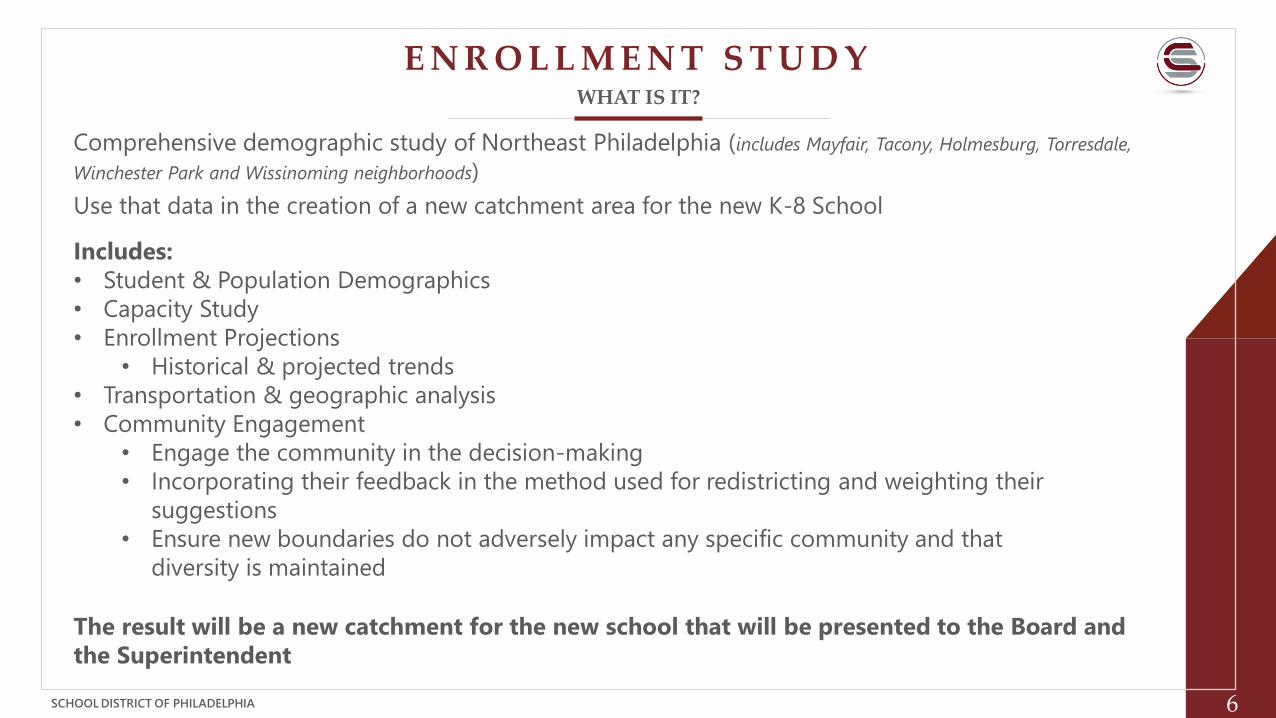
E N R O L L M E N T S T U D YWHAT IS IT?
Comprehensive demographic study of Northeast Philadelphia (includes Mayfair, Tacony, Holmesburg, Torresdale,
Winchester Park and Wissinoming neighborhoods)
Use that data in the creation of a new catchment area for the new K-8 School
Includes:
• Student & Population Demographics
• Capacity Study
• Enrollment Projections
• Historical & projected trends
• Transportation & geographic analysis
• Community Engagement
• Engage the community in the decision-making
• Incorporating their feedback in the method used for redistricting and weighting their
suggestions
• Ensure new boundaries do not adversely impact any specific community and that
diversity is maintained
The result will be a new catchment for the new school that will be presented to the Board and
the Superintendent

SCHOOL DISTRICT OF PHILADELPHIA 7
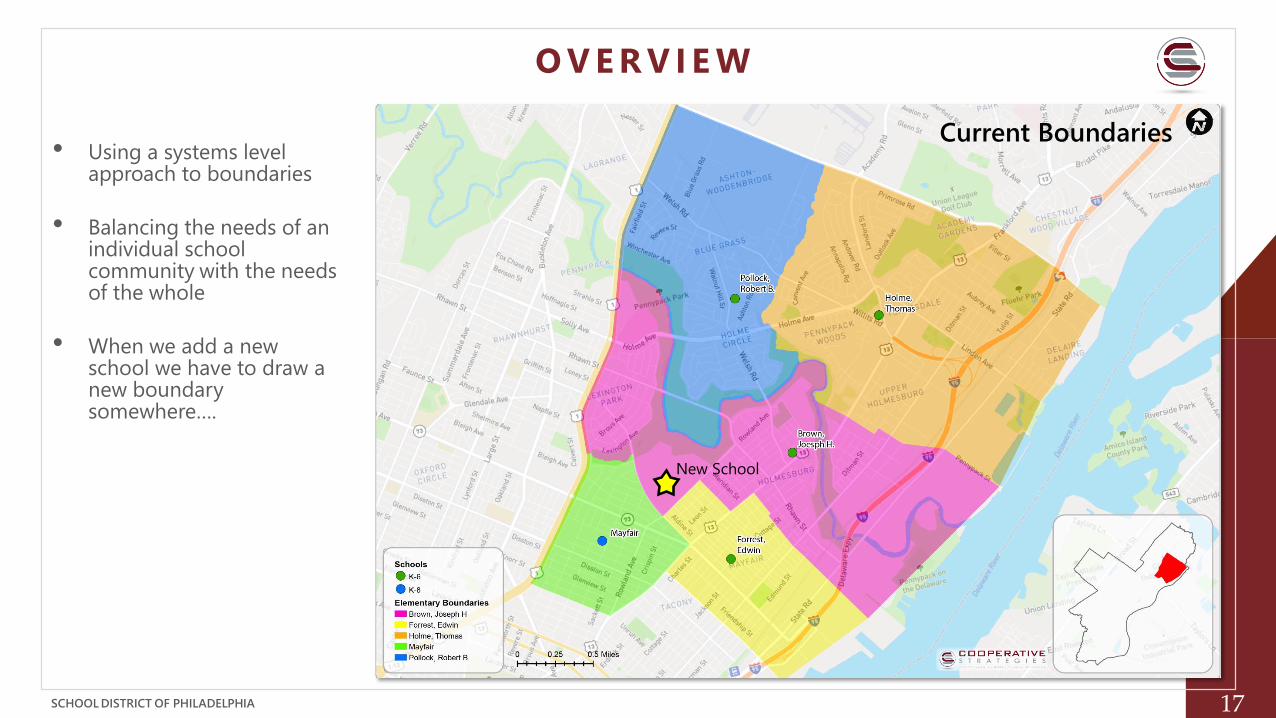
O V E R V I E W
• Using a systems level approach to boundaries
• Balancing the needs of an individual school community with the needs of the whole
• When we add a new school we have to draw a new boundary somewhere….
Current Boundaries
New School
SCHOOL DISTRICT OF PHILADELPHIA 8
E N R O L L M E N T
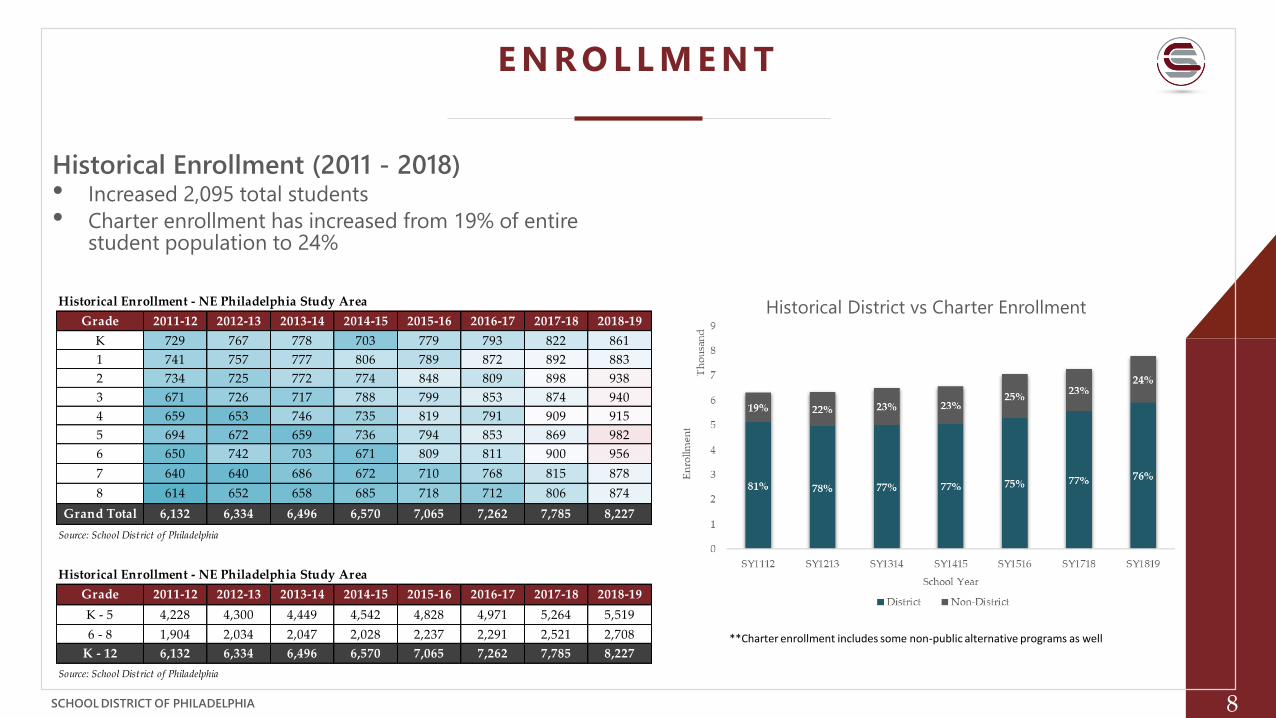
Historical Enrollment (2011 - 2018)
Historical Enrollment - NE Philadelphia Study Area
Grade 2011-12 2012-13 2013-14 2014-15 2015-16 2016-17 2017-18 2018-19
K 729 767 778 703 779 793 822 861
1 741 757 777 806 789 872 892 883
2 734 725 772 774 848 809 898 938
3 671 726 717 788 799 853 874 940
4 659 653 746 735 819 791 909 915
5 694 672 659 736 794 853 869 982
6 650 742 703 671 809 811 900 956
7 640 640 686 672 710 768 815 878
8 614 652 658 685 718 712 806 874
Grand Total 6,132 6,334 6,496 6,570 7,065 7,262 7,785 8,227
Source: School District of Philadelphia
Historical Enrollment - NE Philadelphia Study Area
Grade 2011-12 2012-13 2013-14 2014-15 2015-16 2016-17 2017-18 2018-19
K - 5 4,228 4,300 4,449 4,542 4,828 4,971 5,264 5,519
6 - 8 1,904 2,034 2,047 2,028 2,237 2,291 2,521 2,708
K - 12 6,132 6,334 6,496 6,570 7,065 7,262 7,785 8,227
Source: School District of Philadelphia
• Increased 2,095 total students
• Charter enrollment has increased from 19% of entire student population to 24%
Historical District vs Charter Enrollment
**Charter enrollment includes some non-public alternative programs as well
SCHOOL DISTRICT OF PHILADELPHIA 9
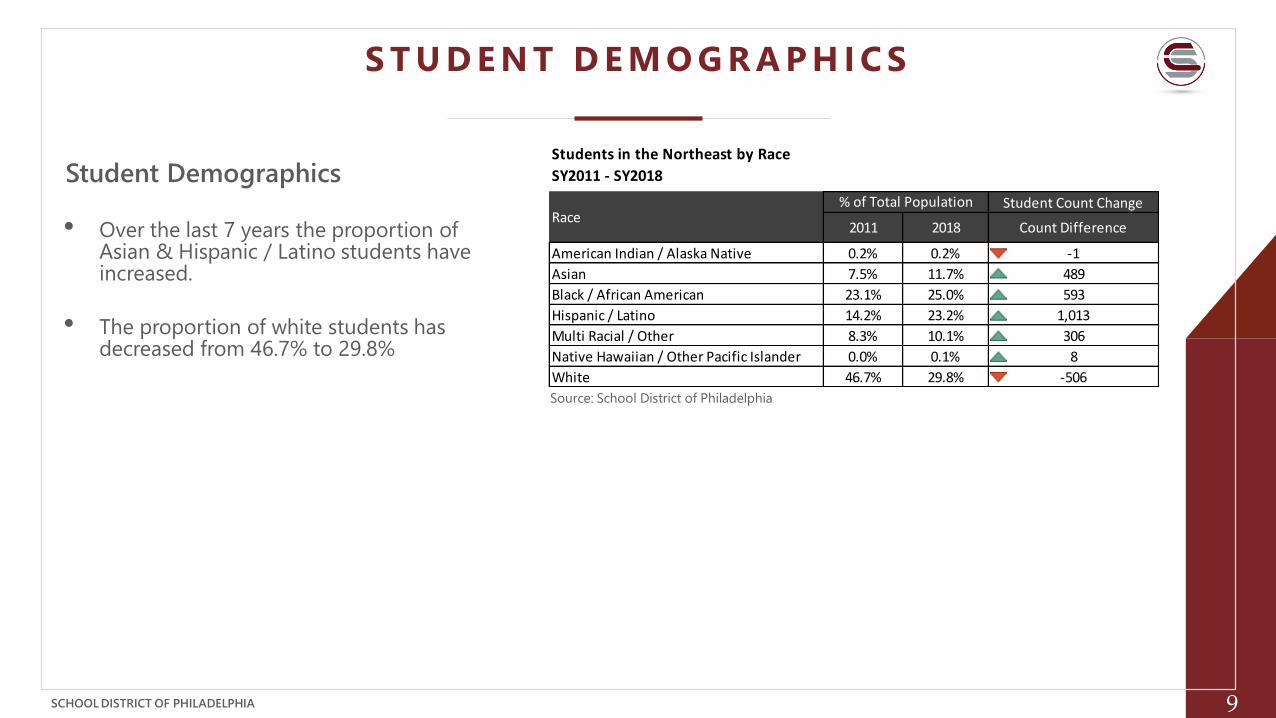
Students in the Northeast by Race
SY2011 - SY2018
Student Count Change
2011 2018 Count Difference
American Indian / Alaska Native 0.2% 0.2% -1
Asian 7.5% 11.7% 489
Black / African American 23.1% 25.0% 593
Hispanic / Latino 14.2% 23.2% 1,013
Multi Racial / Other 8.3% 10.1% 306
Native Hawaiian / Other Pacific Islander 0.0% 0.1% 8
White 46.7% 29.8% -506
% of Total PopulationRace• Over the last 7 years the proportion of
Asian & Hispanic / Latino students have increased.
• The proportion of white students has decreased from 46.7% to 29.8%
Student Demographics
S T U D E N T D E M O G R A P H I C S
Source: School District of Philadelphia
SCHOOL DISTRICT OF PHILADELPHIA
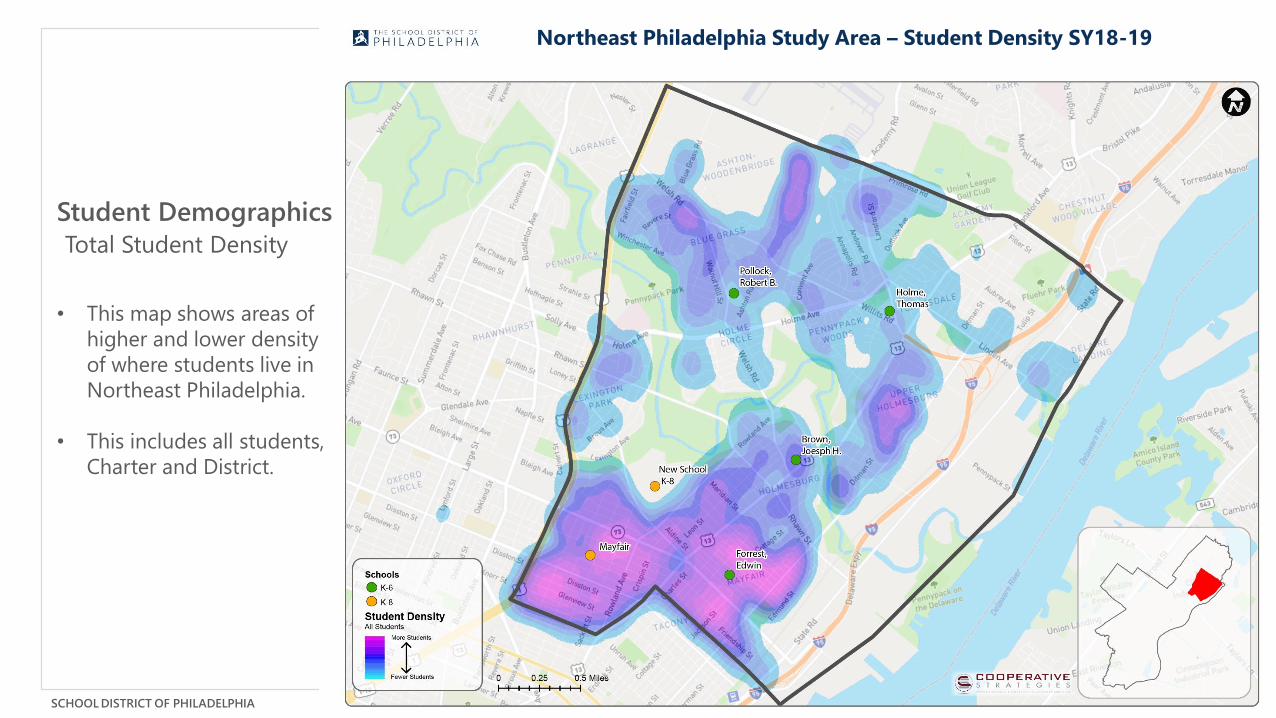
Student Demographics
• This map shows areas of
higher and lower density
of where students live in
Northeast Philadelphia.
• This includes all students,
Charter and District.
Total Student Density
Northeast Philadelphia Study Area – Student Density SY18-19
SCHOOL DISTRICT OF PHILADELPHIA 11
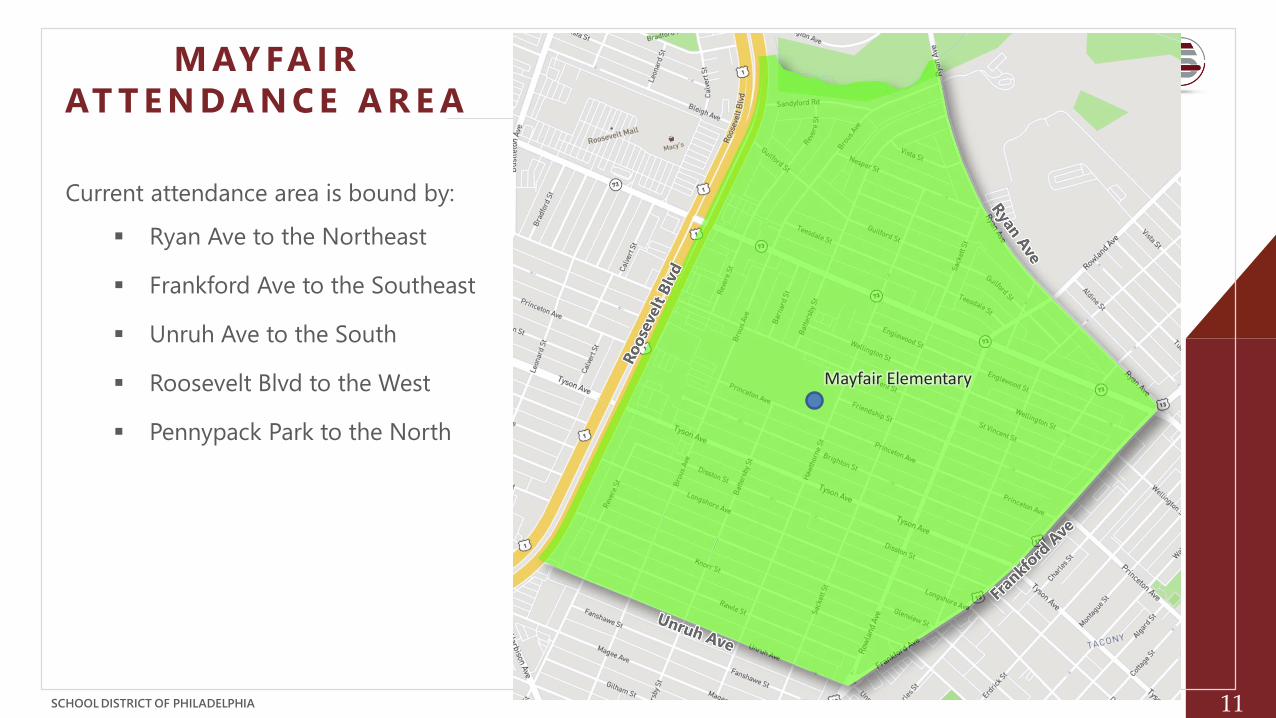
M AY FA I R
AT T E N D A N C E A R E A
Current attendance area is bound by:
▪ Ryan Ave to the Northeast
▪ Frankford Ave to the Southeast
▪ Unruh Ave to the South
▪ Roosevelt Blvd to the West
▪ Pennypack Park to the North
Mayfair Elementary
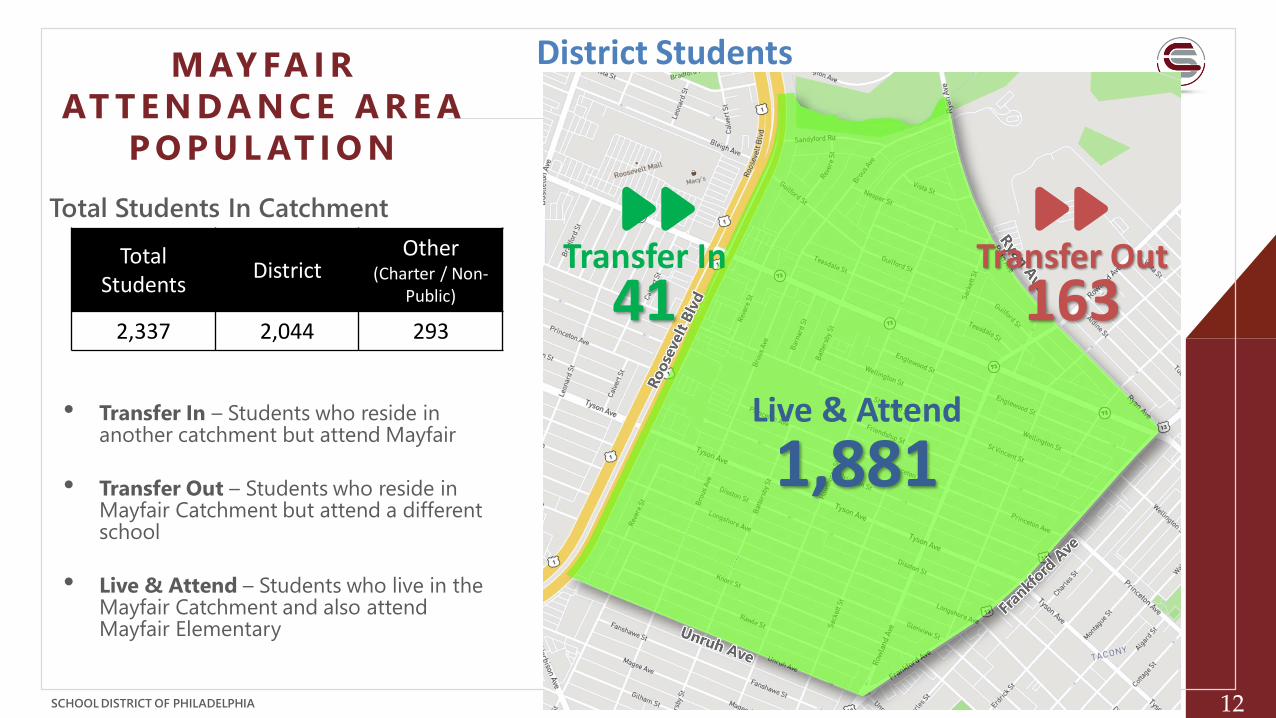
SCHOOL DISTRICT OF PHILADELPHIA 12
Total Students
DistrictOther
(Charter / Non-Public)
2,337 2,044 293
Live & Attend
1,881
Transfer Out
163Transfer In
41
Total Students In Catchment
District StudentsM AY FA I R
AT T E N D A N C E A R E A
P O P U L AT I O N
• Transfer In – Students who reside in another catchment but attend Mayfair
• Transfer Out – Students who reside in Mayfair Catchment but attend a different school
• Live & Attend – Students who live in the Mayfair Catchment and also attend Mayfair Elementary
SCHOOL DISTRICT OF PHILADELPHIA 13
0
500
1,000
1,500
2,000
2,500
2009 2010 2011 2012 2013 2014 2015 2016 2017 2018 2019 2020 2021 2022 2023
Enro
llm
en
t
Year
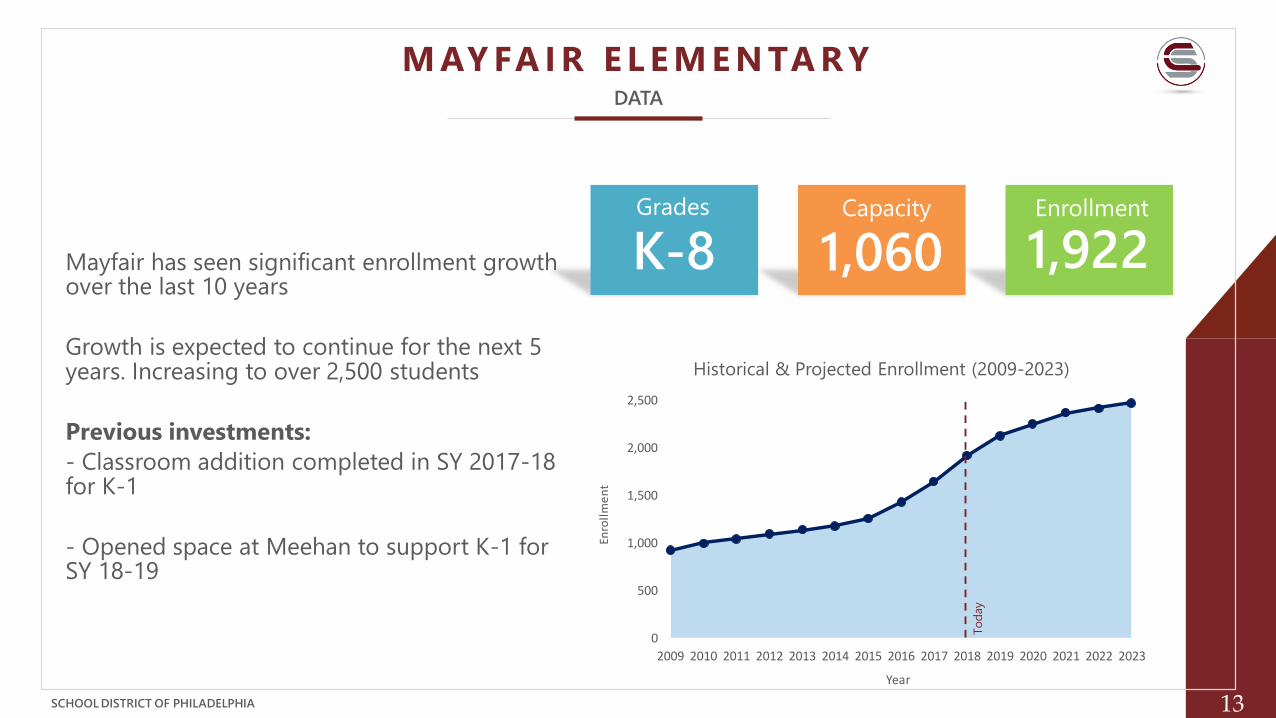
M AY FA I R E L E M E N TA R YDATA
Historical & Projected Enrollment (2009-2023)
Grades
K-8Capacity
1,060 1,922Enrollment
Mayfair has seen significant enrollment growth over the last 10 years
Growth is expected to continue for the next 5 years. Increasing to over 2,500 students
Previous investments:
- Classroom addition completed in SY 2017-18 for K-1
- Opened space at Meehan to support K-1 for SY 18-19
To
day
SCHOOL DISTRICT OF PHILADELPHIA 14
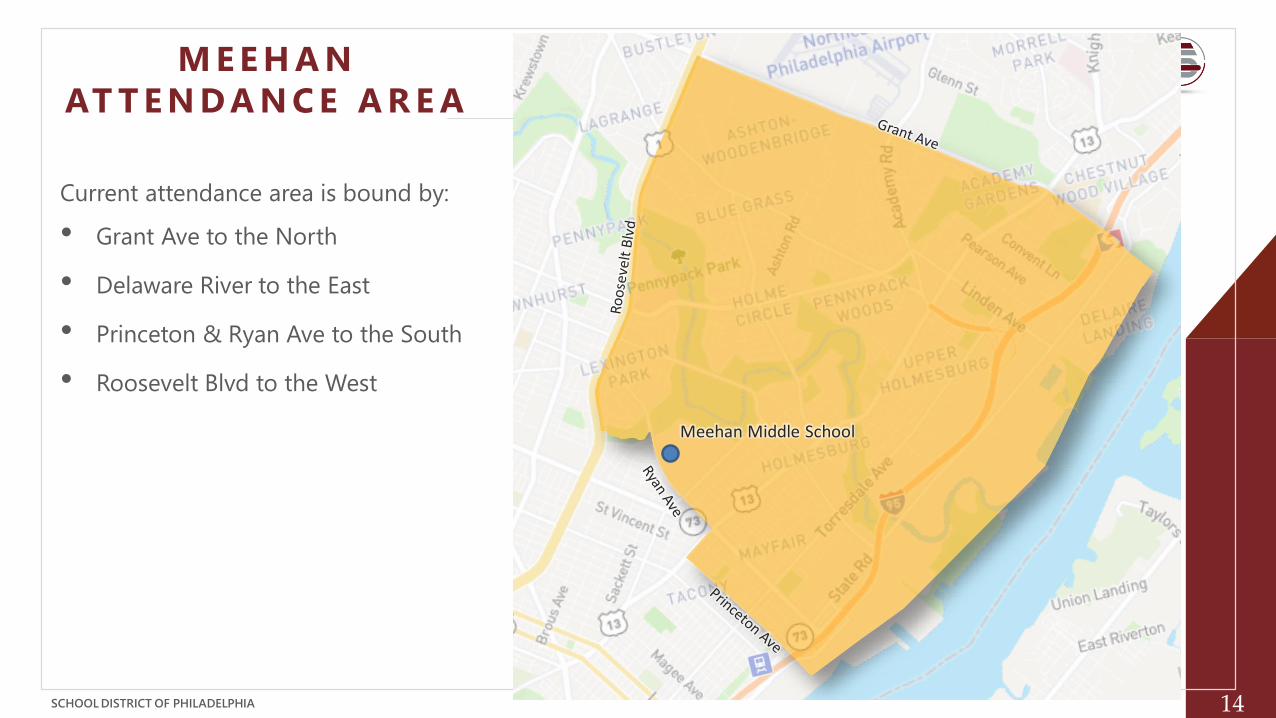
M E E H A N
AT T E N D A N C E A R E A
Current attendance area is bound by:
• Grant Ave to the North
• Delaware River to the East
• Princeton & Ryan Ave to the South
• Roosevelt Blvd to the West Mayfair Elementary
Meehan Middle School
SCHOOL DISTRICT OF PHILADELPHIA 15
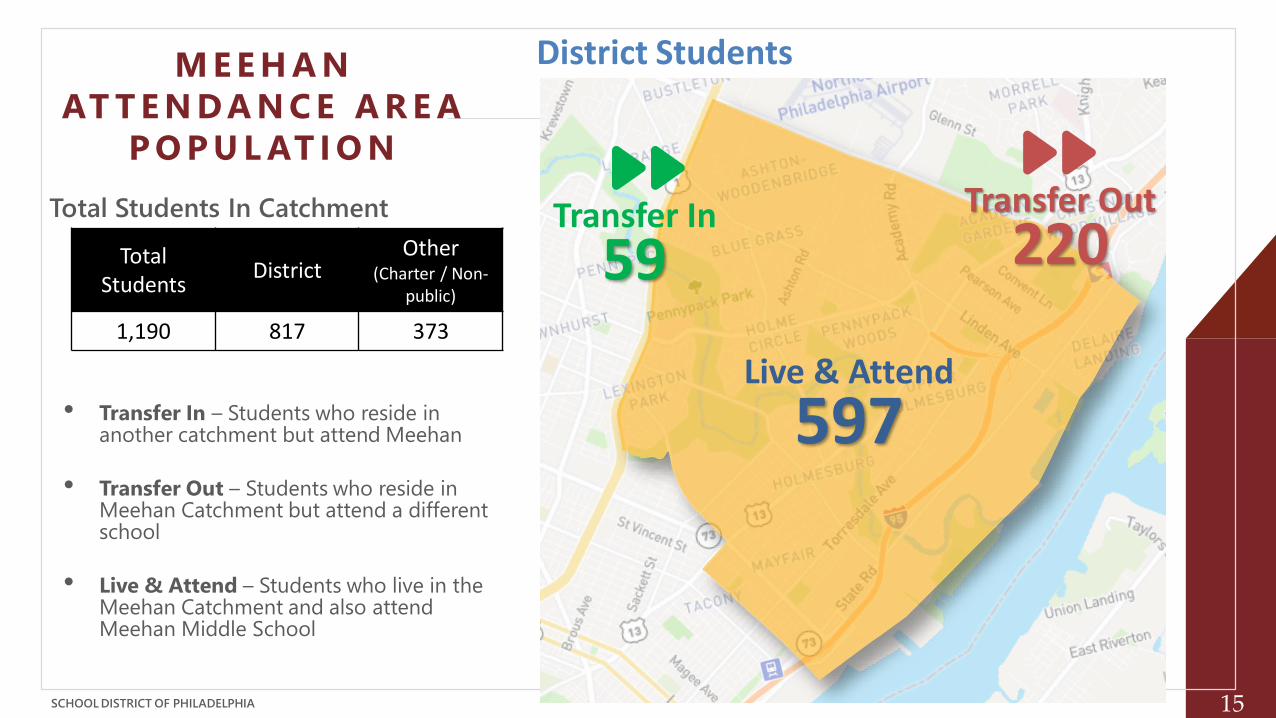
Total Students
DistrictOther
(Charter / Non-public)
1,190 817 373
Live & Attend
597
Transfer Out
220Transfer In
59Total Students In Catchment
District StudentsM E E H A N
AT T E N D A N C E A R E A
P O P U L AT I O N
• Transfer In – Students who reside in another catchment but attend Meehan
• Transfer Out – Students who reside in Meehan Catchment but attend a different school
• Live & Attend – Students who live in the Meehan Catchment and also attend Meehan Middle School
SCHOOL DISTRICT OF PHILADELPHIA 16
0
100
200
300
400
500
600
700
800
900
1,000
2009 2010 2011 2012 2013 2014 2015 2016 2017 2018
Enro
llmen
t
Year
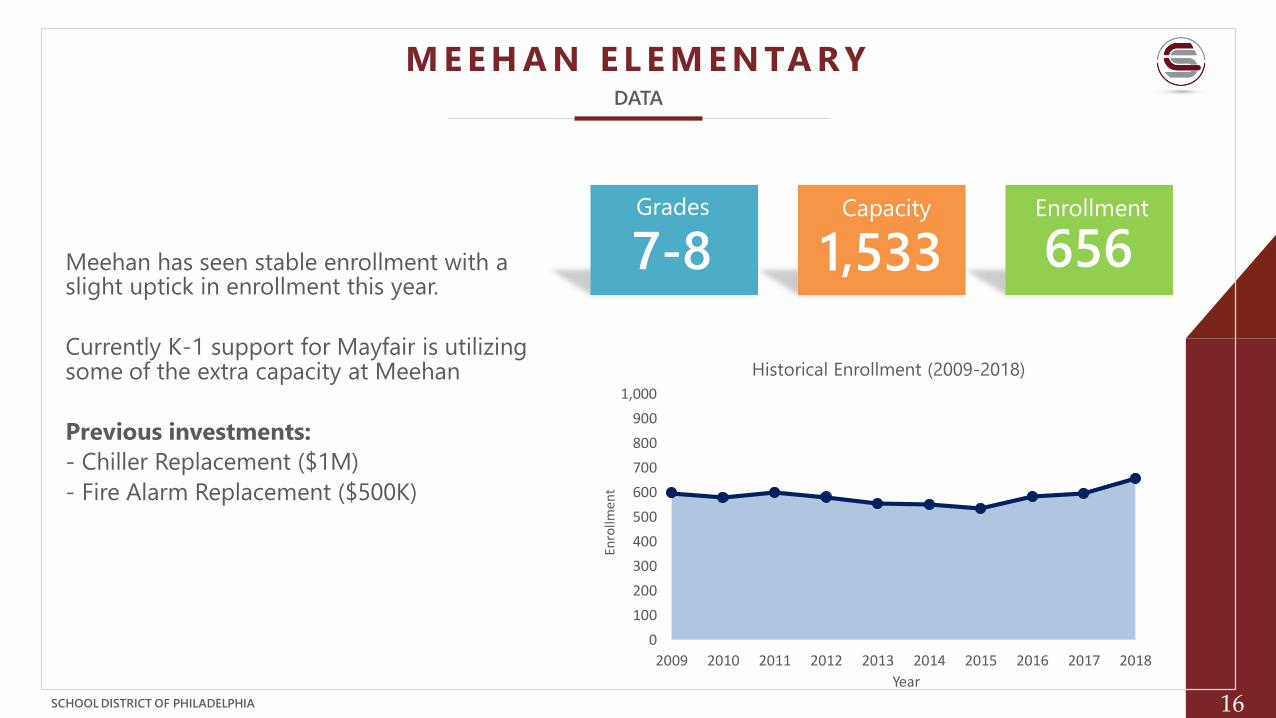
M E E H A N E L E M E N TA R YDATA
Historical Enrollment (2009-2018)
Grades
7-8Capacity
1,533 656Enrollment
Meehan has seen stable enrollment with a slight uptick in enrollment this year.
Currently K-1 support for Mayfair is utilizing some of the extra capacity at Meehan
Previous investments:
- Chiller Replacement ($1M)
- Fire Alarm Replacement ($500K)
SCHOOL DISTRICT OF PHILADELPHIA 17
O V E R V I E W
• Using a systems level approach to boundaries
• Balancing the needs of an individual school community with the needs of the whole
• When we add a new school we have to draw a new boundary somewhere….
Current Boundaries
New School
SCHOOL DISTRICT OF PHILADELPHIA 18
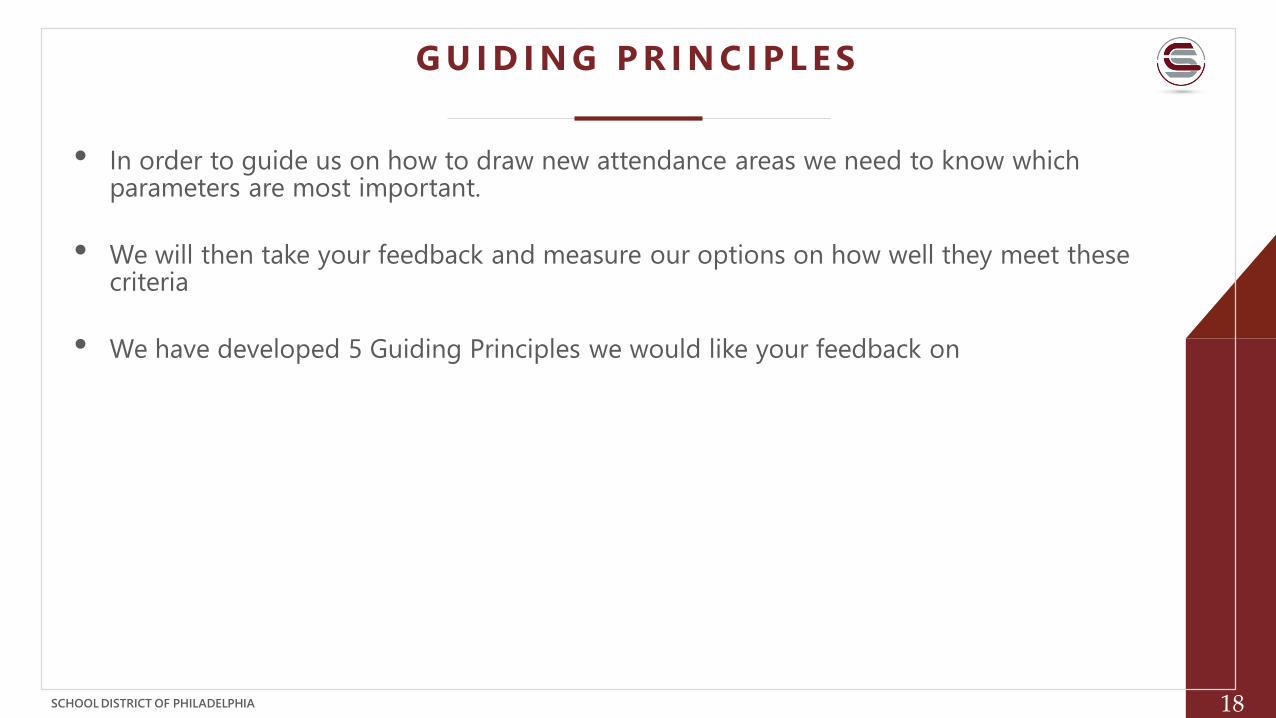
G U I D I N G P R I N C I P L E S
• In order to guide us on how to draw new attendance areas we need to know which parameters are most important.
• We will then take your feedback and measure our options on how well they meet these criteria
• We have developed 5 Guiding Principles we would like your feedback on
SCHOOL DISTRICT OF PHILADELPHIA 19
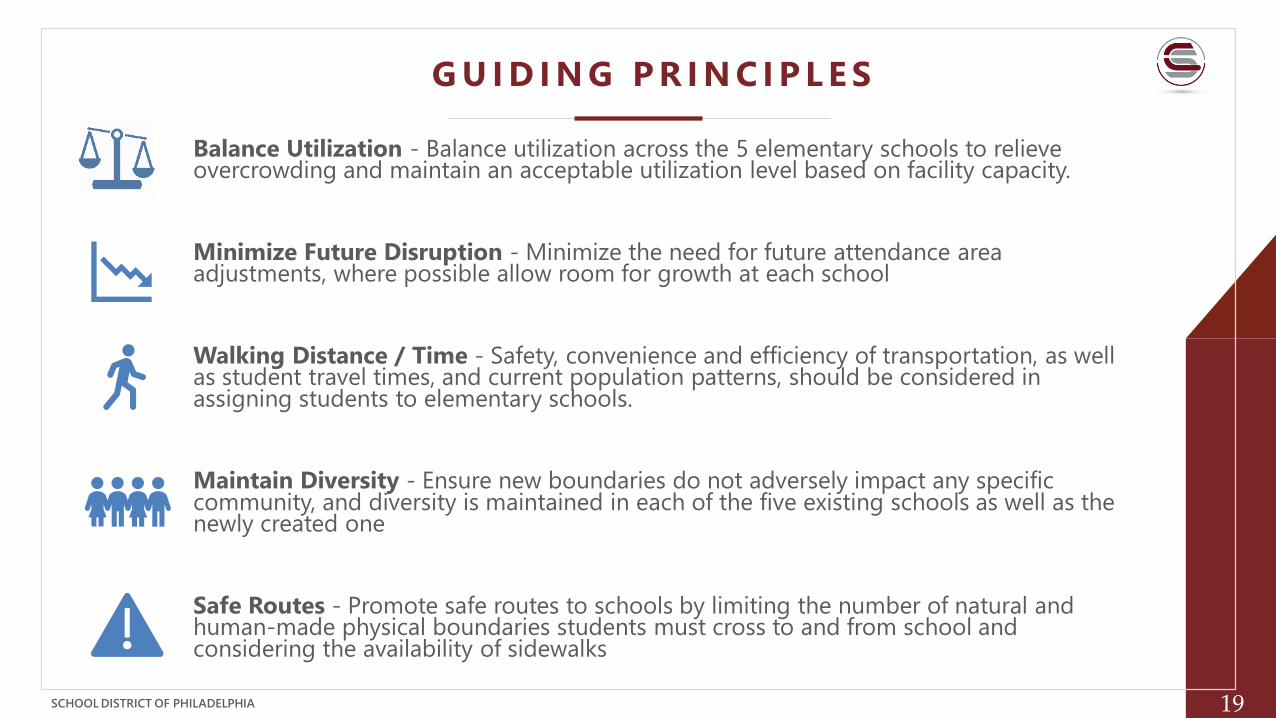
G U I D I N G P R I N C I P L E S
Balance Utilization - Balance utilization across the 5 elementary schools to relieve overcrowding and maintain an acceptable utilization level based on facility capacity.
Minimize Future Disruption - Minimize the need for future attendance area adjustments, where possible allow room for growth at each school
Walking Distance / Time - Safety, convenience and efficiency of transportation, as well as student travel times, and current population patterns, should be considered in assigning students to elementary schools.
Maintain Diversity - Ensure new boundaries do not adversely impact any specific community, and diversity is maintained in each of the five existing schools as well as the newly created one
Safe Routes - Promote safe routes to schools by limiting the number of natural and human-made physical boundaries students must cross to and from school and considering the availability of sidewalks
SCHOOL DISTRICT OF PHILADELPHIA 20
I M P L I C AT I O N S
• Some of these Principles will be in direct conflict with each other
• So consider how some of these guiding principles affect one another and which items are more important to you
• For example:
▪ You may be able to achieve balancing utilization perfectly across the northeast but this will be at the detriment to walking distance & time because you would have to send students to schools that have the capacity
▪ Also we may be able to impact less students now with a boundary change but this could be at the at the detriment of minimizing future impact because we haven't solved the growth and over crowding long-term
SCHOOL DISTRICT OF PHILADELPHIA 21
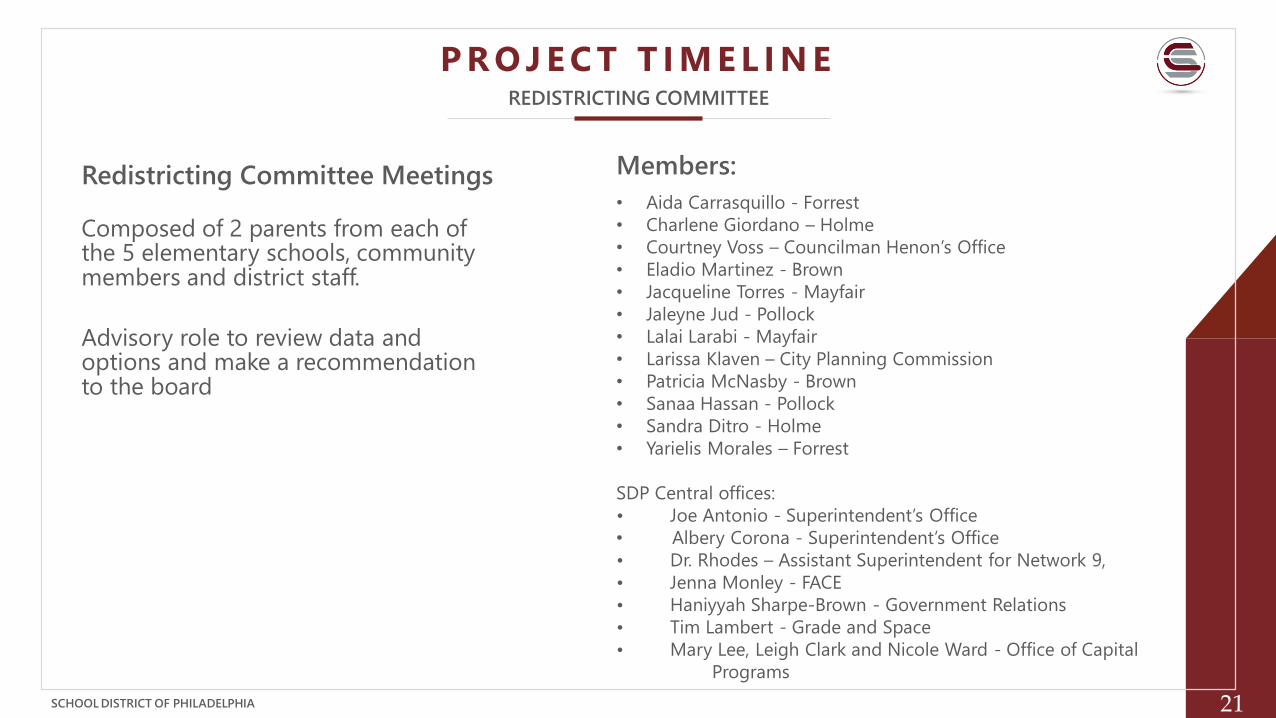
P R O J E C T T I M E L I N EREDISTRICTING COMMITTEE
Composed of 2 parents from each of the 5 elementary schools, community members and district staff.
Advisory role to review data and options and make a recommendation to the board
Redistricting Committee Meetings Members:
• Aida Carrasquillo - Forrest
• Charlene Giordano – Holme
• Courtney Voss – Councilman Henon’s Office
• Eladio Martinez - Brown
• Jacqueline Torres - Mayfair
• Jaleyne Jud - Pollock
• Lalai Larabi - Mayfair
• Larissa Klaven – City Planning Commission
• Patricia McNasby - Brown
• Sanaa Hassan - Pollock
• Sandra Ditro - Holme
• Yarielis Morales – Forrest
SDP Central offices:
• Joe Antonio - Superintendent’s Office
• Albery Corona - Superintendent’s Office
• Dr. Rhodes – Assistant Superintendent for Network 9,
• Jenna Monley - FACE
• Haniyyah Sharpe-Brown - Government Relations
• Tim Lambert - Grade and Space
• Mary Lee, Leigh Clark and Nicole Ward - Office of Capital
Programs
SCHOOL DISTRICT OF PHILADELPHIA 22
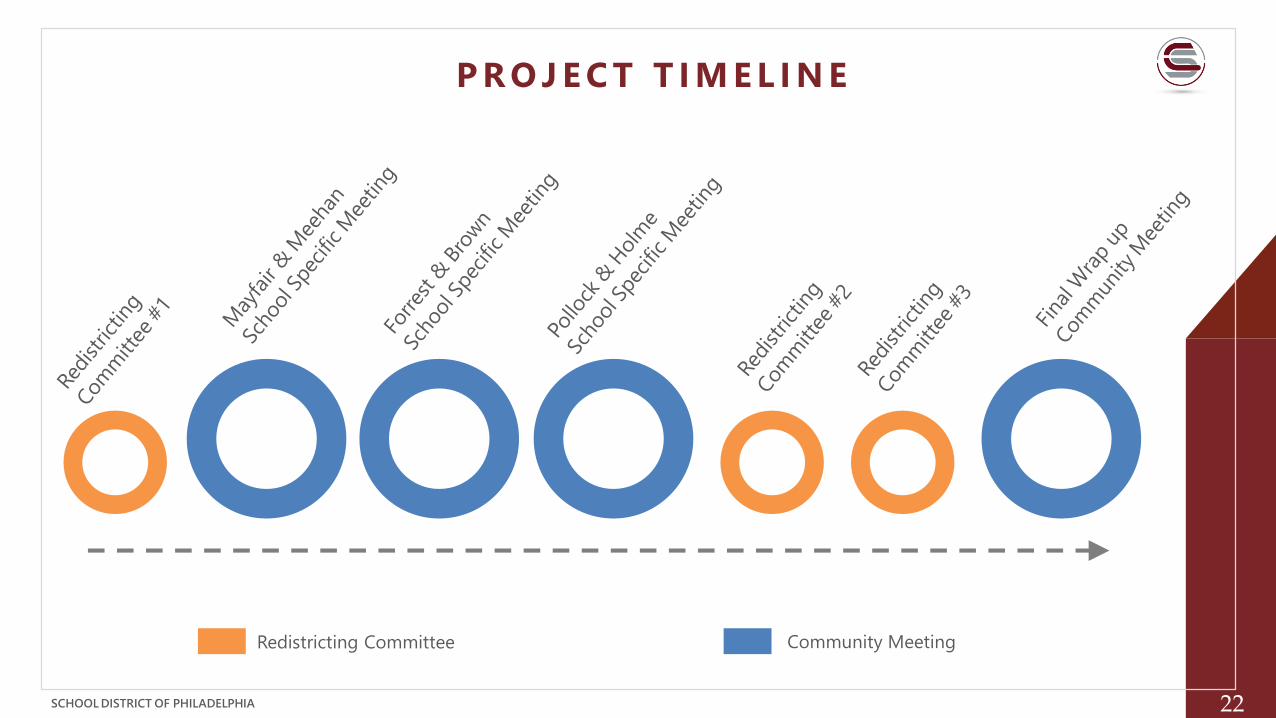
P R O J E C T T I M E L I N EATTENDANCE BOUNDARY TIMELINE
Redistricting Committee Community Meeting
SCHOOL DISTRICT OF PHILADELPHIA 23
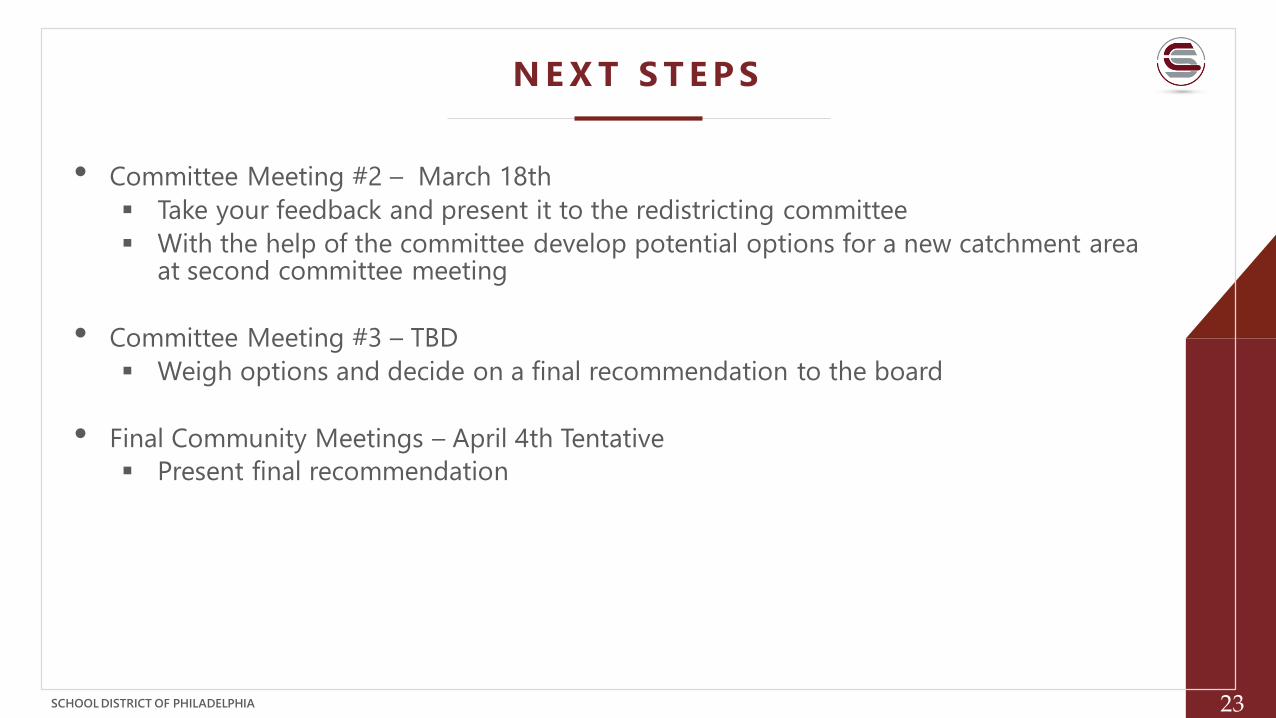
N E X T S T E P S
• Committee Meeting #2 – March 18th
▪ Take your feedback and present it to the redistricting committee
▪ With the help of the committee develop potential options for a new catchment area at second committee meeting
• Committee Meeting #3 – TBD
▪ Weigh options and decide on a final recommendation to the board
• Final Community Meetings – April 4th Tentative
▪ Present final recommendation
SCHOOL DISTRICT OF PHILADELPHIA 24
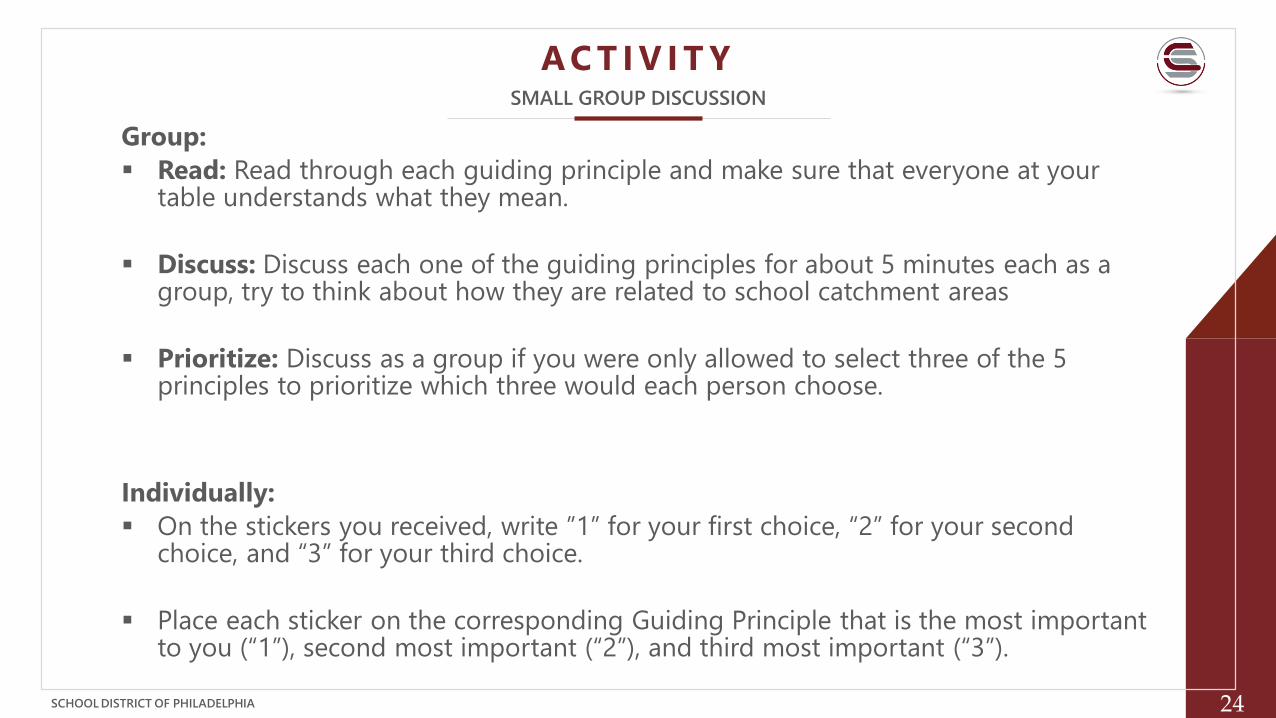
A C T I V I T Y
Group:
▪ Read: Read through each guiding principle and make sure that everyone at your table understands what they mean.
▪ Discuss: Discuss each one of the guiding principles for about 5 minutes each as a group, try to think about how they are related to school catchment areas
▪ Prioritize: Discuss as a group if you were only allowed to select three of the 5 principles to prioritize which three would each person choose.
Individually:
▪ On the stickers you received, write ”1” for your first choice, “2” for your second choice, and “3” for your third choice.
▪ Place each sticker on the corresponding Guiding Principle that is the most important to you (“1”), second most important (“2”), and third most important (“3”).
SMALL GROUP DISCUSSION
SCHOOL DISTRICT OF PHILADELPHIA 25
Q U E S T I O N S
• Questions?
• Project Website: https://www.philasd.org/capitalprograms/newschoolonryanave/