Embed Size (px)
Citation preview
INSPECTIONEERINGJOURNALMAY
JUNE2007_____
Vol 13Issue 3
API p.2TechReportonSCCofCSinFuelGradeEthanol
Heat p.3ExchangerTubeInspection–Update
RBI p.11UtilizingMetricsMaximizingtheValue
Why p.17OperatingSitesJustDon’tGetIt
…”Hence the likelihood thatinspection will find changing corrosion
rates because of process changes that are unknown to them is quite low.”
Why Some Operating Sites Just Don’t Get It, by John Reynolds
9-13EUROCORR 2007, Konzerthaus Freiburg im Breisgau, Germany > VE and more. For more information visit the web site http://www.eurocorr.org/EUROCORR+2007.html 16-20NACE Corrosion Technology Week 2007, Houston, TX > For more information contact Linda Goldberg phone: 281/228-6221 e-mail: [email protected] 17-19API Fall Refining Meeting, San Antonio, TX > CAS, RI, NDE, FFS, RBI. For more information visit the web site www.API.org
May / June2007_____
Vol 13 Issue 3
The Inspectioneering® Journal is a bi-monthly,
copyright protected, periodical publishedsix times per year.
Please address allcorrespondence to:
The Inspectioneering® Journal5315 FM 1960 West,
Suite B 237Houston, TX77069 USA
Phone: (281) 397-7075Fax: (281) 397-9996Email: [email protected]
Website:www.inspectioneering.com
Publisher:Dawn Alvarado
Chief Editor:Gregory C. Alvarado
Contributing Author:
John T. Reynolds, Shell Global Solutions (US), Inc.
(retired)
Brian BeresfordTechCorr Inspection
and Engineering
(ISSN 1082-6955)
IJ Industry.....Activities PlannerThe Inspectioneering® Journal does not warrant nor guarantee the accuracy of any infor-mation contained, nor the extent of inclusiveness, in the Industry Activities Planner. It is imperative that interested parties contact the sponsoring organizations, for each par-ticular event, to verify dates, information and locations, prior to any planning or decision making regarding the value of each event. Readers may contact the Inspectioneering® Journal office to obtain appropriate contact information.
Please e-mail any activities of interest you think applicable to the Inspectioneering® community to [email protected].
11-1327th Annual ILTA (Independent Liquid Terminals Assn.) International Operating Conference & Exhibition, George R. Brown Convention Center and Hilton Hotel, Houston, TX > RI, CAS, VE. For more information visit the web site http://www.ilta.org/CalendarofEvents/AOCTS/2007/2007info.htm 12-13Asset Integrity Management Summit, The Marcliffe Hotel, Aberdeen, UK > CAS, RL, NDE, FFS, MI, RBI, FFS, RI and more. For more information visit the web site http://www.iqpc.com/cgi-bin/templates/genevent.html?topic=229&event=12757& 20-23ASME International Chemical and Petroleum Industry Inspection Technology (ICPIIT) X Conference, Houston, TX >NDE, VE, CAS, RI. For more information visit the web site http://www.asnt.org/events/conferences/icpiit/icpiit.htm
JUNE 2007
22-2734th Annual Review of Progress in Quantitative Nondestructive Evaluation, Colorado School of Mines, Golden, Colorado > NDE
JULY 2007
SEPTEMBER 2007
9-11ESOPE 2007, European Symposium on Pressure Equipment, Paris, France> FFS, RBI, VE, CAS, RI, NDE. For more information visit the web site http://www.afiap.org/MAJ/evenementsEsope_2007_En.pdf
OC TOBER 2007

I N D E X -
New from API .................................2API Technical Report 939-D, Second Edition, Stress Corrosion Cracking of Carbon Steel in Fuel Grade Ethanol: Review, Experience Survey, Field Monitoring, and Laboratory Testing
Inspection of Heat .................... 3-10Exchanger, Condenser & Fin Fan Coolers Tubes – An Update
Risk Based Inspection ............. 11-16Utilizing MetricsMaximizing the Value
Why Some Operating Sites ....... 17-20 “Just Don’t Get It”
Please make checks payable to The Inspectioneering Journal 5315 FM 1960 West, Suite B 237
Houston, TX 77069 Telephone: (281) 397-7075 Fax: (281) 397-9996
Email: [email protected] Website: www.inspectioneering.com
Subscriber Name (Recipient)
Company Name
Address
City State/Province Zip/Code
Phone Fax
Email URL
Credit Card No. Expiration Date
Cardholder Signature Date
Digital Subscriptions Available: Send pricing, format and delivery questions to [email protected]
❑ YESI would like to subscribe to the INSPECTIONEERING JOURNAL
Single subscriptions cost $225.00 U.S. per year (6 issues). 10% discount for2 yr. subscriptions. Contact us for details on multiple subscription pricing. Non-U.S. subscribers add for postage, handling and transfers: in Canada and Mexico: add $40.00 U.S. per year, All others: add $50.00 U.S. per year. Except wire transfers: add $40.00 U.S. per transfer.
___________________________________________________________________________________________________
___________________________________________________________________________________________________
___________________________________________________________________________________________________
___________________________________________________________________________________________________
___________________________________________________________________________________________________
___________________________________________________________________________________________________
_______________________________________________________________
❑ Renewal ❑ New Subscription ❑ Check Enclosed ❑ Bill Me (payment due in 30 days)
_______________________________________________________________________________________
Cardholder Name________________________________
IJ Article Submission and Publication 1. AllarticlesmustadheretotheGuidelinesandRequirementslistedonourwebsiteat http://www.inspectioneering.com/publishanarticle.htm. 2. Authorsmusthave/obtainauthorizedpermissiontoprint,withcompanyandnamebyline,inthispublication. 3. Sendduplicatesofallphotos,illustrations,andvisualaidswithpermissiontoreprint.Mustbesubmitted withdraftarticle. “IJ”retainsrighttoreprintandarchiveallvisualaidssubmittedforuse. 4. Unlessotherwiserequested,articlesmustbeonepageinlength,10to12cpi,singlespaced. 5. Editorandcontributingeditorswillmakeallfinaldecisionsregardingacceptanceofarticle,i.e.valueand appropriatenessjudgements,alongwitheditingdecisions. 6. Authorisresponsibleforfinalreview,followingstep5,andauthorizationfromhis/heremployertorelease, asnecessary. 7. Allarticlesacceptedbythe“IJ”becomethepropertyofthe“IJ”.Noreprintispermittedwithoutprior writtenauthorization.
The Inspectioneering® Journal assumes no responsibilities or liabilities for the accuracy or application of methodologies, technologies, philosophies, references, case histories, or un-authorized release of company information in relation to any printed subject matter in the Inspectioneering® Journal The Inspectioneering® Journal, the editors and authors, or anyone acting on their behalf, assume no responsibility or liability, without limitation, for the use of information published in the Inspectioneering® Journal.

2 INSPECTIONEERING JOURNAL May/June 2007
Introduction The American Petroleum Institute (API) is issuing this publications announcement to inform companies involved in the distribution, transportation, storage, and blending of denatured fuel ethanol of a potential for metal cracking and product leakage from carbon steel equipment in certain portions of the fuel ethanol distribution system. API, with assistance from the Renewable Fuels Association (RFA), has published Technical Report 939-D, Second Edition, that describes cracking events and associated ethanol leaks, the results of related research and field studies, and preliminary guidelines for mitigation and prevention. However, this announcement is being issued at this time so that handlers of fuel ethanol can evaluate the need for additional appropriate precautions.
Background Fuel ethanol is increasingly being used as a gasoline oxygenate and extender. It is supplied to specifications described in ASTM D 4806 that provides guidance primarily for product purity and functionality of fuel ethanol in gasoline blends used in automotive engines. Once manufactured, fuel ethanol is transported by a number of means (e.g. tanker trucks, rail tanker cars, barges and pipelines) to ethanol distribution facilities and gasoline blending facilities where it is held in storage tanks prior to blending with gasoline. The primary material of construction used in this distribution system is carbon steel. Until recently, fuel ethanol was not widely recognized for its potential to cause cracking of carbon steel. API is issuing this announcement because of the potential impact of cracking and leaks if this problem is not adequately managed.
Field Experience In the API investigations conducted to date, it is apparent that a number of leaks have occurred in equipment handling fuel ethanol due to cracking of the carbon steel. Approximately two dozen cases of cracking and leaks have been documented in various types of equipment including storage tanks, piping, and associated handling equipment in the distribution system for fuel ethanol, and in an ethanol transport pipelines. However, there have been no reported cases at ethanol manufacturing facilities, nor has cracking been reported after ethanol has been added into conventional gasoline blends with nominally 10 percent ethanol with balance gasoline. Thus far, no cracking events have been reported in carbon steel equipment exposed to E85 fuel blends.
New From API
API Technical Report 939-D, Second Edition,Stress Corrosion Cracking of Carbon Steel inFuel Grade Ethanol: Review, Experience Survey, Field Monitoring, and Laboratory Testing
Key MessagesThere have been metallurgical investigations conducted in several documented cases and preliminary research has been conducted by API with the assistance of the RFA. Even though the factors that lead to cracking are not completely understood, it is known to occur by a phenomenon referred to as stress corrosion cracking. Based on a survey of companies involved in the distribution and handling of fuel ethanol, several have taken steps to inspect for cracks and mitigate this problem. Inspection techniques have included use of wet fluorescent magnetic particle testing to find cracks on interior surfaces exposed to fuel ethanol. Mitigation techniques used by some companies include thermal stress relief of welds in piping and the use of internal coatings in storage tanks that are resistant to immersion in ethanol, however, these measures are considered interim until more research is conducted. Most recently, laboratory tests have indicated a susceptibility to cracking of carbon steel in E85 blends of fuel ethanol and gasoline however, there have been no documented cases of cracking of carbon steel equipment in E85 in the field.
Additional Information
The following are resources for additional information:
ASTM D 4806,Specifications for Fuel Grade EthanolASTM International100 Barr Harbor DriveP.O. Box C700West Conshohocken, PA 19428-2959Order Information: Phone 610-832-9585;Online: www.astm.org
Please contact API at [email protected] if you have information on failures of carbon steel equipment in fuel ethanol service or in ethanol gasoline blends.
Printed copies of API TR 939-D, Second Edition, may be purchased for $147.00 each. API members receive a 30% discount on orders. For more information on ordering this and all API publications, visit www.api.org/cat.
Second Edition, May 2007Pages: 172Price: $147.00Product No. C939D2

3 INSPECTIONEERING JOURNAL May/June 2007
Editor’s note: A well designed qualification demonstration testing program is strongly recommended for these NDE techniques and operators applying them. Many articles on such a program have appeared in the “IJ”. This type of “gate keeping” program should include consideration for the types of flaws or damage expected, the degree of damage, accuracy, the orientation of damage, extenuating factors such as tubesheet, baffle and fin presence or proximity, etc. The operator, procedure, hardware and software should be qualified, collectively. Verification and confirmation of results are always recommended prior to undertaking any costly repairs or replacements.
Inspection of Heat Exchanger,Condenser & Fin Fan
Coolers Tubes – An UpdateBy Brian Beresford,
TechCorr Inspection & Engineering, Houston, TX
Tube inspection is a vital tool for the refining and petrochemical industries. Heat exchangers and condensers are designed to sustain 100% separation between the products in the tube (tube side) and the products in the vessel (shell side). A leaking tube can not only cause a significant impact to production it can cause major environmental issues and the potential for loss of life.
Tube Inspection techniques have been available for decades. Historically the costs for inspections have been extraordinarily high due to probe manufacturing and instrumentation costs. Only nuclear facilities which are heavily regulated could afford these services. Over the past decade improvements in manufacturing capabilities have helped to decrease the cost for testing devices. The 1986 Process Safety Improvement Act also resulted in an increased demand for inspection services. These two factors have contributed to more cost effective probe design and decreased cost to perform inspections. Tube inspection services are much more cost effective for the oil and gas industry equipment operators than in the past.
Now exchangers and condensers are being inspected on a more regular basis. This has lead to improved bundle reliability for the oil and gas companies. The inspection allow the operators to improve preventative maintenance programs by identifying damaged tubes requiring immediate replacement during maintenance outages and the ability to more accurately determine remaining life so maintenance activities can be scheduled during future outages and finally the ability to manage “Risk” by reducing the number of unforeseen unplanned outages. These benefits have provided significant reliability improvements for refinery and petrochemical operators and will continue to grow as technology and implementation practices continue to improve over time.
Current Technology
Tube inspection techniques include Eddy Current, Remote Field Eddy Current, Magnetic Flux Leakage, IRIS (UT technique) and LOTIS (Laser) profilemetry. Although this article focuses on electromagnetic based techniques the ultrasonic and laser techniques require mentioning as the techniques are very complimentary and often used in parallel.
Tube inspection is typically broken down into two (2) categories; ferrous and nonferrous. Ferrous materials refer to materials with magnetic properties such as carbon steel and 400 series stainless steel. Nonferrous materials refer to materials with nonmagnetic properties such as copper, brass, Inconel and most stainless steels. The following table shows the techniques that are used for the different tubes materials.
Technique Table Eddy
Current
Remote Field
Eddy Current
Magnetic
Flux Leakage
IRIS (UT) Laser
Ferrous X X X X
Nonferrous X X X
Key words: ferro-magnetic,non-ferro-magnetic, eddy current, remote field eddy current, laser profilometry, internal rotary inspection system (IRIS), baffle, tubesheet, externally referenced electromagnetic technique, fin tubes, accuracy, austenitic, ferritic, cleanliness

4 INSPECTIONEERING JOURNAL May/June 2007
Although the choice of technique used is primarily influenced by the type of “failure mechanism” needed to be detected many times the technique used is dictated by the tube cleanliness. For example, whereas the utilization of IRIS and Laser require a high degree of tube cleanliness, ET, RFT and MFL do not require the same level of cleanliness. There are several damage mechanisms and flaws that can occur on the outside or inside diameter surfaces (O.D. or I.D.) as well as volumetric damage. The following table shows the various flaws that can be detected with the various techniques for both nonferrous and ferrous tubing materials.
Eddy Current Eddy Current Testing (ET) is very sensitive to a great number of variables making it a powerful examination tool. The eddy current testing method is based on inducing electrical currents (eddy currents) in electrically conductive materials. For tube inspection, bobbin type probes are used containing coils as shown. In theory, any defects in the material such as cracks, pitting, wall loss or other discontinuities will disrupt the flow of the eddy currents and be detected by the instrumentation. Most heat exchanger bundles contain supports that are many times likely targets for service type
damage such as fretting, galvanic or oxygen concentration cell corrosion. Multi-frequency channel systems are capable of suppressing or mixing out the unwanted signals responses from supports in order to closely interrogate the material under and near the supports. Mixing is also used for the detection of defects near, at, or within the tubesheet. Conventional eddy current testing is employed primarily on non-ferrous (nonmagnetic) materials due to permeability effects of ferrous materials. Many times the owner/users of the exchangers prefer eddy current testing to IRIS (internal rotary inspection system) inspection as the cleanliness of the tubes is less critical. Additionally, the productivity of eddy current testing can be as much as 3 – 4 times faster than this type of UT inspection.
Technique Flaw Detection Table for Nonferrous Tubing
NONFERROUS MATERIALS
DamageMechanism
ConventionalEddy Current
RemoteField Eddy
Current(RFT)
MagneticFlux
Leakage(MFL)
IRIS (UT) Laser
I.D. General WallLoss
YesYes
(Limited)N/A Yes Yes
O.D. General WallLoss
Yes N/A N/A Yes N/A
I.D. PittingYes (need proper
Calibration standard)N/A N/A
Yes (Limitedpit size)
Yes
O.D. Pitting Yes N/A N/A Yes No
I.D. Cracking(stress corrosion
cracking)
Yes (need properCalibration standard)
N/A N/A NoYes
(Limited)
O.D. Cracking(stress corrosion
cracking)Yes N/A N/A No No
Volumetric Flaws Yes N/A N/A Yes (Limited) N/A
Technique Flaw Detection Table for Ferrous Tubing
FERROUS MATERIALS
DamageMechanism
ConventionalEddy Current
RemoteField Eddy
Current(RFT)
Magnetic FluxLeakage
(MFL)IRIS (UT) Laser
I.D. General WallLoss
Yes (Limited) Yes Yes (Limited) YesYes
Limited
O.D. General WallLoss
N/A Yes Yes (Limited) Yes N/A
I.D. Pitting Yes (Limited) Yes Yes Yes Yes
O.D. Pitting N/A Yes Yes Yes No
I.D. Cracking(stress corrosion
cracking)Yes (Limited) Yes No No
Yes(Limited)
O.D. Cracking(stress corrosion
cracking)N/A Yes No No No
Volumetric Flaws(embedded, etc.)
N/A Yes No Yes (Limited) N/A
An inside-coil or bobbin coil consists of several turns of wire wrapped around a cylindrical form. This probe type is passed through the inside diameter of test specimens such as tubes and bores.

5 INSPECTIONEERING JOURNAL May/June 2007
Remote Field Eddy Current (RFT)
Remote Field Eddy Current Testing (RFT) was developed for ferrous or carbon steel materials and requires a special RFT probe in which the exciter coil is separated from the pickup coil or coils by a distance of two-to-three times the tube diameter. The receiving or pick up coil then detects the flux lines generated that cross the tube wall twice. Due to the highly magnetic properties of ferrous materials, meaningful eddy current testing requires higher power fields. Where previous eddy current techniques on ferrous tubing required complete magnetic saturation of the tube material, RFT does not. The remote RFT amplifier provides the higher power output levels needed for ferrous tube inspection, and the RFT probe coils are designed to handle the increased power levels. Because RFT is transmitted through the tube wall, it is equally sensitive to flaws on the inside diameter (ID) or outside diameter (OD) of the tube. The accuracy for heat exchanger tubes is generally +/- 10%. The accuracy for boiler tubes is generally +/- 20%. The reason for the accuracy difference from exchanger tubes to boiler tubes is the average cross sectional volume. The larger the tube the bigger the average cross sectional volume and the less accurate you will be. As with eddy current, many times the owner/users of the exchangers prefer RFT testing to spinning UT type inspection as the cleanliness of the tubes is less critical. Additionally, the productivity of eddy current testing can be as much as 2 - 3 times faster. RFT is a bit slower than eddy current and it is important that the speed of travel is as constant as possible to obtain accurate responses.
Magnetic Flux Leakage (MFL) MFL is based on the magnetization of the material to inspect using a strong magnet located inside the probe (see illustration). As the probe encounters a wall reduction or a sharp discontinuity, the flux distribution varies around that area and is detected either with a Hall-effect sensor or an inductive pickup coil. This is the result of the large flux leakage response that is generated. MFL has been used successfully on carbon steel fin fan tubes. MFL techniques are less sensitive to the aluminum fins. These perturbations in the magnetic field are detected by the sensors positioned within the magnetic circuit, recorded and later analyzed and reviewed.
Internal Rotary Inspection System (IRIS) Internal Rotary Inspection System (IRIS) is sensitive to both ID and OD forms of volumetric wall loss. The technique uses an ultrasonic beam to scan the tube internal surface in a helical pattern ensuring that the full tube length is tested. The IRIS system monitors the front wall and the back wall echoes in order to precisely measure the tube wall thickness. Measurements can be as accurate as +/- .005 inches. IRIS accuracy and sensitivity are seriously compromised in the presence of ID or OD deposits, bends, and geometry changes. One of the draw backs of IRIS inspections is that the tubes are required to be extremely clean and typically are “soda” blasted. IRIS takes 2-3 times longer than RFT. If areas of geometry changes require examination, complementary methods must be employed. IRIS is not sensitive to non-volumetric forms of degradation such as cracking. Verification and confirmation of results is always recommended prior to undertaking any costly repairs or replacements.
Laser Optical Tube Inspection System (LOTIS)
Laser measurement tools for gauging are based on the principle of optical triangulation. A laser source similar to a standard laser pointer is directed at the surface whose height is to be measured. An imaging lens collects the light reflected from the surface and focuses it onto a position-sensitive detector. The output from the detector is processed
6 INSPECTIONEERING JOURNAL May/June 2007
electronically to convert the detector positions to accurate height measurements that can be stored on a computer for subsequent display and analysis. The laser spins inside the tube creating a helical “rifle” pattern or footprint. The tighter the pattern the more thorough the inspection and the longer the time required for inspection. This method requires high levels of cleanliness and typically that no moisture or moisture droplets are inside the tubes. Deposits will absorb the laser light and moisture will refract the light creating areas of data dropout or erroneous data.
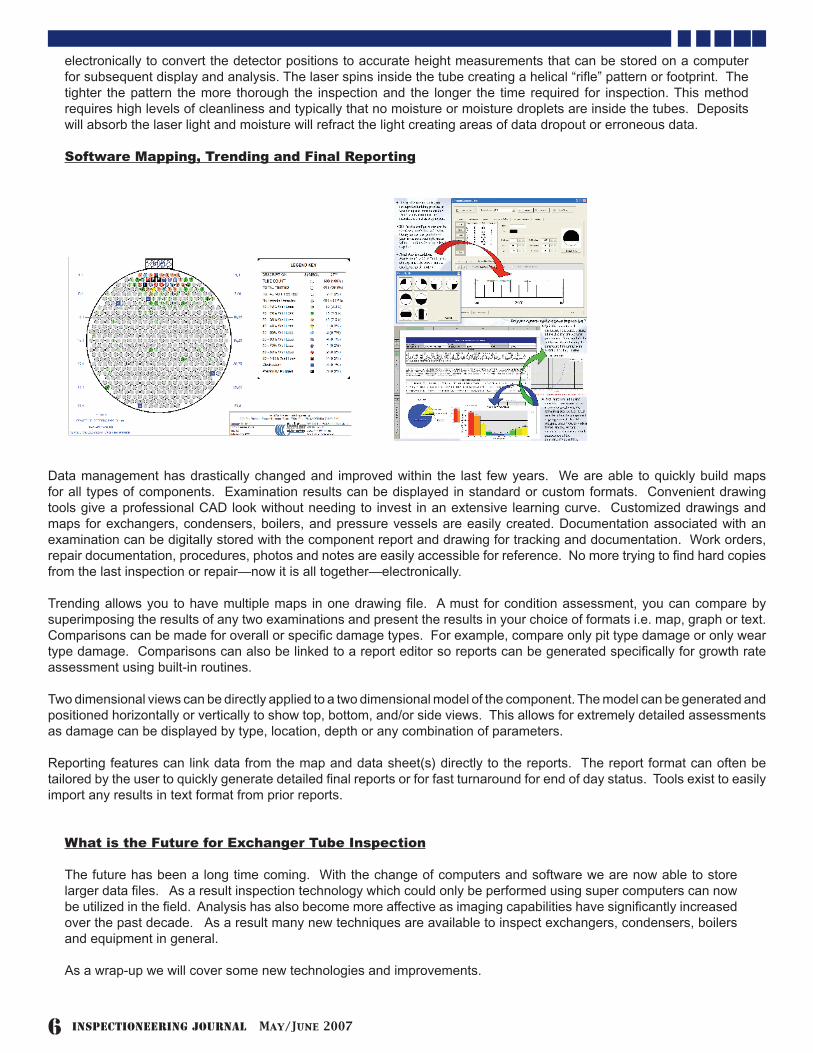
Software Mapping, Trending and Final Reporting
Data management has drastically changed and improved within the last few years. We are able to quickly build maps for all types of components. Examination results can be displayed in standard or custom formats. Convenient drawing tools give a professional CAD look without needing to invest in an extensive learning curve. Customized drawings and maps for exchangers, condensers, boilers, and pressure vessels are easily created. Documentation associated with an examination can be digitally stored with the component report and drawing for tracking and documentation. Work orders, repair documentation, procedures, photos and notes are easily accessible for reference. No more trying to find hard copies from the last inspection or repair—now it is all together—electronically.
Trending allows you to have multiple maps in one drawing file. A must for condition assessment, you can compare by superimposing the results of any two examinations and present the results in your choice of formats i.e. map, graph or text. Comparisons can be made for overall or specific damage types. For example, compare only pit type damage or only wear type damage. Comparisons can also be linked to a report editor so reports can be generated specifically for growth rate assessment using built-in routines.
Two dimensional views can be directly applied to a two dimensional model of the component. The model can be generated and positioned horizontally or vertically to show top, bottom, and/or side views. This allows for extremely detailed assessments as damage can be displayed by type, location, depth or any combination of parameters.
Reporting features can link data from the map and data sheet(s) directly to the reports. The report format can often be tailored by the user to quickly generate detailed final reports or for fast turnaround for end of day status. Tools exist to easily import any results in text format from prior reports.
What is the Future for Exchanger Tube Inspection
The future has been a long time coming. With the change of computers and software we are now able to store larger data files. As a result inspection technology which could only be performed using super computers can now be utilized in the field. Analysis has also become more affective as imaging capabilities have significantly increased over the past decade. As a result many new techniques are available to inspect exchangers, condensers, boilers and equipment in general.
As a wrap-up we will cover some new technologies and improvements.

7 INSPECTIONEERING JOURNAL May/June 2007
Some of the advanced tubular technologies include XRFT a solution to inspect Fin Fan Coolers which historically could not be inspected using electromagnetic techniques. Remote Field and Eddy Current “Array” technology using segmented coils is providing much more sensitivity to small volume pitting and cracking. Finally the SPNR™ probe technology is a non-surface riding coil that provides 100% imagining in a C-scan plot excellent for difficult defect mechanisms.
Fin Fan Inspection
Conventional remote field testing (RFT) is not reliable when inspecting carbon steel fin fan coolers. The fins disturb the electro-magnetic field. This forced the use of ultrasonic methods to inspect fin fan coolers however cleanliness became a major limitation to ultrasonic methods. As a result the Externally Referenced Electromagnetic Technique
(XRFT) was developed. XRFT is an electromagnetic technique using the Remote Field phenomena connected with an external reference to eliminate extraneous noises by utilizing a balanced system (i.e. the extraneous noise is caused by the fins). XRFT has an accuracy rate of +/- 10% of nominal wall, good sensitivity to gradual wall loss and sensitivity to pitting. Pit detection and sizing is directly dependent on fill factor and pit diameter size. XRFT has good repeatability and tubes can be inspected at 1’ per/sec with very little cleaning required. This technique has
good false positive recognition and has made data analysis easy to interpret. The external reference self-comparison differential arrangement uses two differential probes and is setup to provide differential and absolute responses. It essentially combines the self-comparison differential coil arrangement with the external reference absolute coil arrangement. The other probe, located in an external reference sample, compares one of its coils with one of the coils in the inspection probe to provide absolute information and detection of long flaws and dimensional variations.
Probe Designs & Improvements
Although technology has allowed high volume data acquisition to become a reality the improved probe design and manufacturing capabilities have helped to change the tubular inspection business forever.
The Conventional “Bobbin Probe” is a single segmented coil design measuring the average cross sectional volume loss. As a result this method is quantitative.
• Averages 360° Area
• Vector Additions of Multiple Defects
• Defect Morphology Difficult to Determine
New “Array” Probe is a six to eight segmented coil design allowing volumetric discrimination and improved sizing capabilities.
• Segmented coils decreases affects of averaging
• Increased signal to noise ratio
• Limits vector additions of multiple defects
• Provides more detailed information on defect morphology.

8 INSPECTIONEERING JOURNAL May/June 2007
A C-Scan Presentation of the data is now possible using the array probe technology. This presentation is extremely useful during the analysis phase as metal loss can be attributed to specific quadrants within the tube being inspected. As such the morphology of the defect can be better determined when compared to the conventional bobbin probe technique
SPNR™ (Pronounced Spinner) Eddy Current Probe
SPNR = Send-Receive Polarized Non-Contact Rotating probe has historically been utilized in the nuclear industry. The SPNR probe produces two channels per frequency. One channel is sensitive to circumferential flaws and the other sensitive to axial flaws. These channels have been tuned so that they are near identical and overlapping. Any flaw that is volumetric in nature produces equal signals on both the Circ and Axial channels.
This Eddy Current technology is super sensitive to nearly any type of defect mechanism imaginable. It provides a three-dimensional image of the defect allowing detailed data analysis and presentation.
Advantages of SPNR - Polarized sensitivity to flaw orientation results in a maximum response to an indication running parallel to the line of centers between the coils. Excellent flaw characterization. Excellent characterization of “noise” signals including reduced sensitivity to thermal variations and improved characterization of lift off (expansions, ovality, denting), support structures and deposits.
Use of the SPNR probe instead of surface-riding rotating probes considerably reduces inspection time, consumable costs, Simplified analysis and reduced number of questionable calls. Compatible with common data acquisition systems and analysis software SPNR™ Probe is easily reconfigured to a variety of tube diameters and materials.
SPNR™ Reformer Tube Development
TechCorr Inspection & Engineering was requested by Methanex in Punta Arenas, Chile to design and develop an examination technique for the examination of reformer tube headers specifically looking for axial and circumferential. The tube specifications are 800-HT 6” inside diameter excess and the header length is 5950mm (19.5 feet). TechCorr utilized Eddy Current Testing spinner probe technology and was able to see the heat affected zone from the weld and multiple

9 INSPECTIONEERING JOURNAL May/June 2007
axial ligament cracks. The 3-D C-Scan images from the spinner probe were extremely clear and conclusive! This type of 3-D C-Scan display can be implemented to any type of tubing, flat and curved surfaces.
10 INSPECTIONEERING JOURNAL May/June 2007
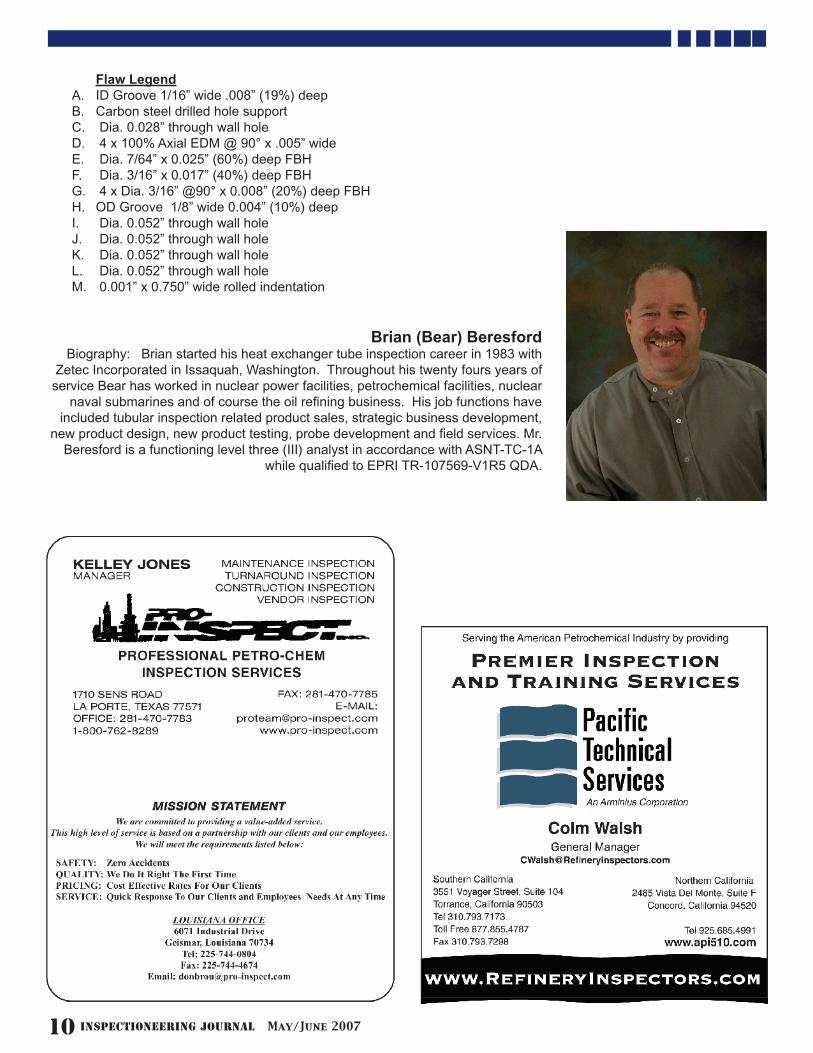
Flaw LegendA. ID Groove 1/16” wide .008” (19%) deep B. Carbon steel drilled hole support C. Dia. 0.028” through wall holeD. 4 x 100% Axial EDM @ 90° x .005” wideE. Dia. 7/64” x 0.025” (60%) deep FBHF. Dia. 3/16” x 0.017” (40%) deep FBHG. 4 x Dia. 3/16” @90° x 0.008” (20%) deep FBHH. OD Groove 1/8” wide 0.004” (10%) deepI. Dia. 0.052” through wall holeJ. Dia. 0.052” through wall holeK. Dia. 0.052” through wall holeL. Dia. 0.052” through wall holeM. 0.001” x 0.750” wide rolled indentation
Brian (Bear) Beresford Biography: Brian started his heat exchanger tube inspection career in 1983 with
Zetec Incorporated in Issaquah, Washington. Throughout his twenty fours years of service Bear has worked in nuclear power facilities, petrochemical facilities, nuclear
naval submarines and of course the oil refining business. His job functions have included tubular inspection related product sales, strategic business development,
new product design, new product testing, probe development and field services. Mr. Beresford is a functioning level three (III) analyst in accordance with ASNT-TC-1A
while qualified to EPRI TR-107569-V1R5 QDA.

11 INSPECTIONEERING JOURNAL May/June 2007
This is part 2 in a multi-part series. Part 1 set the stage in explaining the basics of RBI, including
• How confidence and uncertainty are managed effectively
• The importance of a good materials/corrosion/damage mechanisms review
• Factoring NDE into the RBI equation – credits and debits
• The importance of good, realistic, credible RBI calculation models based on sound and industry accepted technological basis
• Explanation of RBI as a relative risk ranking tool
• Importance of consistency to ensure relativities and therefore risk rankings are valid
• Risk is dynamic • The pitfalls and liabilities in using “black box”
technologies
As I am most familiar with API Base Resource Document 581, I will continue to use this technical basis for this article. Other important reasons for using this document:
• The document is available in the public domain for reference
• It is most often referenced by developers and users of most, if not all, RBI software tools
• It is very comprehensive and fully develops
the risk, i.e. consequence and likelihood of failure scenarios to establish a full understanding
• Once one is able to grasp the technical basis of API’s quantitative approach (more qualitative approaches are included in this document, also) it is easier to back off or “zoom out”, validate and understand the more qualitative approaches
Risk Refresher
For the sake of the RBI discussion, Risk is the combined consideration of consequence/s of failure (CoF) and probability of failure (PoF). It should include considerations for safety, environmental impact, business interruption, equipment repair and replacement costs, etc. Output measures should be provided for both sides of the risk equation and combined.
PoF X CoF = Risk
Where the following components are considered in the PoF calculation:
Generic failure frequency X damage factor (DF) X management factor = PoF
The damage factor represents how much confidence you have in what you believe to
Risk-Based Inspection Utilizing Metrics
Maximizing the ValuePart 2
Editorial by Greg Alvarado, “IJ” Chief Editor
Key words: risk-based inspection (RBI), fitness for service, risk in sq.’ per year, risk is dynamic, relative risk, consistency, probability of failure, likelihood of failure, generic failure frequency, damage factor, RCA, FMEA
RBI Basic Premise – How much confidence do I need to have in what I believe to be the condition of the equipment – Greg Alvarado

12 INSPECTIONEERING JOURNAL May/June 2007
be the condition of the equipment, i.e. age, corrosion or damage rate/s for all potential damage mechanisms, past and future inspection effectiveness’ for each damage type, materials properties, remaining thickness or ability to contain the process. This factor adjusts the generic failure frequency for that type of equipment.
The software, software facilities and project documentation must make it easy to identify the risk drivers, e.g. lack of inspection history (aka confidence in the real condition of the equipment), corrosion rate, thin wall, toxic chemicals contained, susceptibility to unstable conditions (such as acid carryover), etc. so the user can manage them appropriately at the right times.
With these types of capabilities and information we can begin to create and evaluate metrics.
Current Refining and Petrochemical Industries Metrics Status
In the 1990’s with the growing popularity and maturing of RCM (reliability centered maintenance), in regards to plant equipment, we began seeing the emergence of metrics and concepts like:
• % of design availability• % of desired reliability• costs of LPOs (cost of lost profit
opportunities often due to unplanned outages)
• Process hazards risk matrices for company decision making
• and more….We at least began to track these metrics and try to identify root causes via structured root cause analysis and began being proactive by performing rigorous FMEA (failure modes and effects analysis).
This now sets the stage for proactive
management of equipment reliability. The picture has been painted that past practices, i.e. using past thickness readings to calculate corrosion rates, using corrosion coupons and corrosion probes to manage equipment was like driving a car by looking through the rear view mirror. Tools like RBI, when linked with effective management of change programs, materials operating windows (also referred to as key process reliability parameters or integrity operating windows), digital controls systems and automatic notifications programs help us drive our plants forward by looking out the windshield and taking advantage of our instrument panel.
Impact of Consistency on Reliable Metrics
There is an old adage that states, “If I can measure it I can manage it”. This is most often true. In the world of RBI, as we learned from the last article, it is important to measure “it” consistently. Once we believe in the measurement model and practice measures consistently (this is imperative when using relative risk), the metrics can be very powerful and valuable. If we do not maintain consistency we will lose relatively, greatly diminishing the value and validity of the relative risk measures.
Some hints for maintaining consistency in the RBI process (the process includes the working process, associated activities, the RBI software, associated software platforms, etc.):
• Develop and follow a corporate RBI best practice (“what to do”) (amongst other things this procedure might contain the Risk Target, Inspection Effectiveness Tables, the corporate risk philosophy, etc.)
• Develop and follow a site RBI procedure (amongst other things this document will contain specific “how to’s” in the RBI process like; local rules and regulations, corporate regulations, the type of RBI used, reference to the technical basis of the RBI used, RBI team members and roles, RBI ever greening, performing data validation, how RBI “fits into” the equipment reliability
13 INSPECTIONEERING JOURNAL May/June 2007
program, establishing the RBI corrosion rate or damage susceptibility, etc.)
• Use a software tool that best forces the RBI team to follow a structured process
• Document any deviations, assumptions or changes sufficient to understand the logic and recreate the study at a later time with a different team of people
• Train RBI facilitators to assure they are all on “the same page”
Something to keep in mind, the more qualitative the RBI approach is, the more it is affected by the opinions of the participants. These can change daily. Hence, a very prescriptive procedure is recommended for qualitative studies, especially.
Companies like Solomon Associates have been benchmarking refineries and providing measures in various areas, related to performance, for some time. These measures cover many areas, in addition to fixed equipment reliability. These measure are, when it comes to fixed equipment reliability, at a much higher level than API RBI and therefore do not as readily point to the risk drivers. Plants often want to be in their 1st quartile of performance. Just to demonstrate the importance of consistency in relative measures, all plants are placed, in this study, into a size range measured in EDC or equivalent distillation capacities. There are others who perform similar comparisons and many owner operators benchmark themselves, internally. For the purposes of this publication, we will focus on RBI.
RBI Produces Helpful Metrics
And now for what I hope you find helpful guidance. All things considered in the risk equation, i.e. safety, environment, business, equipment inspection, replacement and repair costs, etc., in terms of relative risk measures metrics can help us determine:
1. Am I doing the right things (in his book, The 7 Habits of Highly Effective People, Stephen Covey explains the importance
of first focusing on doing the right things, or being effective, versus being efficient. Once we have assured ourselves we are doing the right things we may then work on efficiencies. Otherwise, we may just be doing the wrong things faster. Understanding this perspective brings many benefits such as appreciating the power of good predictive models and if I am considering it, how to evaluate if the “streamlined” approach I am considering will perform as desired or is it a waste of time or even worse, creating a false sense of security, for example.)?
v The risk analysis should tell us immediately:4 Is the risk being driven by consequence
or likelihood or both4 The analysis should “zero in” on the
particular risk drivers in any category (see Figure 3)n For example, if the driving risk is PoF
and is attributable to the potential for Cl stress corrosion cracking, how many times has the component been inspected for such? Has it ever been detected? If not, it may be that as soon as an effective inspection is performed for this mechanism and SCC found not to be present, that the PoF drops considerably for some period of time.
n On the other hand, for example, if it is a crude overhead line that is susceptible to severe thinning and has been inspected often with the appropriate types of inspection, it may be nearing end of life.
4 The RBI analyst should have the documentation to validate the results and test them appropriately
2. Am I moving in the right direction, i.e. versus past practices, am I reducing risks at each measurement iteration, or at least keeping it at an acceptable level?
By measuring risk in units such as sq.’/year or financial terms and knowing how much it costs to perform a task and being able to ascertain

14 INSPECTIONEERING JOURNAL May/June 2007
this number (risk in square feet per year or financial risk) at any time in the lifetime of the equipment we can compare the relative payoff of any action or inaction, for example:
Figure 1.
In Figure 1 the two risk profiles depict the top 100 risk items in one processing unit. Risk in sq’/year is on the “y” axis and the equipment items are on the “x” axis. The risk is cumulative over 4 years, i.e. the time between turnarounds. Turnaround is driven by catalyst removal. The blue profile (profile with most dramatic peaks and valleys) is under a traditional API 510/570 inspection program. The green profile (much smoother) is for the same unit if the API RBI plan is implemented. The peaks in the blue profile indicate areas of vulnerability that the RBI process identified. Knowing the inspection and inspection related maintenance costs for each strategy the following metrics can be easily derived:
• The average risk reduction, per dollar spent is 1.7 sq.’ per year under the traditional plan.
• The average risk reduction, per dollar spent is 2.7 sq.’ per year if the API RBI plan is implemented. This represents a 37% improvement in risk reduction per dollar spent on the inspection program. It is also noteworthy to mention that over $500 K was identified for reallocation to other areas of the plant’s reliability program, as a result.
Some people call this savings. It is best to refer to it as saavy risk management and being able to better focus resources.
Risk in sq.’ per year, is a relative measure. For example, let’s say the highest consequence area for a particular piece of equipment is safety related and is 10,000 sq’ for H2S exposure. Let’s say that the current PoF is 1 X 10⁻⁶,or one in one million years. Let’s also imagine that if nothing is done in 10 years, i.e. no inspection, that the PoF escalates to 1 X 10⁻⁴, or one in ten thousand years. If the consequence area does not change, and the PoF is one in ten thousand years, the risk is approximately 1 sq.’ per year.
3. How much is risk increasing over time? seeFigure 34. By measuring uptime, availability, reliability,
leak rates, LPO occurrences, etc. can I make a direct comparison or indirect comparison to the impact of my RBI program?
5. Is it more beneficial for me to:5.1. Do nothing5.2. Inspect5.3. Repair5.4. Replace5.5. “Alloy up”5.6. Perform a fitness for service analysis5.7. Perform a remaining life assessment5.8. Install a damage mitigation system, e.g.
corrosion inhibition system6. The risk impact of a new chemical or
physical environment on equipment risk and reliability (e.g. changing crude slates to differing TANs), changing temperatures and/

15 INSPECTIONEERING JOURNAL May/June 2007
or pressures, changing to a new chemical (e.g. containing chlorides), etc.7. The real impact of “overdue” TMLs (thickness monitoring locations)
Risk Matrix Versus Other Metrics
Risk is dynamic, not static. Over time some things that have a low probability of failure (PoF), today, will, as walls thin and/or materials properties degrade, increase in PoF. It is important to manage this equipment and understand when risk increases.
Figure 2. Traditional RBI Risk Matrix
Traditional RBI Risk MatrixStill a valuable snapshot of risk distribution for a population of items. While it does provide the percentages of equipment at various ranges in the risk matrix only at points in time, it tells nothing of risk drivers or risk escalation except from a very high level on an iterative basis. It does not discriminate what individual equipment items rose in risk or why.
Figure 3. Risk is dymamic API RBI Software Version 8.02 dynamic risk plot showing overall risk (top, dark green, curve), risk weighted HIC/SOHIC damage curve (second from top, light green), internal thinning curve (third from top, blue) over ten years or two projected turnaround cycles. The horizontal line at the “y” value of 50 represents a risk target or threshold of 50’sq./year. The plan period is 10 years. Note that an inspection for HIC/SOHIC
is being called for just before the overall risk for this component or vessel just before the risk target is achieved. If the damage is no worse than anticipated the HIC/SOHIC contribution to risk lessens, as we gain confidence in the true damage state through inspection. If this vessel were closer to end of life, the vertical slope of the damage/risk curves would increase and inspection would do little to nothing to decrease the slope/s.
In the next article I will continue by covering points 4 through 7 from the section, RBI Produces Helpful Metrics.
16 INSPECTIONEERING JOURNAL May/June 2007
Items to be covered in future articles in this series:
• Case history examples of the impact of debits and credits on the PoF, risk and inspection strategies
• RBI and related management metrics – How can we know we are getting better? Leading and lagging measures.
• The importance of the damage/corrosion/materials review and usefulness of materials operating envelopes
• Piping reliability• Cross-functional group learning – The ultimate synergy and ROI• What do regulators have to say about RBI?• Design stage RBI• And more…..
If you have any questions about this article, would like further elaboration or reference information or are interested in other related topics, please send e-mail me at [email protected].
1 The 100 Largest Property Losses 1971-2001 (Large Property Damage Losses in the Hydrocarbon-Chemical Industry, 20th Edition: February 2003, A Publication of Marsh’s Risk Consulting Practice
2 New Forces at Work in Refining Industry - Views of Critical Business and Operations Trends, D. J. Peterson, Sergej Mahnovski , The Rand Corporation 2003, ISBN: 0-8330-3436-7
3 News Conference Statements U.S. Chemical Safety Board, October 31, 2006 by Chairman Carolyn Merritt
4 API Base Resource Document 581, 2nd Edition October 2000
5 Various past IJ articles on the subjects of RBI, damage mechanisms and NDE. Visit the on-line indices at http://www.inspectioneering.com/indices.htm
Gregory C. AlvaradoChief Editor
Inspectioneering Journal
17 INSPECTIONEERING JOURNAL May/June 2007
From time to time, I’m asked why some operating sites don’t seem to pay adequate attention to the need to protect and preserve pressure equipment integrity (PEI). Too often a few sites don’t seem to “get it” until they have a major process safety event associated with a failure of pressure equipment. And unfortunately when that happens, they are suddenly on board with PEI needs and don’t seem to be able to apply their available resources fast enough. Fortunately, I see less and less of this type behavior as time passes and the word spreads throughout the industry about PEI catastrophes and how to avoid them.
In this article, I will address some of the reasons that I believe some sites don’t pay enough attention to PEI needs. But first, I need to emphasize once more that you can’t start with a mediocre PEI program and expect to have an excellent one in a year or two. It just doesn’t happen that fast. In my experience, if you have a mediocre PEI program (or even worse than mediocre), it may take between 5 and 10 years to build it into a really solid, sustainable PEI program of excellence by systematically and meticulously putting in place all the necessary management systems for the entire spectrum of the “The 101 Essential Elements of Pressure Equipment Integrity Management for the Hydrocarbon Process Industry”(1).
By no means is this article meant in any way to be a finger-pointing or faultfinding exercise for anyone or any site. It’s meant only to help sites recognize if they might suffer from any of these symptoms (i.e. excuses) for lack of an adequate PEI program, and to help them address them, as necessary, before it’s too late. You will also note as you read through the reasons, that they are highly intertwined, i.e. that most are interrelated and that if one reason exists, then several others may also exist.
Now let’s begin with those seven reasons that I have observed about why a few sites just don’t seem to “get it”.
Reason No. 1:Lack of risk management knowledge or ineffective application of risk analysis by some plant management. Effective risk analysis and risk management are keys to successful management of PEI risks, just as they are to all other risks in a plant environment. Most cost-effective inspection planning these days is accomplished by the application of RBI, at least at the operating sites
with more advanced PEI programs. Clearly effective risk analysis is the heart and soul of effective RBI programs. Well, low and behold, effective decision-making is also accomplished based on effective risk analysis. If management understands the magnitude of the risks they are carrying by not having effective piping inspection programs, injection point management programs; deadleg programs; PMI programs, CUI programs, etc. on down the list of the 101 Essential Elements, then they are much more likely to provide the necessary resources to build excellence in those programs. If management acts to resource these programs based on their past experience and knowledge, then well-and-good; but if not, effective risk analysis which indicates the combined consequences and probability of PEI failures, is a very effective method of getting management attention to the higher risk PEI issues that need to be addressed.
Reason No. 2:Lack of strong-willed, competent PEI engineers/supervisors/leaders willing and able to be advocates for the necessary PEI issues. Management does not come by their knowledge of the importance of PEI issues by “assmosis” (which has been euphemistically described as the practice of sitting on a copy of the 101 Essential Elements until they are fully understood). Management has a lot of issues on their platter, most of which compete for attention and budget funds with PEI issues. Typically one of the main responsibilities of many managers is to determine how to “stuff a quart into a pint jar”. So management needs to hear about PEI issues from strong advocates for the 101 Essential Elements. They need to hear about incidents in your company and in other companies where failures of pressure equipment have led to process safety incidents and poor reliability. For many years, I have routinely attended the API Operating Practices Symposium (OPS), which is a day-long session at each of the semi-annual API Refining Meetings. At these meetings (which are only open to attendees from operating companies in the industry), numerous process safety incidents are explained in detail, i.e. what happened, why it happened, what corrective action was taken, and how such incidents can be prevented. At every OPS, there are presentations on PEI failures, on which I would report back to my management and technical associates to keep them apprised of higher risk PEI issues that were causing process safety incidents in the industry.
Why Some Operating Sites “Just Don’t Get It”John T. Reynolds, PEI Consultant

18 INSPECTIONEERING JOURNAL May/June 2007
Management also needs to see PEI Key Performance Indicators (KPI’s) that indicate how well your site is performing on such issues as: leaks with process safety impact; leaks with reliability impact; leak saves; near leaks; cost of leaks; lost opportunity from leaks; etc. Capable managers usually are willing to act on hard data, and typically not willing to act on just “whining”, which they find annoying. To this end, the API Inspection Subcommittee is putting together a spreadsheet of PEI KPI’s that will be available some time in the 4Q/2007. At that time all interested participants from operating companies will be able to measure and benchmark themselves against all other industry companies participating in the survey. More on that in an upcoming edition of the IJ.
Bottom line for reason no. 2 is that management needs to hear from us regularly on what can and does happen to operating sites that don’t pay enough attention to achieving excellence in PEI. God forbid that your site is the next one that “gets PEI religion” after serious PEI incidents occur.
Reason No. 3:Lack of budgeting for PEI issues by management that would rather apply their available resouces on projects or other competing interests. As I mentioned in the introduction, a lot of these reasons are intertwined. And this one is a bit of a corollary on reasons no. 1 & 2 above, but may also be somewhat independent of them. If managements don’t understand or really appreciate the magnitude of risks they are carrying by having under-resourced PEI programs, then they are not likely to budget enough resources to improve them. On the other hand, there are some managers that “just don’t think that something bad is going to happen at their site” or that they will be held responsible for “an act of God” after a serious PEI failure. You know the old “ostrich approach” to handling the PEI challenge. Managers come from many different backgrounds and experiences before they get put in charge of PEI. Those different experiences can lead them to favor spending their resources on other issues like process improvements, new projects, fancy-dancy electronic IT systems, etc. Some just don’t understand the real value achieved of applying the necessary resources to maintain existing assets and would rather spend their resources on building new assets. As I mentioned before, solving problems no. 1 & 2 above, usually solves this one too.
Reason No. 4:Lack of application of an effective PEI technical review process. One of the most effective methods that I know of to enlighten managers about the quality of their existing program (or lack thereof) is
to conduct an independent technical review of the PEI program. Shell Global Solutions has one such program, which they conduct at all of their refining and petrochemical operating sites worldwide. It’s called a FAIR+MS, which stands for Focused Asset Integrity Review of the PEI Management Systems (i.e. the 101 Essential Elements of Pressure Equipment Integrity Management). Numerous senior managers have said to me that the Shell GS FAIR is one of the most valuable technical reviews i.e. audits that they have experienced because:
• It is conducted by very experienced PEI professionals that have conducted numerous FAIR’s at numerous sites,
• It reports and risk ranks the necessary improvements needed
• It scores the site on the quality of it’s PEI program based on a 1000 points of excellence, which allows benchmarking with other sites that have been reviewed,
• It contains a gap analysis conducted with key PEI folks from the site to build agreement on what needs to be improved, and
• It includes an interactive report out session with plant management at the conclusion of the review.
In many cases, these candid, straight-shooting, eye-opening reports have resulted in rapid deployment of the necessary resources to begin climbing the ladder of PEI excellence.
Reason No. 5:Lack of understanding that an effective PEI program must also include very effective MOC, SIM and IOW programs. An effective inspection program alone is not sufficient to protect and preserve pressure equipment and achieve excellence in pressure equipment integrity. An effective inspection program must be accompanied by at least three other effective programs at the site in order to achieve PEI excellence. They are:
• Management of Change (MOC),• Shared Integrity Management (SIM), and• Integrity Operating Windows (IOW).
It’s always interesting to me, when I attend the API OPS twice a year, how many process safety incidents could have been avoided by a more effective MOC program applied to PEI. An effective site MOC program needs to assure that any change in the hydrocarbon process variables or change in the process hardware is reviewed and approved by an experienced, competent subject matter expert (SME) in pressure equipment integrity. Very often that SME includes review by a materials/corrosion specialist. If that occurs, then inspection programs can be adjusted to monitor changes in deterioration in pressure equipment and many potential PEI incidents can be avoided.
Sometimes a site has a fairly effective MOC process
“Just Don’t Get It” cont.

19 INSPECTIONEERING JOURNAL May/June 2007
for hardware changes, but there is a misconception by some process technologists/engineers/operators that no matter what process changes they make, that the inspectors will determine how corrosion and deterioration of the equipment is changing, simply with routine scheduled inspections. I sometimes wonder if these good folks think we are the equivalent of monkeys in a tropical forest, constantly climbing through their pipe racks taking thickness measurements in hopes of finding something changed. One of the important communication functions of the PEI group is to help others understand that PEI groups are dependent upon timely and thorough MOC communications in order to adjust inspection strategies appropriately. Without timely MOC communications, inspection strategies will continue to be based upon historic types and rates of deterioration and not on the current or changing deterioration conditions. Hence the likelihood that inspection will find changing corrosion rates because of process changes that are unknown to them is quite low.
The second important adjunct to an effective PEI program is what I call Shared Integrity Management (SIM). Shared Integrity Management is an integration of “ownership” and responsibility for pressure equipment integrity by all involved site functions, including operations, engineering and maintenance. As such, operations management and process engineering share PEI leadership roles with the PEI function, to preserve and protect the integrity of pressure equipment. Similarly, PEI personnel should share with Operations management the goal to attain the full useful life of pressure equipment cost-effectively. This shared integrity management leads to everyone being on the same page with regard to pressure equipment integrity, all working for the same shared goals, all understanding that they have a vital role in integrity management and knowing specifically what that role is. Inspection cannot do it alone.
The sites that are best at implementing SIM, all have documented and implemented PEI roles for folks in operations, engineering, maintenance, inspection, and materials specialists. For instance, process engineers may be in charge of keeping the list of injection and mix points up-to-date and reporting any changes (or anticipated changes) in operation of those injection/mix points to appropriate inspection personnel. Maintenance may have the role of implementing specifically defined PMI for all new and modified alloy hardware piping. Engineering may have the role of making sure that inspection is involved in all the previously defined aspects of QA/QC for every step of a new or plant change project. These are just single examples of a list for each function that may have 20-30 specific tasks listed for SIM. These types of specific roles, endorsed by plant management, go a long way toward
alleviating the need for inspectors and inspection engineers to constantly be chasing down others in operations, maintenance and engineering to get them to cooperate with and participate in the PEI needs of the site, which as we all know is a little like “pushing on a rope”.
The third vital “leg of this stool” that supports an effective PEI program is that of identifying and implementing effective integrity operating windows (IOW)(2). IOW’s should be established for all variables (both physical and chemical) that could impact equipment integrity if not properly controlled. Just a very few examples of the variables include temperatures, pressures, fluid velocities, pH, flow rates, chemical or water injection rates, levels of corrosive constituents, chemical composition, etc. These IOW’s should be established by a team of operators, process engineers, materials/corrosion specialists and inspection personnel who are directly involved with each process unit where IOW’s are needed.
Variations from IOW limits should be brought to the attention of appropriate Inspectioneering personnel. This communication link provides early warning to PEI personnel when established IOW’s are exceeded so that appropriate plans and changes in inspection strategy can be implemented if equipment deterioration rates are expected to change.
Once again, inspection cannot do it alone. Sites that do not have effective MOC, SIM, and IOW programs that directly and specifically support their PEI program will likely struggle to build real excellence in pressure equipment integrity.
Reason No. 6:Lack of experience with on-site process safety incidents caused by PEI failures. This one is also closely related to reasons no. 1 & 2 above. If your site is small and has limited communications with other sites and limited information about what pressure equipment failures occur in our industry, then plant management may not understand the PEI risks that are being carried and how to avoid them. Also, some managers have this belief that “if it has not happened here, then we must already have adequate safeguards in place”. That belief may not recognize that other safeguarding barriers may have been active in preventing an incident or may not recognize that unreported or under-reported near misses have already occurred that could have easily escalated into a serious incident. Fortunately, every release of hazardous substances does not ignite or does not expose personnel to toxic or hazardous substances. But we all know that “just dumb luck” can only protect us just so far. So once again, implementing the corrective actions for reasons no. 1 & 2 above will usually

20 INSPECTIONEERING JOURNAL May/June 2007
correct this problem, too.
Reason No. 7:Lack of effective application of industry PEI codes and standards for in-service inspection and maintenance of pressure equipment. And last but certainly not least is reason no. 7. There is an enormous, useful body of knowledge about in-service inspection (ISI), pressure equipment integrity (PEI) and materials and corrosion (M/C) contained in the numerous codes and standards published by the API. These documents are very helpful in building a solid foundation for PEI programs in the refining and chemical industry. These PEI codes and standards are assembled by dozens of very knowledgeable ISI & M/C specialists from across the USA and around the world; and then balloted (often multiple times) and published by using the ANSI consensus process to ensure that they truly represent industry best practices for PEI. Though too numerous to mention here in their entirety, some of the more prominent API ISI codes and standards (with abbreviated titles) include:
• API 510 In-Service Pressure Vessel Inspection Code
• API 570 In-Service Piping Inspection Code
• API 571 Materials Deterioration Mechanisms
• API 572 Pressure Vessel Inspection Practices (sister document to 510)
• API 573 Furnace and Boiler Inspection Practices
• API 574 Piping Inspection Practices (sister document to 570)
• API 575 Tank Inspection Practices (sister document to 653)
• API 576 Pressure Safety Device Inspection and Servicing
• API 577 Welding Inspection and Metallurgy
• API 578 Piping Material Verification and PMI
• API 579 Fitness for Service Analysis• API 580 Risk-Based Inspection Programs• API 581 Risk-Based Inspection
Methodology• API 582 Specialized Welding Practices• API 653 Atmospheric Storage Tank
Inspection
Hopefully you are all very familiar with each of these codes and standards and have the latest editions readily available to you. Each of these standards is updated (and sometimes substantially improved) every 3-5 years, while others like 510/570/653 have addenda published every 1-2 years in order to keep them up-to-date. So you need to make
sure you are working with the latest edition.
Since each of these codes and standards represents a consensus of best practices put together by subject matter experts from owner-users, consultants, and those that provide services to our industry, they are sometimes general in nature and sometimes cannot provide the detail that may be needed to effectively implement them at your site. That typically means that you will need to document some extra details about just how each of them will be effectively implemented at your site, i.e. who does what, when and how often, etc. Most sites do that by creating their own set of PEI procedures, which then expands upon the PEI issues (more detail) that are covered in the API codes and standards to make them site-specific.
Conclusion:Do you recognize any of these symptoms at your site? Hopefully not; and your management is completely on board with what needs to be done in order to keep your pressure equipment safe and reliable. Once that is true for all operating sites, then there should be no more pressure equipment failures, fires, explosions, toxic releases, etc. in our industry.
So what did I miss? If you have experienced other reasons for inadequate PEI programs, send them along to me through [email protected]. If just one of the above reasons applies to any one operating site, that site will probably struggle to achieve excellence in their PEI program. But if multiple reasons are present at any one site, then “may the force be with you” as you climb the mountain of PEI excellence.
References:1. The 101 Essential Elements of Pressure
Equipment Integrity Management for the Hydrocarbon Process Industry, John T. Reynolds, The Inspectioneering Journal, A 13 part series of articles from May, 2000 to May, 2002; also published in its entirety by the NPRA, Reliability and Maintenance Conference, May, 2003.
2. The Importance of Integrity Operating Windows in the Process Safety of Pressure Equipment, John T. Reynolds, The Inspectioneering Journal, March/April 2005.
John T. Reynolds,Retired, Shell Global Solutions
“Just Don’t Get It” cont.

Improve plant reliability bysolving piping corrosionproblems with weld overlayCorrosion Resistant Alloysfrom KLAD.
KLAD delivers completed pipe spools and vessel components ready to install with samedelivery schedule as carbon steel fabricationand at a fraction of solid alloy prices.
Email or call KLAD to discuss your requirements at [email protected], ext. 112 or 102fax 713-433-5001
KLAD MANUFACTURING CO.403 South Loop West
Houston, Texas 77054, USA
www.clad.com
36” header w/317L overlay, 34 ft L,Transfer Line—Delivery 5 weeks.
(4), 20” headers w/625 Overlay, 60 ft L eaREAC System-Delivery 10-12 weeks
10”-18” Pipe Spools w/625 OverlayREAC System-Delivery 14-16 weeks
54” Vessel Bottom Section w/309LMo Overlay, 40 ft LHP Amine Absorber-Shipped complete 10 weeks
24” Pipe Spool w/C276 OverlaySafety Relief Hdr-Delivery 8 weeks
For Performance You Can Count On
48” Boot w/317L OverlaySurge Vessel-Delivery 8 weeks
Klad-AdforispectionV7.qxd 3/15/07 9:55 AM Page 1