Embed Size (px)
Citation preview

First Quarter2018 Results
May 9, 2018
2
Forward-looking statementsThis presentation, as well as other statements made by Delphi Technologies PLC (the “Company”), contain forward-looking statements that reflect, when made, the Company’s current views with respect to current events, certain investments and acquisitions and financial performance. Such forward-looking statements are subject to many risks, uncertainties and factors relating to the Company’s operations and business environment, which may cause the actual results of the Company to be materially different from any future results.
All statements that address future operating, financial or business performance or the Company’s strategies or expectations are forward-looking statements. Factors that could cause actual results to differ materially from these forward-looking statements are discussed under the captions “Risk Factors” and “Management’s Discussion and Analysis of Financial Condition and Results of Operations” in the Company’s filings with the Securities and Exchange Commission. New risks and uncertainties arise from time to time, and it is impossible for us to predict these events or how they may affect the Company. It should be remembered that the price of the ordinary shares and any income from them can go down as well as up.
The Company disclaims any intention or obligation to update or revise any forward-looking statements, whether as a result of new information, future events and/or otherwise, except as may be required by law.
3
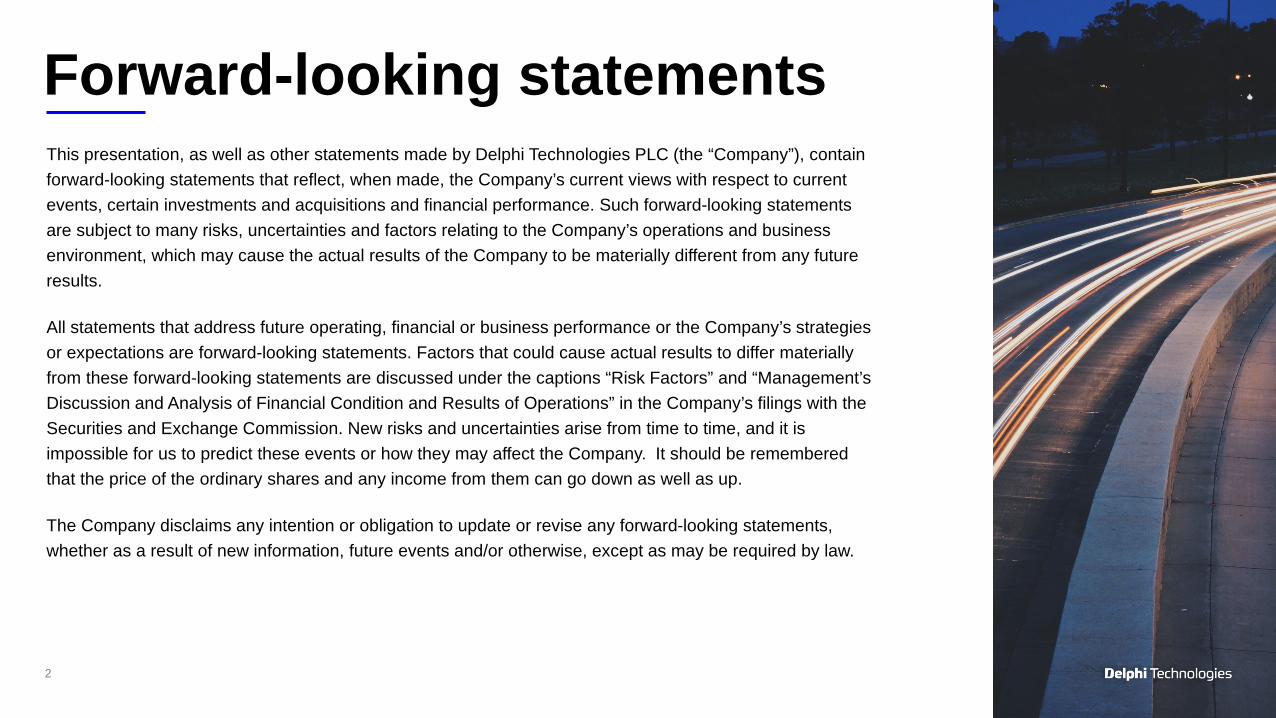
1. Adjusted for restructuring and other special items; see appendix for detail and reconciliation to US GAAP2. Excluding $17 million commercial settlement which benefited Q1 2017 adjusted operating income
Underlying performance on track, raising full year outlook
Q1 2018 highlights
Revenue
$1.3 b(+4.6% YoY)
Operating income1
$159 m(12.3% up 80 bps)2
Earnings per share1
$1.30
$3 b of bookings across ICE and Electronics
Increased outlook driven by FX tailwinds
Robust growth in key areas of the portfolio
Post-spin operational progress on track
Strong start to the year with raisedEPS outlook for 2018
4
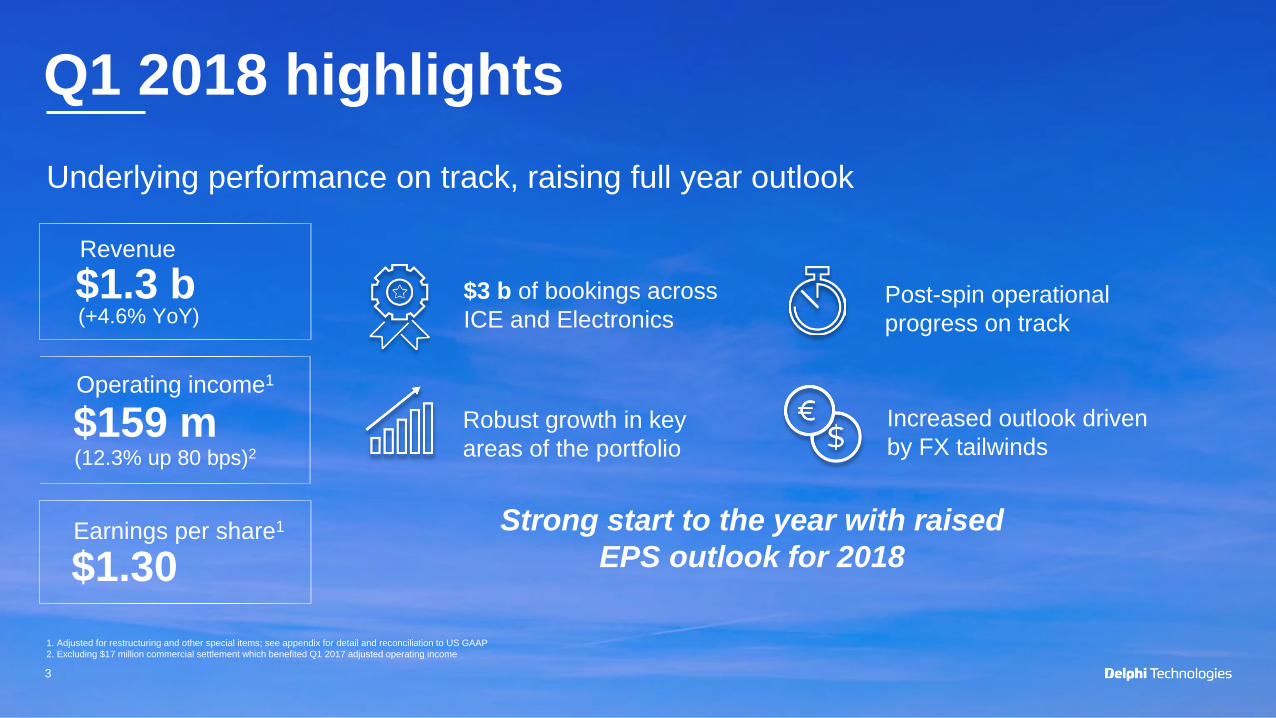
Balanced business, fully focused on delivering on our commitments
Market updateRegulatory driven demand for advanced propulsion solutions
GDi continues to displace diesel and PFi for passenger carAccelerated demand for electrificationHigher pressure systems for commercial vehicles
Recent industry topicsDiesel headlines in EuropePotential changes in trade/tariff frameworkHigher commodity pricesRelaxation of regulatory framework in the U.S.
5
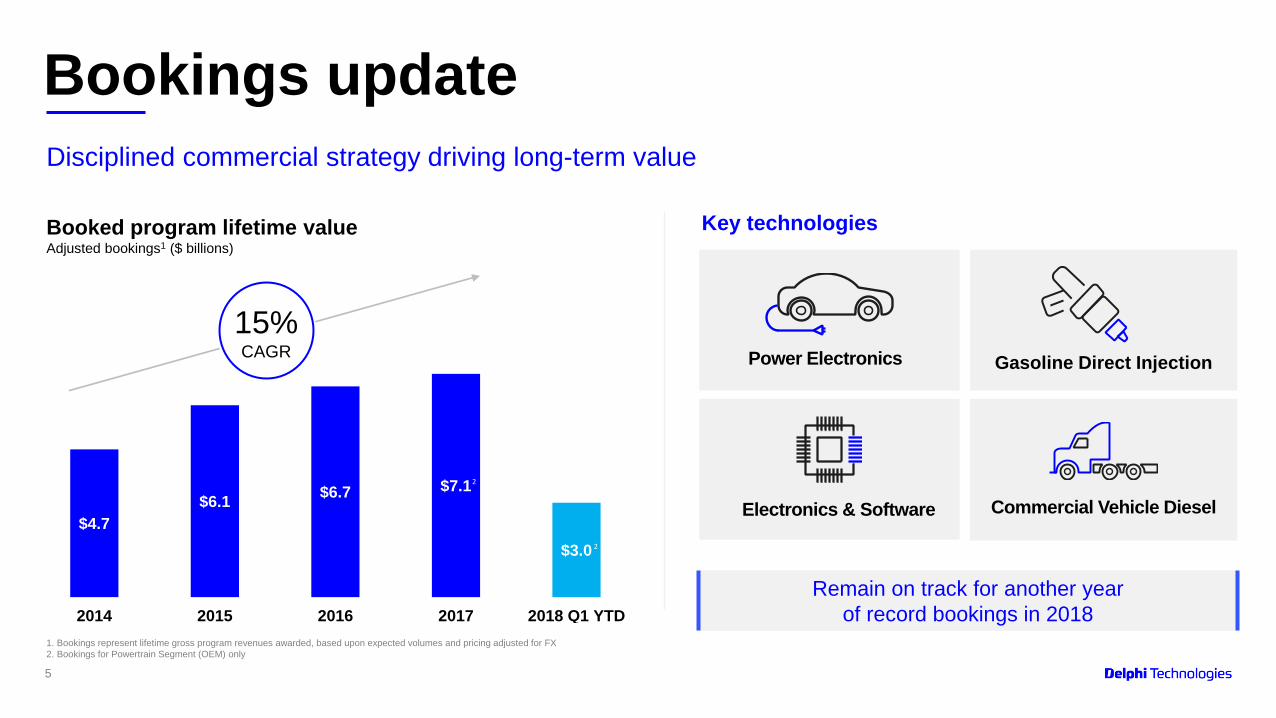
Bookings update
Booked program lifetime valueAdjusted bookings1 ($ billions)
1. Bookings represent lifetime gross program revenues awarded, based upon expected volumes and pricing adjusted for FX2. Bookings for Powertrain Segment (OEM) only
Disciplined commercial strategy driving long-term value
$4.7$6.1 $6.7 $7.1
$3.0
2014 2015 2016 2017 2018 Q1 YTD
2
2
15%CAGR
Remain on track for another year of record bookings in 2018
Key technologies
Power Electronics
Commercial Vehicle Diesel
Gasoline Direct Injection
Electronics & Software
6
Post-spin progress on track, creating optimal structure to support future growth
Spin updateProgress made in Q1
All transition service agreements fully operationalSignificant progress made on standalone functions Lean corporate HQ fully staffed and operational in London
On track with plan to eliminate spin-related inefficiencies
Spin-related costs and capex expected to ramp during 2018Clearer line of sight to exit TSAs and CMSAsFocused on lean and efficient standalone operations
7
Summary
Great start to the year
Solid financial performance and excellent bookings momentum in Q1
Post-spin operational progress on track
Increased outlook for FY 2018
FinancialReview
9
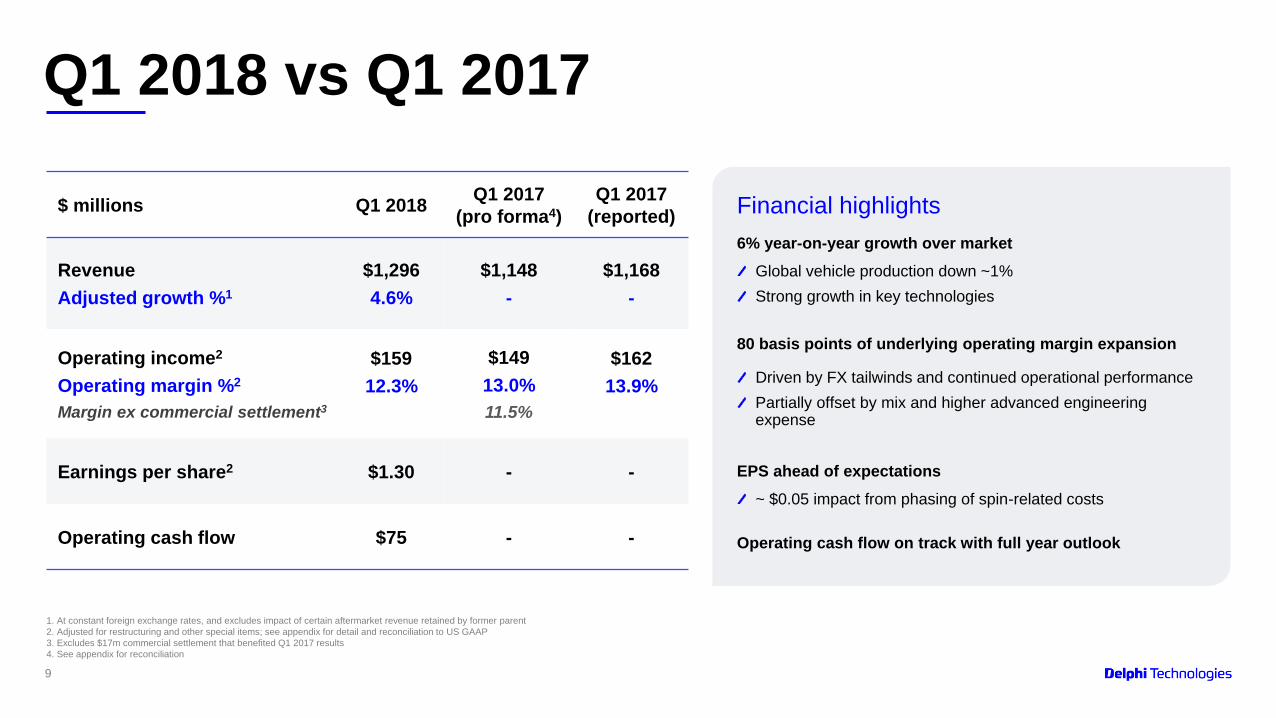
Q1 2018 vs Q1 2017
Financial highlights$ millions Q1 2018 Q1 2017 (pro forma4)
Q1 2017 (reported)
RevenueAdjusted growth %1
$1,2964.6%
$1,148-
$1,168-
Operating income2
Operating margin %2
Margin ex commercial settlement3
$15912.3%
$14913.0%11.5%
$16213.9%
Earnings per share2 $1.30 - -
Operating cash flow $75 - -
1. At constant foreign exchange rates, and excludes impact of certain aftermarket revenue retained by former parent2. Adjusted for restructuring and other special items; see appendix for detail and reconciliation to US GAAP3. Excludes $17m commercial settlement that benefited Q1 2017 results4. See appendix for reconciliation
6% year-on-year growth over market Global vehicle production down ~1%Strong growth in key technologies
80 basis points of underlying operating margin expansion
Driven by FX tailwinds and continued operational performancePartially offset by mix and higher advanced engineering expense
EPS ahead of expectations~ $0.05 impact from phasing of spin-related costs
Operating cash flow on track with full year outlook
10
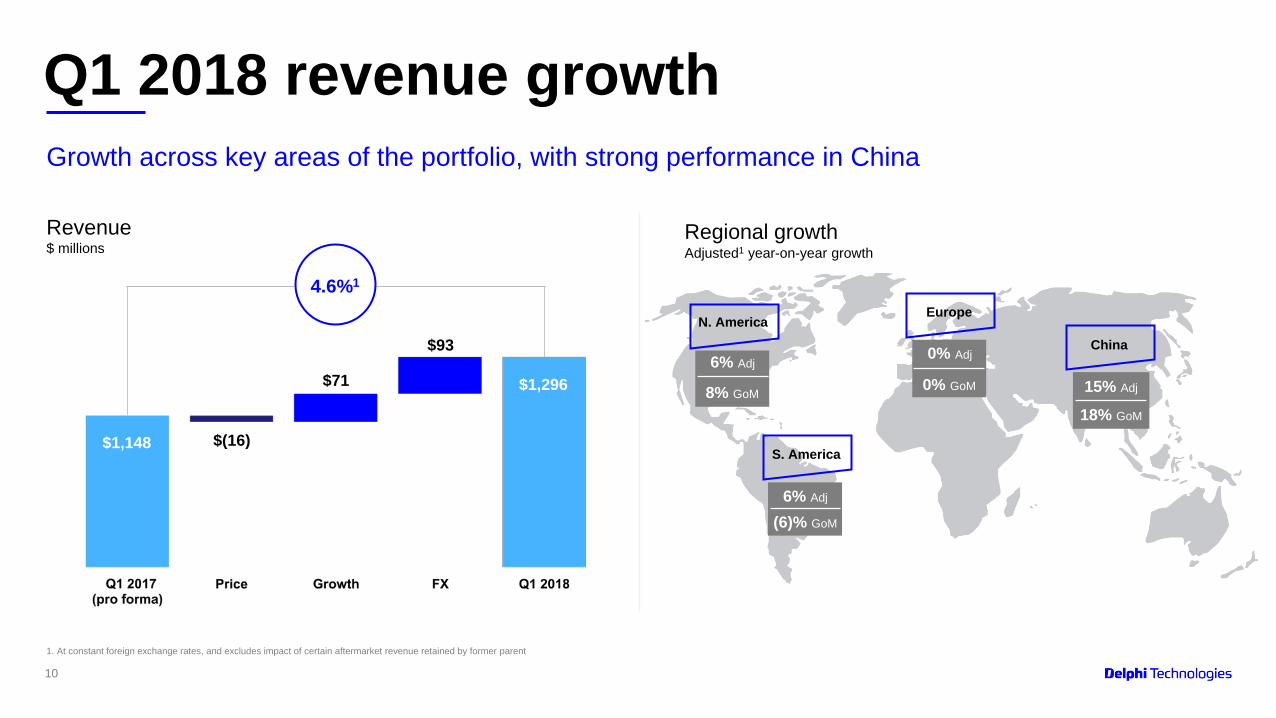
Q1 2018 revenue growth
1. At constant foreign exchange rates, and excludes impact of certain aftermarket revenue retained by former parent
Revenue$ millions
Regional growthAdjusted1 year-on-year growth
Growth across key areas of the portfolio, with strong performance in China
0% GoM
6% Adj
8% GoM
0% Adj
15% Adj
18% GoM
6% Adj
(6)% GoM
4.6%1
$1,148
$1,296$71
$93
$(16)
N. America
S. America
Europe
China
11
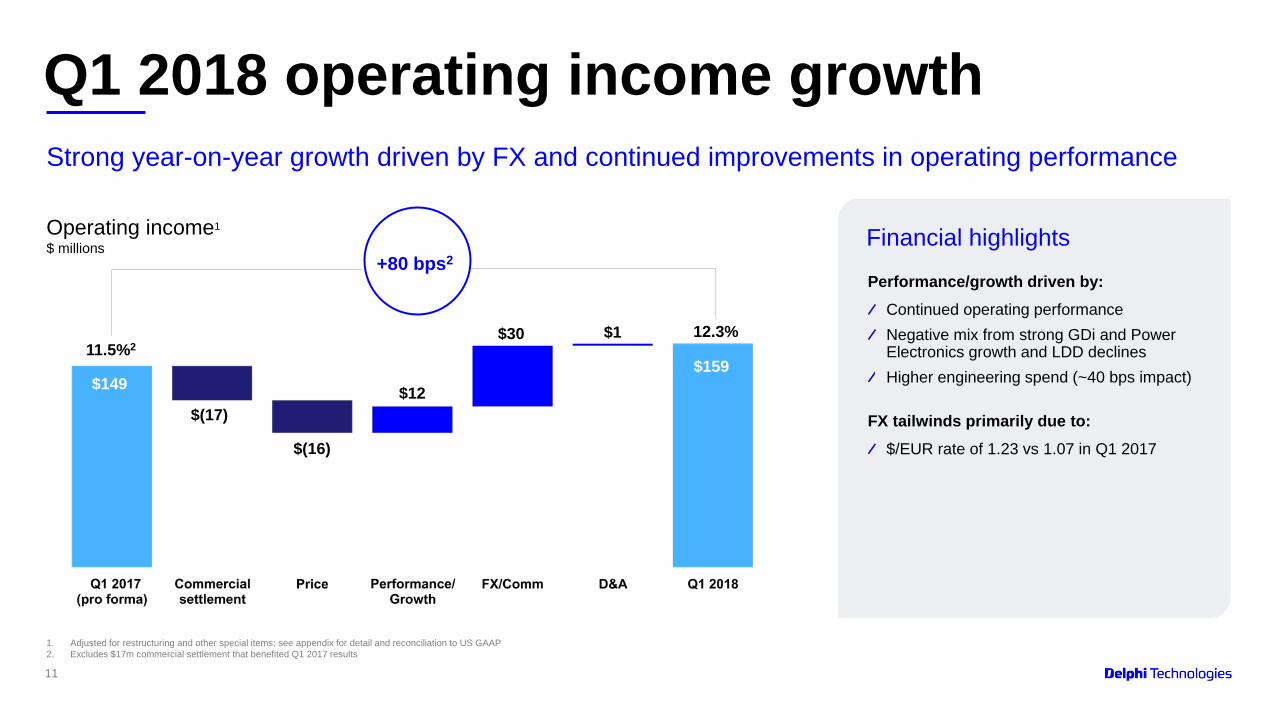
Q1 2018 operating income growth
Operating income1 Financial highlights$ millions
1. Adjusted for restructuring and other special items; see appendix for detail and reconciliation to US GAAP2. Excludes $17m commercial settlement that benefited Q1 2017 results
Strong year-on-year growth driven by FX and continued improvements in operating performance
+80 bps2
11.5%212.3%
$149
$(16)
$12
$30 $1
$159
$(17)
Performance/growth driven by: Continued operating performanceNegative mix from strong GDi and Power Electronics growth and LDD declinesHigher engineering spend (~40 bps impact)
FX tailwinds primarily due to:$/EUR rate of 1.23 vs 1.07 in Q1 2017
12
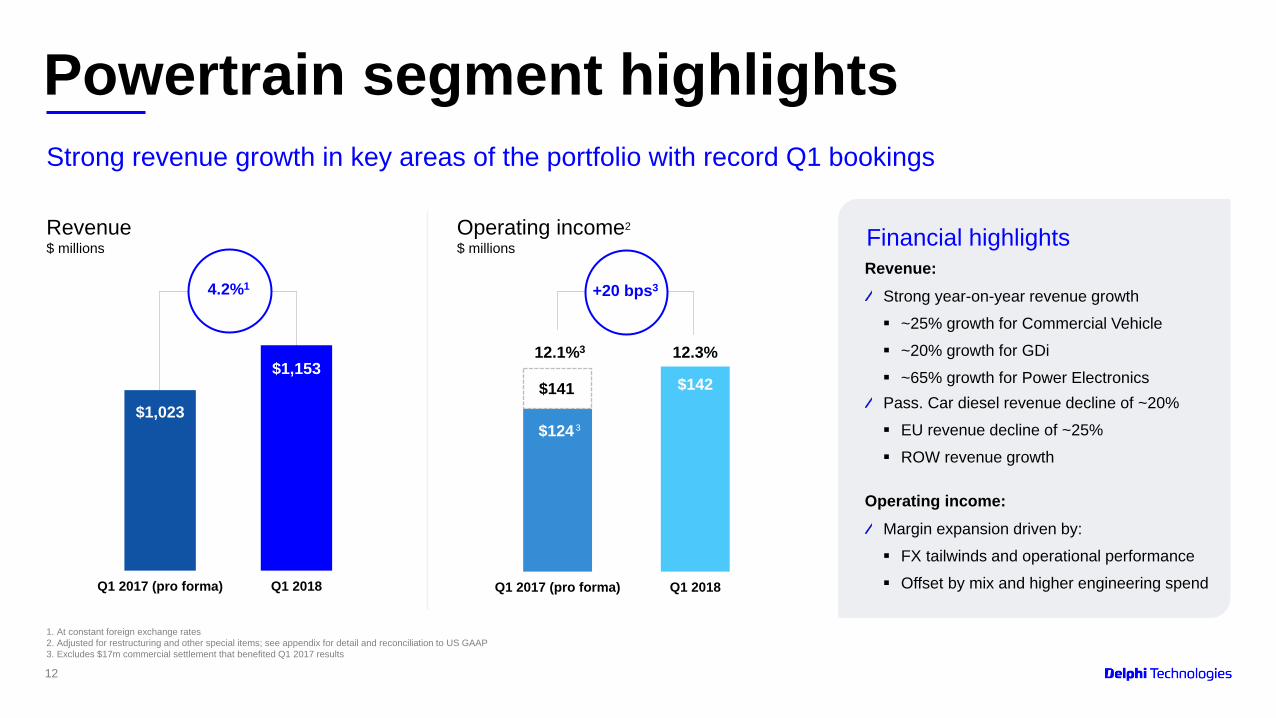
$124
$142
Q1 2017 (pro forma) Q1 2018
Powertrain segment highlights
Revenue Operating income2 Financial highlights$ millions $ millions
1. At constant foreign exchange rates2. Adjusted for restructuring and other special items; see appendix for detail and reconciliation to US GAAP3. Excludes $17m commercial settlement that benefited Q1 2017 results
Strong revenue growth in key areas of the portfolio with record Q1 bookings
$1,023
$1,153
Q1 2017 (pro forma) Q1 2018
12.3%12.1%3
4.2%1 +20 bps3Revenue:
Strong year-on-year revenue growth ~25% growth for Commercial Vehicle ~20% growth for GDi ~65% growth for Power ElectronicsPass. Car diesel revenue decline of ~20% EU revenue decline of ~25% ROW revenue growth
Operating income: Margin expansion driven by: FX tailwinds and operational performance Offset by mix and higher engineering spend
3
$141
13
Q1 2017 (pro forma) Q1 2018
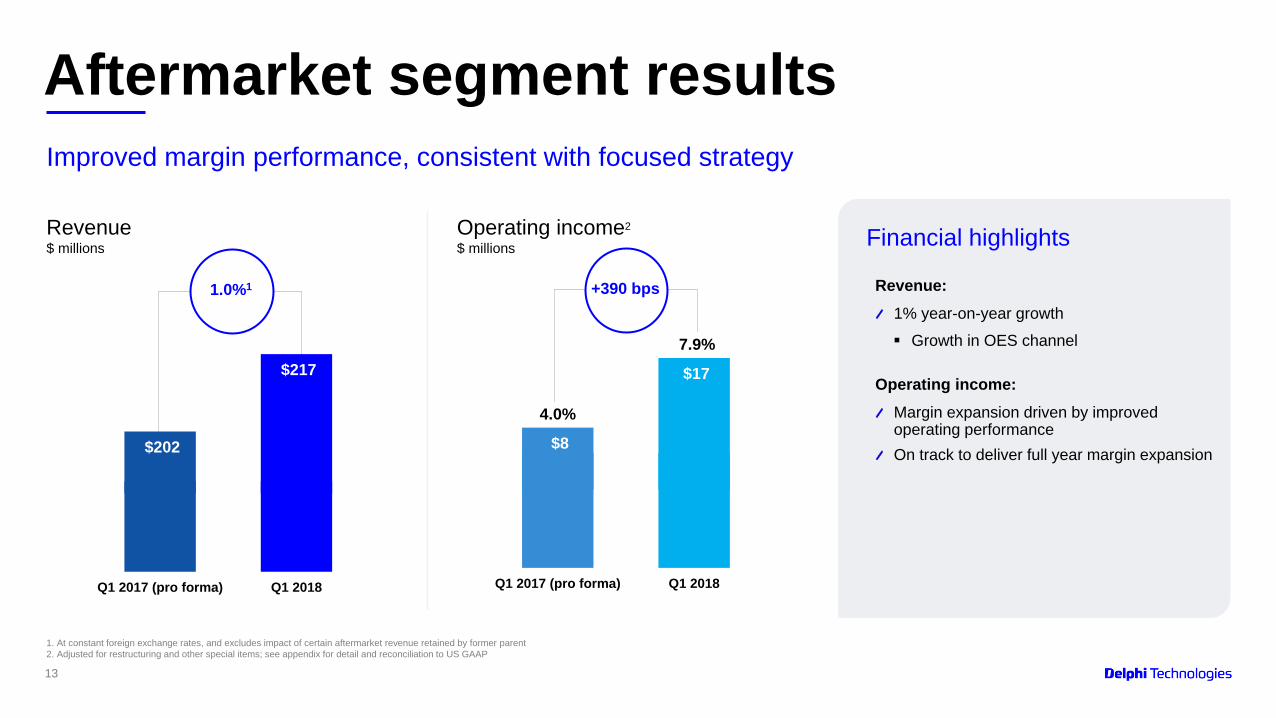
Aftermarket segment results
Revenue Operating income2 Financial highlights$ millions $ millions
1. At constant foreign exchange rates, and excludes impact of certain aftermarket revenue retained by former parent2. Adjusted for restructuring and other special items; see appendix for detail and reconciliation to US GAAP
Improved margin performance, consistent with focused strategy
$202
$217
$8
$17
Q1 2017 (pro forma) Q1 2018
4.0%
7.9%
1.0%1 +390 bps Revenue: 1% year-on-year growth Growth in OES channel
Operating income: Margin expansion driven by improved operating performanceOn track to deliver full year margin expansion
14
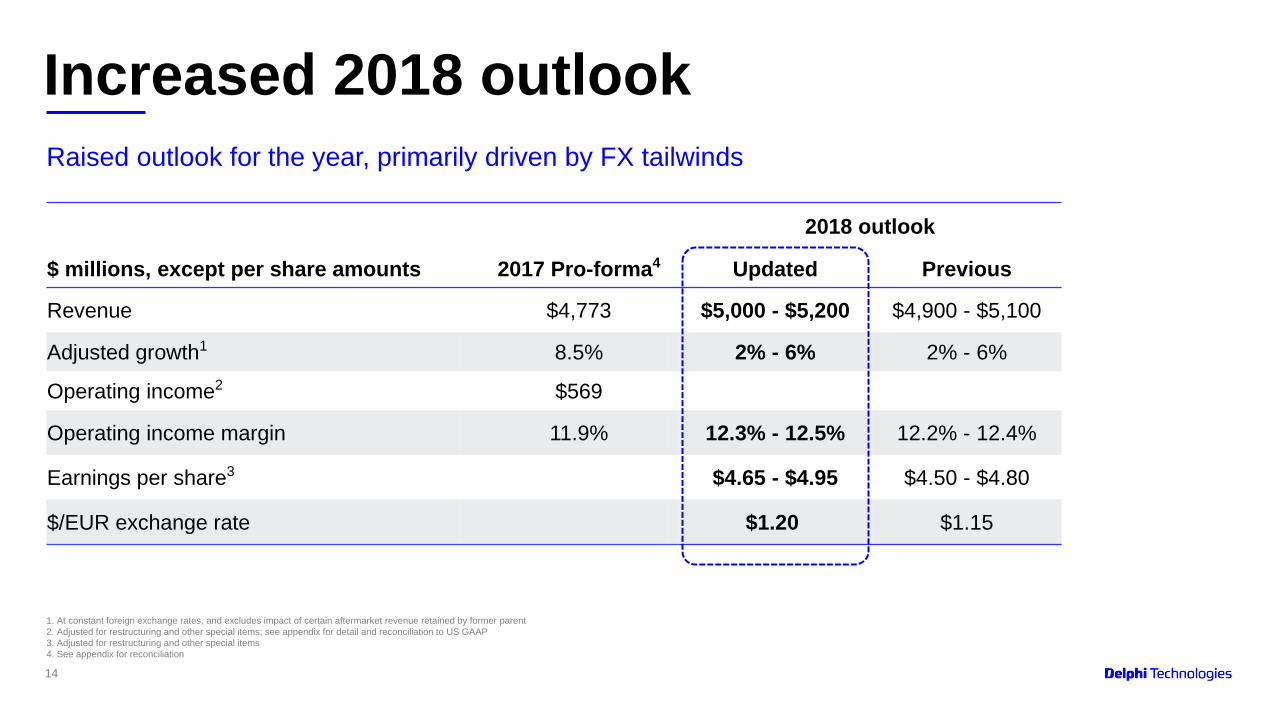
Increased 2018 outlook
1. At constant foreign exchange rates, and excludes impact of certain aftermarket revenue retained by former parent2. Adjusted for restructuring and other special items; see appendix for detail and reconciliation to US GAAP3. Adjusted for restructuring and other special items4. See appendix for reconciliation
Raised outlook for the year, primarily driven by FX tailwinds
2018 outlook
$ millions, except per share amounts 2017 Pro-forma4 Updated Previous
Revenue $4,773 $5,000 - $5,200 $4,900 - $5,100
Adjusted growth1 8.5% 2% - 6% 2% - 6%
Operating income2 $569
Operating income margin 11.9% 12.3% - 12.5% 12.2% - 12.4%
Earnings per share3 $4.65 - $4.95 $4.50 - $4.80
$/EUR exchange rate $1.20 $1.15
15
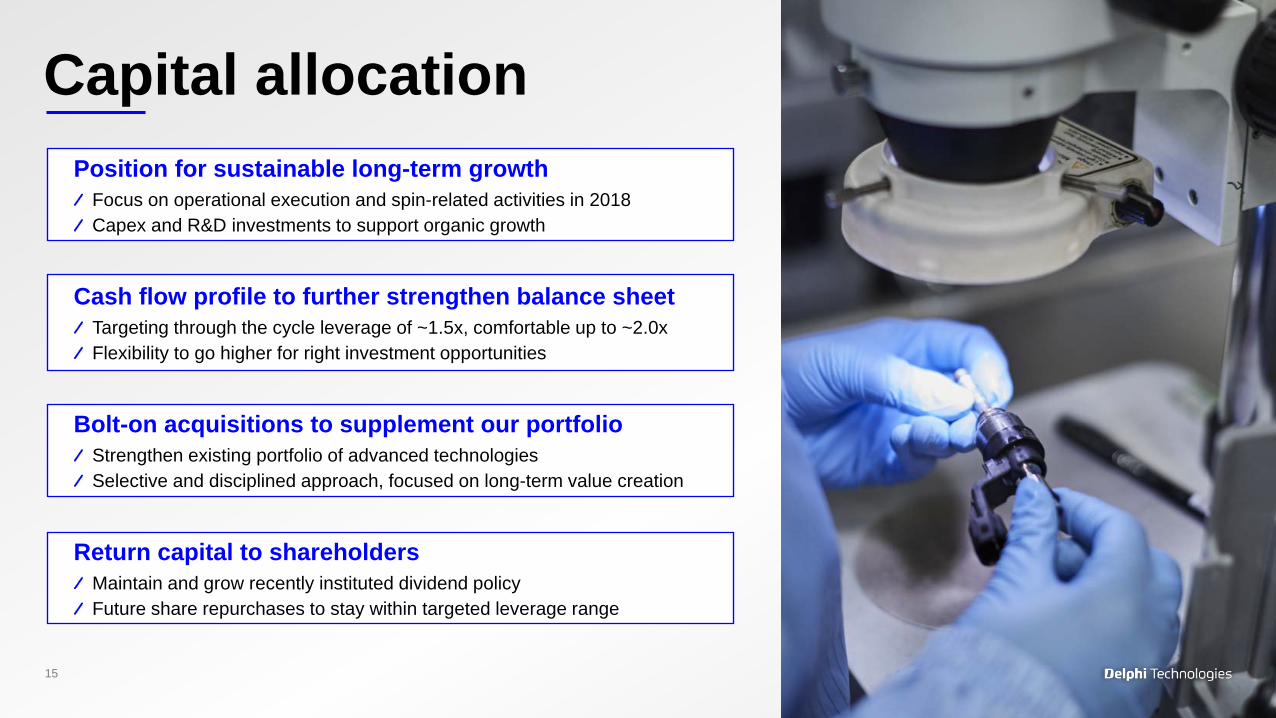
Capital allocationPosition for sustainable long-term growth
Focus on operational execution and spin-related activities in 2018Capex and R&D investments to support organic growth
Cash flow profile to further strengthen balance sheet Targeting through the cycle leverage of ~1.5x, comfortable up to ~2.0xFlexibility to go higher for right investment opportunities
Bolt-on acquisitions to supplement our portfolioStrengthen existing portfolio of advanced technologies Selective and disciplined approach, focused on long-term value creation
Return capital to shareholdersMaintain and grow recently instituted dividend policyFuture share repurchases to stay within targeted leverage range
Q&A

Appendix
18
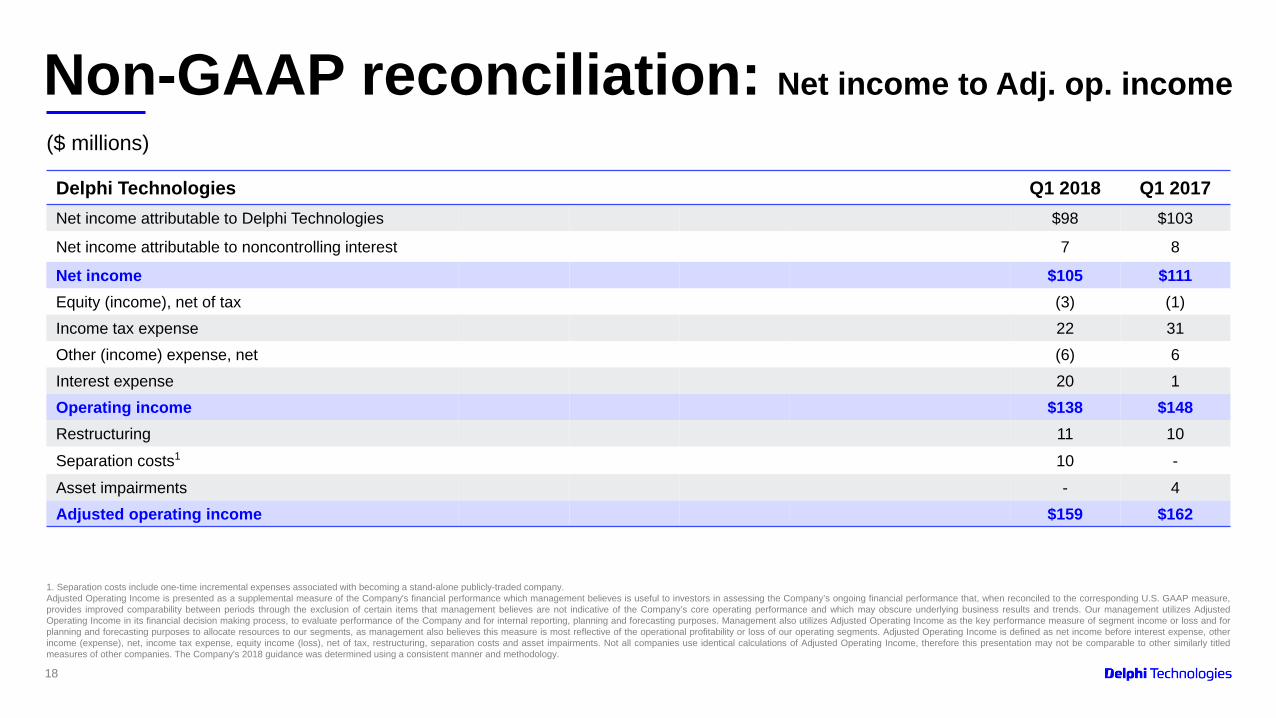
Non-GAAP reconciliation: Net income to Adj. op. income($ millions)
1. Separation costs include one-time incremental expenses associated with becoming a stand-alone publicly-traded company.Adjusted Operating Income is presented as a supplemental measure of the Company's financial performance which management believes is useful to investors in assessing the Company’s ongoing financial performance that, when reconciled to the corresponding U.S. GAAP measure,provides improved comparability between periods through the exclusion of certain items that management believes are not indicative of the Company’s core operating performance and which may obscure underlying business results and trends. Our management utilizes AdjustedOperating Income in its financial decision making process, to evaluate performance of the Company and for internal reporting, planning and forecasting purposes. Management also utilizes Adjusted Operating Income as the key performance measure of segment income or loss and forplanning and forecasting purposes to allocate resources to our segments, as management also believes this measure is most reflective of the operational profitability or loss of our operating segments. Adjusted Operating Income is defined as net income before interest expense, otherincome (expense), net, income tax expense, equity income (loss), net of tax, restructuring, separation costs and asset impairments. Not all companies use identical calculations of Adjusted Operating Income, therefore this presentation may not be comparable to other similarly titledmeasures of other companies. The Company's 2018 guidance was determined using a consistent manner and methodology.
Delphi Technologies Q1 2018 Q1 2017Net income attributable to Delphi Technologies $98 $103
Net income attributable to noncontrolling interest 7 8
Net income $105 $111Equity (income), net of tax (3) (1)Income tax expense 22 31Other (income) expense, net (6) 6Interest expense 20 1 Operating income $138 $148Restructuring 11 10Separation costs1 10 -Asset impairments - 4 Adjusted operating income $159 $162
19
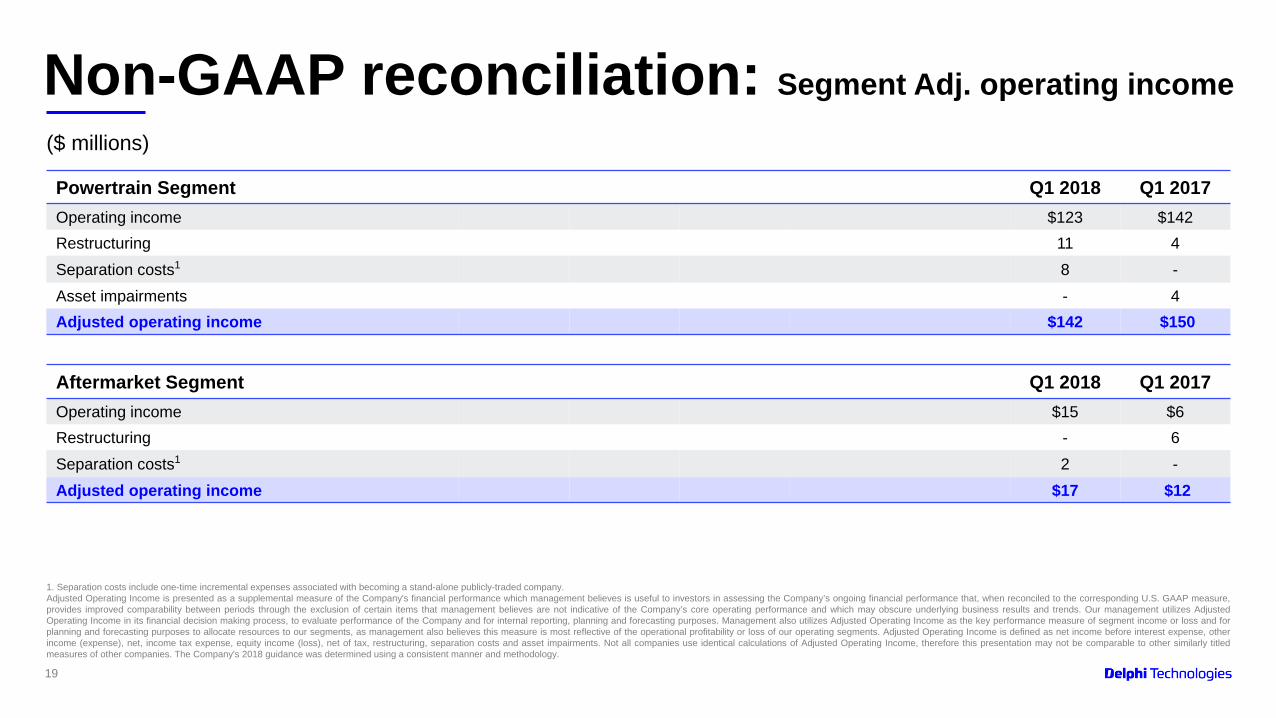
Non-GAAP reconciliation: Segment Adj. operating income
($ millions)
1. Separation costs include one-time incremental expenses associated with becoming a stand-alone publicly-traded company.Adjusted Operating Income is presented as a supplemental measure of the Company's financial performance which management believes is useful to investors in assessing the Company’s ongoing financial performance that, when reconciled to the corresponding U.S. GAAP measure,provides improved comparability between periods through the exclusion of certain items that management believes are not indicative of the Company’s core operating performance and which may obscure underlying business results and trends. Our management utilizes AdjustedOperating Income in its financial decision making process, to evaluate performance of the Company and for internal reporting, planning and forecasting purposes. Management also utilizes Adjusted Operating Income as the key performance measure of segment income or loss and forplanning and forecasting purposes to allocate resources to our segments, as management also believes this measure is most reflective of the operational profitability or loss of our operating segments. Adjusted Operating Income is defined as net income before interest expense, otherincome (expense), net, income tax expense, equity income (loss), net of tax, restructuring, separation costs and asset impairments. Not all companies use identical calculations of Adjusted Operating Income, therefore this presentation may not be comparable to other similarly titledmeasures of other companies. The Company's 2018 guidance was determined using a consistent manner and methodology.
Aftermarket Segment Q1 2018 Q1 2017Operating income $15 $6Restructuring - 6Separation costs1 2 -Adjusted operating income $17 $12
Powertrain Segment Q1 2018 Q1 2017Operating income $123 $142 Restructuring 11 4Separation costs1 8 -Asset impairments - 4 Adjusted operating income $142 $150
20
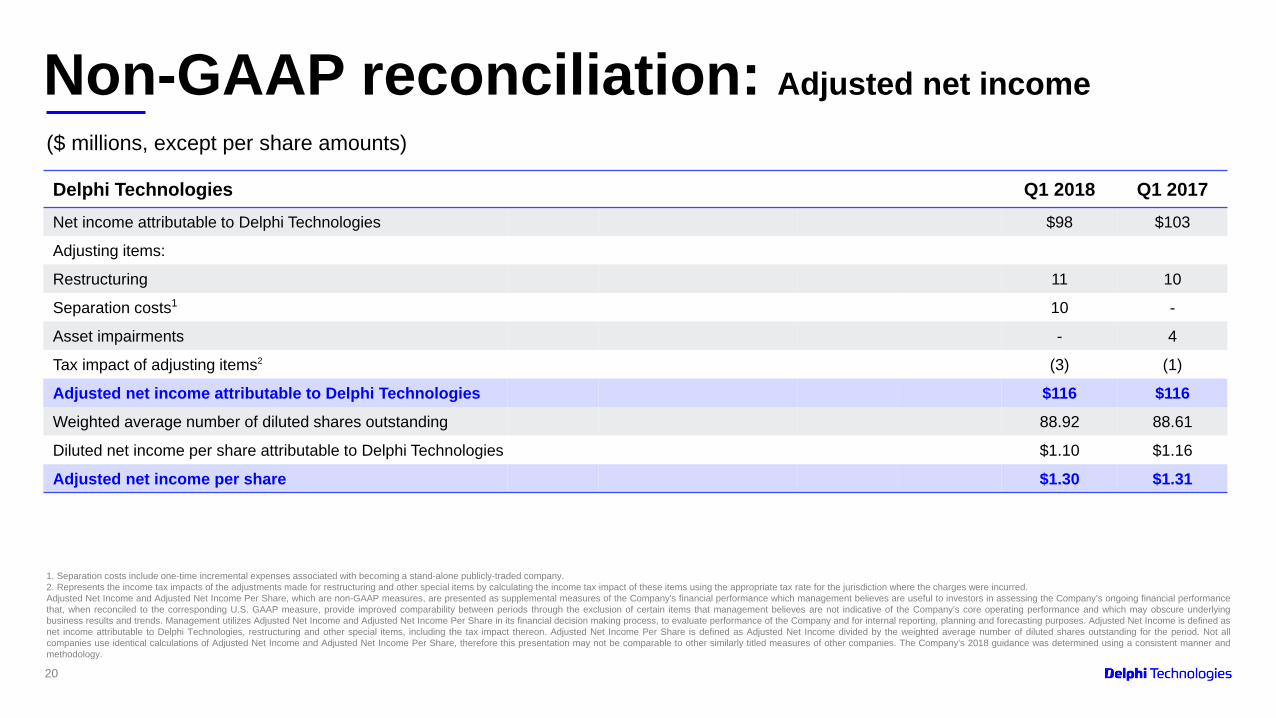
Non-GAAP reconciliation: Adjusted net income($ millions, except per share amounts)
1. Separation costs include one-time incremental expenses associated with becoming a stand-alone publicly-traded company.2. Represents the income tax impacts of the adjustments made for restructuring and other special items by calculating the income tax impact of these items using the appropriate tax rate for the jurisdiction where the charges were incurred.Adjusted Net Income and Adjusted Net Income Per Share, which are non-GAAP measures, are presented as supplemental measures of the Company's financial performance which management believes are useful to investors in assessing the Company’s ongoing financial performancethat, when reconciled to the corresponding U.S. GAAP measure, provide improved comparability between periods through the exclusion of certain items that management believes are not indicative of the Company’s core operating performance and which may obscure underlyingbusiness results and trends. Management utilizes Adjusted Net Income and Adjusted Net Income Per Share in its financial decision making process, to evaluate performance of the Company and for internal reporting, planning and forecasting purposes. Adjusted Net Income is defined asnet income attributable to Delphi Technologies, restructuring and other special items, including the tax impact thereon. Adjusted Net Income Per Share is defined as Adjusted Net Income divided by the weighted average number of diluted shares outstanding for the period. Not allcompanies use identical calculations of Adjusted Net Income and Adjusted Net Income Per Share, therefore this presentation may not be comparable to other similarly titled measures of other companies. The Company's 2018 guidance was determined using a consistent manner andmethodology.
Delphi Technologies Q1 2018 Q1 2017Net income attributable to Delphi Technologies $98 $103
Adjusting items:
Restructuring 11 10
Separation costs1 10 -
Asset impairments - 4
Tax impact of adjusting items2 (3) (1)
Adjusted net income attributable to Delphi Technologies $116 $116Weighted average number of diluted shares outstanding 88.92 88.61
Diluted net income per share attributable to Delphi Technologies $1.10 $1.16
Adjusted net income per share $1.30 $1.31
21
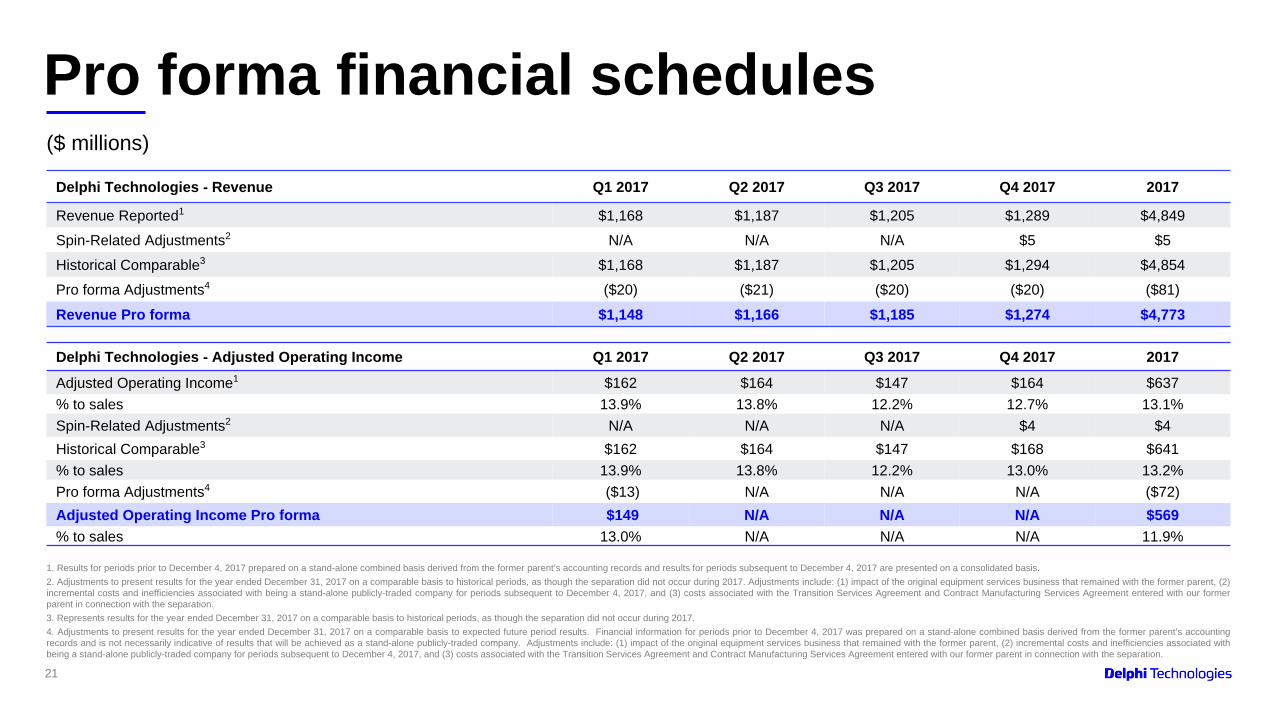
Pro forma financial schedules($ millions)
1. Results for periods prior to December 4, 2017 prepared on a stand-alone combined basis derived from the former parent’s accounting records and results for periods subsequent to December 4, 2017 are presented on a consolidated basis.2. Adjustments to present results for the year ended December 31, 2017 on a comparable basis to historical periods, as though the separation did not occur during 2017. Adjustments include: (1) impact of the original equipment services business that remained with the former parent, (2)incremental costs and inefficiencies associated with being a stand-alone publicly-traded company for periods subsequent to December 4, 2017, and (3) costs associated with the Transition Services Agreement and Contract Manufacturing Services Agreement entered with our formerparent in connection with the separation.3. Represents results for the year ended December 31, 2017 on a comparable basis to historical periods, as though the separation did not occur during 2017.4. Adjustments to present results for the year ended December 31, 2017 on a comparable basis to expected future period results. Financial information for periods prior to December 4, 2017 was prepared on a stand-alone combined basis derived from the former parent’s accountingrecords and is not necessarily indicative of results that will be achieved as a stand-alone publicly-traded company. Adjustments include: (1) impact of the original equipment services business that remained with the former parent, (2) incremental costs and inefficiencies associated withbeing a stand-alone publicly-traded company for periods subsequent to December 4, 2017, and (3) costs associated with the Transition Services Agreement and Contract Manufacturing Services Agreement entered with our former parent in connection with the separation.
Delphi Technologies - Revenue Q1 2017 Q2 2017 Q3 2017 Q4 2017 2017
Revenue Reported1 $1,168 $1,187 $1,205 $1,289 $4,849Spin-Related Adjustments2 N/A N/A N/A $5 $5Historical Comparable3 $1,168 $1,187 $1,205 $1,294 $4,854Pro forma Adjustments4 ($20) ($21) ($20) ($20) ($81)
Revenue Pro forma $1,148 $1,166 $1,185 $1,274 $4,773
Delphi Technologies - Adjusted Operating Income Q1 2017 Q2 2017 Q3 2017 Q4 2017 2017Adjusted Operating Income1 $162 $164 $147 $164 $637% to sales 13.9% 13.8% 12.2% 12.7% 13.1%Spin-Related Adjustments2 N/A N/A N/A $4 $4Historical Comparable3 $162 $164 $147 $168 $641% to sales 13.9% 13.8% 12.2% 13.0% 13.2%Pro forma Adjustments4 ($13) N/A N/A N/A ($72)Adjusted Operating Income Pro forma $149 N/A N/A N/A $569% to sales 13.0% N/A N/A N/A 11.9%
22
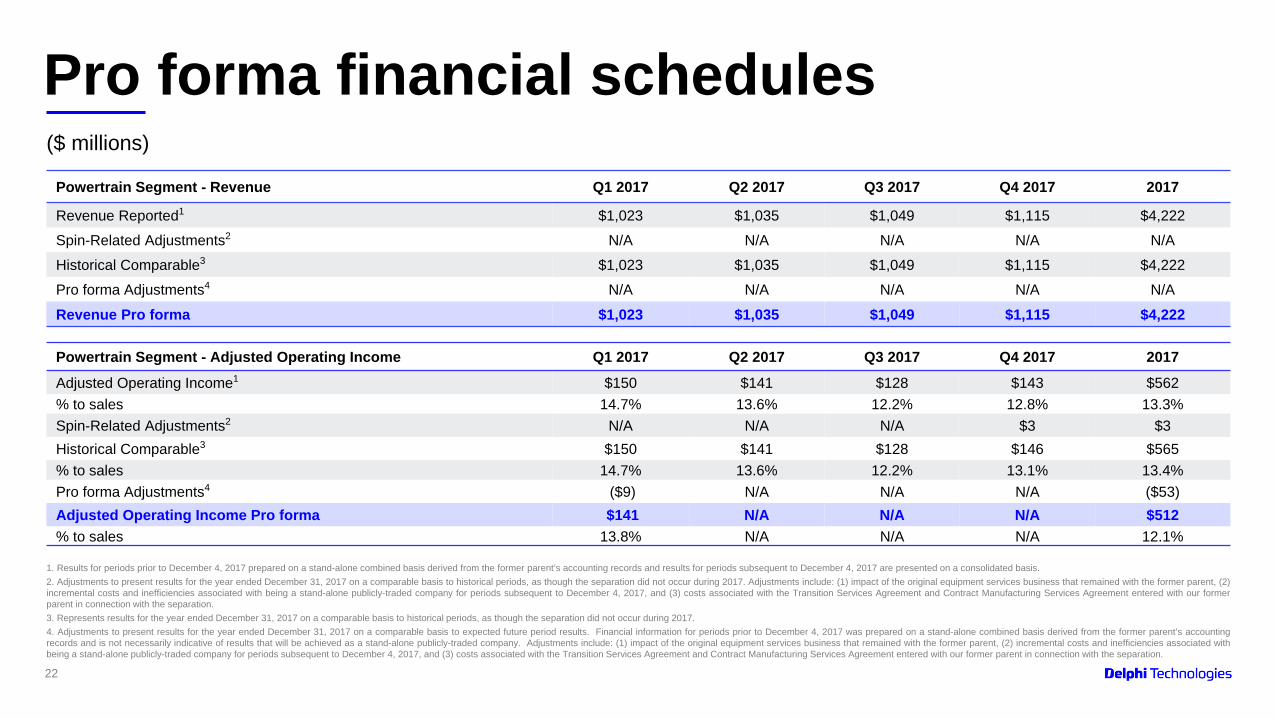
Pro forma financial schedules($ millions)
1. Results for periods prior to December 4, 2017 prepared on a stand-alone combined basis derived from the former parent’s accounting records and results for periods subsequent to December 4, 2017 are presented on a consolidated basis.2. Adjustments to present results for the year ended December 31, 2017 on a comparable basis to historical periods, as though the separation did not occur during 2017. Adjustments include: (1) impact of the original equipment services business that remained with the former parent, (2)incremental costs and inefficiencies associated with being a stand-alone publicly-traded company for periods subsequent to December 4, 2017, and (3) costs associated with the Transition Services Agreement and Contract Manufacturing Services Agreement entered with our formerparent in connection with the separation.3. Represents results for the year ended December 31, 2017 on a comparable basis to historical periods, as though the separation did not occur during 2017.4. Adjustments to present results for the year ended December 31, 2017 on a comparable basis to expected future period results. Financial information for periods prior to December 4, 2017 was prepared on a stand-alone combined basis derived from the former parent’s accountingrecords and is not necessarily indicative of results that will be achieved as a stand-alone publicly-traded company. Adjustments include: (1) impact of the original equipment services business that remained with the former parent, (2) incremental costs and inefficiencies associated withbeing a stand-alone publicly-traded company for periods subsequent to December 4, 2017, and (3) costs associated with the Transition Services Agreement and Contract Manufacturing Services Agreement entered with our former parent in connection with the separation.
Powertrain Segment - Revenue Q1 2017 Q2 2017 Q3 2017 Q4 2017 2017
Revenue Reported1 $1,023 $1,035 $1,049 $1,115 $4,222Spin-Related Adjustments2 N/A N/A N/A N/A N/AHistorical Comparable3 $1,023 $1,035 $1,049 $1,115 $4,222Pro forma Adjustments4 N/A N/A N/A N/A N/A
Revenue Pro forma $1,023 $1,035 $1,049 $1,115 $4,222
Powertrain Segment - Adjusted Operating Income Q1 2017 Q2 2017 Q3 2017 Q4 2017 2017Adjusted Operating Income1 $150 $141 $128 $143 $562 % to sales 14.7% 13.6% 12.2% 12.8% 13.3%Spin-Related Adjustments2 N/A N/A N/A $3 $3Historical Comparable3 $150 $141 $128 $146 $565% to sales 14.7% 13.6% 12.2% 13.1% 13.4%Pro forma Adjustments4 ($9) N/A N/A N/A ($53)Adjusted Operating Income Pro forma $141 N/A N/A N/A $512% to sales 13.8% N/A N/A N/A 12.1%
23
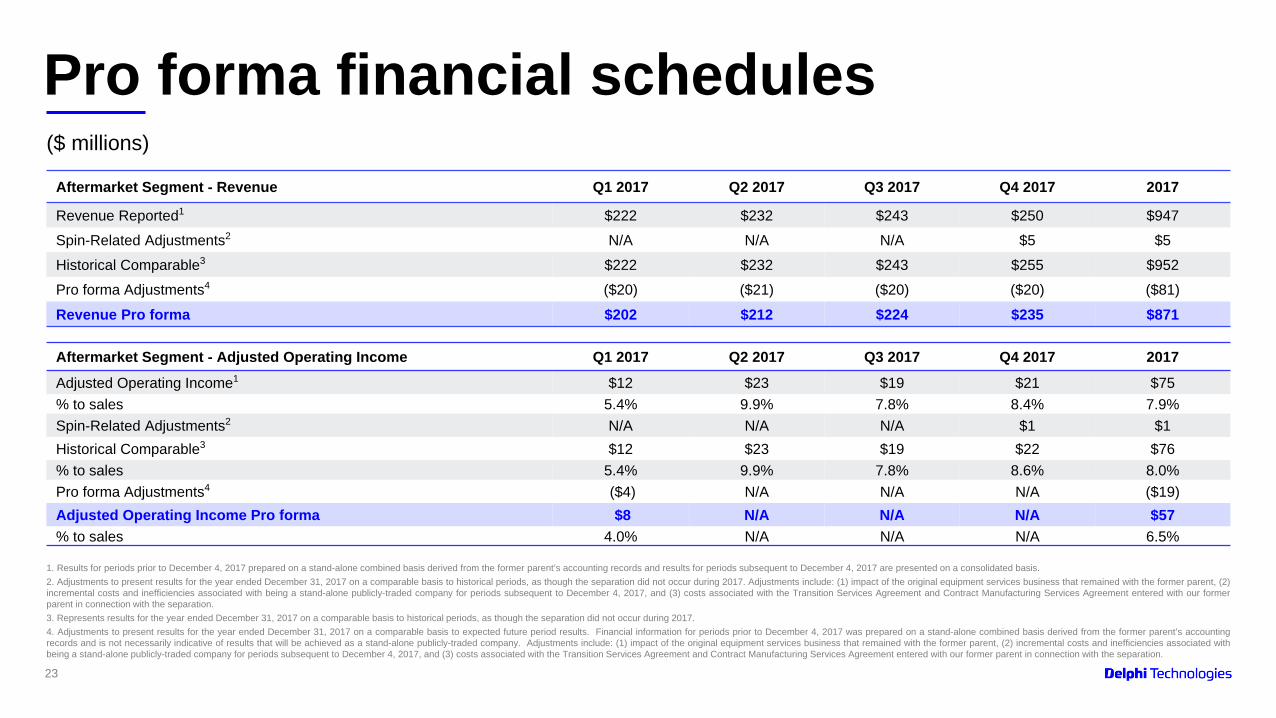
Pro forma financial schedules($ millions)
1. Results for periods prior to December 4, 2017 prepared on a stand-alone combined basis derived from the former parent’s accounting records and results for periods subsequent to December 4, 2017 are presented on a consolidated basis.2. Adjustments to present results for the year ended December 31, 2017 on a comparable basis to historical periods, as though the separation did not occur during 2017. Adjustments include: (1) impact of the original equipment services business that remained with the former parent, (2)incremental costs and inefficiencies associated with being a stand-alone publicly-traded company for periods subsequent to December 4, 2017, and (3) costs associated with the Transition Services Agreement and Contract Manufacturing Services Agreement entered with our formerparent in connection with the separation.3. Represents results for the year ended December 31, 2017 on a comparable basis to historical periods, as though the separation did not occur during 2017.4. Adjustments to present results for the year ended December 31, 2017 on a comparable basis to expected future period results. Financial information for periods prior to December 4, 2017 was prepared on a stand-alone combined basis derived from the former parent’s accountingrecords and is not necessarily indicative of results that will be achieved as a stand-alone publicly-traded company. Adjustments include: (1) impact of the original equipment services business that remained with the former parent, (2) incremental costs and inefficiencies associated withbeing a stand-alone publicly-traded company for periods subsequent to December 4, 2017, and (3) costs associated with the Transition Services Agreement and Contract Manufacturing Services Agreement entered with our former parent in connection with the separation.
Aftermarket Segment - Revenue Q1 2017 Q2 2017 Q3 2017 Q4 2017 2017
Revenue Reported1 $222 $232 $243 $250 $947Spin-Related Adjustments2 N/A N/A N/A $5 $5Historical Comparable3 $222 $232 $243 $255 $952Pro forma Adjustments4 ($20) ($21) ($20) ($20) ($81)
Revenue Pro forma $202 $212 $224 $235 $871
Aftermarket Segment - Adjusted Operating Income Q1 2017 Q2 2017 Q3 2017 Q4 2017 2017Adjusted Operating Income1 $12 $23 $19 $21 $75 % to sales 5.4% 9.9% 7.8% 8.4% 7.9%Spin-Related Adjustments2 N/A N/A N/A $1 $1Historical Comparable3 $12 $23 $19 $22 $76% to sales 5.4% 9.9% 7.8% 8.6% 8.0%Pro forma Adjustments4 ($4) N/A N/A N/A ($19)Adjusted Operating Income Pro forma $8 N/A N/A N/A $57% to sales 4.0% N/A N/A N/A 6.5%