Embed Size (px)
DESCRIPTION
Regional Florida Catastrophic Planning: Focus on South Florida and the Herbert Hoover Dike Region. May 31, 2007. Overview of Florida Catastrophic Planning. Project Goals - PowerPoint PPT Presentation
Citation preview
Regional Florida Catastrophic Planning:Focus on South Florida and the Herbert Hoover Dike Region
May 31, 2007
Overview of Florida Catastrophic Planning
Project Goals Phase 1: To develop a regional response and
recovery annex for the counties and communities surrounding Lake Okeechobee in the event of a Herbert Hoover Dike (HHD) failure
Phase 2: To develop a regional response and recovery annex for a catastrophic hurricane impacting South Florida
Overview of Florida Catastrophic Planning
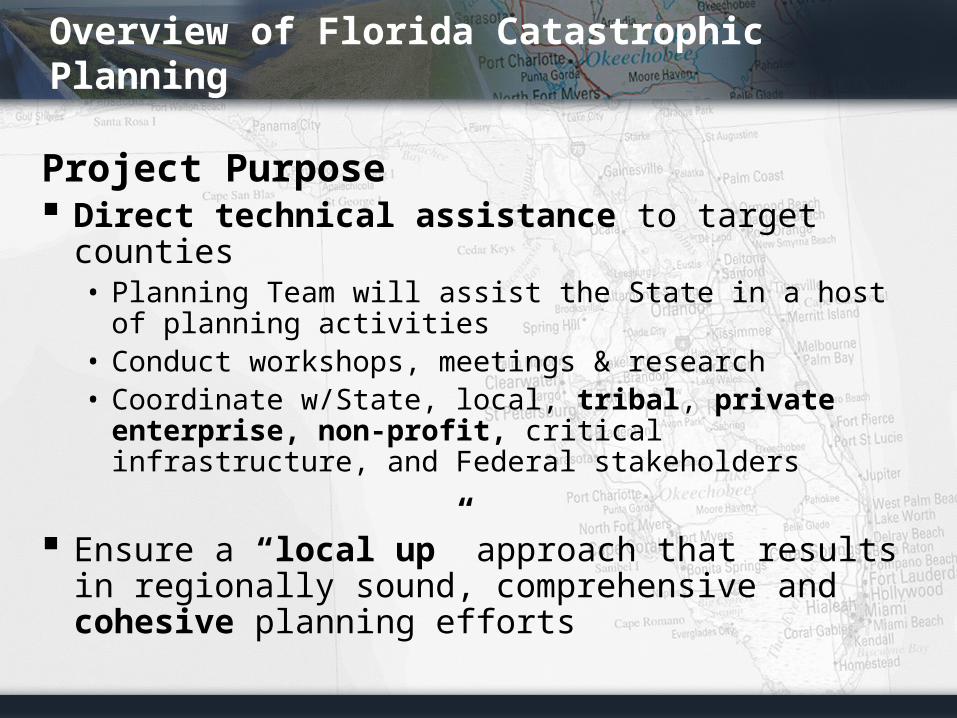
Project Purpose Direct technical assistance to target counties
• Planning Team will assist the State in a host of planning activities
• Conduct workshops, meetings & research• Coordinate w/State, local, tribal, private enterprise,
non-profit, critical infrastructure, and Federal stakeholders
Ensure a “local up” approach that results in regionally sound, comprehensive and cohesive planning efforts
Overview of Florida Catastrophic Planning
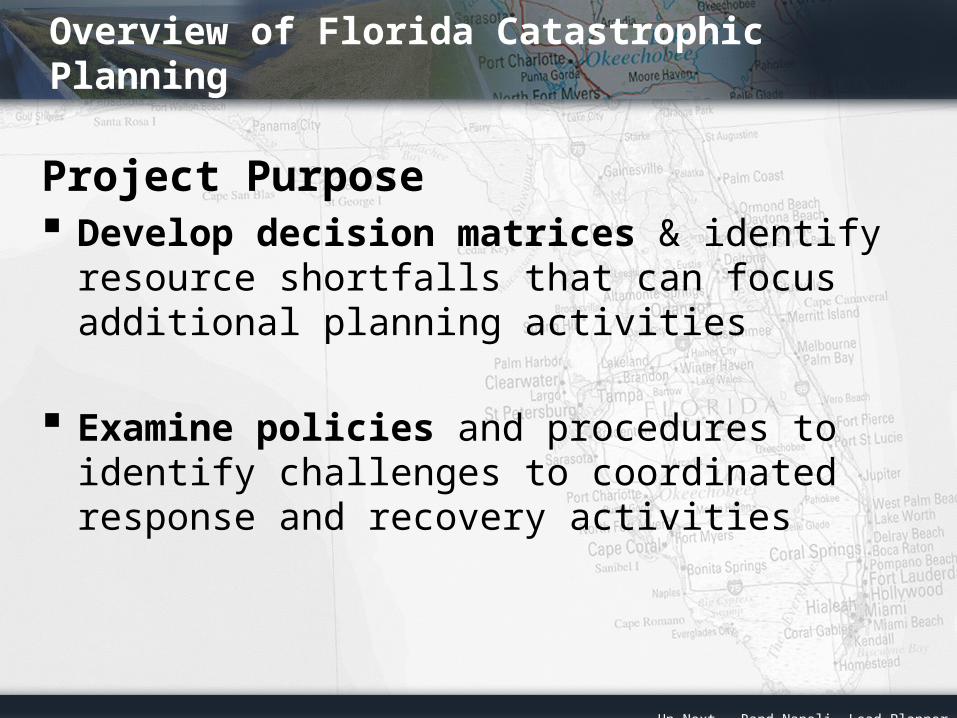
Project Purpose Develop decision matrices & identify resource
shortfalls that can focus additional planning activities
Examine policies and procedures to identify challenges to coordinated response and recovery activities
Up Next - Rand Napoli, Lead Planner
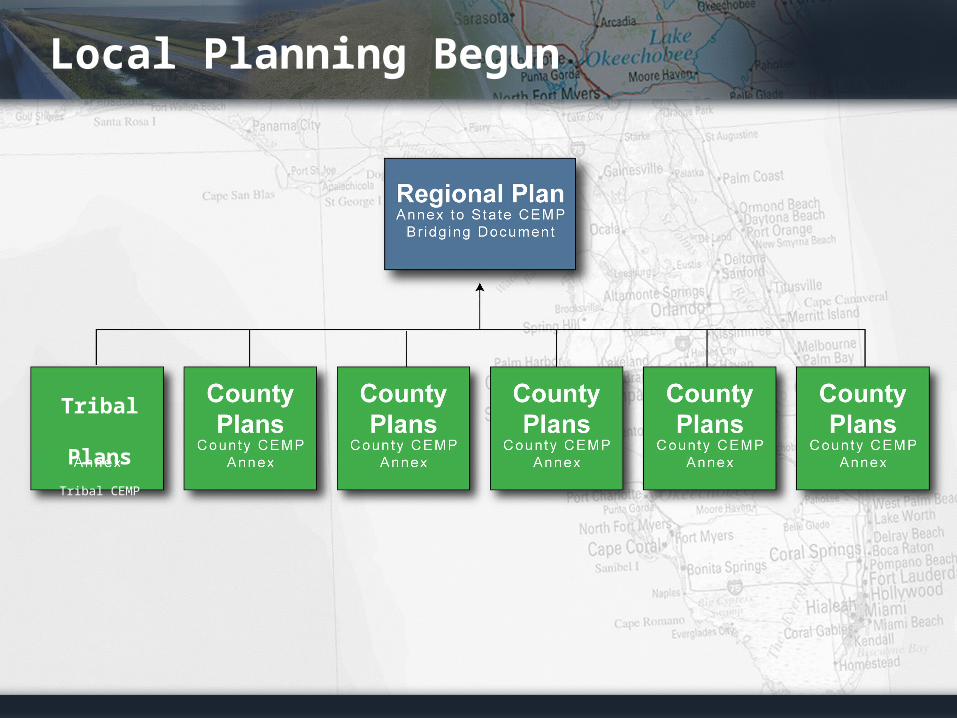
Local Planning Begun
Tribal
Plans
Tribal CEMP
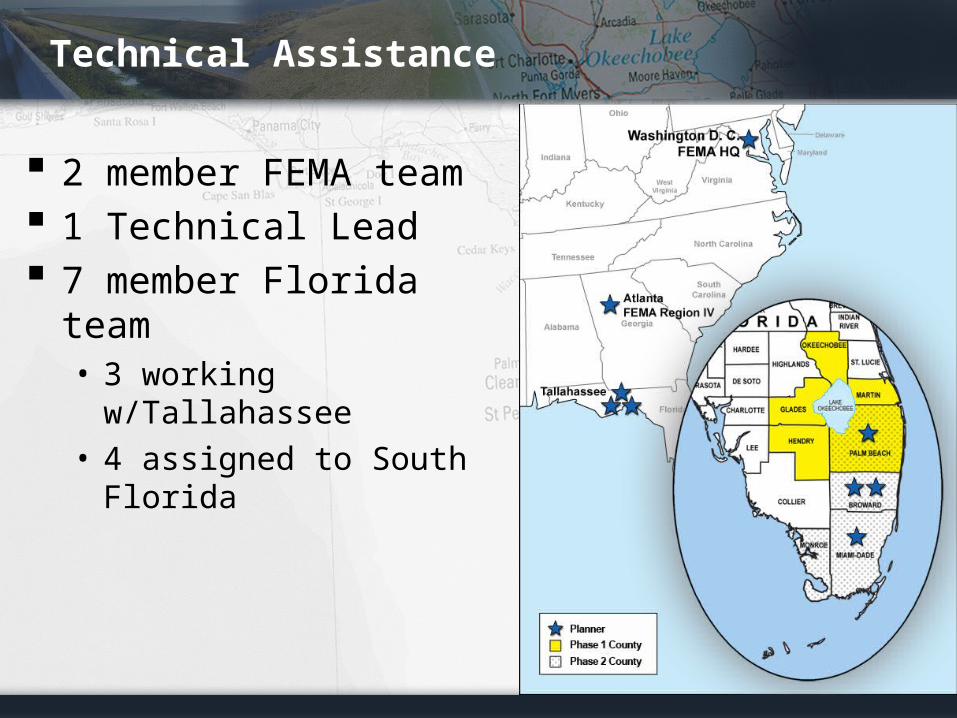
Technical Assistance
2 member FEMA team 1 Technical Lead 7 member Florida team
• 3 working w/Tallahassee• 4 assigned to South Florida
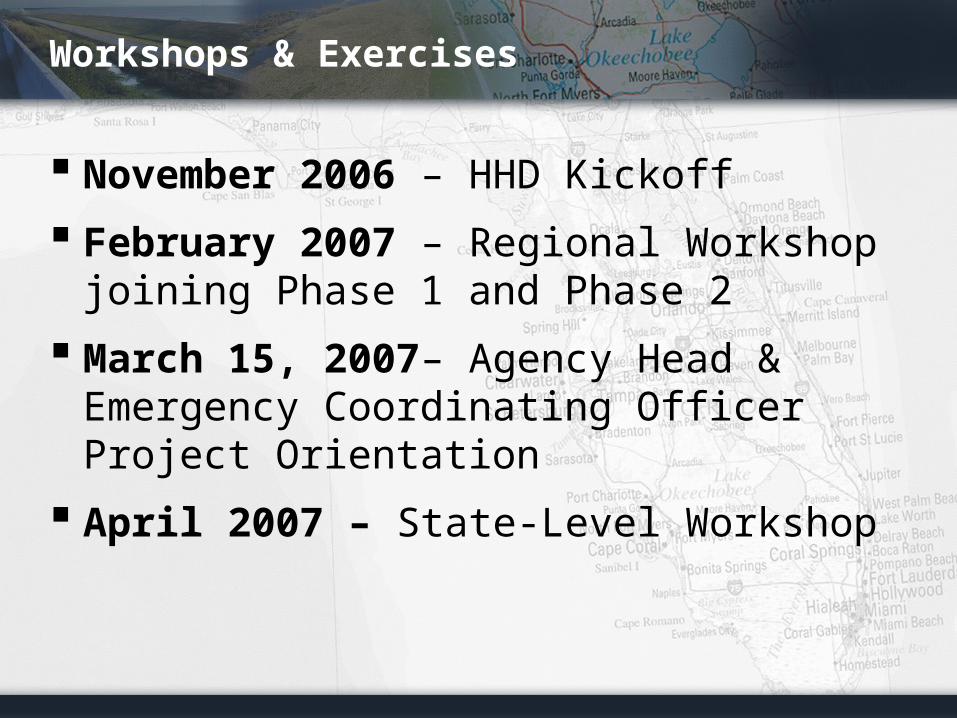
Workshops & Exercises
November 2006 – HHD Kickoff
February 2007 – Regional Workshop joining Phase 1 and Phase 2
March 15, 2007– Agency Head & Emergency Coordinating Officer Project Orientation
April 2007 – State-Level Workshop
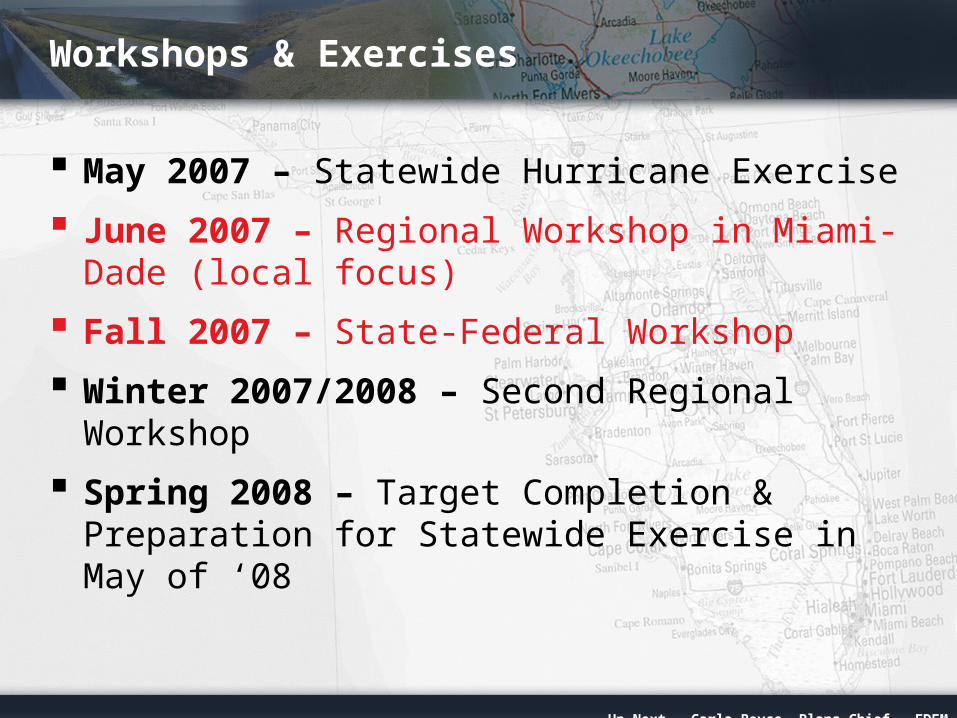
Workshops & Exercises
May 2007 – Statewide Hurricane Exercise
June 2007 – Regional Workshop in Miami-Dade (local focus)
Fall 2007 – State-Federal Workshop
Winter 2007/2008 – Second Regional Workshop
Spring 2008 – Target Completion & Preparation for Statewide Exercise in May of ‘08
Up Next – Carla Boyce, Plans Chief – FDEM
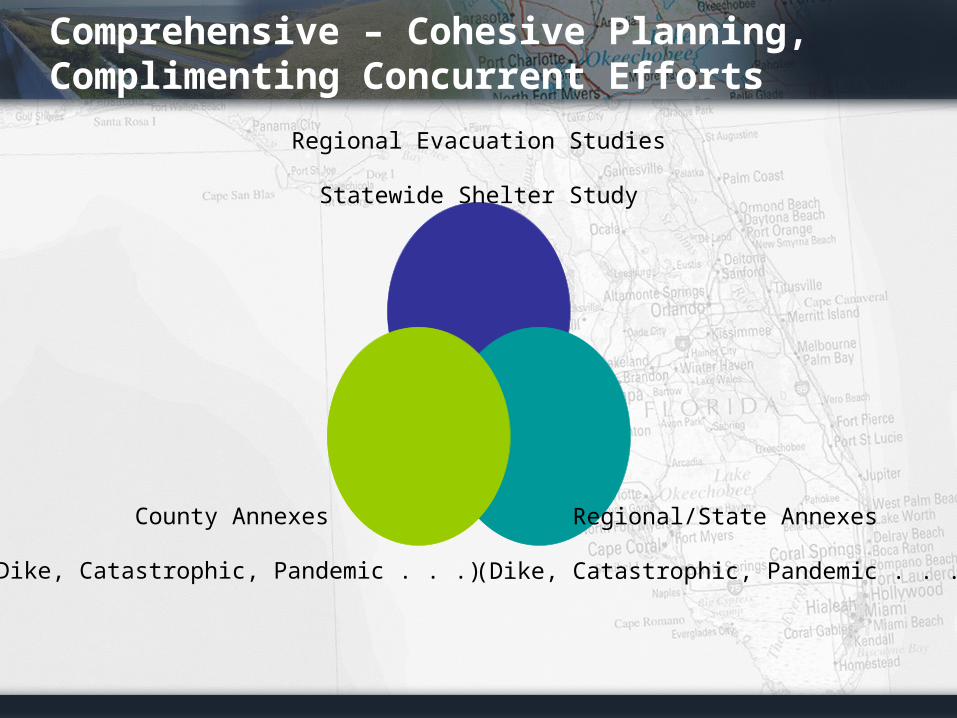
Comprehensive – Cohesive Planning, Complimenting Concurrent Efforts
Regional Evacuation Studies
Statewide Shelter Study
Regional/State Annexes
(Dike, Catastrophic, Pandemic . . .)
County Annexes
(Dike, Catastrophic, Pandemic . . .)

Comprehensive – Cohesive Planning, Complimenting Concurrent Efforts
Regional Evacuation Studies• Behavioral Studies• Vulnerability Assessment
Statewide Sheltering Plans County Annexes
• Comprehensive Emergency Management Plans• Herbert Hoover Dike Annexes• Catastrophic Plan Annexes
Regional Annexes• HHD Annex• Catastrophic Annex
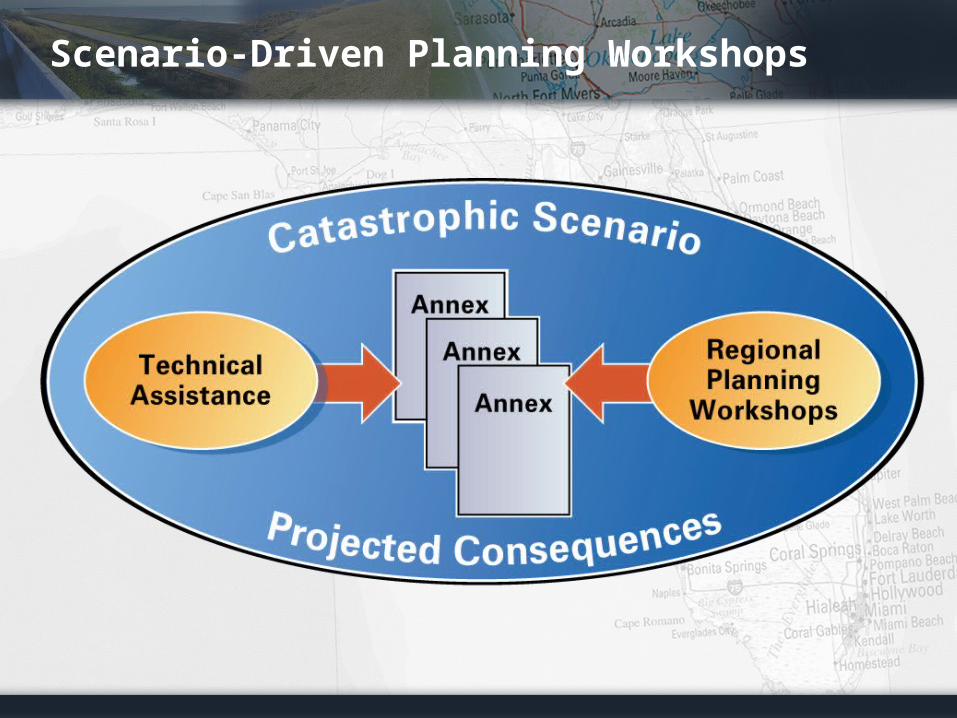
Scenario-Driven Planning Workshops
Scenario-Driven Planning
The scenario sets the “catastrophic bar,” helping to establish the necessary capacity of the resulting plans.
Participants at all levels of government contribute to the planning solutions, and the operational knowledge and experience captured make the resulting plans more viable.
Scenario-Driven Planning
Utilizes a realistic and comprehensive set of consequences for ALL stakeholders
Response and recovery actions will be based on the same planning assumptions & projected consequences
Allows ALL stakeholders to assess their existing and future plans in context of each other
Facilitates updates to and development of plans that address functional areas
Category 5 Hurricane Ono Nearing the
Bahamas
Category 5 Hurricane Ono Nearing the
Bahamas
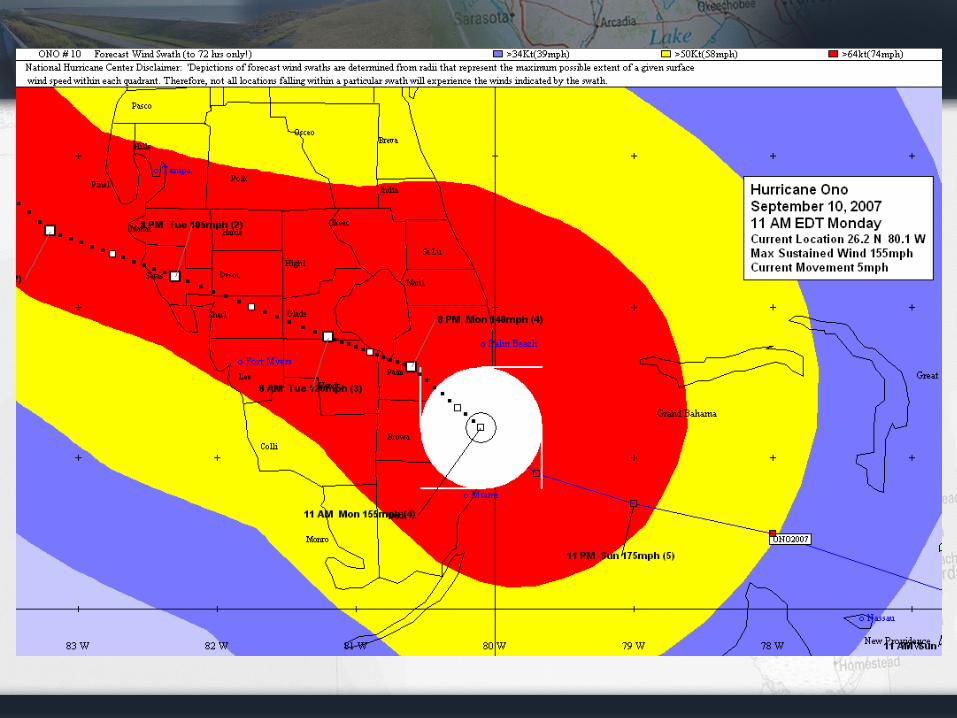
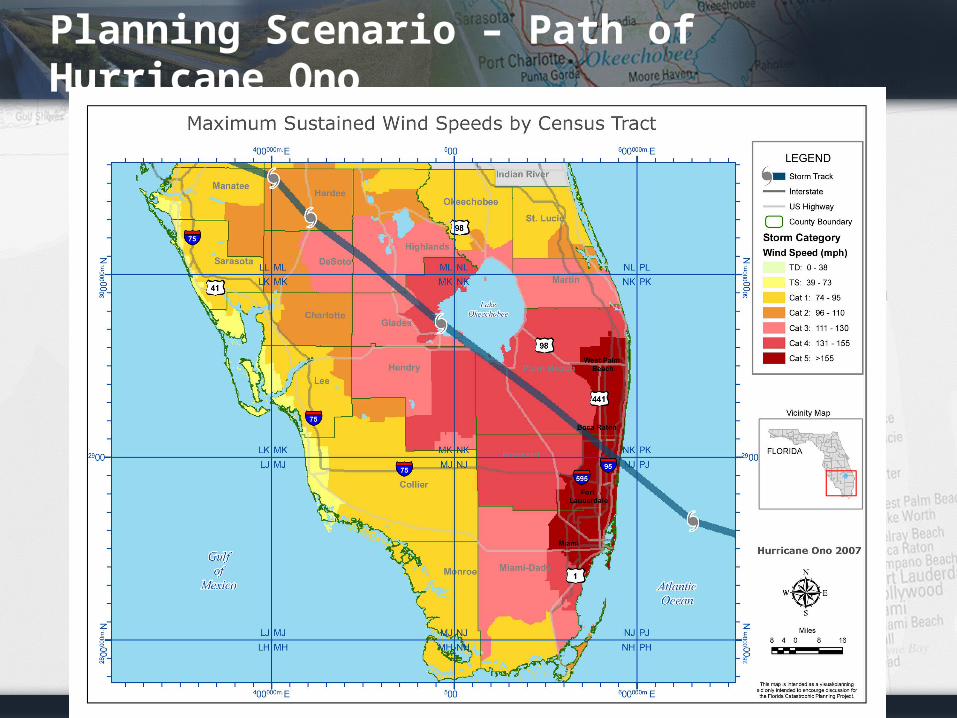
Planning Scenario – Path of Hurricane Ono

Extended Track
How does this affect in-state mutual aid/resources?
How does this affect out-of-state assistance?
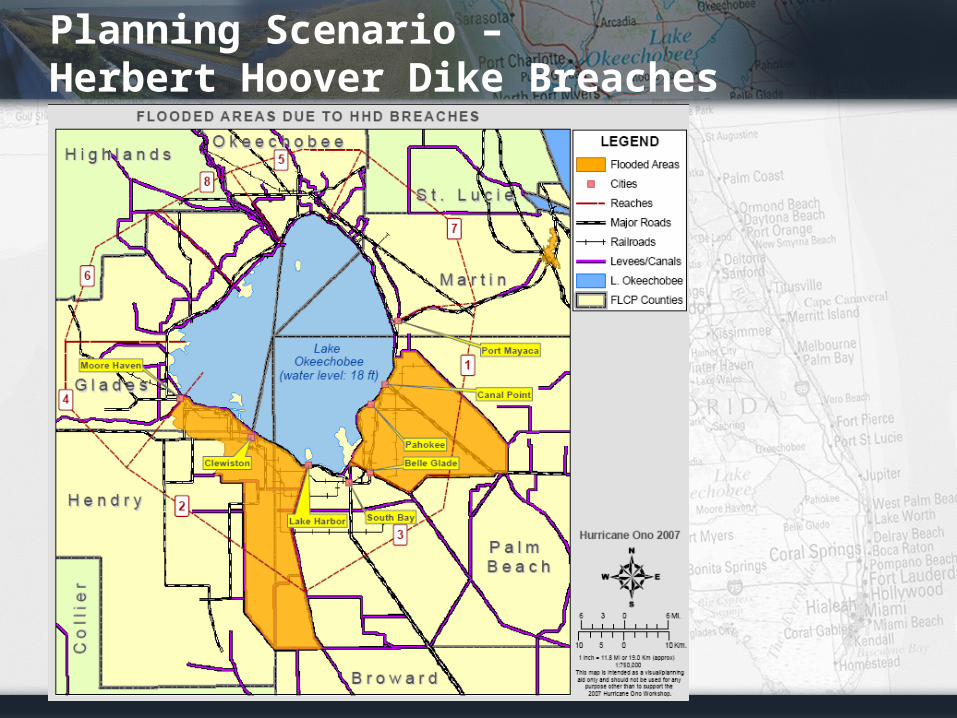
Planning Scenario –Herbert Hoover Dike Breaches
Herbert Hoover Dike & S80 Consequences
From Breaches and Structure Failure ONLY
In Reach 1 (Palm Beach County), the residences of approximately 4,700 households are flooded to a depth of five to thirteen feet.
In Reach 2 (Glades, Hendry, and Palm Beach County), the homes of approximately 4,800 households are within the area that would be covered by one to six feet of water.
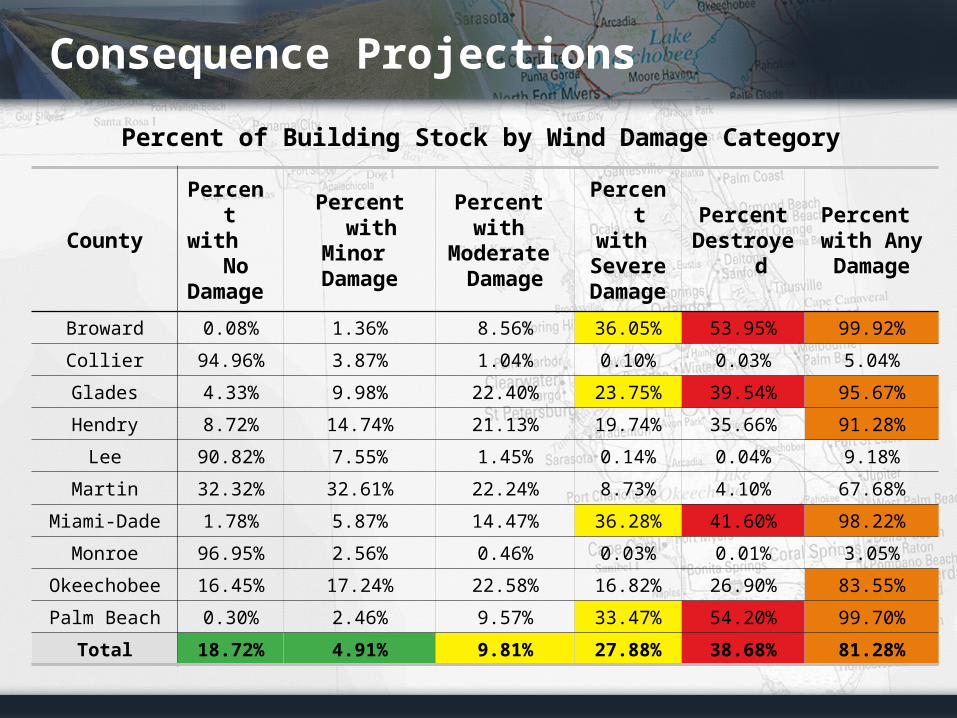
Consequence Projections
CountyPercent with No Damage
Percent with Minor
Damage
Percent with
Moderate Damage
Percent with
Severe Damage
PercentDestroyed
Percent with Any Damage
Broward 0.08% 1.36% 8.56% 36.05% 53.95% 99.92%
Collier 94.96% 3.87% 1.04% 0.10% 0.03% 5.04%
Glades 4.33% 9.98% 22.40% 23.75% 39.54% 95.67%
Hendry 8.72% 14.74% 21.13% 19.74% 35.66% 91.28%
Lee 90.82% 7.55% 1.45% 0.14% 0.04% 9.18%
Martin 32.32% 32.61% 22.24% 8.73% 4.10% 67.68%
Miami-Dade 1.78% 5.87% 14.47% 36.28% 41.60% 98.22%
Monroe 96.95% 2.56% 0.46% 0.03% 0.01% 3.05%
Okeechobee 16.45% 17.24% 22.58% 16.82% 26.90% 83.55%
Palm Beach 0.30% 2.46% 9.57% 33.47% 54.20% 99.70%
Total 18.72% 4.91% 9.81% 27.88% 38.68% 81.28%
Percent of Building Stock by Wind Damage Category
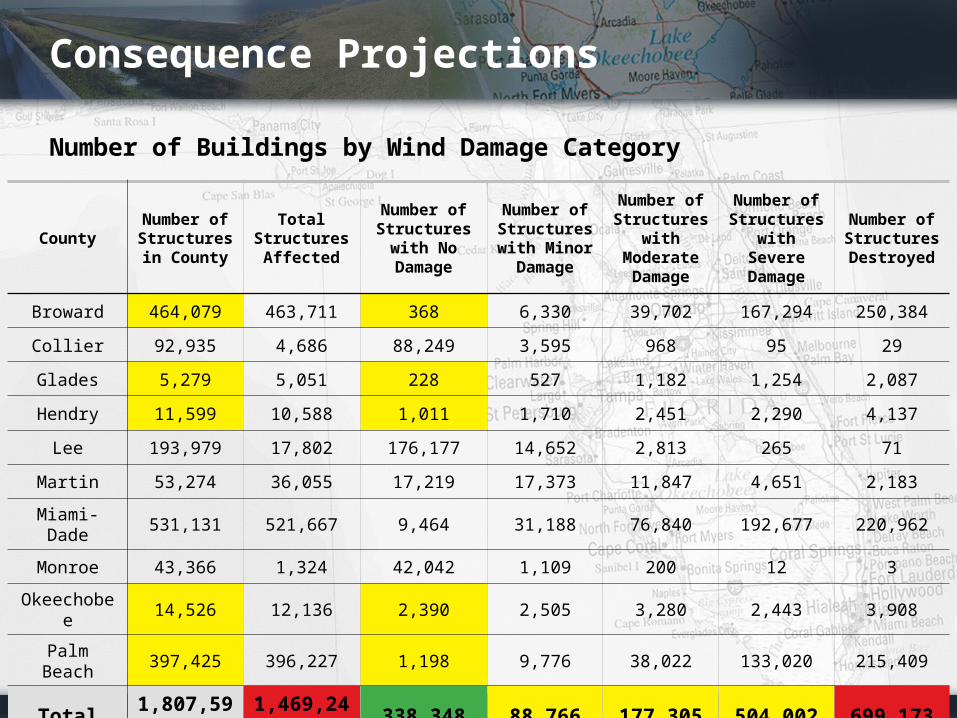
Consequence Projections
Number of Buildings by Wind Damage Category
CountyNumber of Structures in County
Total Structures Affected
Number of Structures
with No Damage
Number of Structures with Minor Damage
Number of Structures
with Moderate Damage
Number of Structures
with Severe Damage
Number of Structures Destroyed
Broward 464,079 463,711 368 6,330 39,702 167,294 250,384
Collier 92,935 4,686 88,249 3,595 968 95 29
Glades 5,279 5,051 228 527 1,182 1,254 2,087
Hendry 11,599 10,588 1,011 1,710 2,451 2,290 4,137
Lee 193,979 17,802 176,177 14,652 2,813 265 71
Martin 53,274 36,055 17,219 17,373 11,847 4,651 2,183
Miami-Dade 531,131 521,667 9,464 31,188 76,840 192,677 220,962
Monroe 43,366 1,324 42,042 1,109 200 12 3
Okeechobee 14,526 12,136 2,390 2,505 3,280 2,443 3,908
Palm Beach 397,425 396,227 1,198 9,776 38,022 133,020 215,409
Total 1,807,593 1,469,245 338,348 88,766 177,305 504,002 699,173

Decision Matrices & Resource Shortfalls
Decision Matrices & Resource Shortfalls
Assess required capabilities based on Catastrophic Scenario• What do we need to do?
Develop scalable and adaptable methods, formulas, or matrices that indicate the quantity and type of assets needed to meet the capability• What do we need to do it?
Decision Matrices & Resource Shortfalls
Determine available resources within local, regional or States inventories, including pre-disaster contracts• What do we already have?
Establish protocols & policies that clearly articulate how to meet both required capabilities and fill gaps and identify resource limitations• How are we going to get our hands on what
we have, and how will we get more?
Decision Matrices & Resource Shortfalls
Integrate with other scenario-based resource planning schemes across disciplines• What does this mean for the rest of the
response and recovery activities?
Sustain the planning process to facilitate updates and changes
The Word Problem
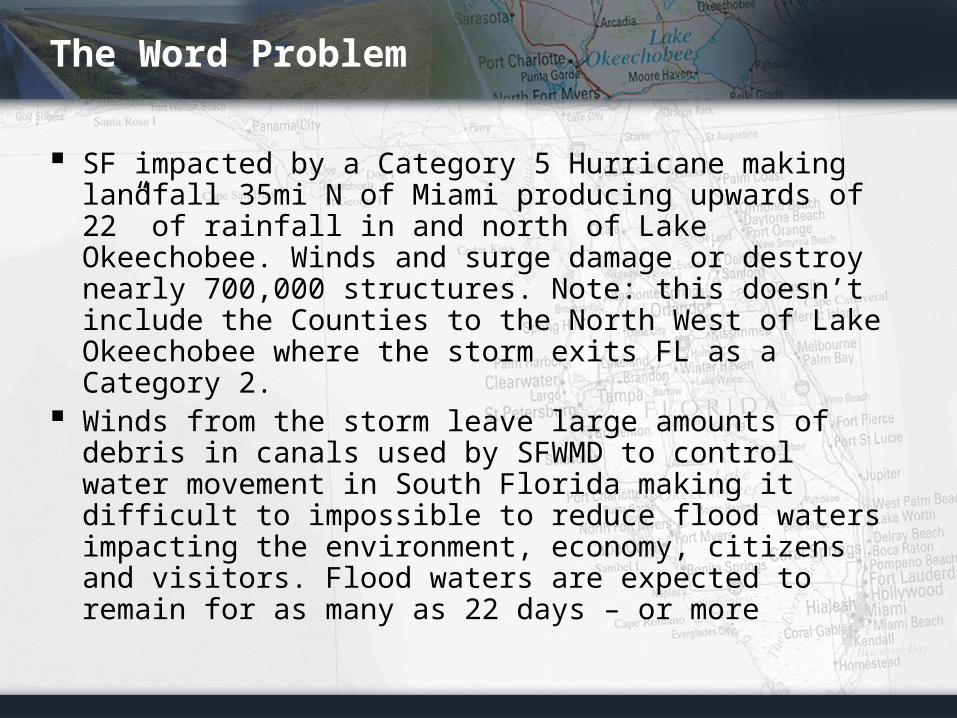
SF impacted by a Category 5 Hurricane making landfall 35mi N of Miami producing upwards of 22” of rainfall in and north of Lake Okeechobee. Winds and surge damage or destroy nearly 700,000 structures. Note: this doesn’t include the Counties to the North West of Lake Okeechobee where the storm exits FL as a Category 2.
Winds from the storm leave large amounts of debris in canals used by SFWMD to control water movement in South Florida making it difficult to impossible to reduce flood waters impacting the environment, economy, citizens and visitors. Flood waters are expected to remain for as many as 22 days – or more

Key Assumptions
Estimated Population – 6,358,934 2,867,295 people are projected to evacuate in
advance of the storm 796,214 people are expected to seek public
shelter (10’s of miles) 3,826,822 homes will be destroyed Up to 3,000,000 customers will be w/o power
from Miami-Dade to Indian River on the East and Manatee/Sarasota on the West
Pick ONE – Break It Down
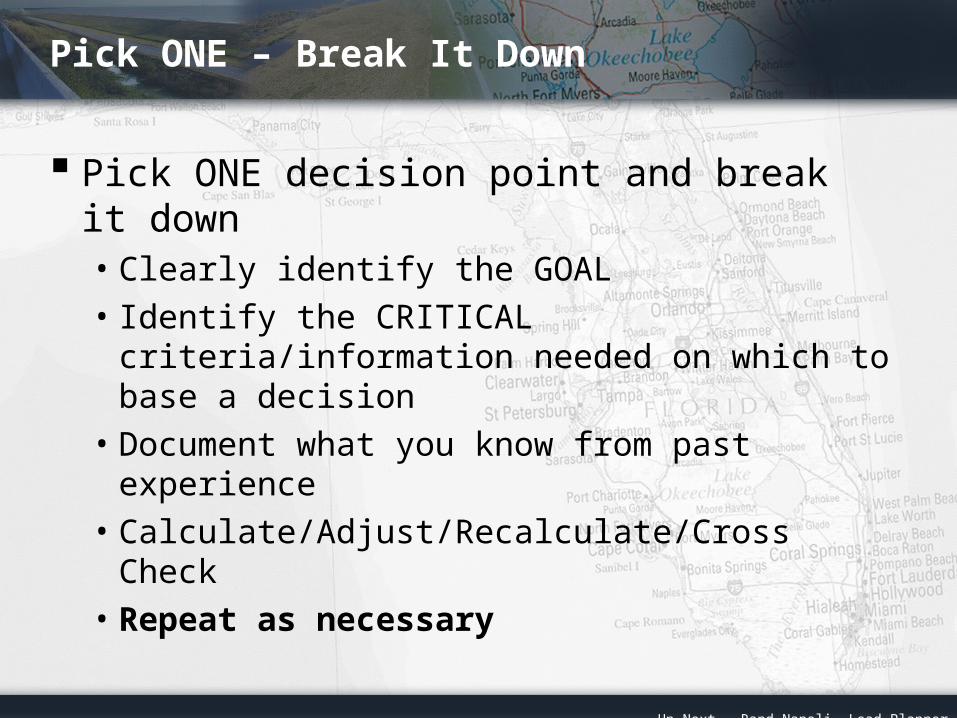
Pick ONE decision point and break it down• Clearly identify the GOAL• Identify the CRITICAL criteria/information
needed on which to base a decision• Document what you know from past
experience• Calculate/Adjust/Recalculate/Cross Check• Repeat as necessary
Up Next - Rand Napoli, Lead Planner
Pick ONE – Break It Down
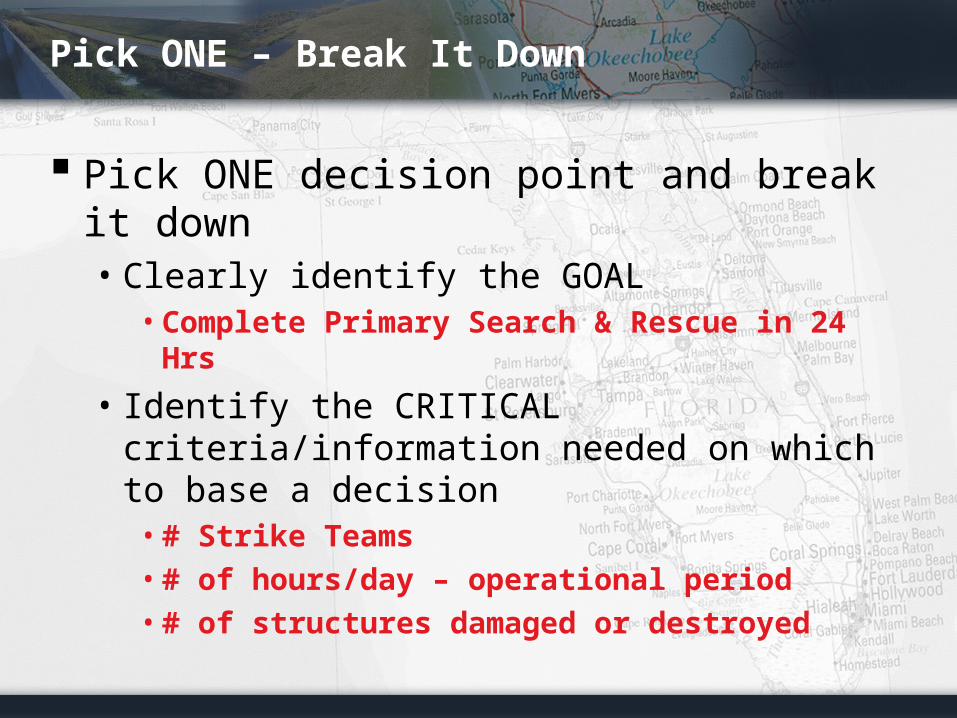
Pick ONE decision point and break it down• Clearly identify the GOAL
• Complete Primary Search & Rescue in 24 Hrs
• Identify the CRITICAL criteria/information needed on which to base a decision
• # Strike Teams• # of hours/day – operational period• # of structures damaged or destroyed
Pick ONE – Break It Down
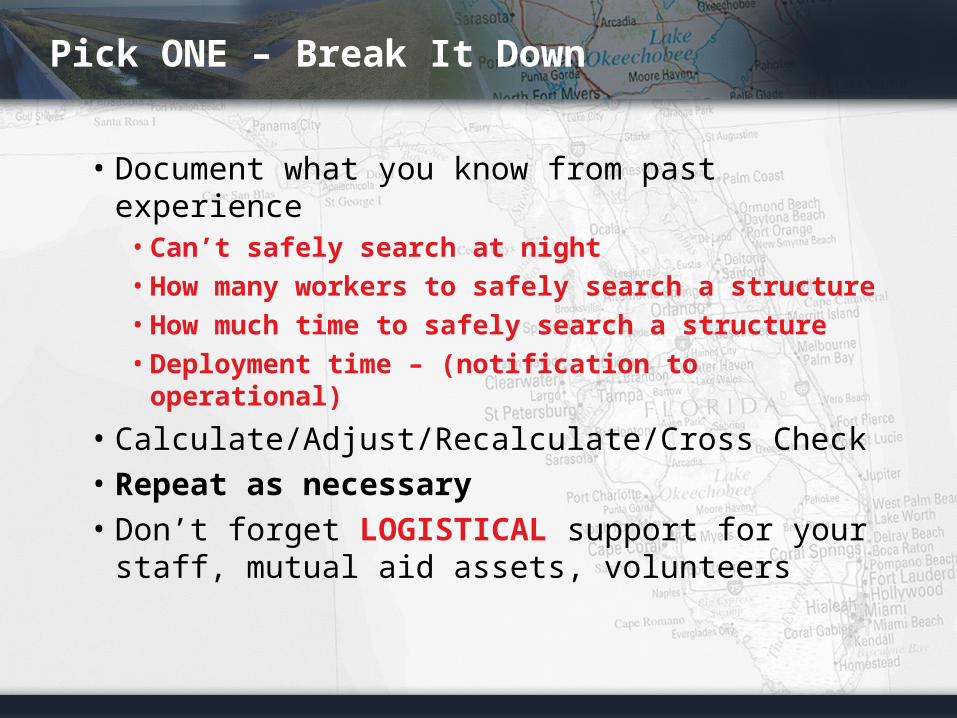
• Document what you know from past experience
• Can’t safely search at night• How many workers to safely search a structure• How much time to safely search a structure• Deployment time – (notification to operational)
• Calculate/Adjust/Recalculate/Cross Check• Repeat as necessary• Don’t forget LOGISTICAL support for your
staff, mutual aid assets, volunteers
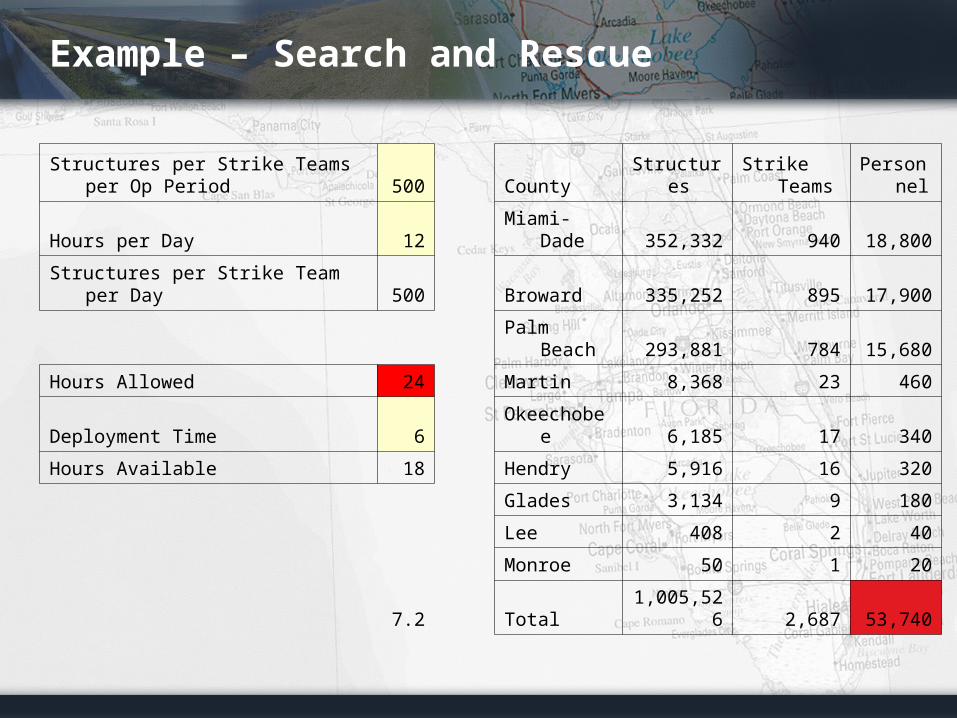
Example – Search and Rescue
Structures per Strike Teams per Op Period 500 County Structures
Strike Teams
Personnel
Hours per Day 12 Miami-Dade 352,332 940 18,800
Structures per Strike Team per Day 500 Broward 335,252 895 17,900
Palm Beach 293,881 784 15,680
Hours Allowed 24 Martin 8,368 23 460
Deployment Time 6 Okeechobee 6,185 17 340
Hours Available 18 Hendry 5,916 16 320
Glades 3,134 9 180
Lee 408 2 40
Monroe 50 1 20
7.2 Total 1,005,526 2,687 53,740
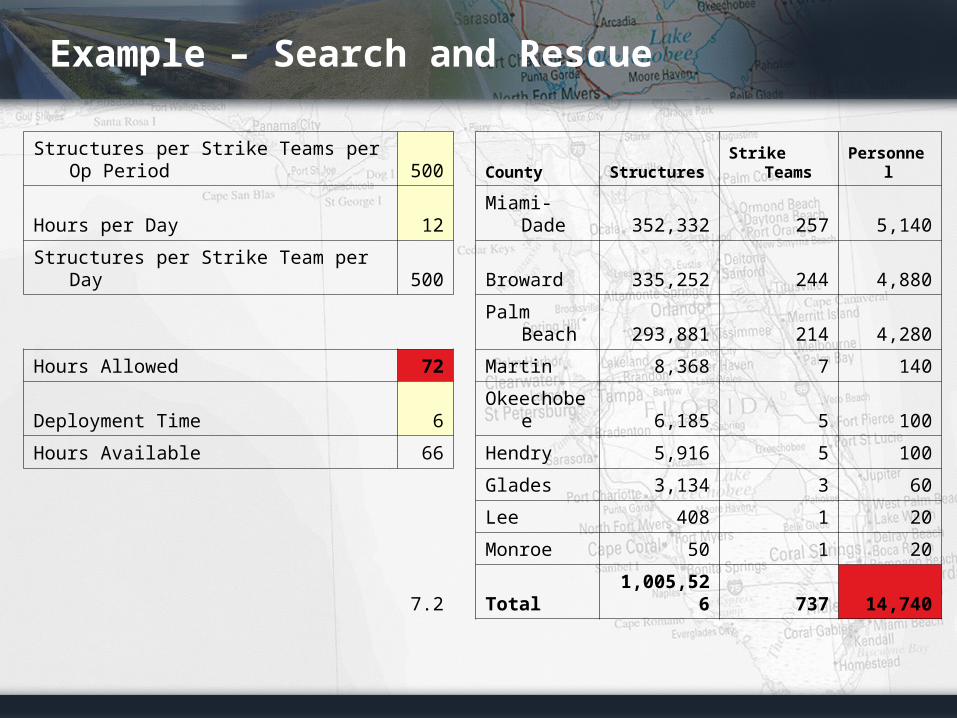
Example – Search and Rescue
Structures per Strike Teams per Op Period 500 County Structures Strike Teams Personnel
Hours per Day 12 Miami-Dade 352,332 257 5,140
Structures per Strike Team per Day 500 Broward 335,252 244 4,880
Palm Beach 293,881 214 4,280
Hours Allowed 72 Martin 8,368 7 140
Deployment Time 6Okeechobe
e 6,185 5 100
Hours Available 66 Hendry 5,916 5 100
Glades 3,134 3 60
Lee 408 1 20
Monroe 50 1 20
7.2 Total 1,005,526 737 14,740

Pick ONE – Break It Down
Pick ONE decision point and break it down• Clearly identify the GOAL
• Provide 3 Hot Meals/day for survivors in impacted area
• Identify the CRITICAL criteria/information needed on which to base a decision
• How many survivors remained in the area– Approximately 4.3 Million
• Quantity of food/meal• How many staff required to prepare/deliver

Pick ONE – Break It Down
• Document what you know from past experience
• Operational Period• Deployment time – (notification to operational)• Staff required to prepare X number meals
• Adjust/Recalculate/Cross Check/ - Repeat• Don’t forget LOGISTICAL support for your
staff, mutual aid assets, volunteers
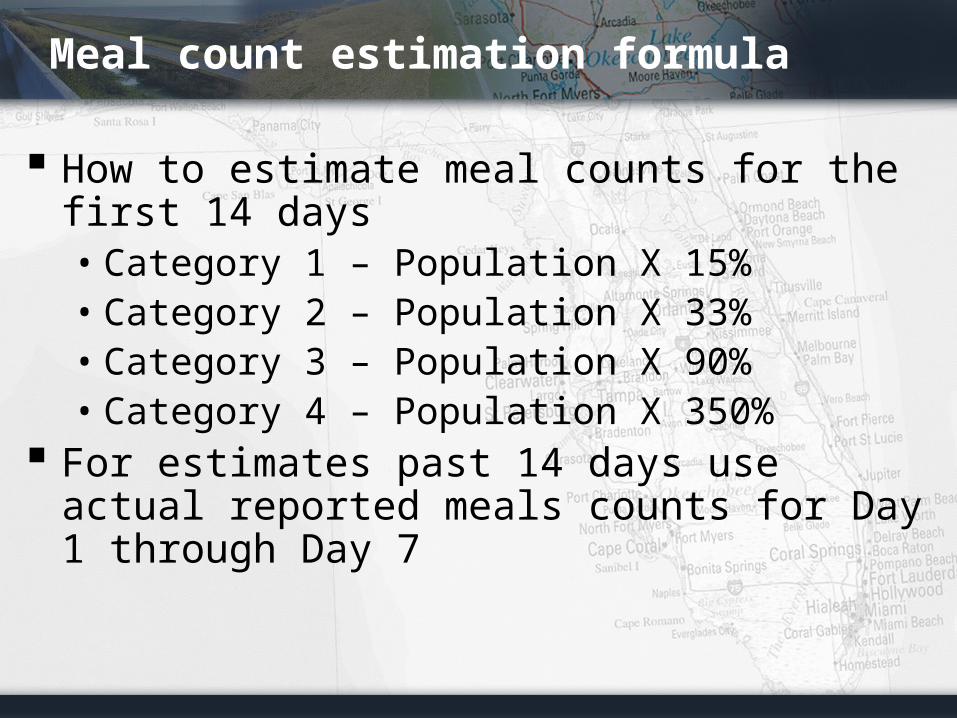
Meal count estimation formula
How to estimate meal counts for the first 14 days• Category 1 – Population X 15%• Category 2 – Population X 33%• Category 3 – Population X 90%• Category 4 – Population X 350%
For estimates past 14 days use actual reported meals counts for Day 1 through Day 7
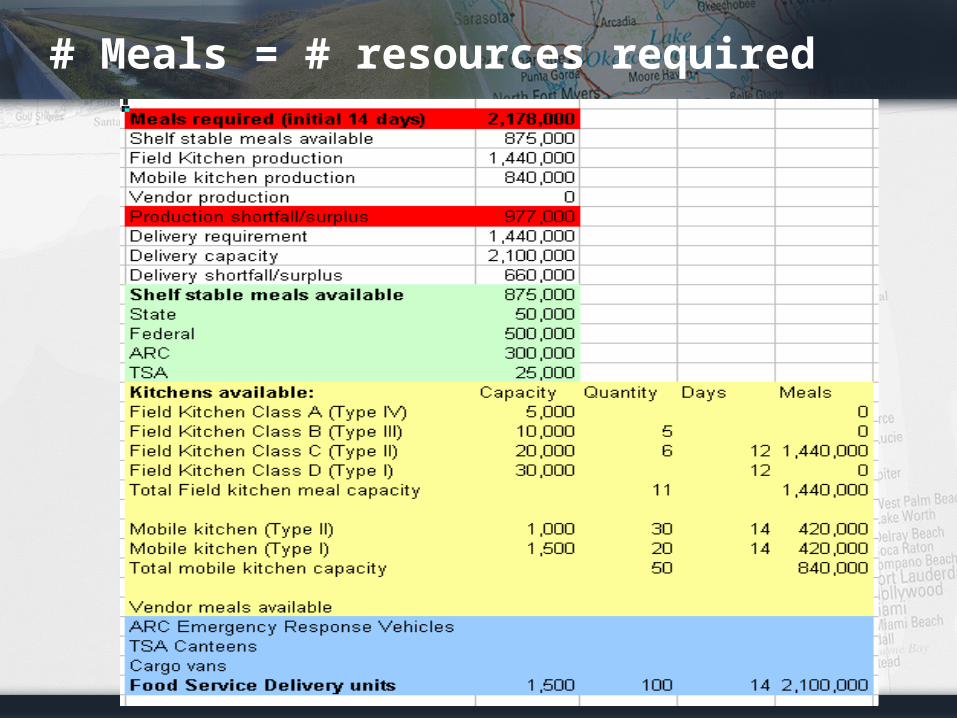
# Meals = # resources required
Contacts & Information
www.FloridaDisaster.org/CatastrophicPlanning Carla Boyce, Plans Chief
• 850.410.1268
Rand Napoli, Lead Planner – IEM• 904.370.0839
Between Workshops – HomeworkReach Out (Bring One)Get involved!