Embed Size (px)
Citation preview
1
Moving towards mass literacy in Spain, 1860-1930
Francisco J. Beltrán Tapia1, Alfonso Díez-Minguela2, Julio Martinez-Galarraga2,
Daniel A. Tirado-Fabregat2
May, 2019
Abstract
This study provides new evidence concerning the advance of literacy in Spain during the
period 1860-1930. To this end it has been constructed a new dataset comprising over a
quarter of a million observations that enable us to describe the evolution of the literacy
process from the beginning of the contemporary period to the advent of the Second
Republic in 1931, broken down territorially to municipal level and distinguishing between
men and women. Departing from these new data, we carry out a preliminary analysis of the
effects of the various changes made to the Spanish model of primary education provision,
which moves from a scenario characterized by an absence of government regulation,
through one with a regulatory framework that made individuals and municipal councils
responsible for its costs (Public Instruction Act 1857), and finally to one in which it was
regulated and funded by the State (with the creation of the Ministry of Public Instruction in
1900).
Keywords: Literacy, Human Capital, Gender Gap, 19th century, Spain
JEL codes: N33, I24, I25
1 Norwegian University of Science and Technology 2 Universitat de València
* The authors thank the financial support of the Bank of Spain through the “Programa de
Ayudas a la Investigación en Historia Económica” and Pablo Martin-Aceña for his help,
trust and patience.
2
1.- Introduction.
The aim of this study is to provide new evidence concerning the advance of literacy in
Spain during the period 1860-1930. To this end we construct a dataset comprising over a
quarter million observations, broken down territorially to municipal level and distinguishing
between men and women, that enables us to determine the evolution of literacy from the
beginning of the contemporary period to the advent of the Second Republic in 1931.1
These new data allow us to analyse the effects of the various changes made to the Spanish
model of primary education. In this regard, starting with a scenario characterized by an
absence of government regulation, the educational system first moved to a regulatory
framework that made individuals and municipal councils responsible for its costs (Public
Instruction Act 1857), and then ended up being regulated and funded by the State (with the
creation of the Ministry of Public Instruction in 1900).
The amount of detail in the information we have collected also permits analysing
two additional aspects of great importance as far as the impact of primary education on the
development of societies is concerned: gender and territorial inequality. Therefore, the text
first explores the inequality in literacy between men and women, focusing specifically on
the evolution of the gender gap between 1860 and 1930. In particular we study whether
this gap narrowed significantly after the active involvement of the State through the
creation of the Ministry of Public Instruction in 1900. Complementing this, we next
provide new evidence on the evolution of territorial inequality in terms of literacy, broken
down into different levels of territorial aggregation: municipal, provincial and regional. As
well as providing details of their own long-term evolution, these different levels of
territorial aggregation and the points of time analysed make it possible to establish
hypotheses as to the impact of the new institutional framework (decentralized vs
centralized funding) on education levels.
The article concludes opening up avenues for future research involving the initial
review – in light of the new evidence – of the main theories established regarding the
determinants of the slow advance of literacy in Spain, the territorial and gender inequality
associated with it, and the impact of different institutional frameworks. The territorial detail 1 Specifically, the data processed for 1860 cover [9,364 municipalities] x [4 categories (‘can read’, ‘can read and write’, ‘cannot read’ and ‘total population’)] x [2 genders (male/female)] = 74,912 in total. For the Population Census of 1900 the total is [9,264 municipalities] x [5 categories (‘can read’, ‘can read and write’, ‘cannot read’, ‘not known’ and ‘total population’)] x [2 genders (male/female)] = 92,640. And for 1930 the data comprise [9,259 municipalities] x [5 categories (‘can read’, ‘can read and write’, ‘cannot read’, ‘not known’ and ‘total population’)] x [2 genders (male/female)] = 92,590 in total. For each point in time these data have been homogenized to the data for the 7,851 municipalities of Spain contained in the 2001 census. The work carried out by Eter Burduli, a research assistant employed using funds for the project financed by the Bank of Spain, was crucial during the data collection stage.
3
provided in the study will enable future research to thoroughly test some of the traditional
hypotheses found in Spanish historiography. It will also provide the chance to contribute
to the ongoing debates in the international literature regarding the determinants of the
unequal growth of literacy in developing societies.
2. The main stages of the literacy process.
2.1. Background.
The eighteenth century witnessed various attempts aimed at determining the educational
status of the population in the territory we know today as Spain. The Godoy-Larruga
Census of 1797 was the first to provide aggregate information about different educational
levels, indicating the number of primary schools, teachers (male/female) and girls/boys.2
According to Guereña and Viñao (1996, p.45): “the data for 1797 provide an approximate
measurement of the population and the school network in Spain at the end of the Ancien Regime”. The
figures show that the first level of the educational infrastructure had 11,007 primary
schools (8,704 for boys and 2,303 for girls), 8,962 male teachers and 2,575 female teachers.3
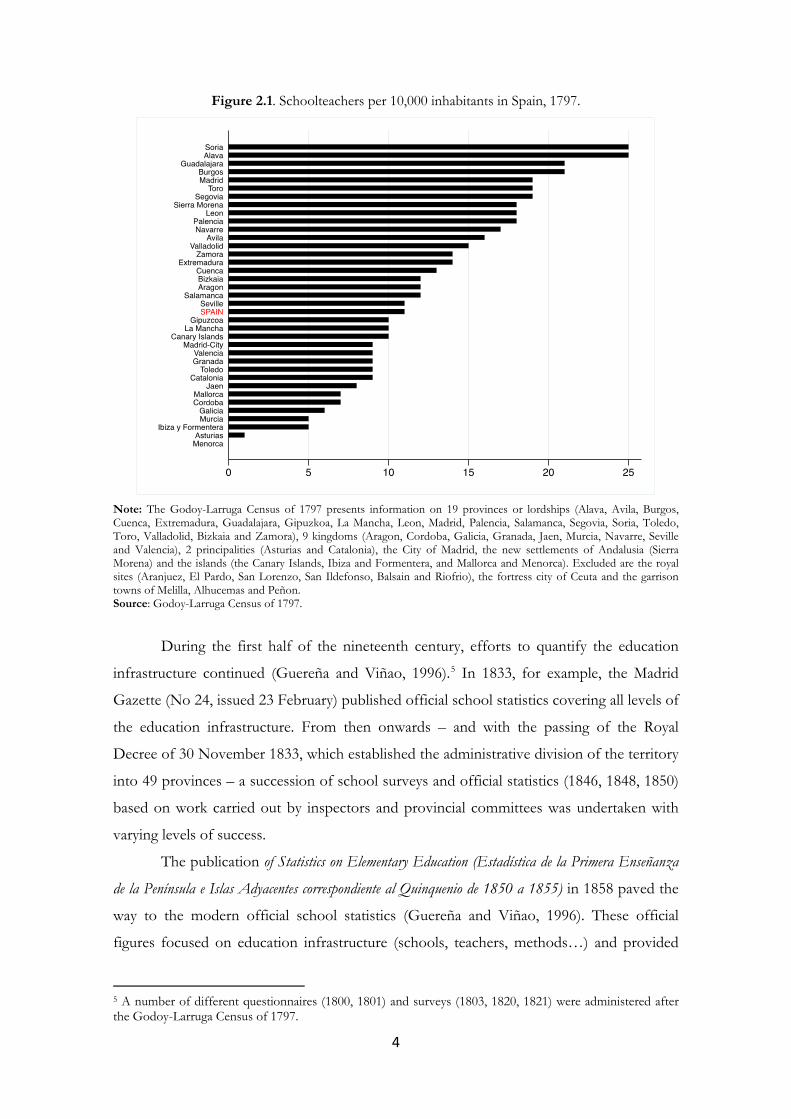
This approximation enables us to appreciate the first big differences involving both gender
and territory. For example, Figure 2.1 shows the inequality that existed between the
territories that then made up the Kingdom of Spain regarding the number of teachers per
10,000 inhabitants.4 These differences, which were already present in the eighteenth
century, reveal that the spread of literacy across the population in later centuries would be
conditioned by the inertia of the past.
2 Following the Royal Order of 6 May 1790, the Godoy-Larruga Census took a special interest in the state of education (Guereña and Viñao, 1996). For a qualitative approximation see Laspalas Pérez (1991). 3 The Godoy-Larruga Census of 1797 provided information on the number of boys (304,613) and girls (88,513) in these schools. The total population was estimated at around 10.5 million. 4 The territorial configuration of the Kingdom of Spain is considered throughout the text to correspond to the sum of the territories situated on the Iberian Peninsula, the Balearic Islands and the Canary Islands.
4
Figure 2.1. Schoolteachers per 10,000 inhabitants in Spain, 1797.
Note: The Godoy-Larruga Census of 1797 presents information on 19 provinces or lordships (Alava, Avila, Burgos, Cuenca, Extremadura, Guadalajara, Gipuzkoa, La Mancha, Leon, Madrid, Palencia, Salamanca, Segovia, Soria, Toledo, Toro, Valladolid, Bizkaia and Zamora), 9 kingdoms (Aragon, Cordoba, Galicia, Granada, Jaen, Murcia, Navarre, Seville and Valencia), 2 principalities (Asturias and Catalonia), the City of Madrid, the new settlements of Andalusia (Sierra Morena) and the islands (the Canary Islands, Ibiza and Formentera, and Mallorca and Menorca). Excluded are the royal sites (Aranjuez, El Pardo, San Lorenzo, San Ildefonso, Balsain and Riofrio), the fortress city of Ceuta and the garrison towns of Melilla, Alhucemas and Peñon. Source: Godoy-Larruga Census of 1797.
During the first half of the nineteenth century, efforts to quantify the education
infrastructure continued (Guereña and Viñao, 1996).5 In 1833, for example, the Madrid
Gazette (No 24, issued 23 February) published official school statistics covering all levels of
the education infrastructure. From then onwards – and with the passing of the Royal
Decree of 30 November 1833, which established the administrative division of the territory
into 49 provinces – a succession of school surveys and official statistics (1846, 1848, 1850)
based on work carried out by inspectors and provincial committees was undertaken with
varying levels of success.
The publication of Statistics on Elementary Education (Estadística de la Primera Enseñanza
de la Península e Islas Adyacentes correspondiente al Quinquenio de 1850 a 1855) in 1858 paved the
way to the modern official school statistics (Guereña and Viñao, 1996). These official
figures focused on education infrastructure (schools, teachers, methods…) and provided
5 A number of different questionnaires (1800, 1801) and surveys (1803, 1820, 1821) were administered after the Godoy-Larruga Census of 1797.
5
aggregate information for each province. However, this detailed information poses two
problems. First, it does not tell us the proportion of the population that could read and
write, and second, the fact that the information is aggregated at provincial level makes it
difficult to carry out an in-depth analysis of territorial inequalities.
The need to have more information on the socioeconomic situation led in 1856 to
the creation of the Royal Statistical Commission (Comisión de Estadística General del Reino),
which one year later would carry out another population count, published in 1858.
However, it was not until the census of 1860 that information on the basic education of the
population appeared for the first time. This was presented for each municipality and
divided the population into three groups: “Can read but not write”, “Can read and write” and
“Cannot read”. The information on primary education was systematized in later censuses
(1877, 1887, 1900, 1910, 1920 and 1930), thus making it possible to study this issue at a
greater level of disaggregation than in surveys and official school statistics.
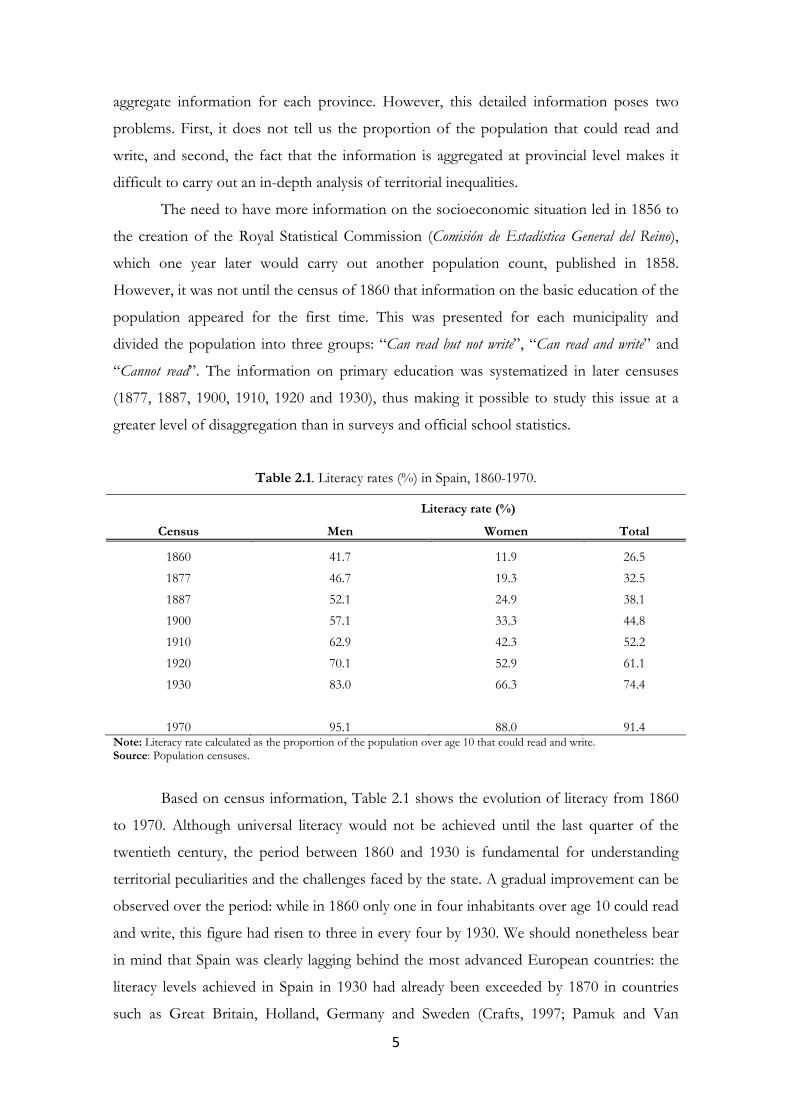
Table 2.1. Literacy rates (%) in Spain, 1860-1970.
Literacy rate (%)
Census Men Women Total
1860 41.7 11.9 26.5
1877 46.7 19.3 32.5
1887 52.1 24.9 38.1
1900 57.1 33.3 44.8
1910 62.9 42.3 52.2
1920 70.1 52.9 61.1
1930 83.0 66.3 74.4
1970 95.1 88.0 91.4 Note: Literacy rate calculated as the proportion of the population over age 10 that could read and write. Source: Population censuses.
Based on census information, Table 2.1 shows the evolution of literacy from 1860
to 1970. Although universal literacy would not be achieved until the last quarter of the
twentieth century, the period between 1860 and 1930 is fundamental for understanding
territorial peculiarities and the challenges faced by the state. A gradual improvement can be
observed over the period: while in 1860 only one in four inhabitants over age 10 could read
and write, this figure had risen to three in every four by 1930. We should nonetheless bear
in mind that Spain was clearly lagging behind the most advanced European countries: the
literacy levels achieved in Spain in 1930 had already been exceeded by 1870 in countries
such as Great Britain, Holland, Germany and Sweden (Crafts, 1997; Pamuk and Van
6
Zanden, 2010). Thus the advance of the literacy process over the period at best served to
narrow the gap that existed between Spain and other more developed European countries.
In addition, national averages hide notable gender and territorial differences.
2.2. The legacy of the Ancien Regime.
By 1860 the surveys and official school statistics were already sounding a warning regarding
the shortage of schools, the precarious situation of teachers, the deficiencies of teaching
methods and the differences that existed between boys’ and girls’ education.6 Huge
differences could also be seen in the provision of educational infrastructures and enrolment
rates. It was in this historical context that Article 366 of the Constitution of 1812 (Item IX.
On public education) set out that “all the towns in the Kingdom shall establish elementary schools, in
which children will be taught reading, writing and counting, and the catechism of the Catholic religion,
which will also include a brief outline of civil obligations”. It also aimed to create a uniform
education system (Art. 368) and a Ministerial Education Board in charge of inspections
(Art. 369). These ideas were given shape in the Quintana Report of 1814 (Report and Draft
Decree on the ordering of Public Education), but the plans were halted due to political and social
instability.7
During the first half of the nineteenth century, primary schools thus followed no
specific education plan and were left to their own means in terms of funding. In other
words, primary education was a municipal responsibility. In was not until 1857, in an
international context marked by great socioeconomic change in which various countries
were taking their first steps towards mass schooling, when the Public Instruction Act
(PIA), commonly known as the Moyano Act, was passed. This law regulated the education
system from 1857 to 1970, when it was replaced by the General Education Act (GEA).8
Therefore an analysis of census information for the period 1860-1930 will enable us to
6 Surveys and official school statistics were not the only sources of information. The property register (Cadastro) compiled between 1749 and 1760 in the Crown of Castile provided information on schools and teachers which, according to Guereña and Viñao (1996, p.27), made it possible to “reconstruct the school network of a particular area”. Other authors have taken literacy to mean the ability of the head of the family to sign the declaration for the property register (Álvarez and Ramos Palencia, 2018). See also Nalle (1989) for the modern era. Another important source is the Geographical, statistical and historical dictionary of Spain and its overseas possessions by Pascual Madoz, which includes information on the education infrastructure in the mid-nineteenth century. 7 1821 saw the establishment of General Regulations for Public Instruction, following the Quintana Report, which were not pursued further. From then until the Public Instruction Act (PIA) of 1857 there was a succession of different plans and endeavours such as the Duque de Rivas Plan of 1836 and, notably, the creation of the Ministerial Board of Public Instruction in 1846. 8 Although the PIA continued until 1970, successive changes were introduced during the 113 years that it remained in force. Compulsory education, for example, in principle from age 6 to age 9, was extended to age 12 in 1909 and age 14 in 1964.
7
evaluate (i) the legacy of the Ancien Regime, and (ii) the actions taken between the passing of
the Moyano Act and the Census of 1930, one year before the proclamation of the Second
Republic.
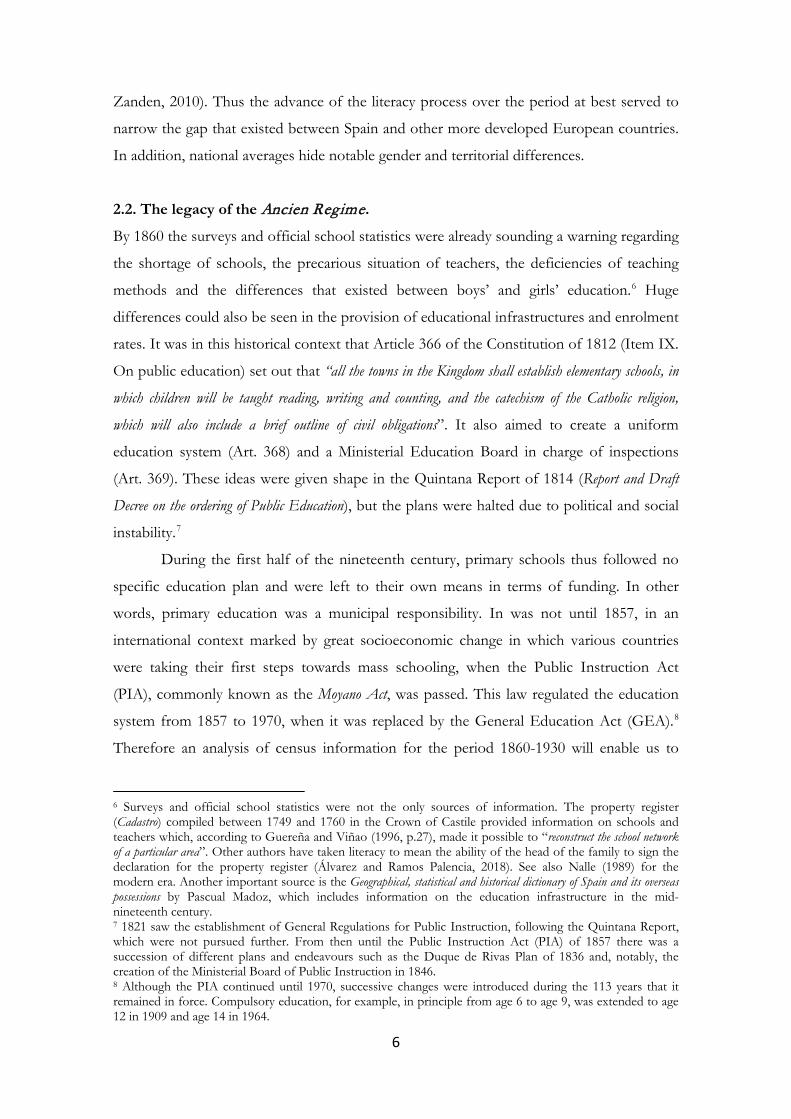
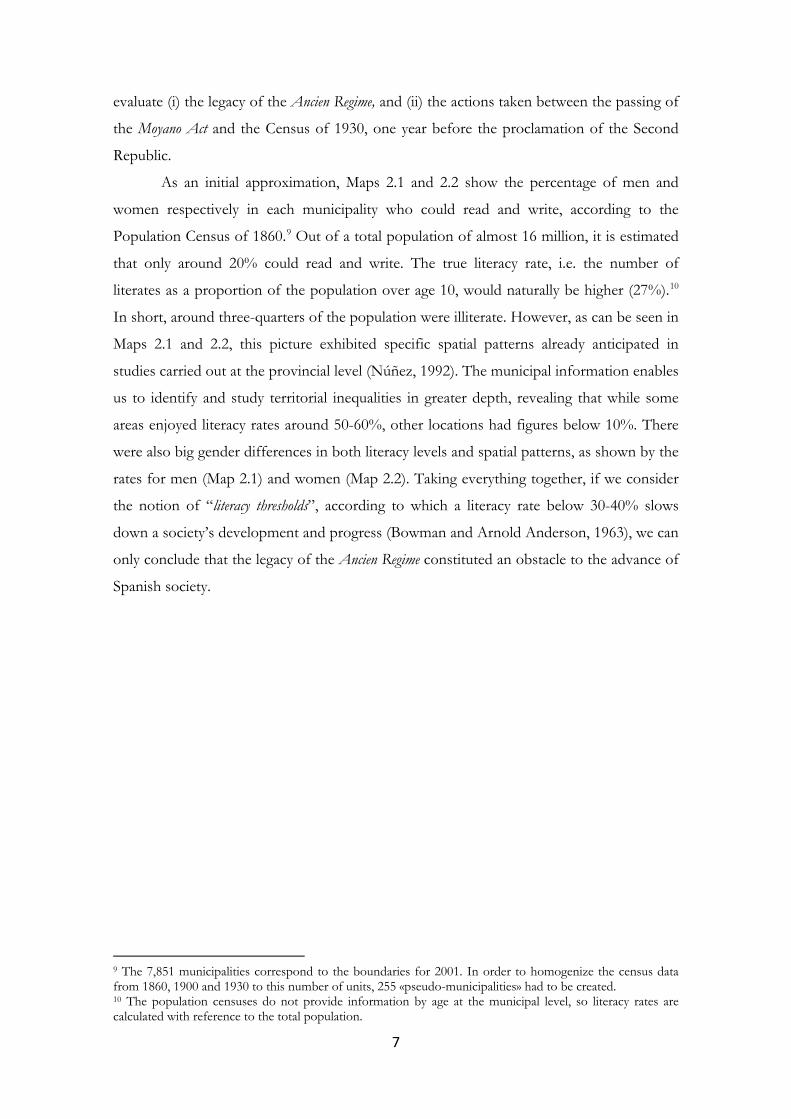
As an initial approximation, Maps 2.1 and 2.2 show the percentage of men and
women respectively in each municipality who could read and write, according to the
Population Census of 1860.9 Out of a total population of almost 16 million, it is estimated
that only around 20% could read and write. The true literacy rate, i.e. the number of
literates as a proportion of the population over age 10, would naturally be higher (27%).10
In short, around three-quarters of the population were illiterate. However, as can be seen in
Maps 2.1 and 2.2, this picture exhibited specific spatial patterns already anticipated in
studies carried out at the provincial level (Núñez, 1992). The municipal information enables
us to identify and study territorial inequalities in greater depth, revealing that while some
areas enjoyed literacy rates around 50-60%, other locations had figures below 10%. There
were also big gender differences in both literacy levels and spatial patterns, as shown by the
rates for men (Map 2.1) and women (Map 2.2). Taking everything together, if we consider
the notion of “literacy thresholds”, according to which a literacy rate below 30-40% slows
down a society’s development and progress (Bowman and Arnold Anderson, 1963), we can
only conclude that the legacy of the Ancien Regime constituted an obstacle to the advance of
Spanish society.
9 The 7,851 municipalities correspond to the boundaries for 2001. In order to homogenize the census data from 1860, 1900 and 1930 to this number of units, 255 «pseudo-municipalities» had to be created. 10 The population censuses do not provide information by age at the municipal level, so literacy rates are calculated with reference to the total population.
8
Map 2.1. Male literacy rates in 1860.
Source: Population census.
Map 2.2. Female literacy rates in 1860.
Source: Population census.
9
Attempts to achieve mass schooling – and with it universal literacy – faced a variety
of problems. A traditional setback, and one of the motivations behind the Public
Instruction Act of 1857, was the lack of a suitable educational infrastructure. In this regard,
the Moyano Act laid down a minimum threshold requirement for schools for each town
according to its size. Communities of over “500 souls”, for example, should have at least
one public primary school for boys and another for girls, even if the latter were
‘incomplete’ (escuelas incompletas) (Art. 100).11 Communities of at least “2,000 souls” should
have two complete schools each for boys and girls, while those with “4,000 souls” should
have three, and so on (Art. 101). It was also recommended that communities of fewer than
“500 souls” should form districts so that they could have a complete primary school (Art.
102). Should this not be possible, then the establishment of an incomplete or seasonal
school was allowed.
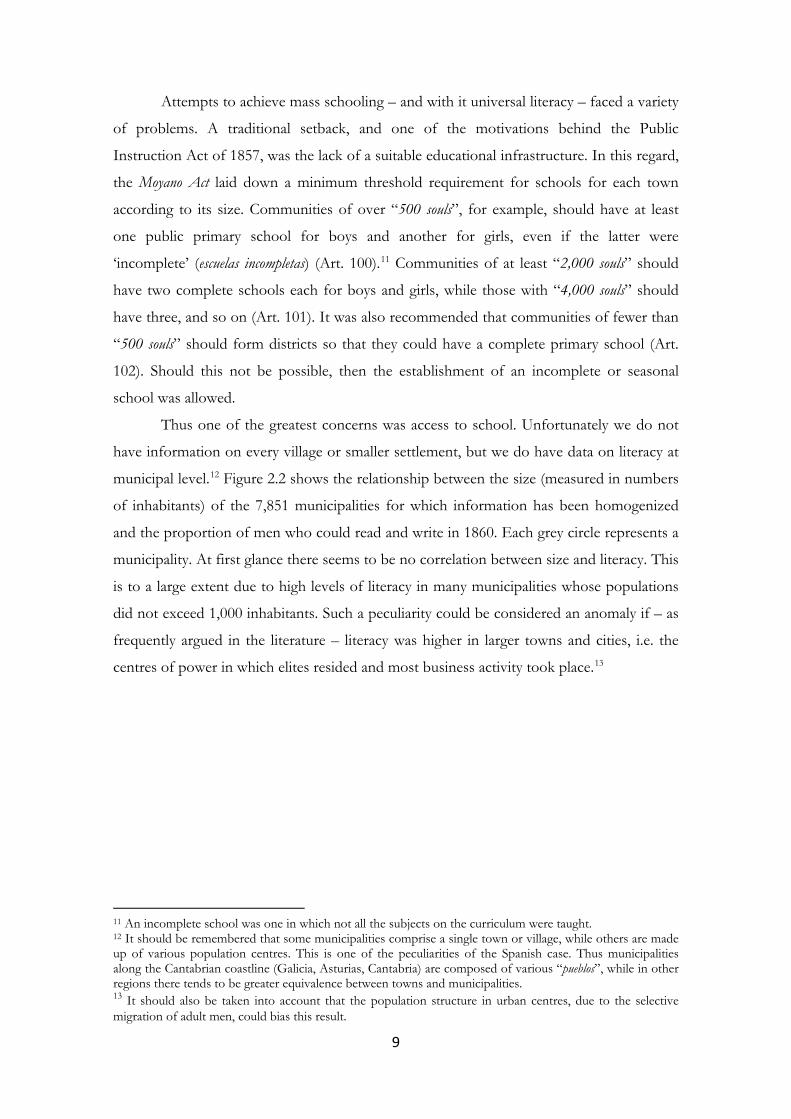
Thus one of the greatest concerns was access to school. Unfortunately we do not
have information on every village or smaller settlement, but we do have data on literacy at
municipal level.12 Figure 2.2 shows the relationship between the size (measured in numbers
of inhabitants) of the 7,851 municipalities for which information has been homogenized
and the proportion of men who could read and write in 1860. Each grey circle represents a
municipality. At first glance there seems to be no correlation between size and literacy. This
is to a large extent due to high levels of literacy in many municipalities whose populations
did not exceed 1,000 inhabitants. Such a peculiarity could be considered an anomaly if – as
frequently argued in the literature – literacy was higher in larger towns and cities, i.e. the
centres of power in which elites resided and most business activity took place.13
11 An incomplete school was one in which not all the subjects on the curriculum were taught. 12 It should be remembered that some municipalities comprise a single town or village, while others are made up of various population centres. This is one of the peculiarities of the Spanish case. Thus municipalities along the Cantabrian coastline (Galicia, Asturias, Cantabria) are composed of various “pueblos”, while in other regions there tends to be greater equivalence between towns and municipalities. 13 It should also be taken into account that the population structure in urban centres, due to the selective migration of adult men, could bias this result.
10
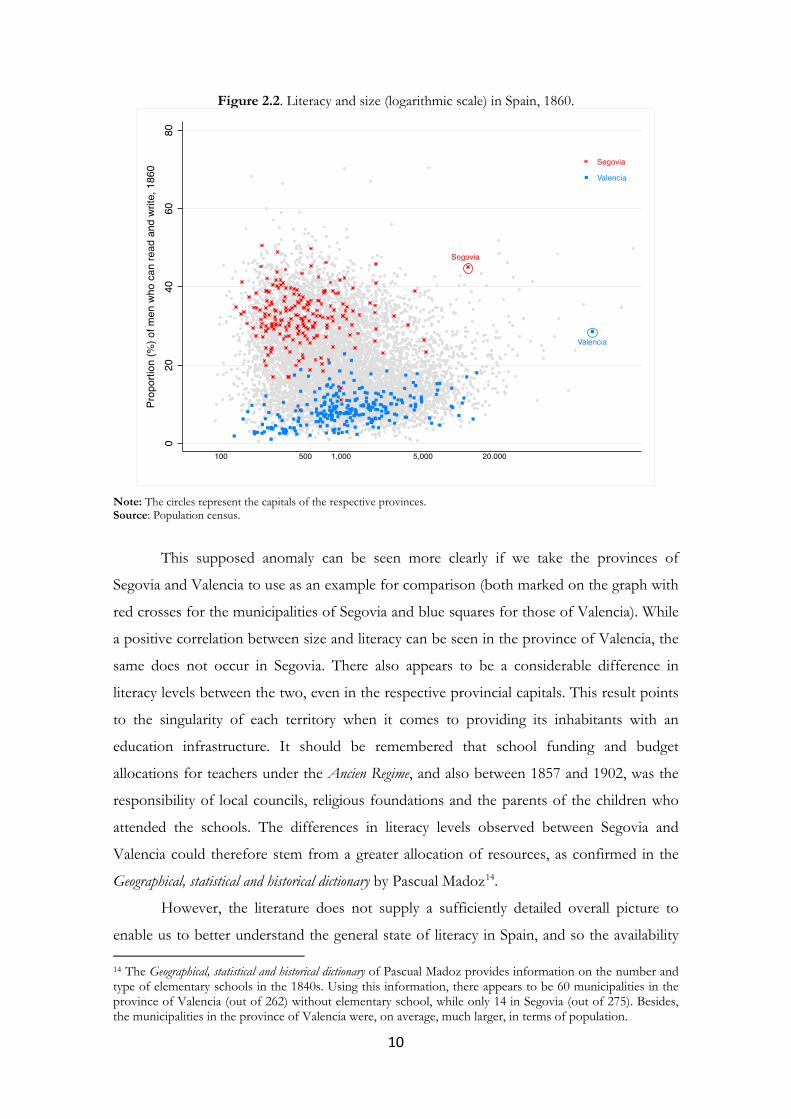
Figure 2.2. Literacy and size (logarithmic scale) in Spain, 1860.
Note: The circles represent the capitals of the respective provinces. Source: Population census.
This supposed anomaly can be seen more clearly if we take the provinces of
Segovia and Valencia to use as an example for comparison (both marked on the graph with
red crosses for the municipalities of Segovia and blue squares for those of Valencia). While
a positive correlation between size and literacy can be seen in the province of Valencia, the
same does not occur in Segovia. There also appears to be a considerable difference in
literacy levels between the two, even in the respective provincial capitals. This result points
to the singularity of each territory when it comes to providing its inhabitants with an
education infrastructure. It should be remembered that school funding and budget
allocations for teachers under the Ancien Regime, and also between 1857 and 1902, was the
responsibility of local councils, religious foundations and the parents of the children who
attended the schools. The differences in literacy levels observed between Segovia and
Valencia could therefore stem from a greater allocation of resources, as confirmed in the
Geographical, statistical and historical dictionary by Pascual Madoz14.
However, the literature does not supply a sufficiently detailed overall picture to
enable us to better understand the general state of literacy in Spain, and so the availability 14 The Geographical, statistical and historical dictionary of Pascual Madoz provides information on the number and type of elementary schools in the 1840s. Using this information, there appears to be 60 municipalities in the province of Valencia (out of 262) without elementary school, while only 14 in Segovia (out of 275). Besides, the municipalities in the province of Valencia were, on average, much larger, in terms of population.
11
of municipal data opens up the possibility of exploring new lines of research. In this regard
there are various aspects to be considered. On the one hand, the case of Spain refreshes the
debate on literacy and societal development, since it was not always the areas with the
highest literacy rates those would later be more economically dynamic during the early
stages of economic development (Nadal, 1996). On the other hand, the reasons behind
territorial differences merit a more detailed analysis. For example, the municipalities’
proximity to the centres of power and terrestrial and/or maritime transport networks could
explain these disparities. Given that information flows along highways, greater interaction
with external agents and their own commercial activity could have encouraged people to
learn. Likewise, proximity to provincial capitals and administrative centres could have had
an impact on literacy levels.
Geography and climate can also affect the demand for education. For example, the
opportunity cost faced by families when sending their children to school can be determined
by type of crop and type of land ownership (Beltrán Tapia and Martinez-Galarraga, 2018).
In this case, in a continental climate with long, cold winters, attending school might actually
be less costly. Similarly, inequality in access to common assets along with local customs and
social stigmas (such as literacy being seen in a negative light) are important elements to take
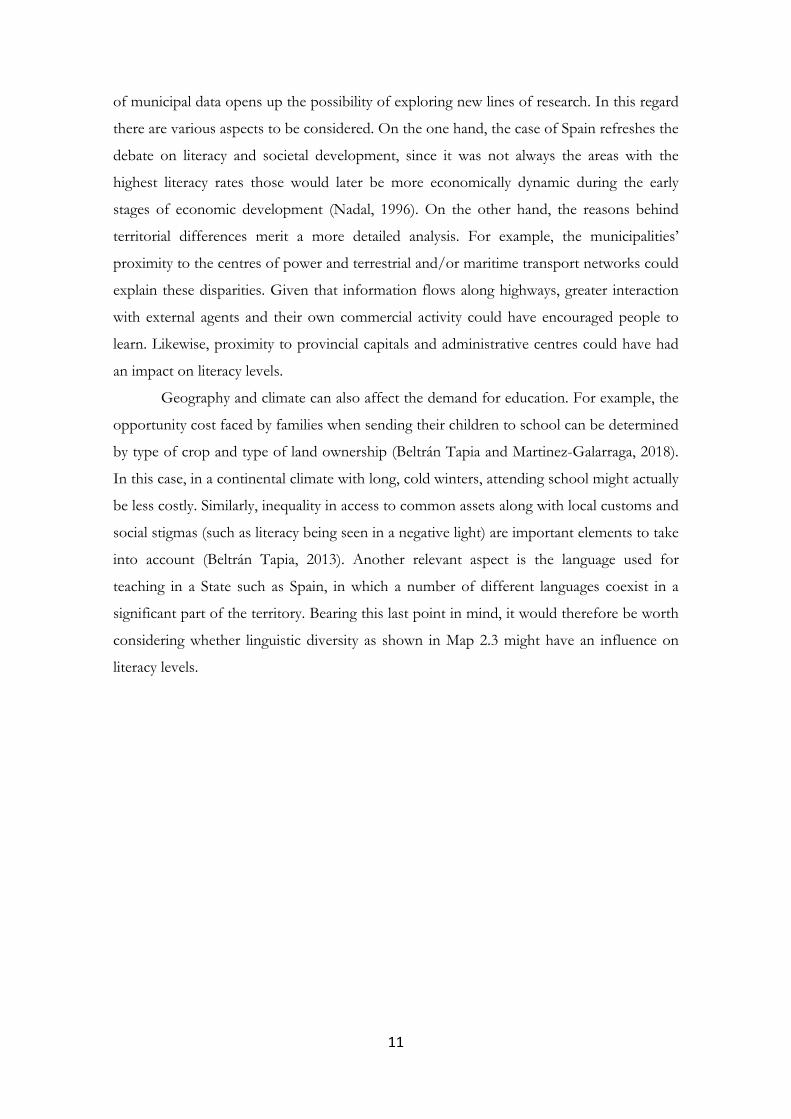
into account (Beltrán Tapia, 2013). Another relevant aspect is the language used for
teaching in a State such as Spain, in which a number of different languages coexist in a
significant part of the territory. Bearing this last point in mind, it would therefore be worth
considering whether linguistic diversity as shown in Map 2.3 might have an influence on
literacy levels.
12
Map 2.3. Linguistic diversity in Spain.
Note: To these different languages should be added Asturleonese, which is spoken in areas of the Cantabrian coastline, and Aragonese, spoken in the northernmost areas of Aragon (along with Benasquese, a mixture of the Aragonese, Gascon and Catalan languages). Although these languages are spoken by few people today, they had a much greater presence even in relatively recent times. Source: Own.
Lastly, different settlement patterns could have affected education levels and should
also be considered. The course of history has given rise to a territorial structure with
marked differences between Southern Spain characterized by fewer municipalities but of
greater size and Northern Spain which has a great many small municipalities dispersed over
the territory. In this regard, it should be pointed out again that on the northernmost edge
of the peninsula it is more common to find municipalities with various population centres.
Finally, and following Calatayud et al. (2009, p.125), it would also be a good idea to explore
an “untested” working hypothesis concerning the impact that the confiscation of Church
property had on primary education.15
2.3. From the Public Instruction Act of 1857 to the Second Republic.
The Public Instruction Act (PIA) of 1857 (or Moyano Act) was one of the great reforms
introduced in Spain in the nineteenth century. Education was split into primary education
15 The impact on education of the Madoz confiscation (1855), i.e. the sale of property including that belonging to the municipalities, has been studied by Beltrán Tapia (2013).
13
and higher education (Art. 1), with a curriculum being established for both.16 At the same
time, primary education would become “compulsory for all Spaniards” (Art. 7) between the
ages of 6 and 9, and free for those whose parents or guardians could not afford it (Art. 9).17
Thus the Moyano Act aimed to give structure and organization to every level of education.
Nevertheless, public schools, i.e. those that were “fully or partly maintained by public funds or by
religious or other similar foundations” (Art. 97), continued to be the responsibility of local
councils and religious organizations.18 Therefore teachers in primary education were not
civil servants belonging to central government. Indeed, Art. 185 established that positions
involving financial allocations that did not exceed 3,000/2,000 reales (i.e. teachers) required
no civil service entrance exam.19
A further effort to foster education was the creation of the Ministry of Public
Instruction and Fine Arts in 190020, which one of its first policies was to include the cost of
primary education in the national budget from 1902. The push to improve the situation
resulted in the extension of compulsory education to age 12 and the creation of the
Department of Primary Education in 1911. The Royal Order of 8 March 1910 guaranteed
the right of women to enrol freely in any official education centre. These changes, along
with others, were aimed at overcoming the serious deficiencies in the education
infrastructure and boosting student numbers and literacy. Two main stages can therefore
be identified in the period 1860-1930: first, the period covering from the passing of the
Public Instruction Act in 1857 plus the census of 1860 to the census of 1900, and second,
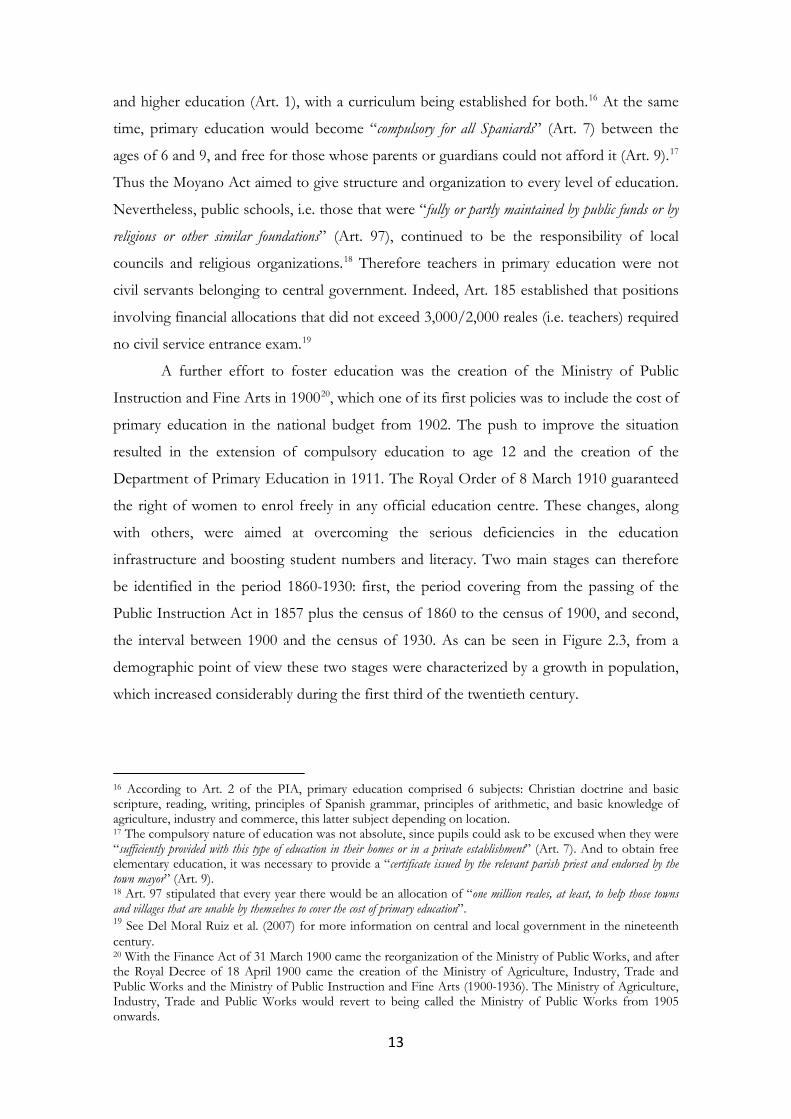
the interval between 1900 and the census of 1930. As can be seen in Figure 2.3, from a
demographic point of view these two stages were characterized by a growth in population,
which increased considerably during the first third of the twentieth century.
16 According to Art. 2 of the PIA, primary education comprised 6 subjects: Christian doctrine and basic scripture, reading, writing, principles of Spanish grammar, principles of arithmetic, and basic knowledge of agriculture, industry and commerce, this latter subject depending on location. 17 The compulsory nature of education was not absolute, since pupils could ask to be excused when they were “sufficiently provided with this type of education in their homes or in a private establishment” (Art. 7). And to obtain free elementary education, it was necessary to provide a “certificate issued by the relevant parish priest and endorsed by the town mayor” (Art. 9). 18 Art. 97 stipulated that every year there would be an allocation of “one million reales, at least, to help those towns and villages that are unable by themselves to cover the cost of primary education”. 19 See Del Moral Ruiz et al. (2007) for more information on central and local government in the nineteenth century. 20 With the Finance Act of 31 March 1900 came the reorganization of the Ministry of Public Works, and after the Royal Decree of 18 April 1900 came the creation of the Ministry of Agriculture, Industry, Trade and Public Works and the Ministry of Public Instruction and Fine Arts (1900-1936). The Ministry of Agriculture, Industry, Trade and Public Works would revert to being called the Ministry of Public Works from 1905 onwards.
14
Figure 2.3. Population of Spain (% annual increase), 1850-1936.
Note: Smoothed average of the annual rates (%) of population growth. Source: Prados de la Escosura (2016, Table 3); Population censuses.
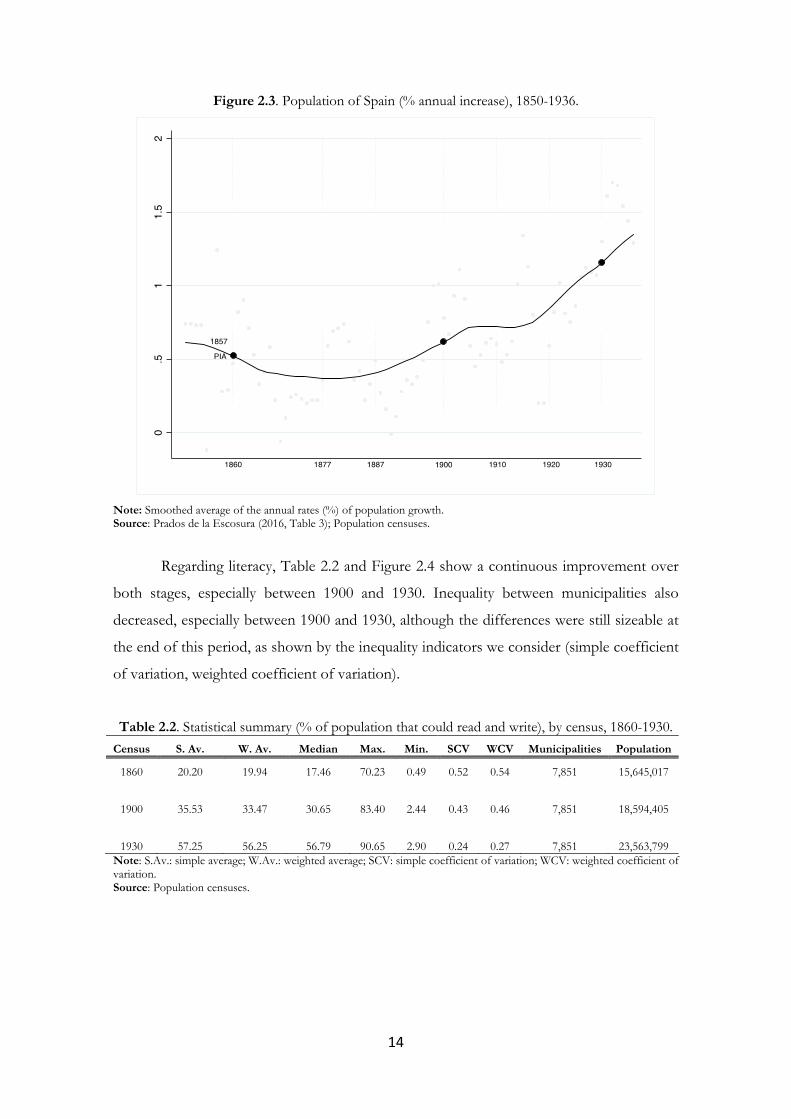
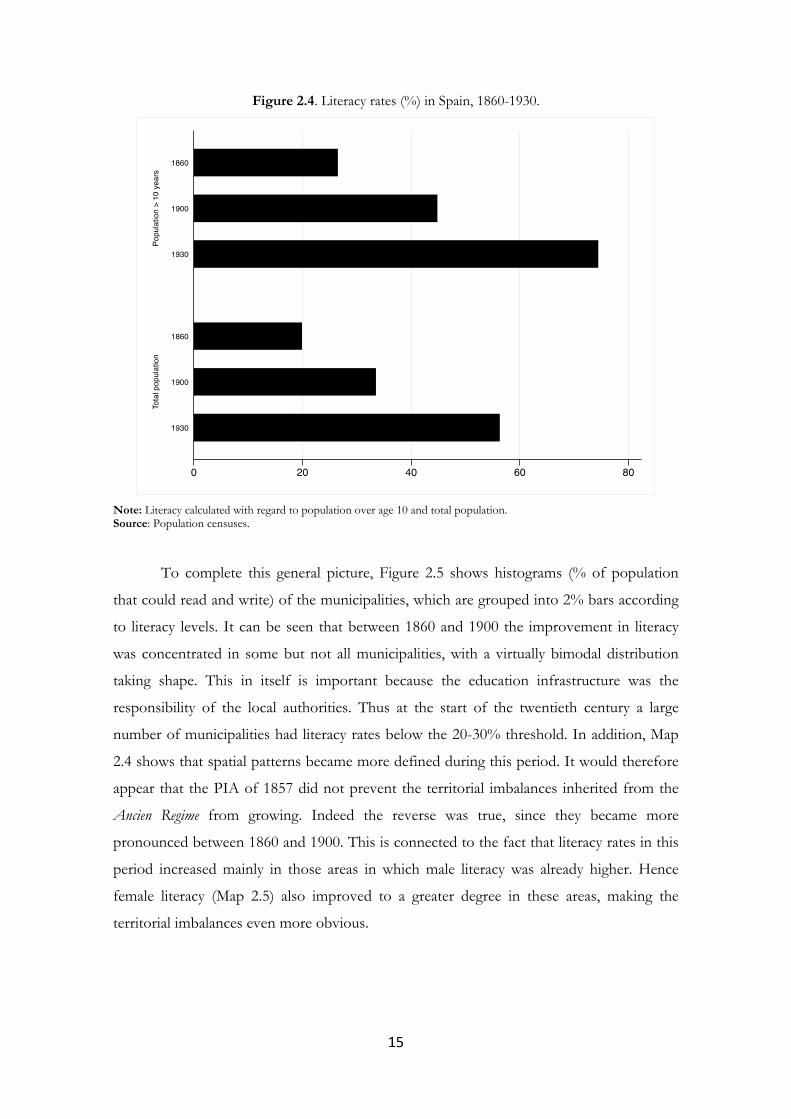
Regarding literacy, Table 2.2 and Figure 2.4 show a continuous improvement over
both stages, especially between 1900 and 1930. Inequality between municipalities also
decreased, especially between 1900 and 1930, although the differences were still sizeable at
the end of this period, as shown by the inequality indicators we consider (simple coefficient
of variation, weighted coefficient of variation).
Table 2.2. Statistical summary (% of population that could read and write), by census, 1860-1930. Census S. Av. W. Av. Median Max. Min. SCV WCV Municipalities Population
1860 20.20 19.94 17.46 70.23 0.49 0.52 0.54 7,851 15,645,017
1900 35.53 33.47 30.65 83.40 2.44 0.43 0.46 7,851 18,594,405
1930 57.25 56.25 56.79 90.65 2.90 0.24 0.27 7,851 23,563,799 Note: S.Av.: simple average; W.Av.: weighted average; SCV: simple coefficient of variation; WCV: weighted coefficient of variation. Source: Population censuses.
15
Figure 2.4. Literacy rates (%) in Spain, 1860-1930.
Note: Literacy calculated with regard to population over age 10 and total population. Source: Population censuses.
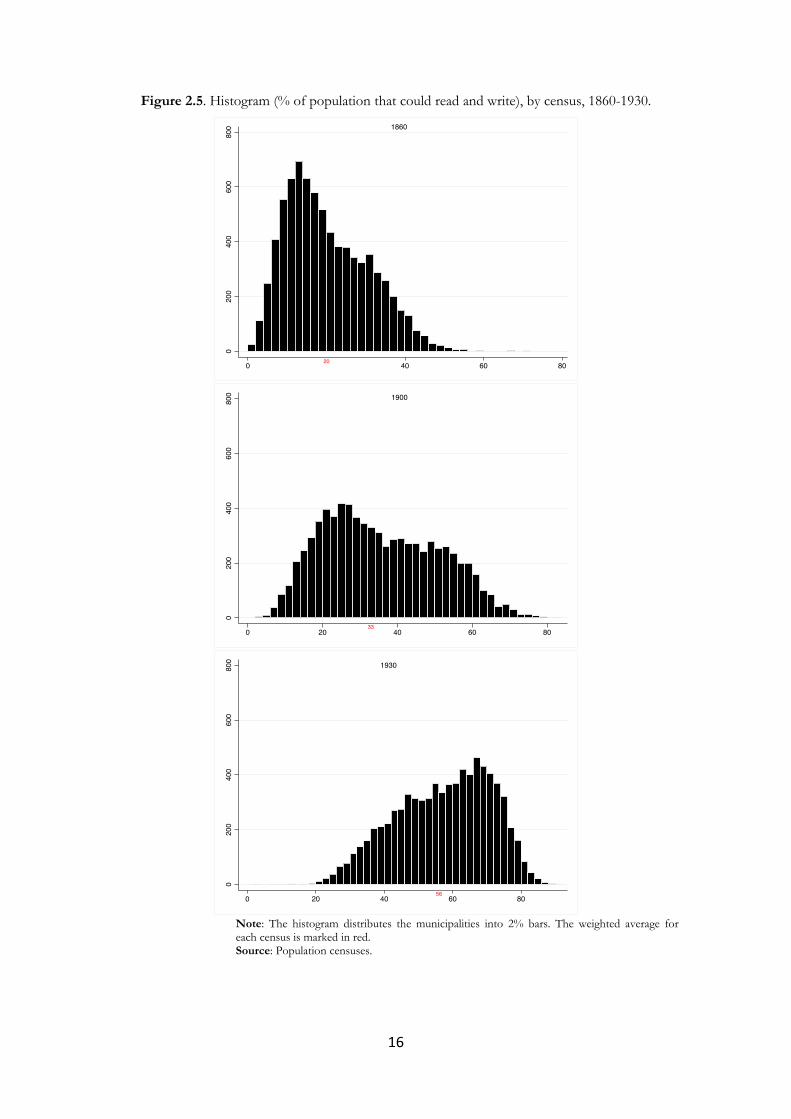
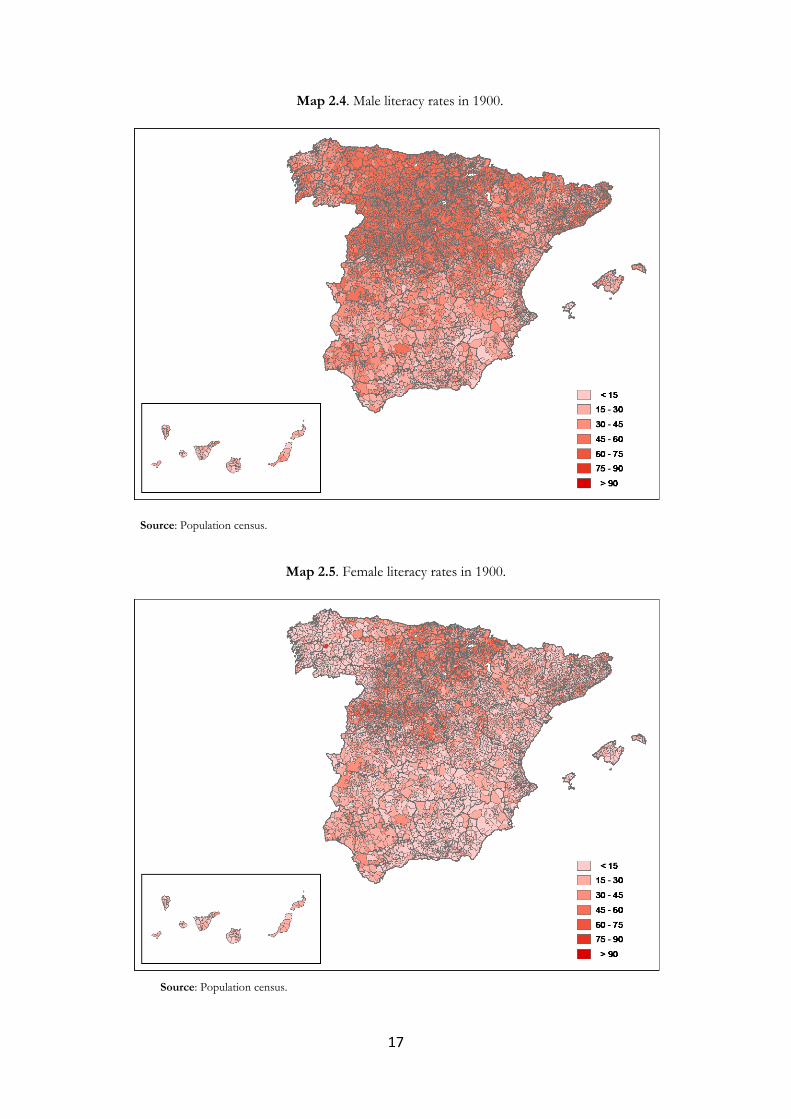
To complete this general picture, Figure 2.5 shows histograms (% of population
that could read and write) of the municipalities, which are grouped into 2% bars according
to literacy levels. It can be seen that between 1860 and 1900 the improvement in literacy
was concentrated in some but not all municipalities, with a virtually bimodal distribution
taking shape. This in itself is important because the education infrastructure was the
responsibility of the local authorities. Thus at the start of the twentieth century a large
number of municipalities had literacy rates below the 20-30% threshold. In addition, Map
2.4 shows that spatial patterns became more defined during this period. It would therefore
appear that the PIA of 1857 did not prevent the territorial imbalances inherited from the
Ancien Regime from growing. Indeed the reverse was true, since they became more
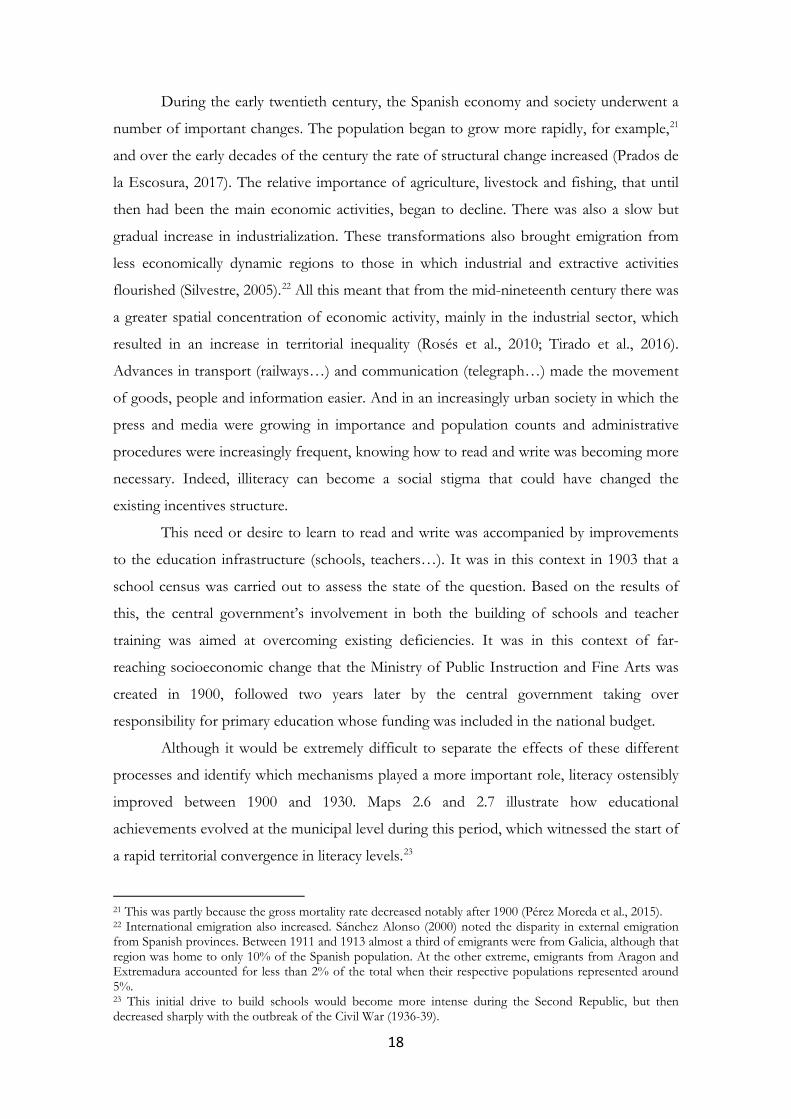
pronounced between 1860 and 1900. This is connected to the fact that literacy rates in this
period increased mainly in those areas in which male literacy was already higher. Hence
female literacy (Map 2.5) also improved to a greater degree in these areas, making the
territorial imbalances even more obvious.
16
Figure 2.5. Histogram (% of population that could read and write), by census, 1860-1930.
Note: The histogram distributes the municipalities into 2% bars. The weighted average for each census is marked in red. Source: Population censuses.
17
Map 2.4. Male literacy rates in 1900.
Source: Population census.
Map 2.5. Female literacy rates in 1900.
Source: Population census.
18
During the early twentieth century, the Spanish economy and society underwent a
number of important changes. The population began to grow more rapidly, for example,21
and over the early decades of the century the rate of structural change increased (Prados de
la Escosura, 2017). The relative importance of agriculture, livestock and fishing, that until
then had been the main economic activities, began to decline. There was also a slow but
gradual increase in industrialization. These transformations also brought emigration from
less economically dynamic regions to those in which industrial and extractive activities
flourished (Silvestre, 2005).22 All this meant that from the mid-nineteenth century there was
a greater spatial concentration of economic activity, mainly in the industrial sector, which
resulted in an increase in territorial inequality (Rosés et al., 2010; Tirado et al., 2016).
Advances in transport (railways…) and communication (telegraph…) made the movement
of goods, people and information easier. And in an increasingly urban society in which the
press and media were growing in importance and population counts and administrative
procedures were increasingly frequent, knowing how to read and write was becoming more
necessary. Indeed, illiteracy can become a social stigma that could have changed the
existing incentives structure.
This need or desire to learn to read and write was accompanied by improvements
to the education infrastructure (schools, teachers…). It was in this context in 1903 that a
school census was carried out to assess the state of the question. Based on the results of
this, the central government’s involvement in both the building of schools and teacher
training was aimed at overcoming existing deficiencies. It was in this context of far-
reaching socioeconomic change that the Ministry of Public Instruction and Fine Arts was
created in 1900, followed two years later by the central government taking over
responsibility for primary education whose funding was included in the national budget.
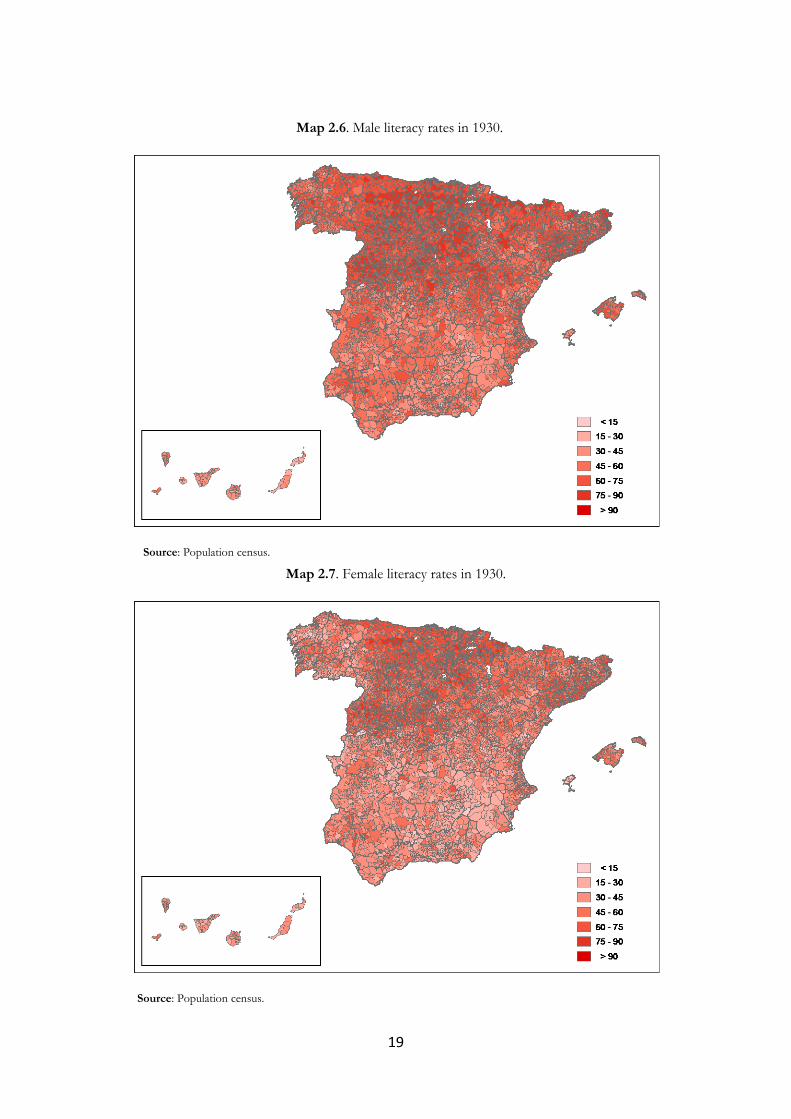
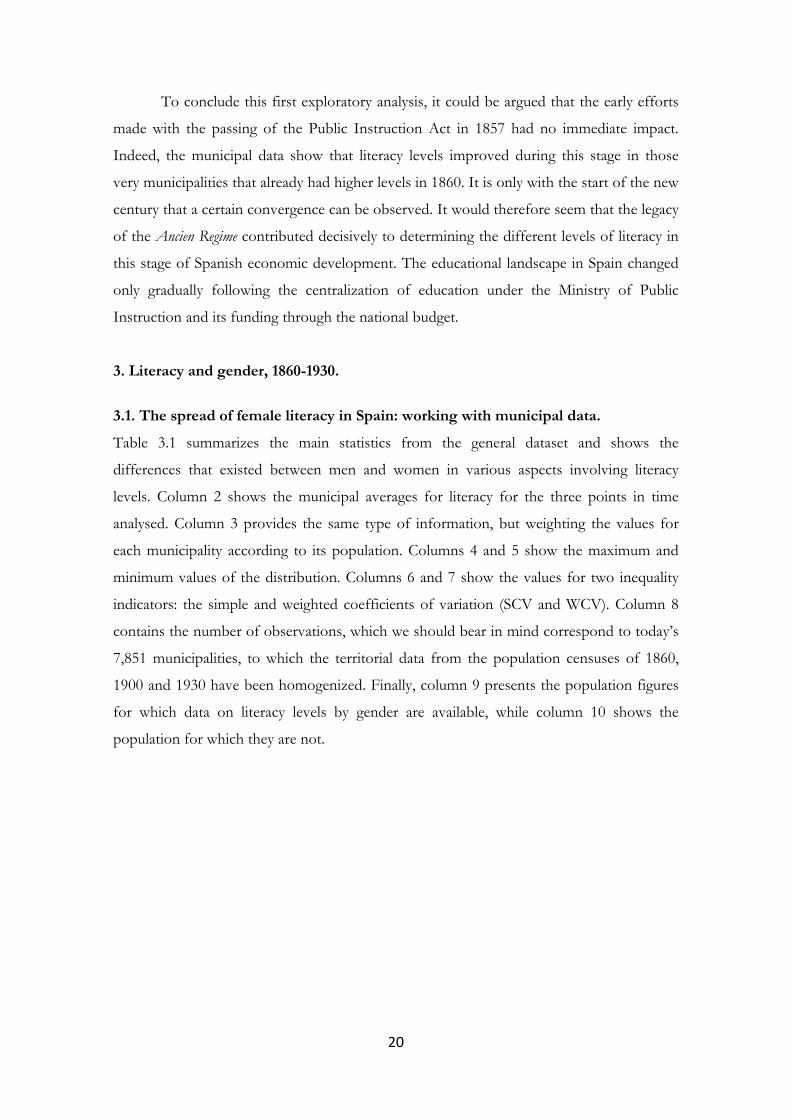
Although it would be extremely difficult to separate the effects of these different
processes and identify which mechanisms played a more important role, literacy ostensibly
improved between 1900 and 1930. Maps 2.6 and 2.7 illustrate how educational
achievements evolved at the municipal level during this period, which witnessed the start of
a rapid territorial convergence in literacy levels.23
21 This was partly because the gross mortality rate decreased notably after 1900 (Pérez Moreda et al., 2015). 22 International emigration also increased. Sánchez Alonso (2000) noted the disparity in external emigration from Spanish provinces. Between 1911 and 1913 almost a third of emigrants were from Galicia, although that region was home to only 10% of the Spanish population. At the other extreme, emigrants from Aragon and Extremadura accounted for less than 2% of the total when their respective populations represented around 5%. 23 This initial drive to build schools would become more intense during the Second Republic, but then decreased sharply with the outbreak of the Civil War (1936-39).
19
Map 2.6. Male literacy rates in 1930.
Source: Population census.
Map 2.7. Female literacy rates in 1930.
Source: Population census.
20
To conclude this first exploratory analysis, it could be argued that the early efforts
made with the passing of the Public Instruction Act in 1857 had no immediate impact.
Indeed, the municipal data show that literacy levels improved during this stage in those
very municipalities that already had higher levels in 1860. It is only with the start of the new
century that a certain convergence can be observed. It would therefore seem that the legacy
of the Ancien Regime contributed decisively to determining the different levels of literacy in
this stage of Spanish economic development. The educational landscape in Spain changed
only gradually following the centralization of education under the Ministry of Public
Instruction and its funding through the national budget.
3. Literacy and gender, 1860-1930.
3.1. The spread of female literacy in Spain: working with municipal data.
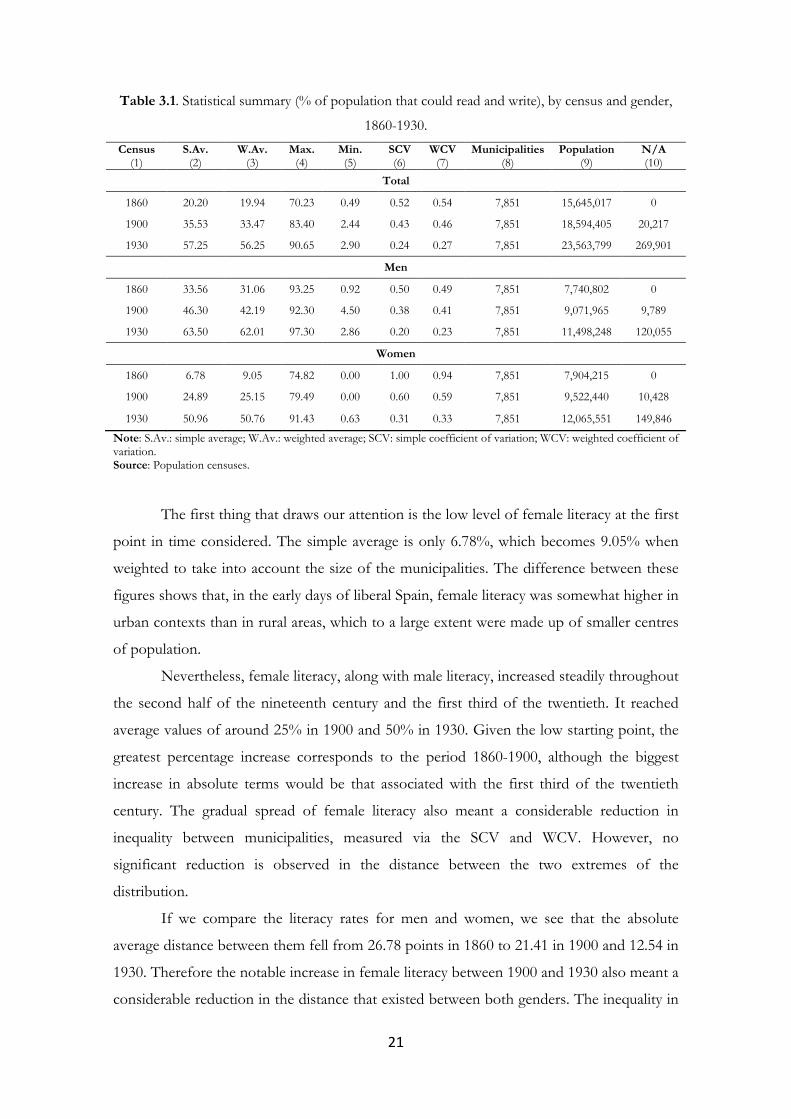
Table 3.1 summarizes the main statistics from the general dataset and shows the
differences that existed between men and women in various aspects involving literacy
levels. Column 2 shows the municipal averages for literacy for the three points in time
analysed. Column 3 provides the same type of information, but weighting the values for
each municipality according to its population. Columns 4 and 5 show the maximum and
minimum values of the distribution. Columns 6 and 7 show the values for two inequality
indicators: the simple and weighted coefficients of variation (SCV and WCV). Column 8
contains the number of observations, which we should bear in mind correspond to today’s
7,851 municipalities, to which the territorial data from the population censuses of 1860,
1900 and 1930 have been homogenized. Finally, column 9 presents the population figures
for which data on literacy levels by gender are available, while column 10 shows the
population for which they are not.
21
Table 3.1. Statistical summary (% of population that could read and write), by census and gender,
1860-1930.
Census (1)
S.Av. (2)
W.Av. (3)
Max. (4)
Min. (5)
SCV (6)
WCV (7)
Municipalities (8)
Population (9)
N/A (10)
Total
1860 20.20 19.94 70.23 0.49 0.52 0.54 7,851 15,645,017 0
1900 35.53 33.47 83.40 2.44 0.43 0.46 7,851 18,594,405 20,217
1930 57.25 56.25 90.65 2.90 0.24 0.27 7,851 23,563,799 269,901
Men
1860 33.56 31.06 93.25 0.92 0.50 0.49 7,851 7,740,802 0
1900 46.30 42.19 92.30 4.50 0.38 0.41 7,851 9,071,965 9,789
1930 63.50 62.01 97.30 2.86 0.20 0.23 7,851 11,498,248 120,055
Women
1860 6.78 9.05 74.82 0.00 1.00 0.94 7,851 7,904,215 0
1900 24.89 25.15 79.49 0.00 0.60 0.59 7,851 9,522,440 10,428
1930 50.96 50.76 91.43 0.63 0.31 0.33 7,851 12,065,551 149,846
Note: S.Av.: simple average; W.Av.: weighted average; SCV: simple coefficient of variation; WCV: weighted coefficient of variation. Source: Population censuses.
The first thing that draws our attention is the low level of female literacy at the first
point in time considered. The simple average is only 6.78%, which becomes 9.05% when
weighted to take into account the size of the municipalities. The difference between these
figures shows that, in the early days of liberal Spain, female literacy was somewhat higher in
urban contexts than in rural areas, which to a large extent were made up of smaller centres
of population.
Nevertheless, female literacy, along with male literacy, increased steadily throughout
the second half of the nineteenth century and the first third of the twentieth. It reached
average values of around 25% in 1900 and 50% in 1930. Given the low starting point, the
greatest percentage increase corresponds to the period 1860-1900, although the biggest
increase in absolute terms would be that associated with the first third of the twentieth
century. The gradual spread of female literacy also meant a considerable reduction in
inequality between municipalities, measured via the SCV and WCV. However, no
significant reduction is observed in the distance between the two extremes of the
distribution.
If we compare the literacy rates for men and women, we see that the absolute
average distance between them fell from 26.78 points in 1860 to 21.41 in 1900 and 12.54 in
1930. Therefore the notable increase in female literacy between 1900 and 1930 also meant a
considerable reduction in the distance that existed between both genders. The inequality in
22
female literacy between municipalities also decreased at a higher rate than for men.
Nevertheless, given the enormous difference existing in 1860, it is not surprising that
greater inequality between municipalities as regards women was still noticeable in 1930.
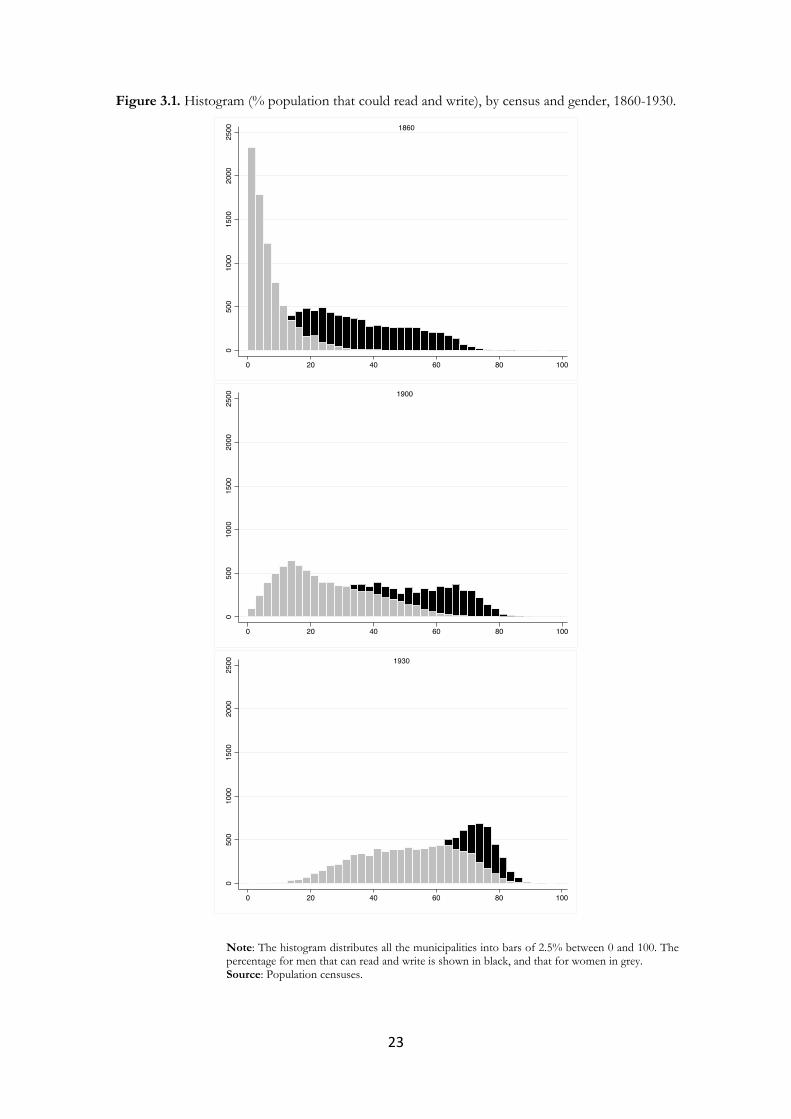
The information contained in Figure 3.1 brings to the fore another distinguishing
element in the distribution of male and female literacy levels in Spain. The figure shows a
histogram of the municipalities arranged by levels of female (male) literacy at the dates of
the three censuses. It can be seen that in 1860 the distribution has a marked bias towards a
concentration of municipalities with female literacy levels far below the average for the
distribution as a whole, in contrast to the picture drawn using the municipal data on male
literacy.
The histograms for the censuses of 1900 and 1930 show how the distribution of
female literacy by municipalities changed over time. In 1900 there is a significant decrease
in the mass of municipalities situated in the left-hand tail, while in 1930 the histogram
shows a distribution that might almost be considered normal (with even a slight bias
towards the right-hand tail). The image at this date is also very similar to that for male
literacy, even if the average literacy levels for men are higher and apparently concentrated
in a larger mass of municipalities in the right-hand tail of the distribution.
In short, female literacy underwent a radical change over the period 1860-1930.
Average levels rose to over 50%, a figure that would be higher if only the population over
age 10 were taken into account. As a result, the distance between the literacy levels of men
and women decreased by over 14 points. Thus female literacy in Spain moved from a
situation in which very low levels was normal in the vast majority of municipalities – offset
only by high levels in a small number of them – to a situation in which, although there were
still marked differences between municipalities, the average value had risen to a level
characteristic of a distribution with a mass of observations of similar magnitude on both
sides.
23
Figure 3.1. Histogram (% population that could read and write), by census and gender, 1860-1930.
Note: The histogram distributes all the municipalities into bars of 2.5% between 0 and 100. The percentage for men that can read and write is shown in black, and that for women in grey. Source: Population censuses.
24
Another interesting dimension is the geographical distribution of literacy by
municipality and gender. Maps 2.1 and 2.2, 2.4 and 2.5, and 2.6 and 2.7 show the
percentage of the population that could read and write in 1860, 1900 and 1930 respectively,
distinguishing between men and women. The first impression we get from looking at the
maps for 1860 (2.1 and 2.2) is that female literacy in virtually the whole of Spain was all but
non-existent. The predominance of light colours, which are associated with literacy levels
of below 15%, is proof of the dearth of female literacy inherited from the Ancien Regime.
Another noteworthy feature emerges when we compare female and male literacy. As far as
men are concerned, the highest levels of literacy are to be found in a large group of
municipalities concentrated in the centre-north of the peninsula. In the women’s case,
however, there is no such clear geographical pattern. The highest values, for example, seem
to be randomly distributed across the country´s entire geography. At first glance, the
presence of relatively high levels can only be identified in certain provincial capitals, such as
Madrid.
The maps for 1900 (2.4 and 2.5) testify to the advances made in female literacy. The
shades representing levels of over 30% now spread across large areas of the country. This
applies especially in territories such as Castile-Leon, Madrid, Cantabria, La Rioja, Navarre
and some areas of the Basque Country, in which male literacy was already relatively high in
1860. This type of evidence would indicate that female literacy was following the pattern
laid down by male literacy, although with a considerable time lag. The territories in which
the incentives for families and municipalities were greatest when it came to supporting
education under the Ancien Regime were the same territories that committed themselves to
the education of women forty years later. In other words, the passing and implementation
of the Public Instruction Act of 1857 had no significant effect on the geography of
women’s literacy.
Finally, the maps for 1930 (2.6 and 2.7) show how female literacy spread
considerably across the territory. As with male literacy, its advance over the period 1900-
1930 was not restricted to those regions with the highest literacy rates under the Ancien
Regime, but extended to new areas. Female literacy received a strong boost in Catalonia, the
Basque Country, Asturias, the coastal areas of the Valencian Community and the Ebro
Valley. As a result, not only did the average levels of female education increase during these
years, but inequality between territories also decreased, especially among those located in
the northernmost part of the peninsula. However, a wide gap opened up between these
regions and those further south in which average levels continued to be relatively low
25
despite notable progress having been made. This would be the case of Andalusia,
Extremadura, Castile-La Mancha, Murcia and the interior and south of the Valencian
Community.
3.3. Inequality in literacy between men and women in Spain: the gender gap.
The existence of marked differences between men’s and women’s levels of education limits
a society’s potential for development, and this is why international organizations and
development agencies (UNESCO) keep track of these levels and study how they evolve.
These organizations have suggested various ways of measuring inequality in male and
female education, and much time has been dedicated to devising methods of quantifying
the so-called gender gap using different synthetic indicators. Nevertheless, no consensus
seems to have been reached regarding the best way to tackle it. One proposal is that any
method would have to reflect absolute differences between the variables linked to the
education processes of men and women (literacy, enrolment, average schooling rates…).
However, it has also been suggested that this approach biases the results against those
territories in which the gender gap is related not only to the low education level of women
but also to the high education level of men. For example, the presence of a 10-point gender
gap does not generate the same types of problem when the female literacy level is 30% as it
does when it is 75%.
This debate also finds a place in the historiography of European and Spanish
education. Considering one or another type of indicator can lead to diametrically opposite
views as to which territories presented the highest degrees of gender discrimination against
women.24 In order to study these aspects in more detail, in the following paragraphs we will
provide a homogenous overall picture of how gender inequality in literacy evolved in the
early stages of the universalization of primary education in Spain. New evidence in the
shape of municipal data is presented, relating to the differences between men and women’s
education levels. We begin by considering the absolute differences in literacy rates by
gender. We then define an indicator for the relative gender gap and use it to carry out an
analysis of what happened in Spain.
24 For more on this controversial subject see Reher (1997).
26
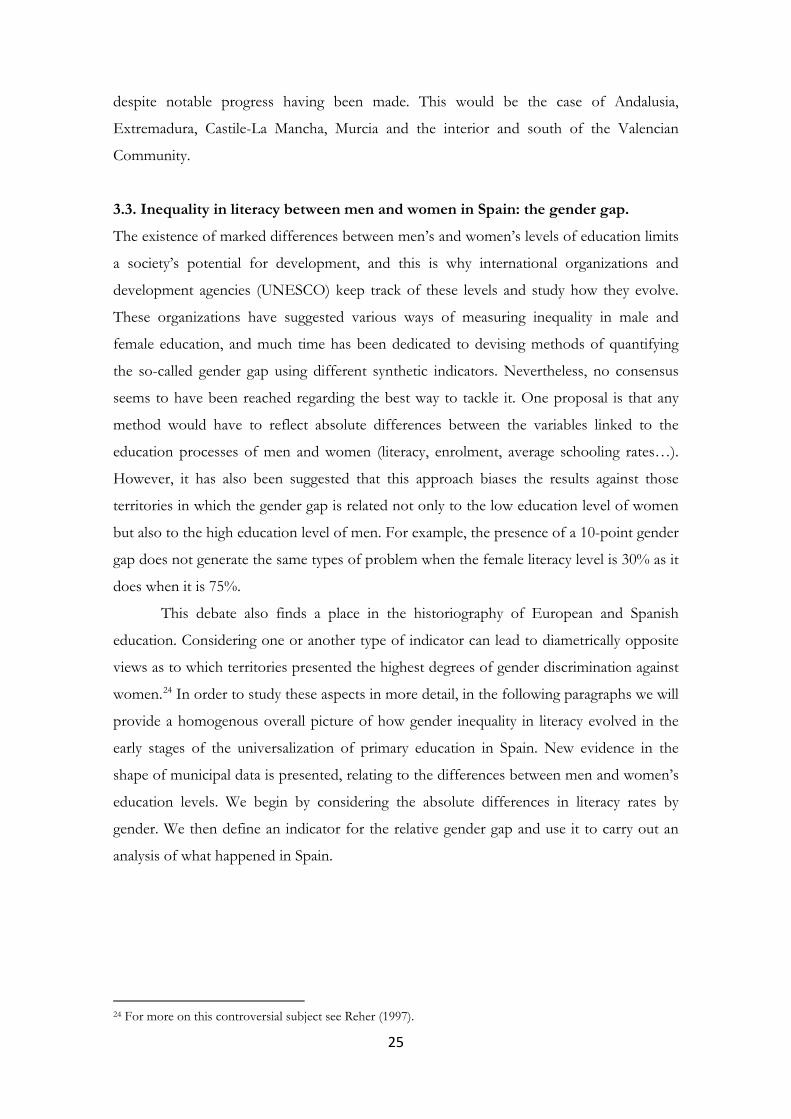
Map 3.1. Absolute differences between male and female literacy rates in 1860 (%).
Source: Population census.
Maps 3.1, 3.2 and 3.3 provide cartographic information about the absolute
differences between literacy rates by gender at the three census dates under study. The map
for 1860 shows that the areas with the greatest differences between male and female
literacy include much of Castile-Leon and Cantabria along with various parts of Asturias
and the more mountainous regions of Navarre and Aragon. In this case, therefore, it is
territories with high average rates of literacy that have the greatest gender differences. No
notable presence of differences associated with gender is identified in territories with lower
average levels, such as Extremadura, Andalusia, much of Castile-La Mancha, Murcia and
the Valencian Community. In other words, the Spanish case follows a pattern in which the
biggest gender differences appear when levels of male literacy are intermediate or even high
to begin with. This is where the most marked absolute differences are to be found, whereas
this does not happen in territories where average literacy levels are extremely low.
27
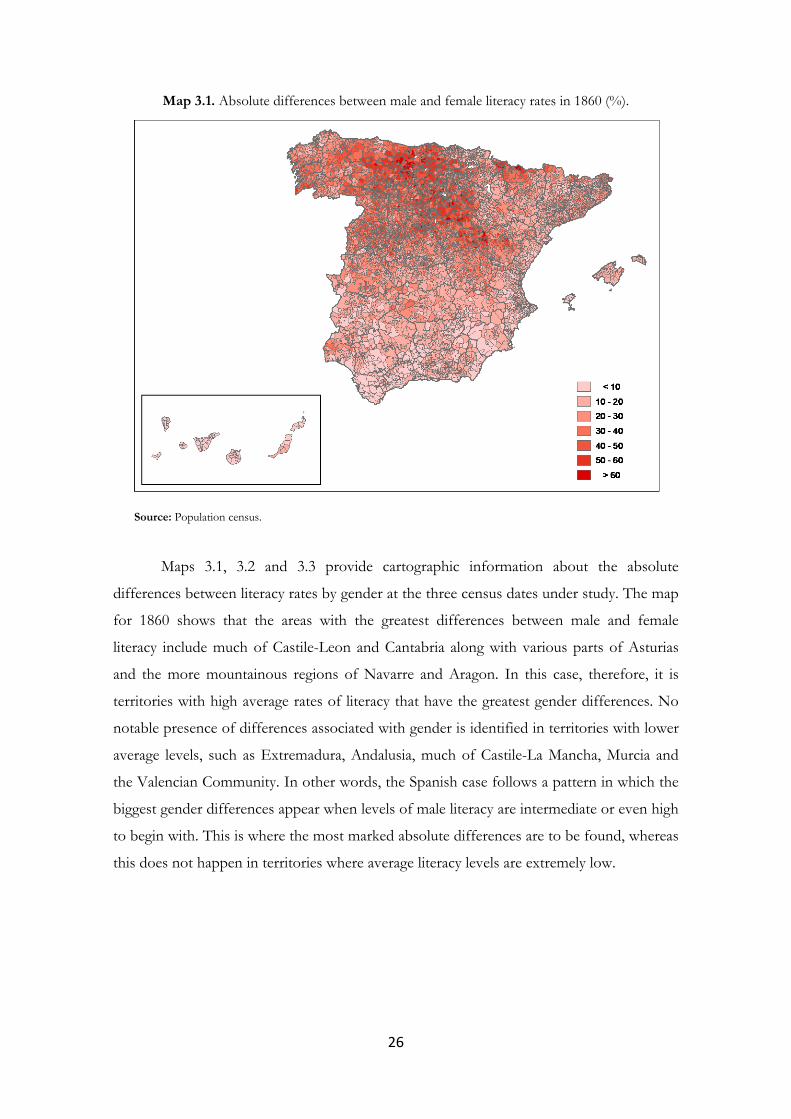
Map 3.2. Absolute differences between male and female literacy rates in 1900 (%).
Source: Population census.
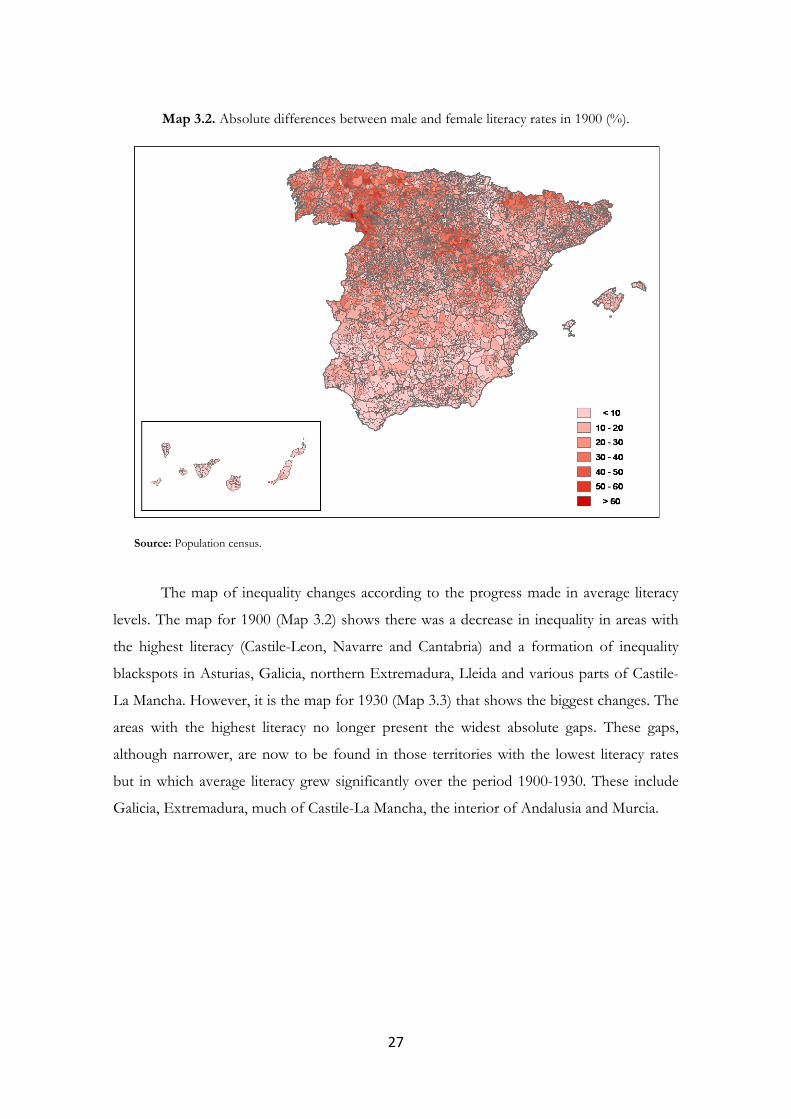
The map of inequality changes according to the progress made in average literacy
levels. The map for 1900 (Map 3.2) shows there was a decrease in inequality in areas with
the highest literacy (Castile-Leon, Navarre and Cantabria) and a formation of inequality
blackspots in Asturias, Galicia, northern Extremadura, Lleida and various parts of Castile-
La Mancha. However, it is the map for 1930 (Map 3.3) that shows the biggest changes. The
areas with the highest literacy no longer present the widest absolute gaps. These gaps,
although narrower, are now to be found in those territories with the lowest literacy rates
but in which average literacy grew significantly over the period 1900-1930. These include
Galicia, Extremadura, much of Castile-La Mancha, the interior of Andalusia and Murcia.
28
Map 3.3. Absolute differences between male and female literacy rates in 1930 (%).
Source: Population census.
The absolute education gap therefore evolved following a pattern whereby it would
be wider, at least up to a certain threshold, in territories with the highest literacy. Hence the
literature on development does not believe that this type of indicator can fully illustrate the
additional problems involved in a society’s progress due to the low literacy level of its
female population. Thus alternative approaches have been suggested for quantifying
relative gender differences.
In line with the proposal made by UNESCO25, we have constructed another gender
gap indicator for the censuses of 1860, 1900 and 1930. The starting point for this is the
male (MLR) and female (FLR) literacy rates, which are then used to construct a gender gap
variable (GG), which is defined as:
GG = �1 − (FLRMLR
)� ∗ 100 (1)
25 Along similar lines, different editions of The Global Gender Gap Report (Hausmann et al., 2009) present various indicators of relative differences between men’s and women’s education.
29
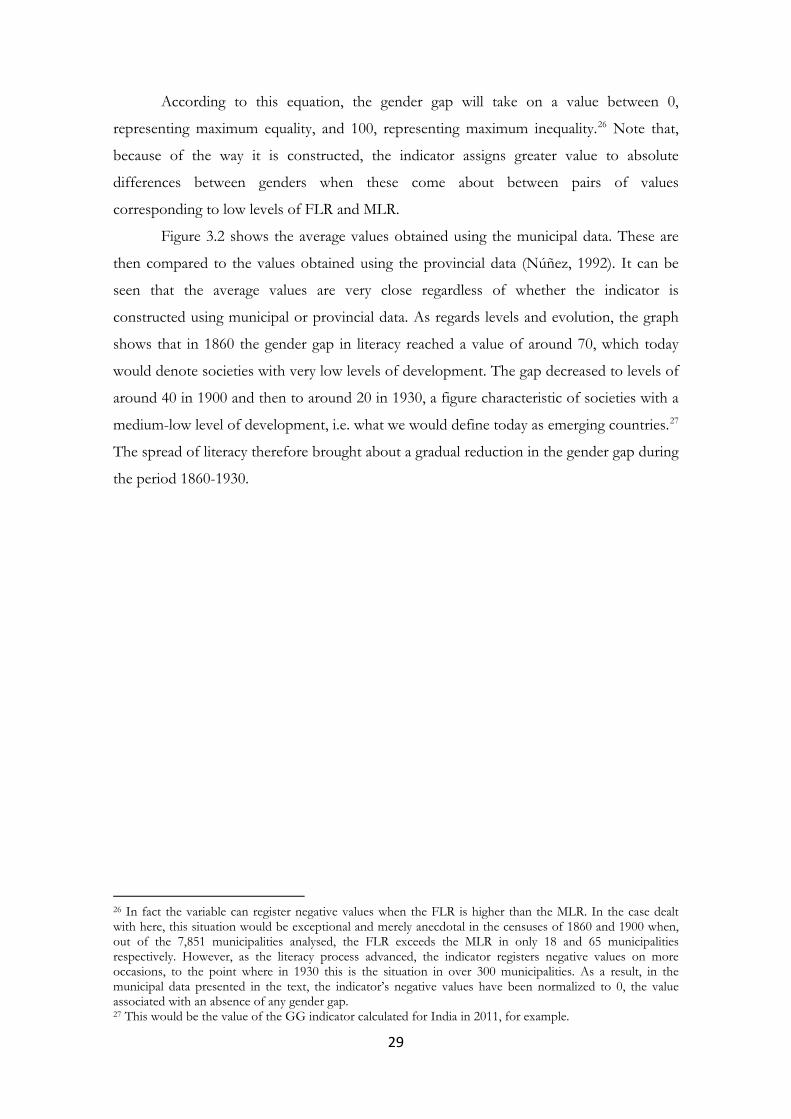
According to this equation, the gender gap will take on a value between 0,
representing maximum equality, and 100, representing maximum inequality.26 Note that,
because of the way it is constructed, the indicator assigns greater value to absolute
differences between genders when these come about between pairs of values
corresponding to low levels of FLR and MLR.
Figure 3.2 shows the average values obtained using the municipal data. These are
then compared to the values obtained using the provincial data (Núñez, 1992). It can be
seen that the average values are very close regardless of whether the indicator is
constructed using municipal or provincial data. As regards levels and evolution, the graph
shows that in 1860 the gender gap in literacy reached a value of around 70, which today
would denote societies with very low levels of development. The gap decreased to levels of
around 40 in 1900 and then to around 20 in 1930, a figure characteristic of societies with a
medium-low level of development, i.e. what we would define today as emerging countries.27
The spread of literacy therefore brought about a gradual reduction in the gender gap during
the period 1860-1930.
26 In fact the variable can register negative values when the FLR is higher than the MLR. In the case dealt with here, this situation would be exceptional and merely anecdotal in the censuses of 1860 and 1900 when, out of the 7,851 municipalities analysed, the FLR exceeds the MLR in only 18 and 65 municipalities respectively. However, as the literacy process advanced, the indicator registers negative values on more occasions, to the point where in 1930 this is the situation in over 300 municipalities. As a result, in the municipal data presented in the text, the indicator’s negative values have been normalized to 0, the value associated with an absence of any gender gap. 27 This would be the value of the GG indicator calculated for India in 2011, for example.
30
Figure 3.2. Gender gap (GG), by census, 1860-1930.
Note: ‘Own data’ refers to the proportion of the population that could read and write out of the total population, whereas Núñez (1992) calculates literacy in terms of population over age 10. See text for more details. Source: Population censuses and own data; Núñez (1992).
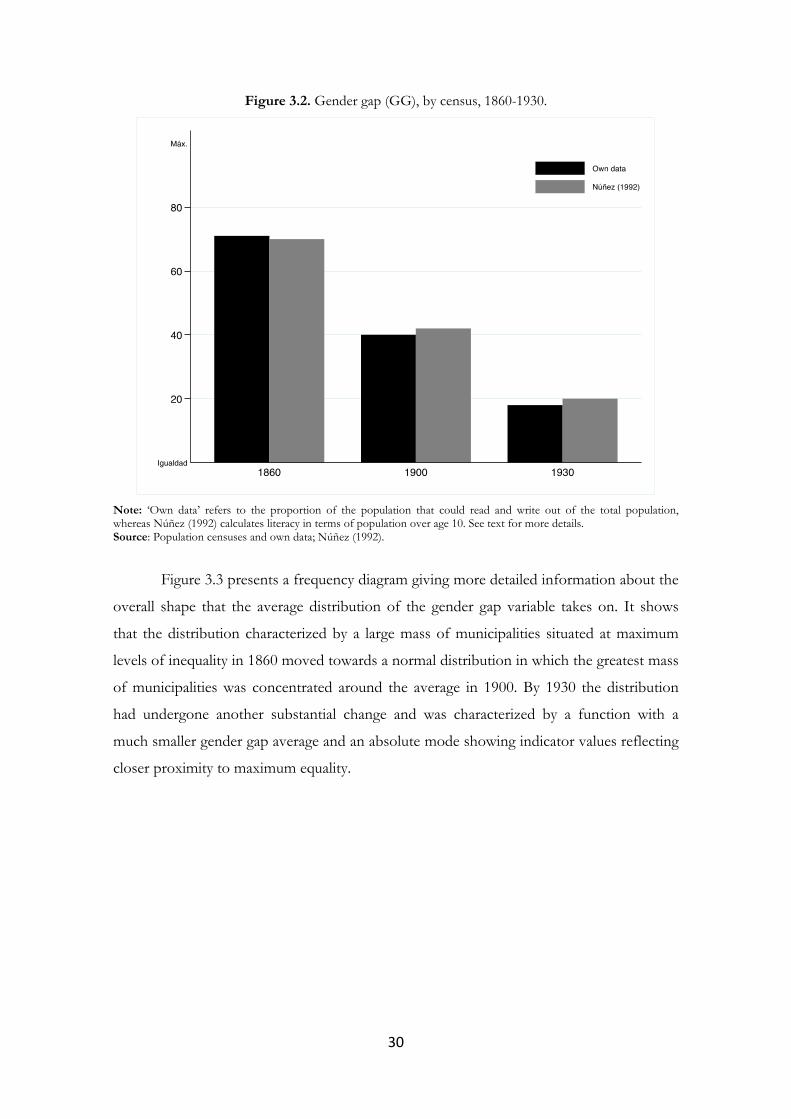
Figure 3.3 presents a frequency diagram giving more detailed information about the
overall shape that the average distribution of the gender gap variable takes on. It shows
that the distribution characterized by a large mass of municipalities situated at maximum
levels of inequality in 1860 moved towards a normal distribution in which the greatest mass
of municipalities was concentrated around the average in 1900. By 1930 the distribution
had undergone another substantial change and was characterized by a function with a
much smaller gender gap average and an absolute mode showing indicator values reflecting
closer proximity to maximum equality.
31
Figure 3.3. Histogram of gender gap, by census, 1860-1930.
Note: The histogram distributes the municipalities into 2% bars from 0 to 100. Data refer to the population censuses of 1860 (black), 1900 (dark grey) and 1930 (light grey). Source: Population censuses.
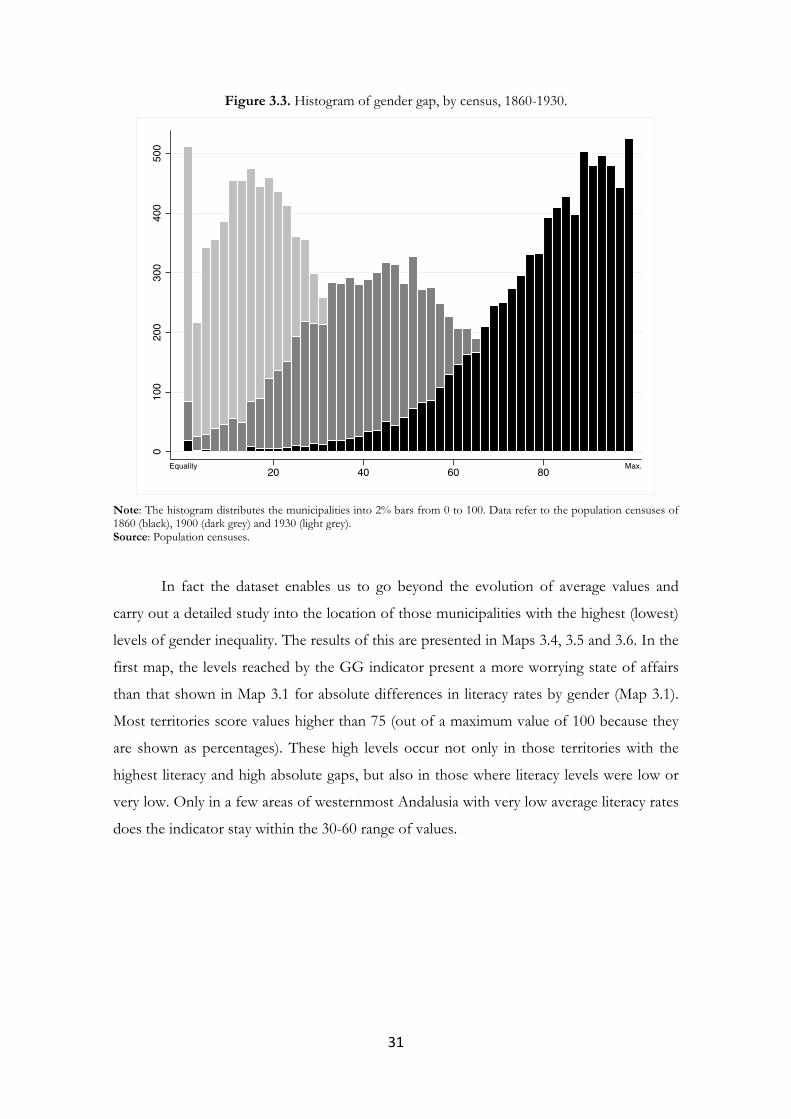
In fact the dataset enables us to go beyond the evolution of average values and
carry out a detailed study into the location of those municipalities with the highest (lowest)
levels of gender inequality. The results of this are presented in Maps 3.4, 3.5 and 3.6. In the
first map, the levels reached by the GG indicator present a more worrying state of affairs
than that shown in Map 3.1 for absolute differences in literacy rates by gender (Map 3.1).
Most territories score values higher than 75 (out of a maximum value of 100 because they
are shown as percentages). These high levels occur not only in those territories with the
highest literacy and high absolute gaps, but also in those where literacy levels were low or
very low. Only in a few areas of westernmost Andalusia with very low average literacy rates
does the indicator stay within the 30-60 range of values.
32
Map 3.4. Gender gap (GG) in literacy in 1860.
Source: Population census and own data.
Map 3.5 for 1900 shows a profound change in the levels and geography of gender
inequality in Spain. The advance of literacy, especially in territories where it was already
higher than average in the mid-nineteenth century, means that there are now sizeable areas
of Castile-Leon, La Rioja, Cantabria, Navarre and the Basque Country that have very
narrow gender gaps, with indicator values below 15 in many cases. Advances in equality are
also starting to be seen in Mediterranean coastal areas, especially Catalonia and the central
section of the Valencian Community.
33
Map 3.5. Gender gap (GG) in literacy in 1900.
Source: Population census.
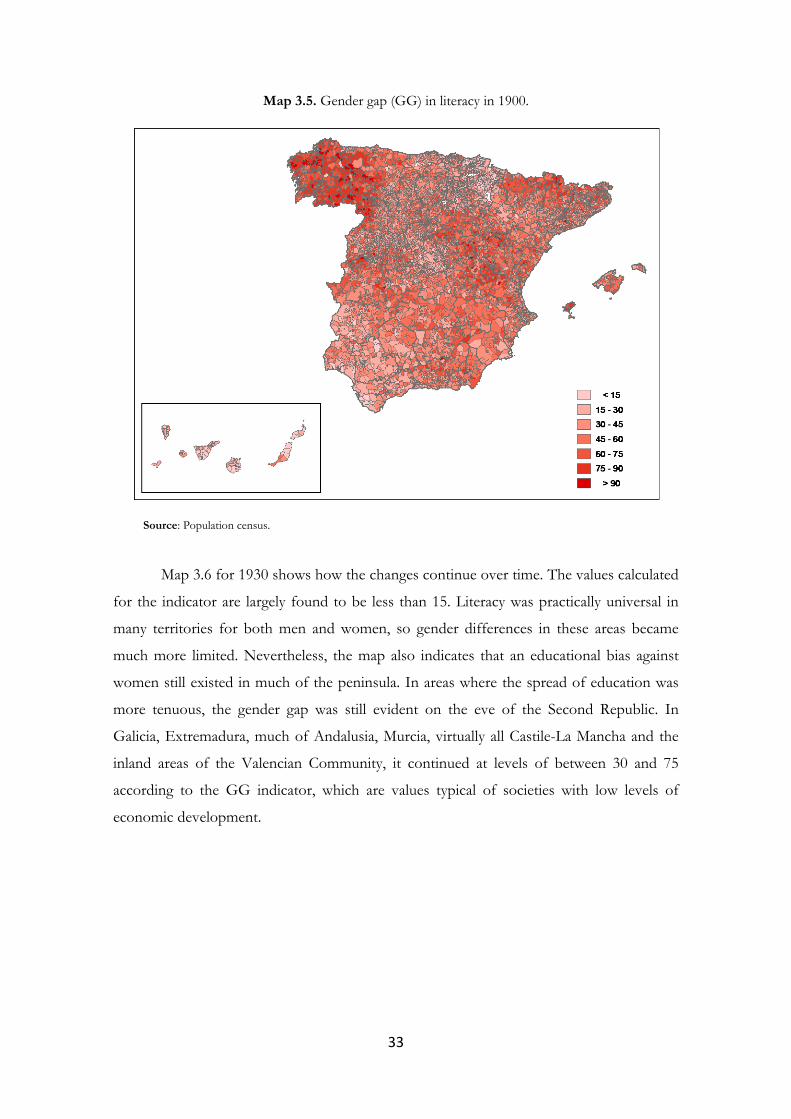
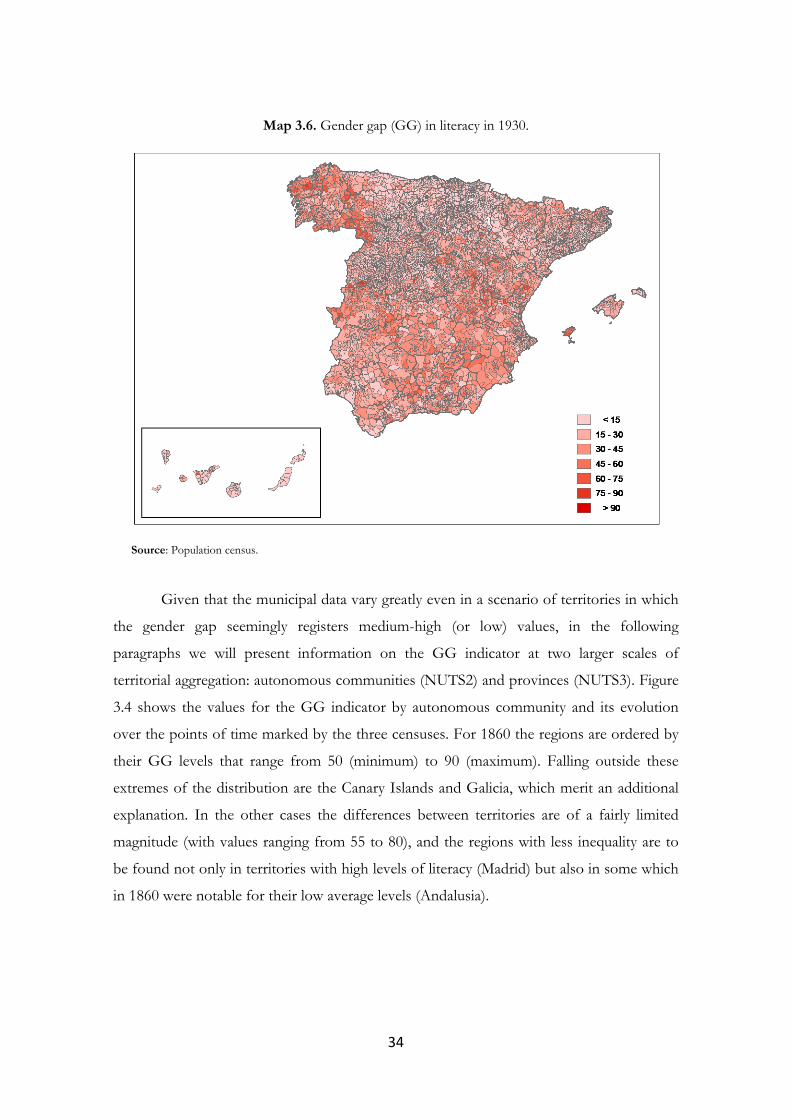
Map 3.6 for 1930 shows how the changes continue over time. The values calculated
for the indicator are largely found to be less than 15. Literacy was practically universal in
many territories for both men and women, so gender differences in these areas became
much more limited. Nevertheless, the map also indicates that an educational bias against
women still existed in much of the peninsula. In areas where the spread of education was
more tenuous, the gender gap was still evident on the eve of the Second Republic. In
Galicia, Extremadura, much of Andalusia, Murcia, virtually all Castile-La Mancha and the
inland areas of the Valencian Community, it continued at levels of between 30 and 75
according to the GG indicator, which are values typical of societies with low levels of
economic development.
34
Map 3.6. Gender gap (GG) in literacy in 1930.
Source: Population census.
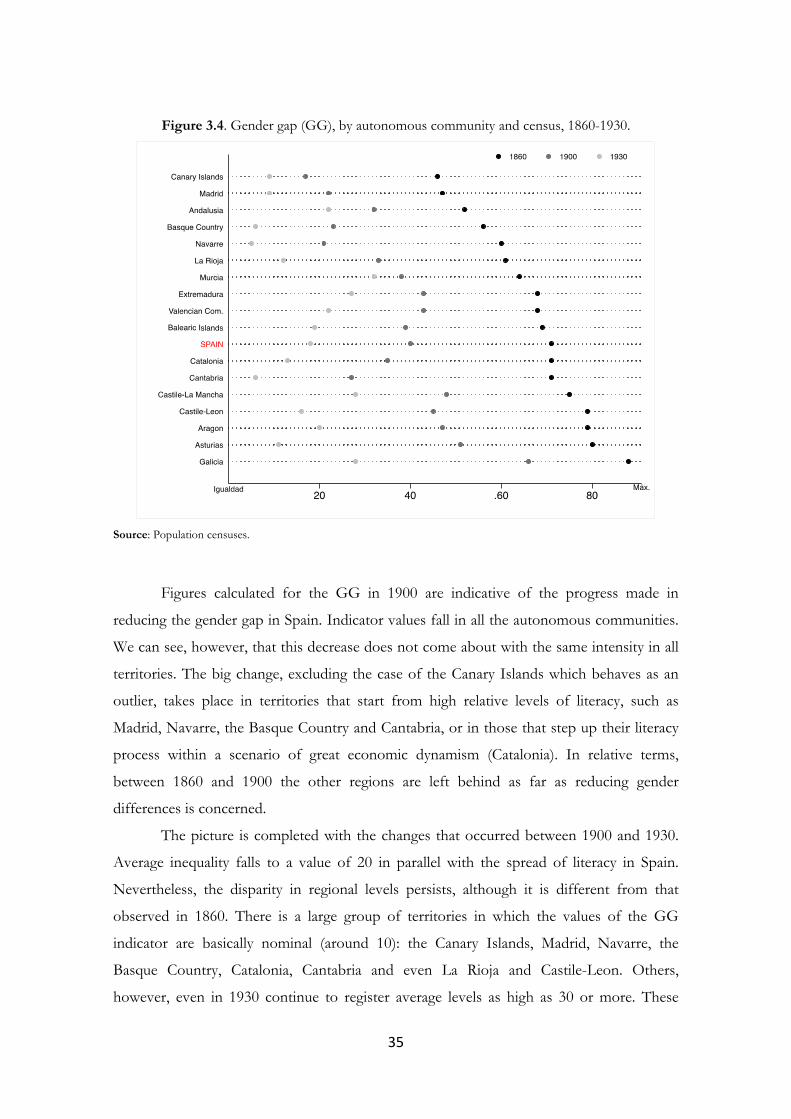
Given that the municipal data vary greatly even in a scenario of territories in which
the gender gap seemingly registers medium-high (or low) values, in the following
paragraphs we will present information on the GG indicator at two larger scales of
territorial aggregation: autonomous communities (NUTS2) and provinces (NUTS3). Figure
3.4 shows the values for the GG indicator by autonomous community and its evolution
over the points of time marked by the three censuses. For 1860 the regions are ordered by
their GG levels that range from 50 (minimum) to 90 (maximum). Falling outside these
extremes of the distribution are the Canary Islands and Galicia, which merit an additional
explanation. In the other cases the differences between territories are of a fairly limited
magnitude (with values ranging from 55 to 80), and the regions with less inequality are to
be found not only in territories with high levels of literacy (Madrid) but also in some which
in 1860 were notable for their low average levels (Andalusia).
35
Figure 3.4. Gender gap (GG), by autonomous community and census, 1860-1930.
Source: Population censuses.
Figures calculated for the GG in 1900 are indicative of the progress made in
reducing the gender gap in Spain. Indicator values fall in all the autonomous communities.
We can see, however, that this decrease does not come about with the same intensity in all
territories. The big change, excluding the case of the Canary Islands which behaves as an
outlier, takes place in territories that start from high relative levels of literacy, such as
Madrid, Navarre, the Basque Country and Cantabria, or in those that step up their literacy
process within a scenario of great economic dynamism (Catalonia). In relative terms,
between 1860 and 1900 the other regions are left behind as far as reducing gender
differences is concerned.
The picture is completed with the changes that occurred between 1900 and 1930.
Average inequality falls to a value of 20 in parallel with the spread of literacy in Spain.
Nevertheless, the disparity in regional levels persists, although it is different from that
observed in 1860. There is a large group of territories in which the values of the GG
indicator are basically nominal (around 10): the Canary Islands, Madrid, Navarre, the
Basque Country, Catalonia, Cantabria and even La Rioja and Castile-Leon. Others,
however, even in 1930 continue to register average levels as high as 30 or more. These
36
include Murcia, Galicia, Castile-La Mancha and Extremadura. A picture therefore takes
shape in which the territorial polarization of gender differences is greater than in 1900 and
also, naturally, greater than the level of polarization inherited from the Ancien Regime shown
here using data from the census of 1860.
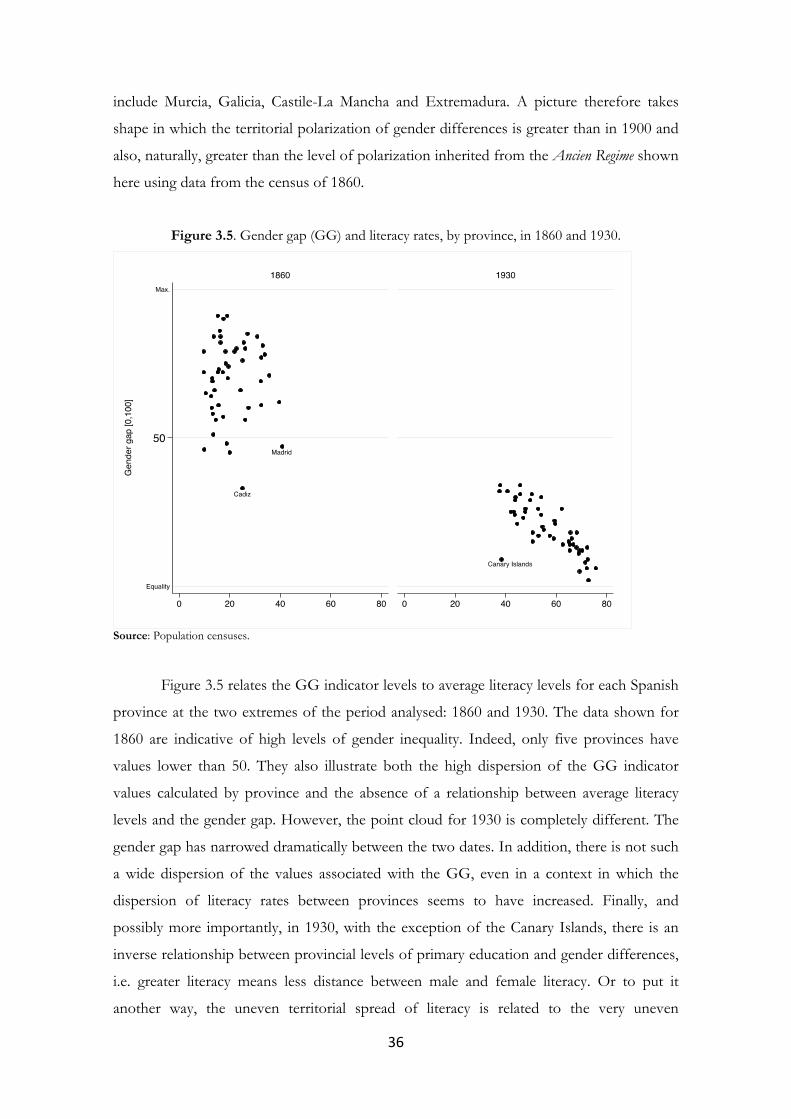
Figure 3.5. Gender gap (GG) and literacy rates, by province, in 1860 and 1930.
Source: Population censuses.
Figure 3.5 relates the GG indicator levels to average literacy levels for each Spanish
province at the two extremes of the period analysed: 1860 and 1930. The data shown for
1860 are indicative of high levels of gender inequality. Indeed, only five provinces have
values lower than 50. They also illustrate both the high dispersion of the GG indicator
values calculated by province and the absence of a relationship between average literacy
levels and the gender gap. However, the point cloud for 1930 is completely different. The
gender gap has narrowed dramatically between the two dates. In addition, there is not such
a wide dispersion of the values associated with the GG, even in a context in which the
dispersion of literacy rates between provinces seems to have increased. Finally, and
possibly more importantly, in 1930, with the exception of the Canary Islands, there is an
inverse relationship between provincial levels of primary education and gender differences,
i.e. greater literacy means less distance between male and female literacy. Or to put it
another way, the uneven territorial spread of literacy is related to the very uneven
37
containment of gender differences across Spain’s geography.28 We therefore now need to
analyse the geography of the literacy process.
4. Territorial inequality in literacy, 1860-1930.
The literacy process in Spain was characterized by its uneven spread across the territory. As
Núñez (1992) pointed out, Castile-Leon and the territories around Cantabria, Alava and
Navarre presented the highest levels of literacy in the mid-nineteenth century. At the other
extreme were the southern provinces (in the regions of Andalusia, Castile-la Mancha,
Murcia and the Valencian Community) along with those in the extreme north-west of the
peninsula (Galicia and Asturias). While these spatial patterns at the provincial level are well
known, in the following pages we present a detailed analysis of how territorial inequality in
literacy evolved at the municipal level over the period 1860-1930. Specifically, we will show
whether the scenario inherited from the Ancien Regime, characterized by high territorial
inequality, weakened over time. We will also analyse whether this possible decrease in
inequality occurred with the same intensity over the course of each of the two institutional
scenarios governing primary education in Spain over the period.
It could be argued that, since the Moyano Act left the financing of primary education
in the hands of individuals (or families) and municipalities, the new design would simply
have reproduced and perpetuated pre-existing territorial inequalities. It might also be
reasonable to think that the change of paradigm involved in the creation of the Ministry of
Public Instruction and Fine Arts in 1900, which meant that the State itself would deal with
investment in education, could have served as an attempt from the public side to narrow
the education gaps that existed between territories by boosting education levels in those
areas where they were lowest.
The literature, using provincial data, usually points out that territorial inequality in
literacy tended to decrease in this stage of history, or to put it another way, that literacy
levels in Spanish provinces were in the process of convergence. Thus Reher (1997) notes
that the gradual growth of the Spanish education system boosted literacy levels in the south
(an area that started from low education levels), whereas there was a more moderate
improvement in the north (an area characterized by more widespread literacy). Certainly
the spread of literacy caused the distance between extremes to narrow. However, the
literature has not carried out a detailed analysis of how distances evolved taking into
account the distribution as a whole. From this standpoint the narrowing of distances may 28 Monirum-Islam and Mustaquim (2015) show that the same type of inverse relationship between average literacy and the gender gap existed in the case of the Indian regions in 2011.
38
not have been so intense if, as Reher (1997) himself says, the setting-up of the education
system was carried out to a greater degree and was more effective in those regions that
were already developing (like Catalonia, for example, which occupied an intermediate
position in the Spanish literacy ranking) than in those that were lagging behind (like
Extremadura and Galicia, for example, which occupied the bottom positions).
The evolution of territorial inequality in human capital has also been analysed from
an international perspective. Diebolt and Hippe (2016) provide new evidence about the
long-term evolution of human capital stock in Europe at a regional level. They construct
different inequality indicators for various points in time starting in the mid-nineteenth
century. The work is based on literacy and numeracy data calculated at a level of territorial
disaggregation corresponding to today’s NUTS2. Their results indicate the presence of big
and in many cases very persistent differences in regional allocations of human capital
within countries. They place Spain along with Bulgaria, Serbia and Russia in the group with
the biggest regional differences.
The same authors state that in general terms Europe underwent a convergence
process in regional literacy levels between 1900 and 1960. However, they point out the
existence of numerous outliers, i.e. regions whose educational performance was either
much higher or much lower than expected in relation to their starting position. Finally they
explore an additional hypothesis concerning the existence of a relationship between the
evolution of regional inequality in literacy and the country’s level of development in terms
of education. They deduce from the evidence that there is an inverted U-shaped
relationship between the two variables, positioning the educational threshold at which
territorial inequality begins its downward slope at the point where the literate population is
greater than 50% of the total. In other words, their results indicate the existence of a
Kuznets curve for regional inequality in human capital, like that suggested by Morrisson
and Murtin (2009).
In connection with these aspects, in the following section we explore in greater
depth the evolution of inequality in literacy at different levels of territorial aggregation:
municipalities, provinces (NUTS3) and autonomous communities (NUTS2). Specifically,
we discuss the possible existence of a pattern of territorial convergence in literacy levels
and the potential impact of the changes made in the area of primary education in Spain on
levels of inequality in education between territories.
39
4.1. Territorial inequality in Spain: working with municipal data.
In order to study the above aspects in greater detail, the following paragraphs provide a
homogenous overall picture of the evolution of territorial inequality in literacy over the
period 1860-1930. To do this we will be referring back to the information shown in Table
3.1, which summarized the main statistics obtained from the new dataset.
The values in columns 4 to 7, which present information on the levels and
evolution of territorial inequality, provide a series of stylized facts. The first and possibly
the most striking is that, in parallel with the advance of the literacy process, territorial
inequality showed a downward trend. The simple coefficient of variation (SCV) for the
distribution that includes literacy rates for the population of Spain as a whole falls from a
value of 0.52 in 1860 to 0.24 in 1930. Inequality falls by 54% between both dates. The
weighted indicator (WCV) follows the same trajectory, although its evolution records a
slightly lower fall (50%).
Nevertheless, this decrease in distances as regards the average must not hide an
additional fact, which is that the distance between the tails does not fall continuously. The
ratio between maximum and minimum municipal literacy rates (columns 4 and 5) fell
considerably between 1860 and 1900, but then increased between 1900 and 1930. Although
average literacy levels along with their maximum values grew rapidly, some municipalities
did not participate in the process and the distance between the tails of the distribution
widened. Later we will provide new evidence about how far this was true in terms of the
municipalities affected.
The third noteworthy fact is to do with the rate at which territorial inequality
decreased. The speed of the convergence between the literacy levels of Spanish
municipalities increased between 1900 and 1930, i.e. with the transition to a model in which
the State took over primary school funding. In comparative terms, therefore, it could be
argued that the model of private or municipal investment developed in the Moyano Act
tended to maintain pre-existing territorial differences, while the creation of the Ministry of
Public Instruction and its assumption of school funding served to correct them.
40
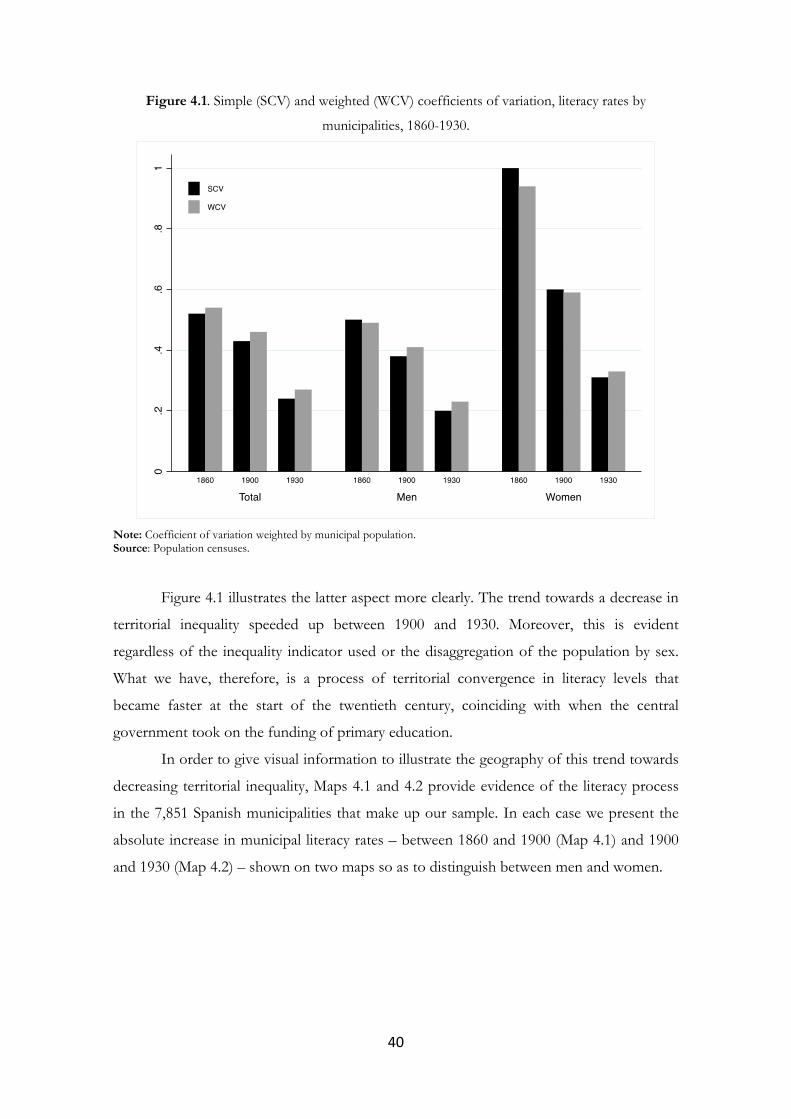
Figure 4.1. Simple (SCV) and weighted (WCV) coefficients of variation, literacy rates by
municipalities, 1860-1930.
Note: Coefficient of variation weighted by municipal population. Source: Population censuses.
Figure 4.1 illustrates the latter aspect more clearly. The trend towards a decrease in
territorial inequality speeded up between 1900 and 1930. Moreover, this is evident
regardless of the inequality indicator used or the disaggregation of the population by sex.
What we have, therefore, is a process of territorial convergence in literacy levels that
became faster at the start of the twentieth century, coinciding with when the central
government took on the funding of primary education.
In order to give visual information to illustrate the geography of this trend towards
decreasing territorial inequality, Maps 4.1 and 4.2 provide evidence of the literacy process
in the 7,851 Spanish municipalities that make up our sample. In each case we present the
absolute increase in municipal literacy rates – between 1860 and 1900 (Map 4.1) and 1900
and 1930 (Map 4.2) – shown on two maps so as to distinguish between men and women.
41
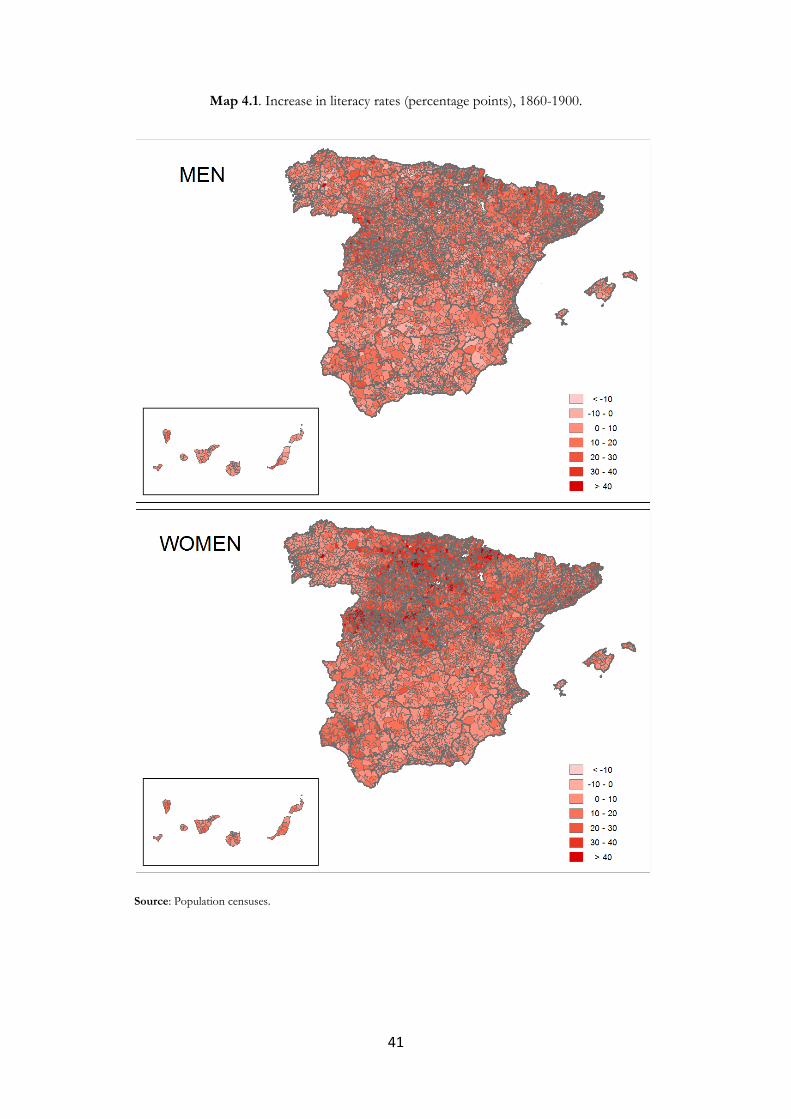
Map 4.1. Increase in literacy rates (percentage points), 1860-1900.
Source: Population censuses.
42
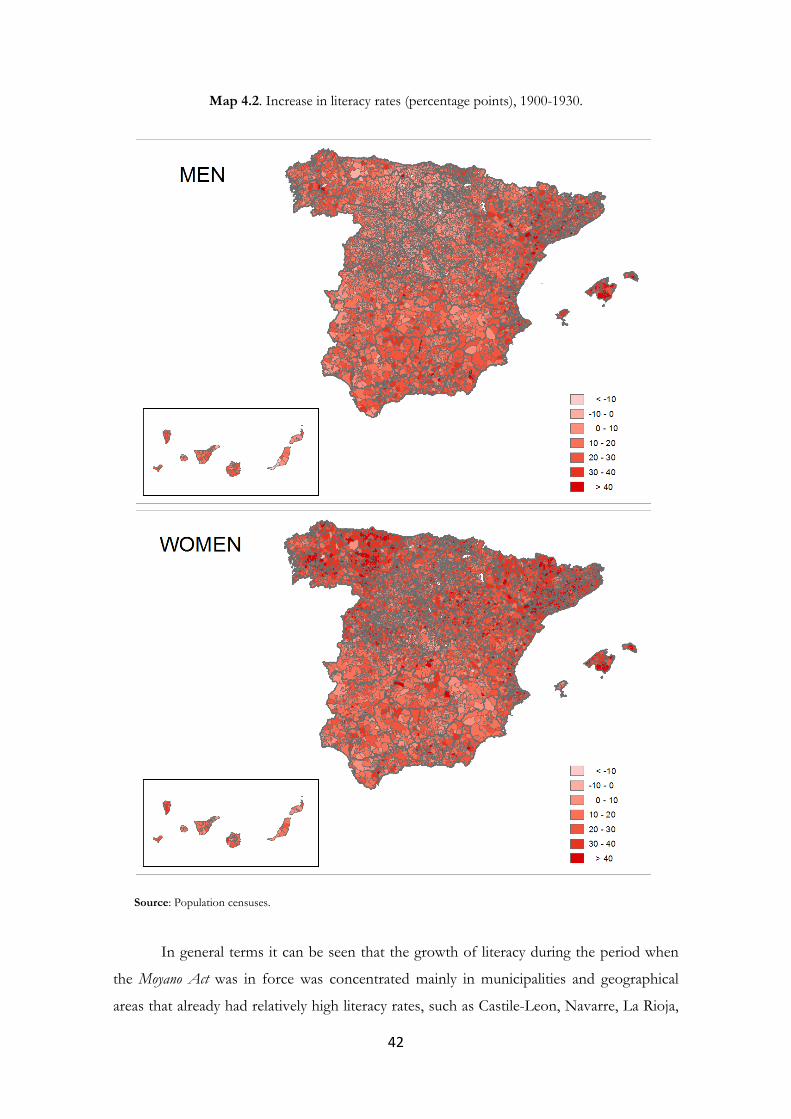
Map 4.2. Increase in literacy rates (percentage points), 1900-1930.
Source: Population censuses.
In general terms it can be seen that the growth of literacy during the period when
the Moyano Act was in force was concentrated mainly in municipalities and geographical
areas that already had relatively high literacy rates, such as Castile-Leon, Navarre, La Rioja,
43
Alava and Madrid. Significant increases (of between 10-20 points) are also revealed in
different municipalities located in areas where literacy rates at the beginning of the same
period were low, such as Andalusia (especially in the provinces of Cadiz and Seville),
Extremadura, Castile-La Mancha and the coastal areas of the Valencian Community. In all
these areas, however, the growth of literacy in some municipalities occurred in parallel to
its slow development in other municipalities in the same region.
The map of the uneven growth of regional literacy changes radically in the period
1900-1930. The areas that register the greatest increases are no longer the traditionally
literate ones, and it is in areas with intermediate levels of literacy that the most significant
increases are observed. Most prominent are the advances made in the municipalities of the
Mediterranean coast, especially in Catalonia, the Balearic Islands and the Valencian
Community, together with those in Aragon, mainly along the River Ebro, and the Basque
Country, especially in Gipuzkoa and Bizkaia. Improved levels of literacy over these years
would considerably reduce territorial inequalities in human capital, and the pattern they
followed would match the pattern of greater economic dynamism experienced by those
regions that underwent mass literacy in the same period (Díez-Minguela et al., 2018; Reher,
1997).
Given that the literacy variable only goes up to 100, it would clearly be reasonable
to believe that absolute increases in literacy would tend to be bigger in those municipalities
that started from lower levels. However, the evidence provided by the maps indicates that
this was not usually the case between 1860 and 1900, although it can indeed be seen in the
period 1900-1930. In fact the biggest increases are not found in areas with lower literacy
rates but in those with intermediate rates and characterized by greater economic dynamism.
Increasing internal migratory flows, the growing urbanization of these regions and the
marked advances made as regards the transformation of their production structures could
have affected the expected return on investing in education more strongly in these
territories than in less dynamic areas of the peninsula. It could therefore be argued that
during these years there was a significant relationship between the uneven advance of
literacy and the economic dynamism of the territories.29
In order to explore these hypotheses in greater depth, below we provide evidence
of the relationship between municipal literacy levels at the start of the period and the
29 The method of constructing the variable presented here could upwardly bias the values obtained for those populations that received literate adult population, since this received population would have a lower proportion of people aged under 10 and a higher volume of adult-age literacy. However, the population flows in Spain were concentrated in a limited group of populations and of low intensity at least until the 1920s (Silvestre, 2007).
44
subsequent increase in literacy rates both for the whole of the period (Figure 4.2) and for
the two time periods into which the study has been divided (Figures 4.3 and 4.4).
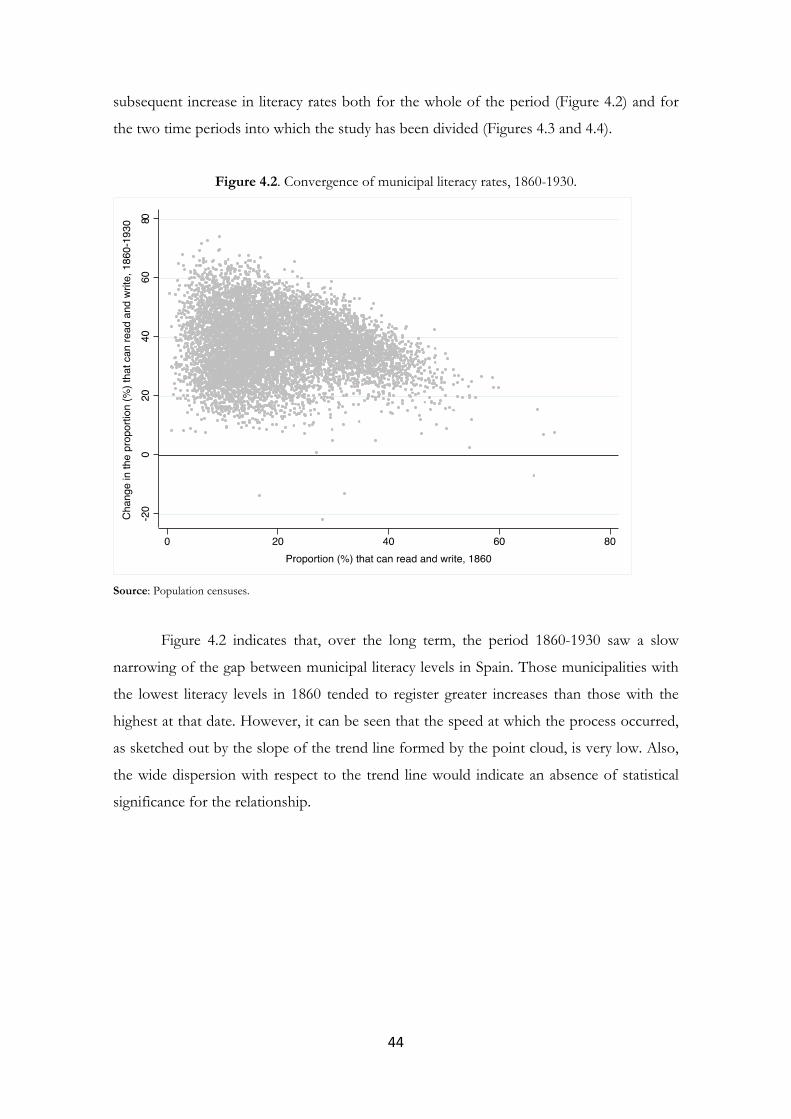
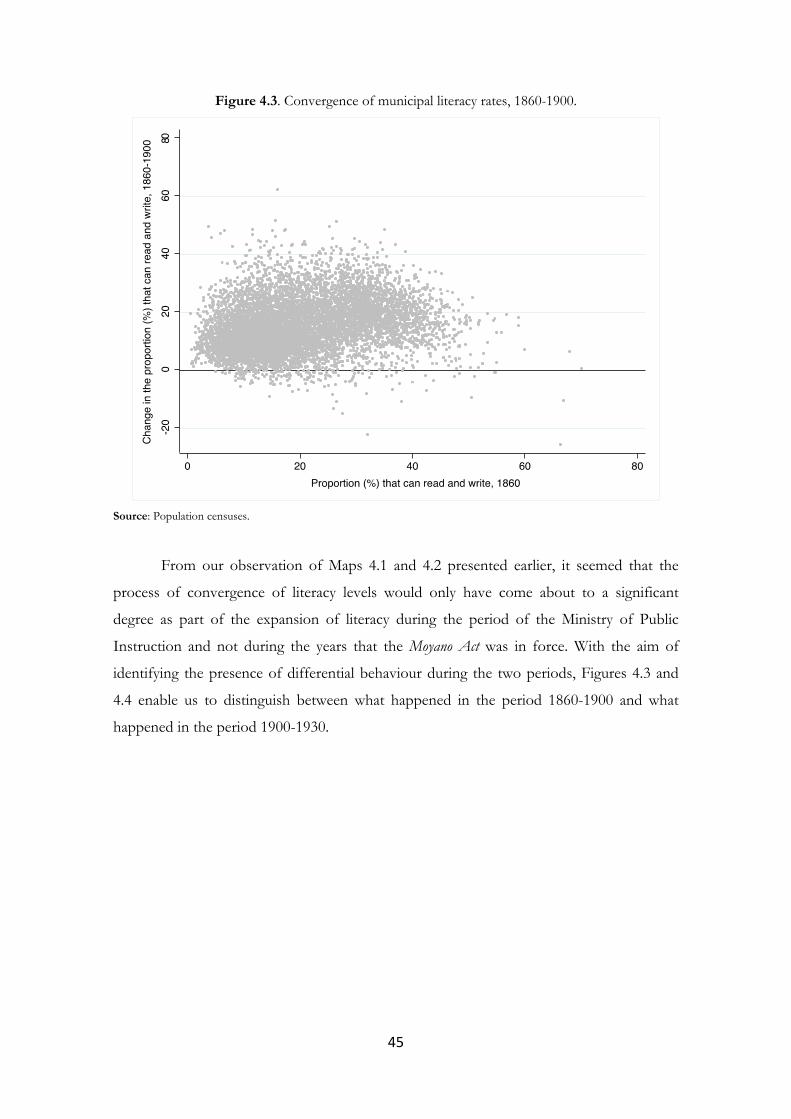
Figure 4.2. Convergence of municipal literacy rates, 1860-1930.
Source: Population censuses.
Figure 4.2 indicates that, over the long term, the period 1860-1930 saw a slow
narrowing of the gap between municipal literacy levels in Spain. Those municipalities with
the lowest literacy levels in 1860 tended to register greater increases than those with the
highest at that date. However, it can be seen that the speed at which the process occurred,
as sketched out by the slope of the trend line formed by the point cloud, is very low. Also,
the wide dispersion with respect to the trend line would indicate an absence of statistical
significance for the relationship.
45
Figure 4.3. Convergence of municipal literacy rates, 1860-1900.
Source: Population censuses.
From our observation of Maps 4.1 and 4.2 presented earlier, it seemed that the
process of convergence of literacy levels would only have come about to a significant
degree as part of the expansion of literacy during the period of the Ministry of Public
Instruction and not during the years that the Moyano Act was in force. With the aim of
identifying the presence of differential behaviour during the two periods, Figures 4.3 and
4.4 enable us to distinguish between what happened in the period 1860-1900 and what
happened in the period 1900-1930.
46
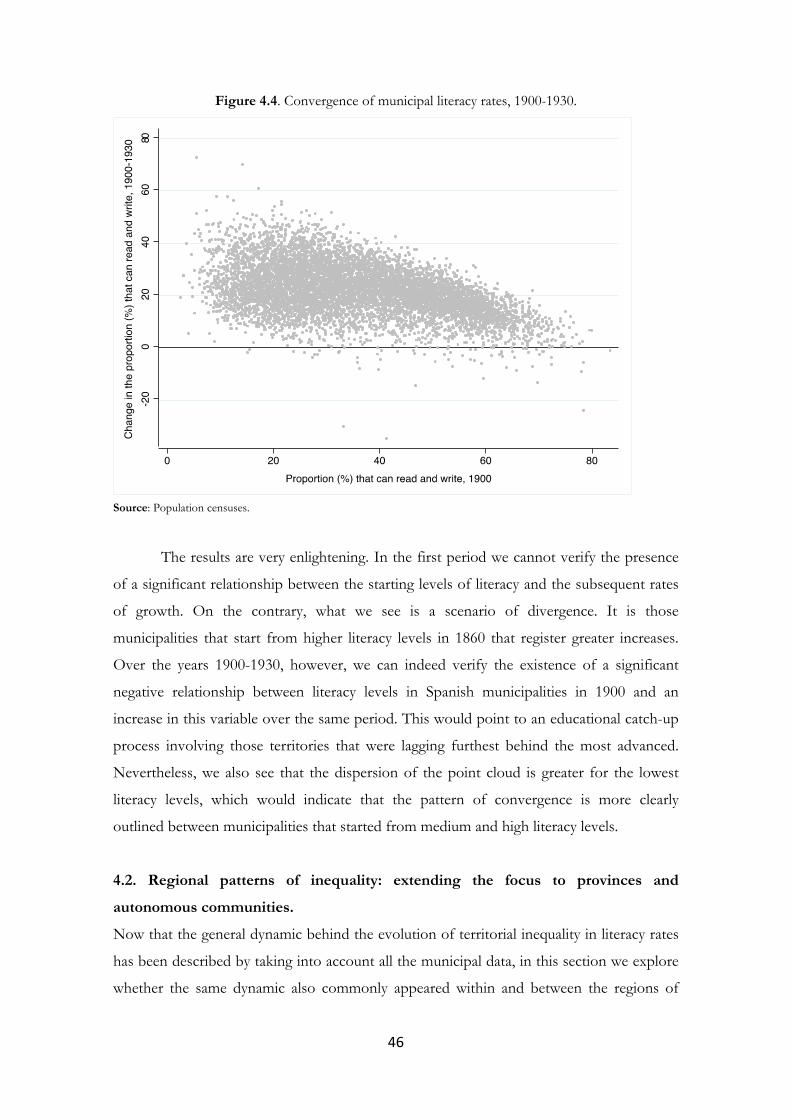
Figure 4.4. Convergence of municipal literacy rates, 1900-1930.
Source: Population censuses.
The results are very enlightening. In the first period we cannot verify the presence
of a significant relationship between the starting levels of literacy and the subsequent rates
of growth. On the contrary, what we see is a scenario of divergence. It is those
municipalities that start from higher literacy levels in 1860 that register greater increases.
Over the years 1900-1930, however, we can indeed verify the existence of a significant
negative relationship between literacy levels in Spanish municipalities in 1900 and an
increase in this variable over the same period. This would point to an educational catch-up
process involving those territories that were lagging furthest behind the most advanced.
Nevertheless, we also see that the dispersion of the point cloud is greater for the lowest
literacy levels, which would indicate that the pattern of convergence is more clearly
outlined between municipalities that started from medium and high literacy levels.
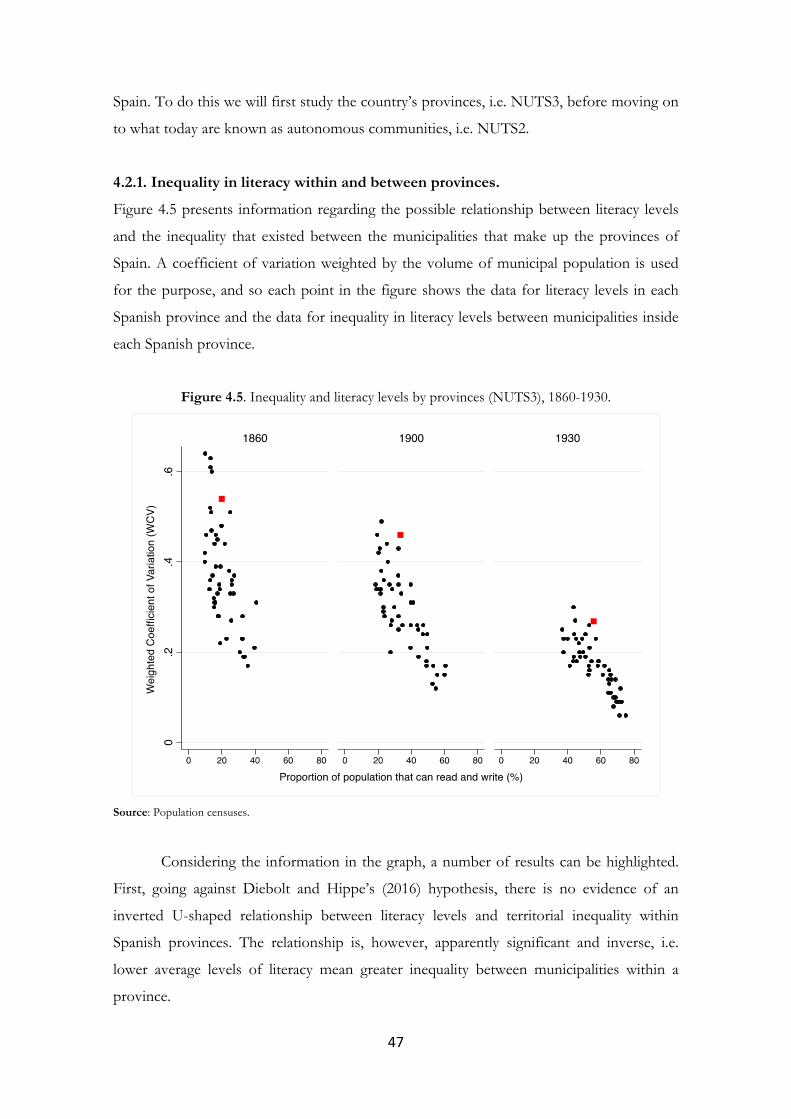
4.2. Regional patterns of inequality: extending the focus to provinces and
autonomous communities.
Now that the general dynamic behind the evolution of territorial inequality in literacy rates
has been described by taking into account all the municipal data, in this section we explore
whether the same dynamic also commonly appeared within and between the regions of
47
Spain. To do this we will first study the country’s provinces, i.e. NUTS3, before moving on
to what today are known as autonomous communities, i.e. NUTS2.
4.2.1. Inequality in literacy within and between provinces.
Figure 4.5 presents information regarding the possible relationship between literacy levels
and the inequality that existed between the municipalities that make up the provinces of
Spain. A coefficient of variation weighted by the volume of municipal population is used
for the purpose, and so each point in the figure shows the data for literacy levels in each
Spanish province and the data for inequality in literacy levels between municipalities inside
each Spanish province.
Figure 4.5. Inequality and literacy levels by provinces (NUTS3), 1860-1930.
Source: Population censuses.
Considering the information in the graph, a number of results can be highlighted.
First, going against Diebolt and Hippe’s (2016) hypothesis, there is no evidence of an
inverted U-shaped relationship between literacy levels and territorial inequality within
Spanish provinces. The relationship is, however, apparently significant and inverse, i.e.
lower average levels of literacy mean greater inequality between municipalities within a
province.
48
Second, if we analyse how the relationship between literacy levels and territorial
inequality within provinces evolved over time, two additional elements can be extracted.
We see that the elasticity (i.e. the slope of the imaginary line that would minimize the
distances between the points that make up the cloud) decreases over time. In other words,
during the early stages of the literacy process (1860 and 1900), increasing averages mean big
decreases in inequality. When higher levels are involved (1930), increasing averages still
mean decreases in inequality, but proportionally smaller ones. And in addition to
illustrating the gradual advance of literacy in Spain, the figure also shows how only the
jump that took place between the censuses of 1900 and 1930 involved any real reduction in
territorial inequality, now between municipalities within the same provinces.
It could therefore be argued that the greatest reduction in territorial inequality came
about in the institutional setting established with the creation of the Ministry of Public
Instruction in 1900 and the financing of primary education through the national budget.
Between then and 1930, inequality in literacy decreased not only on a national level but also
on a provincial level.
4.2.2. Inequality in literacy within and between autonomous communities.
Unlike municipalities and provinces, the territorial division of Spain into autonomous
communities did not exist in the period covered by this work, but it seems reasonable that
we should provide information about the uneven spread of primary education at this level
of territorial aggregation, especially when historical evidence is being generated that may
help us to understand today’s differences in education in Spain. Neither should it be
forgotten that providing this public good is now to a large degree the responsibility of these
branches of local government. Figure 4.6 provides evidence of territorial inequality in
literacy levels among the municipalities that make up the 17 Spanish autonomous
communities. The upper section illustrates developments through the use of the simple
coefficient of variation (SCV), while the lower section shows results obtained using the
weighted coefficient of variation (WCV).
The first thing we notice is that levels of inequality gradually decrease in all the
autonomous communities over the period 1860-1930. It can also been seen that in most
cases the biggest advance corresponds to the period 1900-1930. Indeed, between 1860 and
1900 communities such as Galicia and Murcia show increases in the case of the weighted
indicator. Moreover, when the unweighted indicator is considered, the decrease is very
small in these two communities and also in others such as Asturias, Castile-La Mancha, the
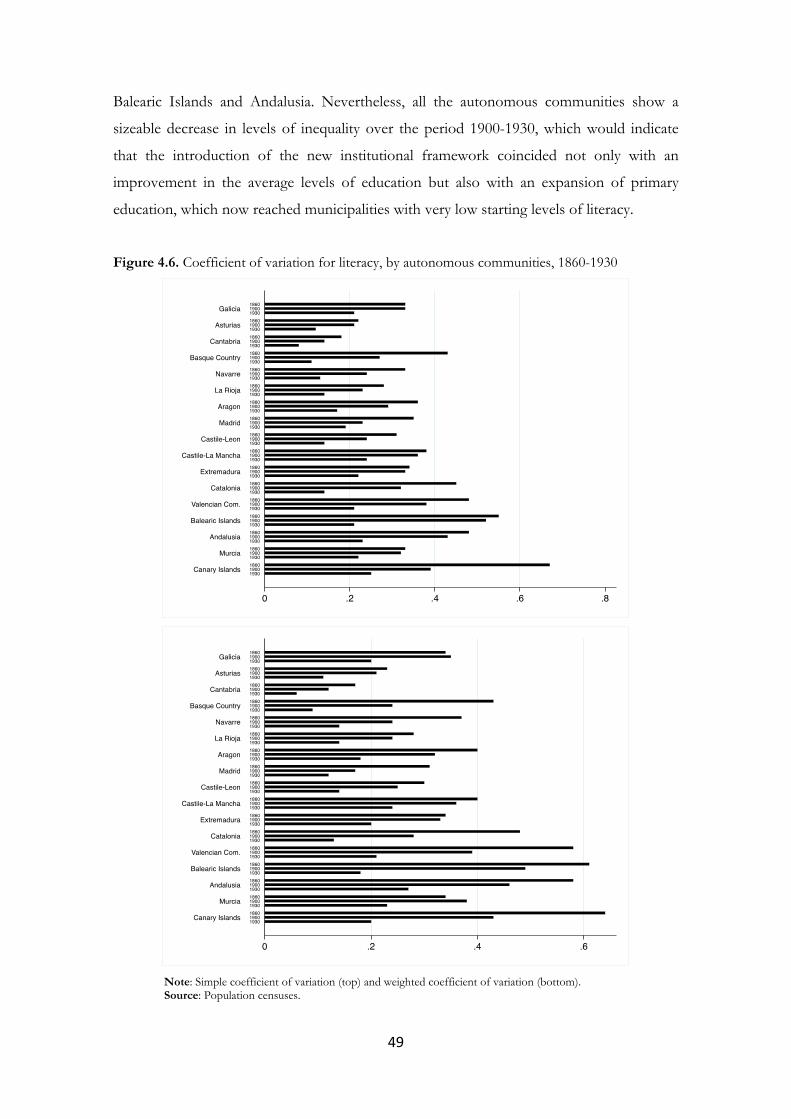
49
Balearic Islands and Andalusia. Nevertheless, all the autonomous communities show a
sizeable decrease in levels of inequality over the period 1900-1930, which would indicate
that the introduction of the new institutional framework coincided not only with an
improvement in the average levels of education but also with an expansion of primary
education, which now reached municipalities with very low starting levels of literacy.
Figure 4.6. Coefficient of variation for literacy, by autonomous communities, 1860-1930
Note: Simple coefficient of variation (top) and weighted coefficient of variation (bottom). Source: Population censuses.
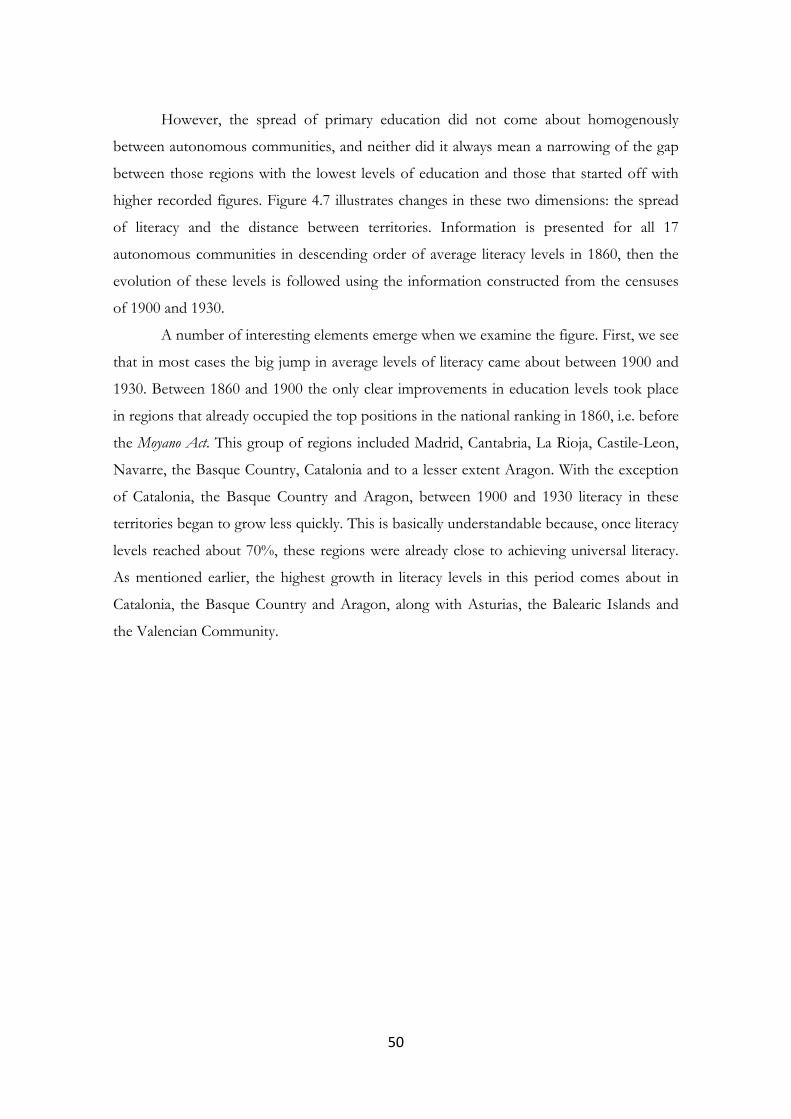
50
However, the spread of primary education did not come about homogenously
between autonomous communities, and neither did it always mean a narrowing of the gap
between those regions with the lowest levels of education and those that started off with
higher recorded figures. Figure 4.7 illustrates changes in these two dimensions: the spread
of literacy and the distance between territories. Information is presented for all 17
autonomous communities in descending order of average literacy levels in 1860, then the
evolution of these levels is followed using the information constructed from the censuses
of 1900 and 1930.
A number of interesting elements emerge when we examine the figure. First, we see
that in most cases the big jump in average levels of literacy came about between 1900 and
1930. Between 1860 and 1900 the only clear improvements in education levels took place
in regions that already occupied the top positions in the national ranking in 1860, i.e. before
the Moyano Act. This group of regions included Madrid, Cantabria, La Rioja, Castile-Leon,
Navarre, the Basque Country, Catalonia and to a lesser extent Aragon. With the exception
of Catalonia, the Basque Country and Aragon, between 1900 and 1930 literacy in these
territories began to grow less quickly. This is basically understandable because, once literacy
levels reached about 70%, these regions were already close to achieving universal literacy.
As mentioned earlier, the highest growth in literacy levels in this period comes about in
Catalonia, the Basque Country and Aragon, along with Asturias, the Balearic Islands and
the Valencian Community.
51
Figure 4.7. Literacy by autonomous communities, 1860, 1900 and 1930.
Source: Population censuses.
By 1930 literacy was therefore practically universal in those territories in which
levels of education were already higher in the mid-nineteenth century and in those which,
although starting from intermediate levels, were economically dynamic. As a result, the
average levels of inequality between and within regions was smaller, but a gap opened up
between those territories that in 1930 achieved literacy levels of between 70% and 80% and
those such as the Canary Islands, Murcia, Andalusia, Extremadura and Castile-La Mancha,
which recorded literacy levels of below 50%. This was a gap that remained open even when
the State took over responsibility for primary education, and it has persisted obstinately
over time.
5. Conclusions.
Jovellanos, the well-known Enlightenment reformist, wrote in his ‘Memorandum on Public
Education’ of 1802 that “the sources of social prosperity are many; but all spring from the same origin,
and this origin is public instruction”. These words indicate that the country’s intellectuals and
elites were perfectly aware of the importance of education for the economic development
of a society. However, the reality was that Spain, in this area as in many others, was lagging
behind other countries at the time.
52
In quantitative terms, the level of education in mid-nineteenth-century Spain
presented a bleak picture. Only 18% of the population could read and write and only
around 36% of children went to school. The situation was even worse in the case of
women. While 30% of men could read and write, the proportion of women barely
exceeded 8%. If we were to reverse the indicator and look at the situation in terms of
illiteracy, the extent of the country’s backwardness is possibly even more striking: in mid-
nineteenth-century Spain nine out of ten women were illiterate, as were seven out of ten
men.
Neither did the conditions under which primary education was provided make it
possible to imagine a particularly hopeful future in which this reality might be corrected.
Except for the children of the poorest families, attending school was not actually free.
Moreover, child labour was the order of the day, which meant that the opportunity cost of
sending children to school was high, especially for families with fewer resources who relied
on child labour for their subsistence. Also, many teachers had no qualifications and most
schools lacked suitable facilities and materials (insufficient equipment, overcrowded classes,
insanitary conditions, etc.). This general situation stood in contrast to that in the most
advanced countries of Europe at the time, which had long enjoyed much higher levels of
education, at least as far as the proportion of the population that could read and write is
concerned (Pamuk and Van Zanden, 2010).
That being said, it has also become clear in the course of this work that the state of
education in nineteenth-century Spain hid many geographical variations. The information
we have been uncovering is illustrative of the uneven regional performance in education.
Generally speaking, the municipalities located in the northern half of the peninsula,
especially in Castile-Leon and Cantabria, had high levels of literacy, in some cases reaching
those seen in other parts of Europe. In the south-east of the peninsula, however, illiteracy
predominated. Apart from exceptions in areas such as Madrid, Cadiz and Gijon, literacy
levels among women were extremely low and always proportionally far below the levels for
men, thus giving rise to a sizeable gender gap.
Under the framework of the Moyano Act, signed in 1857, the proportion of men and
women who could read and write gradually increased. However, this improvement was a
reflection not only of the efforts made in the shape of educational reforms, but also of the
gradual increase in the standard of living that came about in the same period. Nevertheless,
a study of the municipal data uncovered in this work would suggest that in general terms
the Moyano Act had little effect. On the one hand, those municipalities with the worst
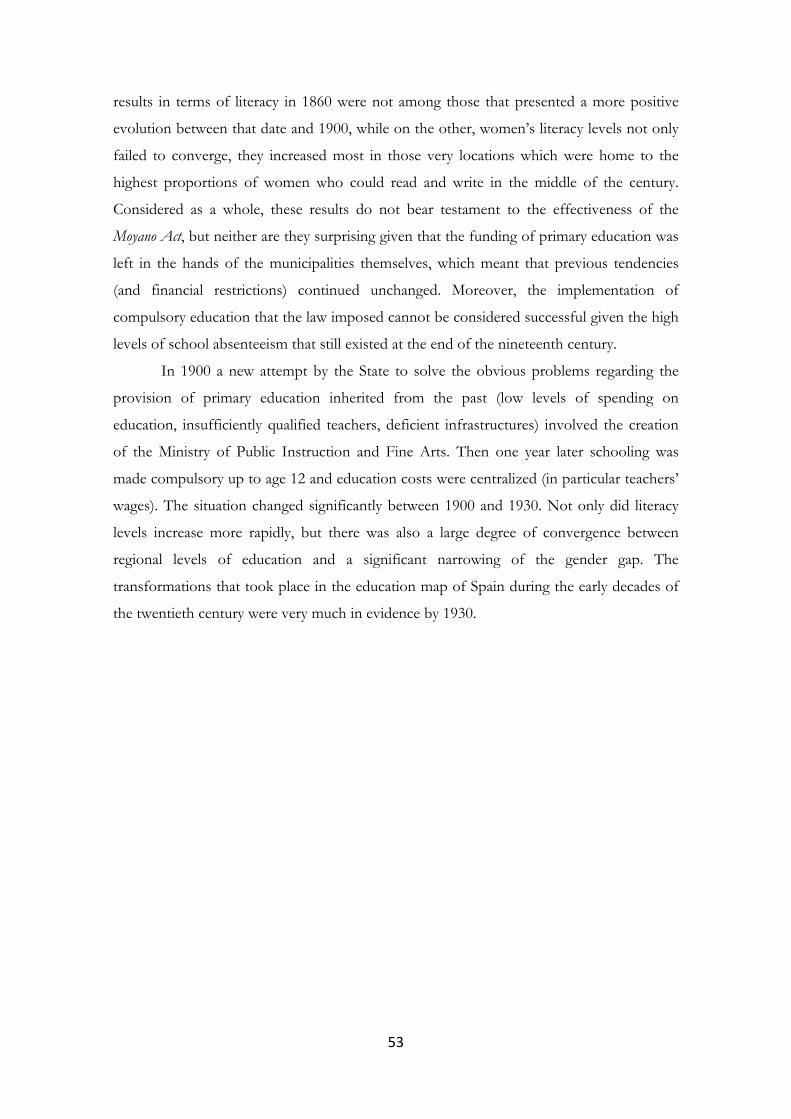
53
results in terms of literacy in 1860 were not among those that presented a more positive
evolution between that date and 1900, while on the other, women’s literacy levels not only
failed to converge, they increased most in those very locations which were home to the
highest proportions of women who could read and write in the middle of the century.
Considered as a whole, these results do not bear testament to the effectiveness of the
Moyano Act, but neither are they surprising given that the funding of primary education was
left in the hands of the municipalities themselves, which meant that previous tendencies
(and financial restrictions) continued unchanged. Moreover, the implementation of
compulsory education that the law imposed cannot be considered successful given the high
levels of school absenteeism that still existed at the end of the nineteenth century.
In 1900 a new attempt by the State to solve the obvious problems regarding the
provision of primary education inherited from the past (low levels of spending on
education, insufficiently qualified teachers, deficient infrastructures) involved the creation
of the Ministry of Public Instruction and Fine Arts. Then one year later schooling was
made compulsory up to age 12 and education costs were centralized (in particular teachers’
wages). The situation changed significantly between 1900 and 1930. Not only did literacy
levels increase more rapidly, but there was also a large degree of convergence between
regional levels of education and a significant narrowing of the gender gap. The
transformations that took place in the education map of Spain during the early decades of
the twentieth century were very much in evidence by 1930.
54
Figure 5.1. Literacy and GDP per inhabitant in Spain, 1860-1930.
Source: Prados de la Escosura (2017), population censuses and own data.
Nevertheless, the educational measures mentioned above were introduced at a time
of economic growth, and therefore it is difficult to distinguish between the effects of both
processes. The huge amount of statistical information dealt with in this work opens up the
possibility of going into these questions in greater detail, since the high degree of territorial
disaggregation enables us to analyse what happened with literacy in areas that were either
little affected by the successive laws or that scarcely grew in economic terms. In this regard,
studying how the educational performance of those municipalities furthest away from the
provincial capitals evolved emerges as a promising line of research. In a similar vein,
exploring the discontinuities hidden within the education laws themselves may also turn
out to be very illuminating. Thus, for example, Art. 102 of the Moyano Act stipulated that
villages of fewer than 500 inhabitants had to have at least one school (whether complete,
incomplete or seasonal). A preliminary analysis of the growth rates for literacy in
municipalities situated on either side of this threshold suggests that the measure had no
effect, since growth rates are practically identical for municipalities with between 400 and
500 inhabitants and those with between 500 and 600 inhabitants at the start of the period.
As pointed out in the introduction and despite the improvements described above,
the uneven regional performance in education has proved to be very persistent. The origins
of today’s situation need to be looked for in the past. The fact that differences persist
55
means that, regardless of the advances made in educational matters, the State’s intervention
since the mid-nineteenth century has not been sufficient to correct regional inequalities.
Understanding the reasons behind the wide geographical variations in education in Spain is
therefore not only interesting in itself but will also throw more light on the ultimate causes
that may explain why some regions continue to be poorer than others, not to mention why
Spain continues to lag behind other European countries in this area. The information
contained in this work will provide the opportunity to empirically study these elements in
greater depth. May the work therefore serve as an intermediate step on the path to a greater
understanding of the history of education in Spain.
Bibliography
Ávila Fernández, A. 1987. ‘La enseñanza primaria a través de los planes y
programas escolares de la legislación española durante el siglo XIX’, Cuestiones pedagógicas 4,
173-186.
Álvarez, B., Ramos Palencia, F. 2018. ‘Human capital and earnings in eighteenth-
century Castile’, Explorations in Economic History 67 (1), 105-133.
Beltrán Tapia, F.J. 2013. ‘Enclosing literacy? Common lands and human capital in
Spain, 1860-1930’, Journal of Institutional Economics 9 (4), 491-515.
Beltrán Tapia, F.J., Martinez-Galarraga, J. 2018. ‘Inequality and education in pre-
industrial economies: evidence from Spain’, Explorations in Economic History 69 (3), 81-101.
Bowman, M.J., Arnold Anderson, C. 1963. ‘Concerning the role of education in
development’. In C. Geertz (ed.), Old societies and new States (Glencoe: The Free Press), 247-
269.
Calatayud, S., Millán, J., Romeo, M.C. 2009. ‘El Estado en la configuración de la
España contemporánea. Una revisión de los problemas historiográficos’. In S. Calatayud, J.
Millán, M.C. Romeo (eds.), Estado y periferias en la España del siglo XIX (València:
Publicacions de la Universitat de València), 9-130.
Crafts, N. 1997. ‘The Human Development Index and changes in standard of
living: some historical comparisons’, European Review of Economic History 1 (3), 299-322.
De Gabriel, N. 2006. Ler e escribir en Galicia (A Coruña: Universidade da Coruña).
Del Moral Ruiz, J., Pro Ruiz, J., Suárez Bilbao, F. 2007. Estado y territorio en España,
1820-1930 (Madrid: Catarata).
Díez-Minguela, A., Martinez-Galarraga, J., Tirado, D.A. 2018. Regional inequality in
Spain, 1860-2015 (Cham: Palgrave Studies in Economic History, Palgrave-Macmillan).
56
Guereña, J.L., Viñao, A. 1996. Estadística escolar, proceso de escolarización y sistema
educativo nacional en España, 1750-1850 (Barcelona: EUB).
Hausmann, R., Tyson, L.D., Zaidi, S. 2009. The global gender gap report 2009 (Geneva:
World Economic Forum).
Laspalas Pérez, F.J. 1991. ‘La escolarización elemental en España según el Censo de
Godoy (1797)’, Historia de la Educación 10, 203-225.
Monirum-Islam, M., Mustaquim, M. 2015. ‘Gender gap in literacy: a study of Indian
scenario’, mimeo.
Morrisson, C., Murtin, F. 2009. ‘The century of education’, Journal of Human Capital
3 (1), 1-42.
Nadal, J. 1996. ‘El factor humà en el retard econòmic espanyol. El debat entre els
historiadors’, Revista Econòmica de Catalunya 29, 9-14.
Nalle, S.T. 1989. ‘Literacy and culture in early modern Castile’, Past & Present 125,
65-96.
Núñez, C.E. 1992. La fuente de la riqueza. Educación y desarrollo económico en la España
contemporánea (Madrid: Alianza Editorial).
Pamuk, S., Van Zanden, J.L. 2010. ‘Standards of living’. In S. Broadberry, K.H.
O’Rourke (eds.), The Cambridge Economic History of Modern Europe (Cambridge: Cambridge
University Press), 217-234.
Pérez Moreda, V., Reher, D.S., Sanz Gimeno, A. 2015. La conquista de la salud.
Mortalidad y modernización en la España contemporánea (Madrid: Marcial Pons).
Prados de la Escosura, L. 2016. ‘Spain’s historical national accounts: expenditure
and output, 1850-2015’, EHES Working Papers in Economic History, No. 103.
Prados de la Escosura, L. 2017. Spanish economic growth, 1850-2015 (Cham: Palgrave
Macmillan).
Reher, D.S. 1997. ‘La teoría del capital humano y las realidades de la historia’,
Papeles de Economía Española 73, 254-261.
Rosés, J.R., Martinez-Galarraga, J., Tirado, D.A. 2010. ‘The upswing of regional
income inequality in Spain (1860-1930)’, Explorations in Economic History 47 (2), 244-257.
Sánchez Alonso, B. 2000. ‘Those who left and those who stayed behind: explaining
emigration from the regions of Spain, 1880-1914’, The Journal of Economic History 60 (3), 730-
755.
Silvestre, J. 2005. ‘Internal migrations in Spain, 1877-1930’, European Review of
Economic History 9 (2), 233-265.
57
Silvestre, J. 2007. ‘Temporary internal migrations in Spain, 1860-1930’, Social Science
History 31 (4), 539-574.
Tirado, D.A., Díez-Minguela, A., Martinez-Galarraga, J. 2016. ‘Regional inequality
and economic development in Spain, 1860-2010’, Journal of Historical Geography 54 (4), 87-98.


![Abstract arXiv:1811.03804v4 [cs.LG] 28 May 2019 · 2019-05-30 · arXiv:1811.03804v4 [cs.LG] 28 May 2019 Gradient Descent Finds Global Minima of Deep Neural Networks Simon S. Du*](https://img.pdfslide.us/doc/110x75/5e5a556f668730778b26eeba/abstract-arxiv181103804v4-cslg-28-may-2019-2019-05-30-arxiv181103804v4.jpg)


![Abstract arXiv:1904.09856v2 [cs.CV] 1 May 2019](https://img.pdfslide.us/doc/110x75/62484d338f9af44c75413e55/abstract-arxiv190409856v2-cscv-1-may-2019.jpg)

![Abstract arXiv:2105.01061v1 [cs.CV] 3 May 2021](https://img.pdfslide.us/doc/110x75/61ea4f5343bc5609cb0be23f/abstract-arxiv210501061v1-cscv-3-may-2021.jpg)
![Abstract arXiv:1905.04172v1 [stat.ML] 10 May 2019](https://img.pdfslide.us/doc/110x75/61ceb2010f0397341365a516/abstract-arxiv190504172v1-statml-10-may-2019.jpg)
![Abstract arXiv:2103.02603v2 [cs.CV] 9 May 2021](https://img.pdfslide.us/doc/110x75/626cdb2c2dd32f1e7c4be046/abstract-arxiv210302603v2-cscv-9-may-2021.jpg)
![Abstract. arXiv:2105.11129v1 [math.DG] 24 May 2021](https://img.pdfslide.us/doc/110x75/6207d4bb550dd305ba2771ff/abstract-arxiv210511129v1-mathdg-24-may-2021.jpg)
![Abstract arXiv:1506.02640v5 [cs.CV] 9 May 2016](https://img.pdfslide.us/doc/110x75/61ac8c860af509414b7c3a20/abstract-arxiv150602640v5-cscv-9-may-2016.jpg)
![Abstract arXiv:1802.04170v2 [stat.AP] 31 May 2018](https://img.pdfslide.us/doc/110x75/61b2e02fec857d1bd857b94a/abstract-arxiv180204170v2-statap-31-may-2018.jpg)
![Abstract arXiv:1806.05343v2 [cs.CV] 29 May 2019](https://img.pdfslide.us/doc/110x75/624a1a1445a6fc79fe581903/abstract-arxiv180605343v2-cscv-29-may-2019.jpg)
![Abstract arXiv:1811.08687v3 [cs.LG] 14 May 2020](https://img.pdfslide.us/doc/110x75/616a2acc11a7b741a34f8992/abstract-arxiv181108687v3-cslg-14-may-2020.jpg)
![Abstract arXiv:2105.04544v2 [cs.LG] 11 May 2021](https://img.pdfslide.us/doc/110x75/6240b6e818f0f13d005fec6b/abstract-arxiv210504544v2-cslg-11-may-2021.jpg)
![Abstract arXiv:2105.02357v1 [cs.AI] 5 May 2021](https://img.pdfslide.us/doc/110x75/617e5efe1b916d2d137ff4ce/abstract-arxiv210502357v1-csai-5-may-2021.jpg)

![Abstract arXiv:1705.01176v1 [cs.DC] 2 May 2017](https://img.pdfslide.us/doc/110x75/6209a87ce0c72b1c3816a12e/abstract-arxiv170501176v1-csdc-2-may-2017.jpg)
