Embed Size (px)
Citation preview

E S S A Y
ADVANCING LIBERTY WITH RESPONSIBILITYBY PROMOTING MARKET SOLUTIONS
FOR MISSOURI PUBLIC POLICY
EXECUTIVE SUMMARY
This study investigates the relationship between education and several economic and social outcomes. On the economic side we consider the link between education and income. We also look at how education is related to health choices and social cohesion. Our basic question is: “What is the relationship between educational decisions made in the past and economic and social outcomes today?” Answers to this question reflect not only personal educational choices, but also shed light on the policy issue of why it is important to improve educational attainment. Using data
from all counties in Missouri, a key finding is that counties in which a large proportion of adults had not completed high school in 1990 are, today, more likely to:
• have lower levels of household income;
• have a larger percentage of the population who smoke;
• have a higher incidence of obesity;
• have a greater occurrence of childhood poverty; and
• have a larger percentage of single-parent households.
May 2017
EDUCATION, INCOME, AND SOCIAL BEHAVIOR ACROSS
MISSOURI By Gail Heyne Hafer and R.W. Hafer

SHOW-ME INSTITUTE I ESSAY
2
Such results may not be too surprising: lower levels of educational attainment are often associated with such negative outcomes. But the other key result of our analysis may be unexpected. We also examine the outcomes in counties where a large portion of adults in 1990 followed finishing high school with vocational training or some college. We find that today these counties tend to:
• have higher levels of household income;
• have a smaller percentage of the population who smoke;
• have a lower incidence of obesity;
• have a lesser occurrence of childhood poverty; and
• have a smaller percentage of single-parent households.
While the finding that more education is associated with better economic and social outcomes is not too surprising, the finding that the “switch” occurs at “high school plus two” years of education and does not require a bachelor’s degree has important policy implications. Namely, improvements in economic conditions and reductions of negative social outcomes may be achieved by improving efforts to ensure educational attainment at least through high school, and to focus on policies that increase the number of adults getting some additional, post–high school training. Focusing on education policies that increase the number of people who obtain some training and/or education beyond high school instead of trying to increase the percentage of the adult population who obtain a bachelor’s degree may, in the end, be more productive in promoting the future economic well-being of Missouri’s citizens.
INTRODUCTION
With limited state revenues, policymakers must make decisions involving complicated tradeoffs: Spend funds on some project that may yield immediate results in terms of increased jobs and tax revenue, or spend the money on other projects, such as education, for which the payoff may not be realized for a decade or more. Using state funds to, say, build a new road will not only create jobs but also deliver future benefits. Indeed, infrastructure is one of the oft-promoted “good” uses of government funds. However,
Glaeser (2016) has pointed out that shifting funds to such jobs-creating infrastructure programs as intra-city trolleys and urban light rail systems often does not meet the basic cost-benefit criteria one would use in evaluating any investment.
Suppose policymakers decide to spend more on education. There is pervasive evidence that better educational outcomes are associated with future higher standards of living, whether measured in terms of economic growth, higher levels of per-capita income, or better overall health conditions. But even if education gets the funds, where to spend it? Should more funds go to districts that already have relatively higher levels of funding from non-state sources, or should funds go to those areas where the value added of an improved education is the largest?
In this essay we will not delve into a cost-benefit analysis of competing projects that state policymakers could chose form. Rather, we investigate the basic relationships between education, income, and social behavior across counties in Missouri. Our view is that education is important; so, we wish to see whether different levels of education tend to produce different outcomes at the county level. Although some of what we present has been established at the national and state levels, our drilling down to the county level is important because many important education decisions affect local economic outcomes.1 Indeed, the evidence presented here will provide policymakers and education advocates with information that can help guide the allocation of educational funding across the state.
To accomplish our task, we first provide a brief overview of the important relationship between education and economic outcomes. We then discuss the education data used in the study. Using that data we then employ some basic statistical techniques to see how education is related to income and to a set of social behaviors. Some observations and policy recommendations close the paper.
WHY EDUCATION MATTERS, AND WHY IT MATTERS MOST
Economies that combine the factors of production—labor, machinery, and technology—in an efficient manner and
May 2017
3
do so consistently over time have higher relative levels of income and the amenities that accompany this success (better health care, cleaner environments, etc.). Using a standard textbook assumption, the dollar value of output being produced is conceptually the same as the income generated by the production of goods and services. This suggests that explaining why the economy of one country, state, or county is better off than another—incomes adjusted for price level differences are higher in one economy compared to another—is relatively straightforward: the one that has been better able to combine the factors of production in ways that allow it to produce more—generate higher incomes—is better off than the other.
Labor and Capital
The problem is that even though all economies have labor and machinery—in the parlance of economics, capital—not all labor or capital is equally productive. Some of the poorest countries have relatively large numbers of workers. It also is true that not every economy has access to equally productive capital. Research (and common sense) has shown that while labor and capital are necessary to produce goods and services, they also are subject to diminishing returns. An example will help. As you add more and more pastry chefs to a kitchen—adding more labor to a fixed amount of capital (that being the kitchen and all the utensils, ovens, etc., in it) it is easy to imagine that while more cakes may get baked, the increase in the number of cakes produced will diminish as the number of bakers increases. The fourth pastry chef may increase cake production, but not as much as the third chef did. As anyone who has experienced the extended family descending on the kitchen to help Mom fix Thanksgiving dinner, output may even decrease with the addition of more and more labor. And the same concept would hold if we changed the scenario: what if we increased the number of ovens but kept the number of pastry chefs fixed at one? One or two extra ovens may increase the chef ’s cake output, but after a while cake production changes little with each additional oven.
Technology, Knowledge, and Education
Economic theory and research have also shown that unlike capital and labor, technology is not subject to such diminishing returns. Say “technology,” and the mental
image conjured up is probably a physical good, like the computer we are using to type this. But technology incorporates much more than that. Technology is revealed in the multitude of modern machines that make our lives more enjoyable (think wash board vs. modern washing machines). It also shows up in other ways, such as rearranging a factory floor to increase output, given the same workers and machines. Both represent an advance in technology.
We prefer to substitute the term “knowledge” for technology. We do so because knowledge is derived from some educational process, whether it is time spent in a classroom or as an on-the-job apprentice. And knowledge gets revealed in technology. We therefore view knowledge as the foundation for technology. Indeed, given the stock of machinery and number of workers, research has shown that countries where the knowledge level of workers (based on some measure of education or cognitive skills) is higher generally experience faster growth in output. Not only is more educational attainment associated with better economic outcomes, but more knowledge increases the pace of technological advancement. The idea that knowledge begets more knowledge leads to the prediction that countries with higher relative levels of education are more likely to achieve better economic outcomes (e.g., higher incomes) than those with less educational attainment.2
Evidence also shows that education builds on itself. Support for this claim is found in the 2015 National Assessment of Educational Progress (NAEP). 3 The NAEP, sponsored by the U.S. Department of Education, is an assessment of student ability across several fields (e.g., reading, mathematics, science, writing, U.S. history, civics, and geography). Standardized tests are given to students in grade levels 4, 8, and 12. Here we focus on the results from the mathematics test administered to over 13,000 seniors across the nation. 4 In 2015, 37 percent of the students scoring in the “proficient” range came from households where the highest level of parental education was “graduating from college.” In contrast, only seven percent of the seniors earning the proficient ranking came from households where parents did not finish high school.5 While other factors are surely at work, the educational attainment of parents is a good predictor of the educational achievement of their offspring.
SHOW-ME INSTITUTE I ESSAY
4
Social Behaviors: Health
Not only is there evidence of a link between education and broad measures of economic progress, such as income, but there also appears to be a close link between education and different types of social behavior. Consider health. The improvement in health in the United States since the 1750s has been significantly affected by advances in medical knowledge and disease control.6 In addition, increases in incomes and the general level of education led to improved use of health-related information, which in turn led to increased economic activity: Healthier workers are more productive than ailing workers.
Holding the effects of income constant, education by itself improves health outcomes, setting into motion what has been referred to as a “virtuous cycle.”7 For the skeptical reader who thinks that all that is being captured is just an income–health connection, we note that education and health outcomes are positively related independent of any income effect. Better-educated individuals, independent of their incomes, are less likely to suffer negative health outcomes, such as chronic disease, stroke, hypertension, and diabetes, and they engage in fewer health-reducing behaviors than those with less education.8
A plausible explanation for the special role of education in health outcomes is that education increases access to and the ability to process health-related information. An individual with more-developed critical thinking skills is probably better able than her less-educated neighbor to understand the long-term consequences of unhealthy behaviors such as smoking or alcohol and drug abuse, as well as the benefits of healthy behaviors, such as exercise and preventive medicine. Indeed, it has been reported that in 2007 only 9 percent of individuals with a bachelor’s degree or higher smoked, compared with 30 percent of those with a high school diploma or less.9
The evidence thus indicates that “education” will improve economic well-being, in terms of more narrowly measured improvements in income and also in terms of social outcomes such as better health.
HOW TO MEASURE EDUCATION?
While researchers continue to search for the holy grail of the best measure of knowledge, it is reassuring to know
that the various measures used are correlated. For example, countries where a large percentage of the population has a high number of years of schooling also tend to be countries with better results on standardized exams.10 Because comparable data at the county level are scant, we will assess each county’s level of educational attainment using a years-of-schooling approach.11 To make this analysis tractable, we focus on three levels of educational attainment: the percentage of adults aged 25 or older in each Missouri county who have completed high school without a diploma; the percentage of adults aged 25 or older who graduated from high school and attended some college or obtained an associate degree; and the percentage of adults 25 or older with a bachelor’s degree or more.
These categories seem fairly self-explanatory, except perhaps for the “high school and some college or associate degree” cluster. This group includes any adult who graduated from high school and extended their education with a couple of years at a four-year university, or in a specific post-secondary training program. For example, community colleges offer a variety of post-secondary programs, such as accounting, culinary arts, nursing, and landscape design. The breadth of possible post–high school training encompassed by this definition thus extends beyond those individuals who entered a four-year college program and left before graduating.
You will notice that we do not include a category for those adults who have obtained a high school diploma but did not attend college or obtain some further training. We are essentially engaging in an experiment that asks if there are substantial effects on the local economy from having a larger share of the adult population that does not obtain a high school diploma or have a larger share of the adult population that graduates from high school and obtains some additional training, whether the latter is through more education or training, or obtaining a bachelor’s degree or more. In a nutshell, our results allow us to consider, relative to having a high school diploma, the effects on the average county’s median household income of having an adult population with too little education or having something more than a high school degree. 12
All of our educational data are for 1990. The other measures, both economic and social, are for the most recent year available.13 Why the temporal disconnect?
May 2017
5
Economists think of education as a “normal” good: as incomes rise, so would the demand for more (and better) education. Though our approach is admittedly imperfect, we try to reduce any feedback that runs from higher incomes to education by using data from a previous time: is past education a useful foundation for future economic and social outcomes? On average, the data indicate that the better-educated person pulls further and further away (economically) from the less-educated person as the years go by. In effect, our approach allows us to see whether the benefits (higher incomes, beneficial social behaviors, etc.) of education accrue over time at the county level.
Finally, we should be clear that all observations are measured as the ratio of each county’s data (e.g., median family income) to the state average. This allows us to compare how well a county is doing relative to the state. As will become apparent, this approach puts counties into categories that are “better than,” “worse than,” or “the same as” the state.
EDUCATION AND INCOME
To see how education and income are related across Missouri’s counties, we compare each county’s relative income to the three educational attainment measures. The income measure is median household income in 2013. To do this we use a scatter plot, where each “dot” represents a county in Missouri. The scatter plot is a useful device because it illustrates the link between these variables across all counties. Because all data are measured relative to the state average, the scatter plot generates four distinct quadrants. If the data points lay predominantly in the southwestern and northeastern quadrants, this would “predict” a positive relationship between the two series: counties with a relatively larger percentage of adults with only a high school education are, on average, likely to also have relatively high levels of income. Conversely, if the data points lie primarily in the northwest and southeast quadrants, this would indicate a negative relationship between the two data sets: counties with a larger percentage of adults with only a high school education are, on average, counties that have lower levels of income. To visually assess the relationship, we superimpose a “best fit” line in each figure to illustrate whether the underlying relationship is positive or negative, or whether the two series are independent.14 And finally, we use
Spearman rank correlations to further assess the statistical relationship between education and the various economic and social outcomes.15
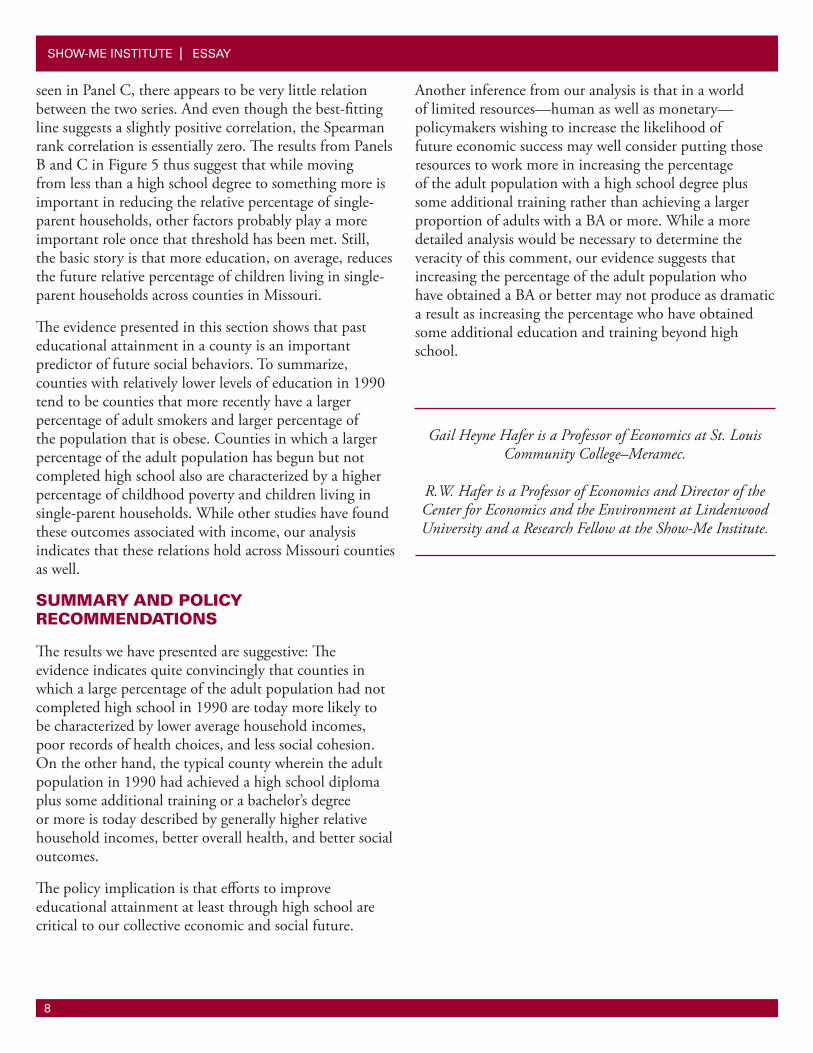
The scatter plot of the education measures and income for all counties in Missouri is shown in Figure 1. (Note: All figures are found in the Appendix at the end of this essay.) Panel A in Figure 1 plots each county’s data on income and its percentage of adults with some high school education but without a diploma. The scatter of points in panel A indicates a negative relationship, as shown by the dashed line. This probably fits with most readers’ expectations: Counties characterized by a larger percentage of adults with only some high school education also are those that have income levels below that of the state average. Statistically, the correlation between the two series is −0.62, which is statistically significant. The story from panel A is that counties with a higher percentage of adults who have only achieved some high school education in 1990 are counties that are more likely to have lower levels of income in 2013.
Quite a different story unfolds when we consider the effects of increasing educational attainment. Panel B shows the link between income and our high-school-plus” category. The plot shows that across Missouri, counties where there was a higher-than-average percentage of adults with some training beyond high school in 1990 are much more likely to have a relatively higher level of household income two decades later. The correlation is 0.59, which is statistically significant. Keeping in mind how we define this category, this finding supports recent arguments that vocational training and apprenticeship programs should be promoted in order to build skills that prepare individuals for middle-income jobs, for many of which workers are in short supply.16 Panel C shows the relationship between attainment of a bachelor’s degree in 1990 and median household income in 2013. There too we find that counties with a relatively higher percentage of adults who have a bachelor’s degree or better in 1990 are more likely to be those counties that had higher subsequent levels of household income. The correlation between median household income and this measure is 0.56, which is highly significant.
Why do we differentiate between the categories high school plus and the bachelor’s degree or more if they both deliver a
SHOW-ME INSTITUTE I ESSAY
6
positive outcome? The reason is because some argue that only by acquiring a college education can one become successful. When we look at county data, the evidence indicates that a large shift in future household incomes occurs when more individuals receive their high school diploma plus some additional education, which may not include a bachelor’s degree. While the bachelor’s degree–income relationship in Panel C corroborates the notion that more education is associated with higher levels of income, from a policy perspective, especially one aimed at raising income in the future, our results suggest that perhaps more attention should be paid to expanding the reach of programs that extend educational skills beyond high school but do not require a bachelor’s degree.
EDUCATION AND SOCIAL BEHAVIOR
A recent study published in the Journal of the American Medical Association (JAMA) examined the link between income and life expectancy in the United States.17 That study focused on the effect that income inequality has on the social behaviors that influence life expectancy. Using those findings as a roadmap, we will limit our analysis to a few key areas examined in the JAMA study. Thus we investigate the correlations between our educational measures and representative measures of health, social cohesion, and poverty. Our question is: Are counties that, on average, show evidence of more bad health choices, less social cohesion, and more poverty also those counties with relatively low levels of past educational attainment?
Health
We investigate the relationship between education and health choices by considering smoking and obesity at the county level in Missouri.18 The data on smoking are the percentage of adult smokers in a county relative to the percentage of adult smokers in the state. The most recent data are for 2012.19 We evaluate the effect of education, once again relative to the state, by using our three educational attainment groups.
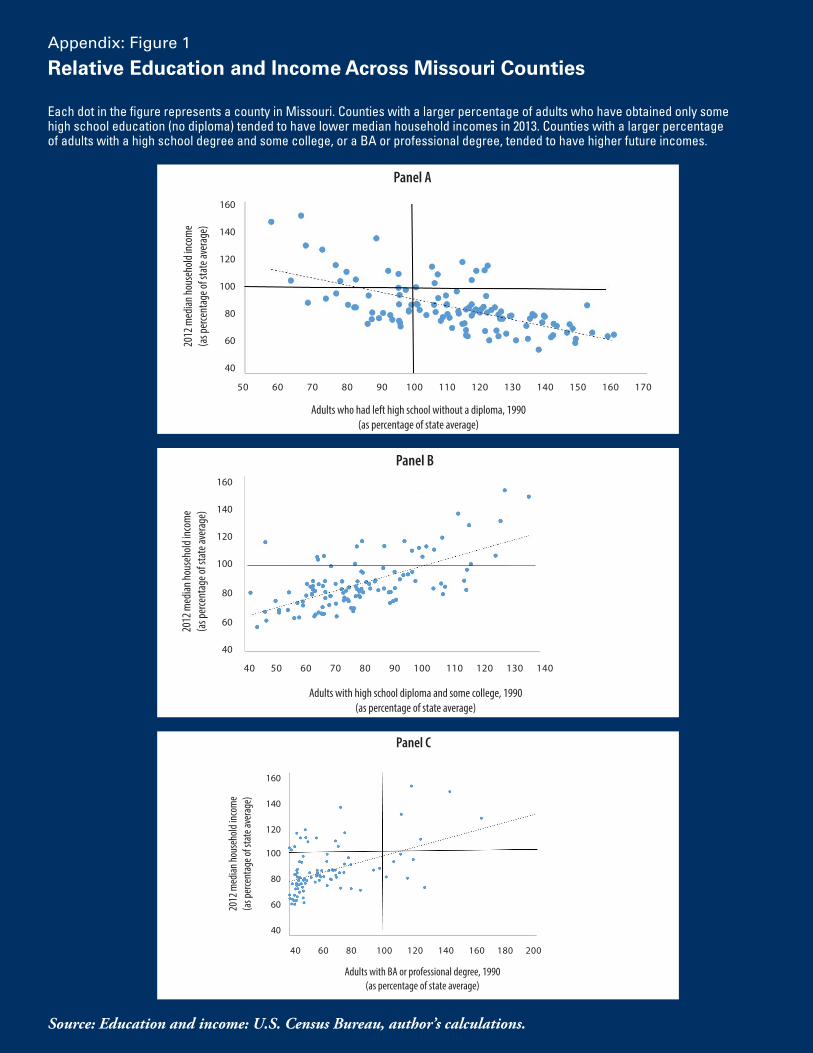
Panel A in Figure 2 is the scatter plot for the percentage of adult smokers by county among adults with some (but not a complete) high school education. The data clearly indicate that counties where a greater percentage of the adult population has only a partial high school education
in 1990 are more likely to be counties that today have a larger percentage of adults who smoke. The upward tilt in the scatter of points illustrates a positive correlation, here equal to a significant value of 0.44. When we consider the high-school-plus group of adults, as is done in Panel B, the relationship is dramatically reversed: The higher the percentage of adults with a high school degree plus some additional education, the lower is percentage of adults who today smoke. In Panel C we see a similar result: a higher percentage of the adult population with a bachelor’s degree or more in 1990 is associated with a lower occurrence of smoking in 2012. In fact, the correlations between smoking and the two respective education measures are −0.61 for the high-school-plus category and −0.42 for the bachelor’s-degree measure, both of which are statistically significant. Our evidence thus suggests that the prevalence of smoking among adults across Missouri today is at least partly related to past levels of education. At the county level, the stronger statistical association between reduced incidence of smoking and the high-school-plus category relative to the BA measure of educational attainment again suggests that focusing on expanding this level of education may yield larger returns in reducing the percentage of adults who smoke.
Next we consider the proportion of the adult population that is obese. Our obesity statistics are for 2011. Although there is some controversy, we use a widely accepted definition of obese as a body mass index (BMI) greater than 30.20 Although this criterion may overstate the percentage of adults who truly are obese, we think it a fair statement that as a general rule obesity (or even being severely overweight) is not a preferred health condition: It has been associated with a shorter life expectancy and increased medical costs. Thus we will take the view that increased levels of obesity reflect a negative health outcome.
Panel A of Figure 3 shows the county-level scatter plot for obesity among those who began but did not complete high school in 1990. Although visually the link appears somewhat weaker than that found between education and income or smoking, the correlation is a positive and significant 0.37. The positive relationship means that those counties with a greater percentage of the adult population that in 1990 completed only a portion of high school also are counties where a higher percentage of the population is obese in 2011. Once again, the relationship “flips”

May 2017
7
when we consider the link between more education and obesity. Panel B of Figure 3 shows that the correlation is now negative (−0.35 and significant). This indicates that having a greater percentage of the population with a high school degree plus some additional training reduces the likelihood of having a larger percentage of the population being categorized as obese. And it appears that increasing the percentage of the population with a bachelor’s degree or more enhances that negative relationship. In Panel C of Figure 3 there is a slightly more pronounced negative relationship between education and obesity: the correlation is −0.40 and is significant.
The JAMA study found that individuals in the bottom income quartile are relatively more likely to smoke, become obese, and not engage in much exercise. Since we have established a link between education and income, it is reasonable to argue that individuals without much education also are more likely to be obese and/or smoke. The data indicate that counties in Missouri where a greater percentage of the population has achieved a high school degree plus some college, or a bachelor’s degree or more, are counties in which the later incidence of smoking and obesity is lower compared to counties wherein a larger percentage of the adult population did not graduate from high school. The data thus suggest that increased education, on average, helps promote a healthier lifestyle.
Poverty and Social Cohesion
Income inequality has grown over time, as has the debate over its effect on numerous economic and social outcomes, from overall economic growth to a possible deterioration of the social fabric.21 Since the data for Missouri so far suggest that today’s household income and past education are related (positively), we examine the relationship between education and an outcome of income inequality: childhood poverty. Childhood poverty is calculated as the percentage of children under 18 living in poverty in 2013. Are Missouri counties where the adult population is relatively less well-educated in 1990 also those counties where childhood poverty is more prevalent in 2013?
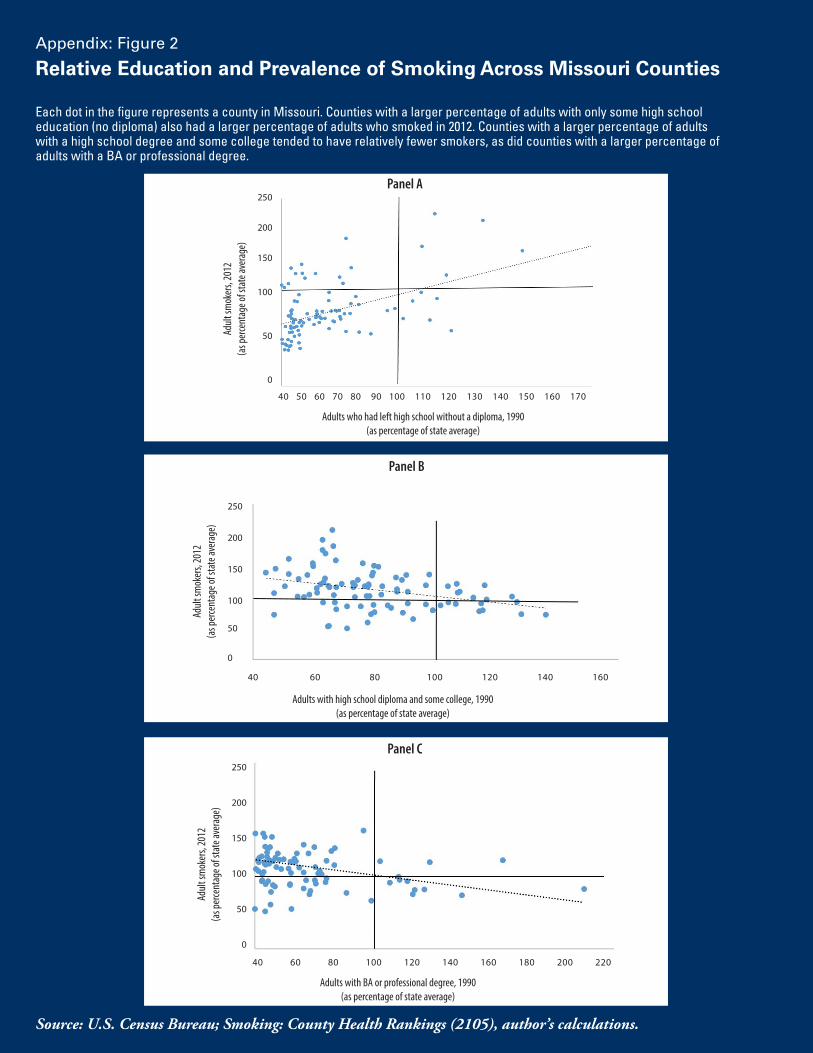
Panel A of Figure 4 shows the relationship across counties between childhood poverty and the percentage of adults who began but did not complete high school. Once again the figure clearly shows that those counties in which
a greater percentage of the population began but did not complete high school in 1990 experienced greater rates of childhood poverty in more recent times. The correlation is large (0.65) and statistically significant. As we have seen before, the positive correlation flips to a significantly negative one when we account for that part of the adult population with more than a high school diploma. In Panel B we see that the percentage of children in poverty falls as the percentage of adults with some college increases. Panel C, using the percentage of adults with a bachelor’s degree or more, shows the same negative relationship, and the correlation is identical to that found in Panel B: For the data in Panels B and C the correlation is −0.54, which is significant. The reasonable story that emerges from the data is that increasing the percentage of adults with educational levels greater than high school begets more income, which in turn reduces relative childhood poverty at the county level.
One indicator of social cohesion is the number of children living in single-parent households. There is evidence that children raised in single-parent households, all else the same, tend to fare worse in terms of future success, both economically and socially.22 What is the connection between past education and children living in single-parent households across Missouri counties?
Panel A of Figure 5 plots the less-than-high-school degree measure along with the percentage of children living in single-parent households. The most recent data for the latter variable are for 2013. The general upward slant in the scatter plot indicates that relatively lower levels of education in 1990 are associated with greater relative percentages of children living in single-parent households two decades later. The correlation between the two series is 0.34, which is statistically significant. In Panel B we plot single-parent households against the percentage of the adult population with a high school degree plus some additional training and find a negative relationship: A larger percentage of adults with more than a high school education in the past is related to an overall decline in the percentage of children in single-parent households. And though the relationship is statistically weaker (the correlation is −0.20), it remains statistically significant. When we consider the link between single-parent households and the bachelor’s-degree-or-more educational variable, there basically is no statistical relationship. As
SHOW-ME INSTITUTE I ESSAY
8
seen in Panel C, there appears to be very little relation between the two series. And even though the best-fitting line suggests a slightly positive correlation, the Spearman rank correlation is essentially zero. The results from Panels B and C in Figure 5 thus suggest that while moving from less than a high school degree to something more is important in reducing the relative percentage of single-parent households, other factors probably play a more important role once that threshold has been met. Still, the basic story is that more education, on average, reduces the future relative percentage of children living in single-parent households across counties in Missouri.
The evidence presented in this section shows that past educational attainment in a county is an important predictor of future social behaviors. To summarize, counties with relatively lower levels of education in 1990 tend to be counties that more recently have a larger percentage of adult smokers and larger percentage of the population that is obese. Counties in which a larger percentage of the adult population has begun but not completed high school also are characterized by a higher percentage of childhood poverty and children living in single-parent households. While other studies have found these outcomes associated with income, our analysis indicates that these relations hold across Missouri counties as well.
SUMMARY AND POLICY RECOMMENDATIONS
The results we have presented are suggestive: The evidence indicates quite convincingly that counties in which a large percentage of the adult population had not completed high school in 1990 are today more likely to be characterized by lower average household incomes, poor records of health choices, and less social cohesion. On the other hand, the typical county wherein the adult population in 1990 had achieved a high school diploma plus some additional training or a bachelor’s degree or more is today described by generally higher relative household incomes, better overall health, and better social outcomes.
The policy implication is that efforts to improve educational attainment at least through high school are critical to our collective economic and social future.
Another inference from our analysis is that in a world of limited resources—human as well as monetary—policymakers wishing to increase the likelihood of future economic success may well consider putting those resources to work more in increasing the percentage of the adult population with a high school degree plus some additional training rather than achieving a larger proportion of adults with a BA or more. While a more detailed analysis would be necessary to determine the veracity of this comment, our evidence suggests that increasing the percentage of the adult population who have obtained a BA or better may not produce as dramatic a result as increasing the percentage who have obtained some additional education and training beyond high school.
Gail Heyne Hafer is a Professor of Economics at St. Louis Community College–Meramec.
R.W. Hafer is a Professor of Economics and Director of the Center for Economics and the Environment at Lindenwood University and a Research Fellow at the Show-Me Institute.

May 2017
9
ENDNOTES
1. For a discussion of the debate surrounding the funding of urban and rural schools in Missouri, see McShane (2016).2. The special role that knowledge plays in explaining economic development is associated with the pioneering work of Lucas (1988) and Romer (1990). As Romer (2105) puts it, “An investment now that maintains or increases the rate of growth of the stock of knowledge will yield a high social rate of return.” 3. This discussion uses the results from the 2015 Nation’s Report Card produced by the NAEP. 4. Because it has been found that math scores in the NAEP are fairly good predictors of differences in economic success at the state level, much focus is often placed in this one test’s outcome. See Hafer (2014) for a more detailed description of NAEP scores and how they relate to economic growth across states.5. Accessed at http://www.nationsreportcard.gov/reading_math_g12_2015/#mathematics6. Costa (2015).7. Costa (2015), page 503.8. See Cutler and Lleras-Muney’s (2006, 2010). Better health is not only important in the sense that healthier individuals are more productive (fewer sick days, etc.) but healthier adults may expose their children to healthier behaviors. As Currie (2009) finds, early childhood health is an important milestone for future economic success. 9. Hernandez-Murillo and Martinek (2011).10. See Barro and Lee (2013).11. While results for standardized test scores, such as the ACT, are available at the school- district level, school districts and counties do not have the same geographical coverage. This makes comparing educational attainment and economic outcomes very difficult. And as previous research using state-level data has shown, the results of correlating either of these two measures with economic growth produces similar statistical results. 12. Our approach is supported by a more sophisticated analysis. We estimated a regression equation of median household income (by county) on the different “bins” of educational attainment by adults. Holding out the educational bin that includes those with only a high school diploma, we find that the estimated effects for those with some high school but no diploma are negative: Having a larger percentage of your population in these two bins predicts a lower than average level of household income relative to having a high school diploma. For the two bins of education greater than a high school diploma, we find that they have positive effects: High school plus some extra training and having a BA or better both lead to higher median household incomes relative to having a high school diploma. 13. The education and income data are from the U.S. Census Bureau. The social behavior data are from the 2015 edition of County Health Rankings, a joint project of the Robert Wood Johnson Foundation and the University of Wisconsin Population Health Institute. The data are for all Missouri counties plus the City of St. Louis.
14. In interpreting the figures, we will rely on “average” relationships. Most of us would probably agree that on average it is riskier to engage in certain behaviors, like mountain climbing, compared to others, like reading a book. This might well influence your advice if your child asks which activity to take up. Your advice will reflect the fact that individuals who climb mountains are statistically more likely to become hurt by this activity than book readers. That does not mean that everyone who climbs will become hurt, just like reading does not mean that you will never be hit by lightning while poring over that latest mystery novel. The observed data suggests that, on average, climbers are more likely to get hurt than book readers.15. The correlation takes values between –1 and +1. If the relative position of the two variables are similar (they have similar rankings from, say, hi to low values) then the correlation will be positive. The closer the comparative ranking the closer the correlation will be to 1. If the rankings a dissimilar, the correlation will be negative. And if the rankings are exactly the opposite, the correlation will be –1. 16. See Newman and Winston (2016). 17. See Chetty, et al. (2016). See also Currie and Hannes-Schwandt (2016) for an overview of other mortality studies.18. Our evidence should not be interpreted as a moral condemnation of certain behaviors. In the final analysis such behavior is a decision made by the individual. Even so, there is much evidence that indicates the negative effects of smoking on individual health and on the social costs of treating those individuals. The same may be said of behaviors that lead to obesity, which increases the likelihood of negative health outcomes such as diabetes. 19. For this measure the data are available for 103 counties.20. This is the BMI cutoff used by the World Health Organization. The controversy arises because the BMI may not be the best measure of body fat. Yet, as stated by the Harvard School of Public Health, “BMI is not a perfect measure, because it does not directly assess body fat. Muscle and bone are denser than fat, so an athlete or muscular person may have a high BMI, yet not have too much fat. But most people are not athletes, and for most people, BMI is a very good gauge of their level of body fat.” (https://www.hsph.harvard.edu/obesity-prevention-source/obesity-definition/obesity-definition-full-story/)21. The debate should not be considered as delineated by whether one is considered to be a liberal or a conservative. This is illustrated by the gamut of studies from Pikkety (2014) to Murray (2012).22. See Murray (2012) and the relevant citations therein.

SHOW-ME INSTITUTE I ESSAY
10
REFERENCES
Barro, Robert J., and Jong Wha Lee. 2013. “A new data set of educational attainment in the world, 1950–2010.” Journal of Development Economics, 104: 184–198.
Chetty, Raj, Michael Spencer, Sarah Abraham, Shelby Lin, Benjamin Scuderi, Nicholas Turner, Augustin Bergeron and David Cutler. 2016. “The association between income and life expectancy in the United States, 2001–2014.” Journal of the American Medical Association, 315 (16): 1750–1766.
Costa, Dora, L. 2015. “Health and the economy in the United States from 1750 to the present.” Journal of Economic Literature, 53(3): 503–570.
Currie, Janet. 2009. “Early childhood health and later economic success.” Journal of Economic Literature, 47(1): 87–122.
Currie, Janet, and Hannes Schwandt. 2016. “Morality inequality: The good news from a county-level approach.” Journal of Economic Perspectives, 30(2): 29–52.
Cutler, David M., and Adriana Lleras-Muney. 2006. “Education and health: Evaluating theories and evidence.” National Bureau of Economic Research Working Paper No. 12352. www.nber.org/papers/w12352.
Cutler, David M., and Adriana Lleras-Muney. 2010. “Understanding differences in health behaviors by education.” Journal of Health Economics, 29(1): 1–28.
Glaeser, Edward L. 2016. “If you build it: Myths and realities about America’s infrastructure spending,” City Journal. Available at: http://www.city-journal.org/html/if-you-build-it-14606.html.
Hafer, R.W. 2014. “Are education and economic growth related?” Essay: Show-Me Institute. Available at: www.showmeinstitute.org/publication/local-control/are-education-and-economic-growth-related
Hernandez-Murillo, Ruben., and Christofer J. Martinek. 2011. “The effects of education on health.” Federal Reserve Bank of St. Louis Economic Synopses No. 11.
Lucas, Robert L., Jr. 1988. “On the mechanics of economic development.” Journal of Monetary Economics, 22(1): 3–42.
McShane, Michael Q. 2016. “Rural school reform.” Essay, Show-Me Institute (April). Available at http://showmeinstitute.org/publication/educational-freedom-miscellaneous/rural-school-reform
Murray, Charles. 2012. Coming Apart: The State of White America, 1960–2010. New York: Crown Forum.
Newman, Katherine S., and Hella Winston. “From high school straight to a career.” The New York Times, (April 15, 2016): A25.
Pikkety, Thomas. 2014. Capital in the Twenty-First Century. Cambridge: Harvard University Press.
Romer, Paul. 1990. “Endogenous technological change.” Journal of Political Economy, 98(5): 71–102.
Romer, Paul. 2015. “My Paper ‘Mathiness in the Theory of Economic Growth.’” Available at: https://paulromer.net/mathiness/.
May 2017
11
Appendix: Figure 1 Relative Education and Income Across Missouri Counties
Each dot in the figure represents a county in Missouri. Counties with a larger percentage of adults who have obtained only some high school education (no diploma) tended to have lower median household incomes in 2013. Counties with a larger percentage of adults with a high school degree and some college, or a BA or professional degree, tended to have higher future incomes.
Source: Education and income: U.S. Census Bureau, author’s calculations.
Panel A20
12 m
edian
hous
ehold
inco
me
(as p
erce
ntag
e of s
tate
aver
age)
160
140
120
100
80
60
40
50 60 70 80 90 100 110 120 130 140 150 160 170
Adults who had left high school without a diploma, 1990(as percentage of state average)
Panel B160
140
120
100
80
60
40
40 50 60 70 80 90 100 110 120 130 140
Adults with high school diploma and some college, 1990(as percentage of state average)
2012
med
ian ho
useh
old in
com
e(a
s per
cent
age o
f sta
te av
erag
e)
Panel C
2012
med
ian ho
useh
old in
com
e(a
s per
cent
age o
f sta
te av
erag
e)
160
140
120
100
80
60
40
40 60 80 100 120 140 160 180 200
Adults with BA or professional degree, 1990(as percentage of state average)
SHOW-ME INSTITUTE I ESSAY
12
Appendix: Figure 2 Relative Education and Prevalence of Smoking Across Missouri Counties
Each dot in the figure represents a county in Missouri. Counties with a larger percentage of adults with only some high school education (no diploma) also had a larger percentage of adults who smoked in 2012. Counties with a larger percentage of adults with a high school degree and some college tended to have relatively fewer smokers, as did counties with a larger percentage of adults with a BA or professional degree.
Source: U.S. Census Bureau; Smoking: County Health Rankings (2105), author’s calculations.
Panel A
Adult
smok
ers,
2012
(as p
erce
ntag
e of s
tate
aver
age)
250
200
150
100
50
0
40 50 60 70 80 90 100 110 120 130 140 150 160 170
Adults who had left high school without a diploma, 1990(as percentage of state average)
Panel B
Adult
smok
ers,
2012
(as p
erce
ntag
e of s
tate
aver
age)
250
200
150
100
50
0
40 60 80 100 120 140 160
Adults with high school diploma and some college, 1990(as percentage of state average)
Panel C
Adult
smok
ers,
2012
(as p
erce
ntag
e of s
tate
aver
age)
250
200
150
100
50
0
40 60 80 100 120 140 160 180 200 220
Adults with BA or professional degree, 1990(as percentage of state average)

May 2017
13
Appendix: Figure 3
Relative Education and Incidence of Obesity Across Missouri Counties
Each dot in the figure represents a county in Missouri. Counties with a larger percentage of adults with only some high school education (no diploma) also had a larger percentage of adults who were obese in 2011. Counties with a larger percentage of adults with a high school degree and some college tended to have a smaller percentage of adults who were obese in 2011, as did counties with a larger percentage of adults with a BA or professional degree.
Source: Education: U.S. Census Bureau; Obesity: County Health Rankings (2105), author’s calculations.
Panel A
Obes
e Adu
lts, 2
012
(as p
erce
ntag
e of s
tate
aver
age)
140
130
120
110
100
90
80
70
60
40 60 80 100 120 140 160 180
Adults who had left high school without a diploma, 1990(as percentage of state average)
Panel B
Obes
e Adu
lts, 2
012
(as p
erce
ntag
e of s
tate
aver
age)
140
130
120
110
100
90
80
70
60
40 60 80 100 120 140 160 180
Adults with high school diploma and some college, 1990(as percentage of state average)
Panel C
Obes
e Adu
lts, 2
012
(as p
erce
ntag
e of s
tate
aver
age)
140
130
120
110
100
90
80
70
60
40 60 80 100 120 140 160 180 200 220
Adults with BA or professional degree, 1990(as percentage of state average)
SHOW-ME INSTITUTE I ESSAY
14
Appendix: Figure 4 Relative Education and Incidence of Childhood Povery Across Missouri Counties Each dot in the figure represents a county in Missouri. Counties with a larger percentage of adults with only some high school education (no diploma) also had a larger percentage of children living in poverty in 2013. Counties with a larger percentage of adults with a high school degree and some college tended to have a smaller percentage of children living in poverty, as did coun-ties with a larger percentage of the adults with a BA or professional degree.
Source: Education: U.S. Census Bureau; Childhood Povery: County Health Rankings (2105), author’s calculations.
Panel ACh
ildre
n livi
ng in
pove
rty, 2
013
(as p
erce
ntag
e of s
tate
aver
age)
280
230
180
130
80
30
40 60 80 100 120 140 160 180 200 220
Adults who had left high school without a diploma 1990(as percentage of state average)
Panel B
Child
ren l
iving
in po
verty
, 201
3(a
s per
cent
age o
f sta
te av
erag
e)
280
230
180
130
80
30
40 60 80 100 120 140 160
Adults with high school diploma and some college, 1990(as percentage of state average)
Panel C
Child
ren l
iving
in po
verty
, 201
3(a
s per
cent
age o
f sta
te av
erag
e)
280
230
180
130
80
30
40 60 80 100 120 140 160 180 200 220
Adults with BA or professional degree, 1990(as percentage of state average)

May 2017
15
Appendix: Figure 5 Relative Education and Percentage of Single-Parent Households Across Missouri Counties Each dot in the figure represents a county in Missouri. Counties with a larger percentage of adults with only some high school education (no diploma) also had a larger percentage of children living in single-parent households in 2013. Counties with a larger percentage of adults with a high school degree and some college had a smaller percentage of children living in single-parent households. There is a slightly positive though statistically insignificant relationship between the percentage of children living in single-parent households and the percentage of adults with a BA or professional degree.
Source: Education: U.S. Census Bureau; Single-parent Households: County Health Rankings (2105), author’s calculations.
Panel ACh
ildre
n in s
ingle-
pare
nt ho
useh
olds,
2013
(as p
erce
ntag
e of s
tate
aver
age)
200
180
160
140
120
100
80
60
40
50 60 70 80 90 100 110 120 130 140 150 160 170
Adults who had left high school without a diploma, 1990(as percentage of state average)
Panel B
Child
ren i
n sing
le-pa
rent
hous
ehold
s, 20
13(a
s per
cent
age o
f sta
te av
erag
e)
200
180
160
140
120
100
80
60
40
40 60 80 100 120 140 160
Adults with high school diploma and some college, 1990(as percentage of state average)
Panel C
Child
ren i
n sing
le-pa
rent
hous
ehold
s, 20
13(a
s per
cent
age o
f sta
te av
erag
e)
200
180
160
140
120
100
80
60
40
40 60 80 100 120 140 160 180 200 220
Adults with BA or professional degree, 1990(as percentage of state average)

5297 Washington Place I Saint Louis, MO 63108 I 314-454-0647
Visit Us:
showmeinstitute.org
Find Us on Facebook:
facebook.com/showmeinstitute
Follow Us on Twitter:
twitter.com/showme
3645 Troost Avenue I Kansas City, MO 64109 I 816-561-1777
Watch Us on YouTube:
youtube.com/showmeinstitute