Embed Size (px)
Citation preview

Hawaii Energy Facts & FiguresHawaii Energy Facts & Figures May 2015May 2015
State of Hawaii Department of Business, Economic Development, and Tourism Hawaii State Energy Office · energy.hawaii.gov
Hawaii Energy Overview
Electric U li es
Electric U li es: Customers & Rates
Renewable Energy: Renewable Energy: RPS Bioenergy Electric Vehicles Geothermal Hydropower Oahu‐Maui Grid Tie Ocean Smart Grid Solar Wind Permi ng
Energy Efficiency: Energy Efficiency Por olio Standards Energy Performance Contrac ng State of Hawaii Agencies Lead By Example Leadership in Energy and Environmental Design ENERGY STAR® Buildings Hawaii Green Business Program GreenSun Hawaii Loan Program End Notes/References

Although Hawaii’s electricity produc on and costs are s ll heavily reliant on oil, energy efficiency and renewable energy have been increasing4 in all coun es.
Hawaii’s electricity prices are three mes higher than the U.S. average.2 3
1 | DBEDT Hawaii State Energy Office |Hawaii Energy Facts & Figures, May 2015
Hawaii Energy Overview
Hawaii is the only state that depends so heavily on petroleum for its energy needs. Whereas less than 1% of electricity in the na on is generated using oil, in 2013 Hawaii relied on oil for 70% and on coal for 14% of its electricity
genera on.1
Hawaii Electricity Produc on by Source, 2013
U.S. Electricity Produc on by Source, 2013
In Hawaii, both electricity and gasoline prices follow the price of petroleum. The graph below shows the prices of Brent crude oil, gasoline, and electricity.5

2 | DBEDT Hawaii State Energy Office |Hawaii Energy Facts & Figures, May 2015
Hawaii Energy Overview Electricity and gasoline are just part of Hawaii’s energy picture. Large quan es of jet fuel are also used (this is different from the mainland, where most petroleum is used for ground transporta on). In Hawaii, roughly equal amounts of petroleum are used for electricity produc on, ground transporta on, and commercial avia on, with the rest used for marine transport, military, and other uses.6
Total petroleum use 2014 (million barrels per year)7
34.3 Fuel for electricity produc on (million gallons per year)8
394
Total petroleum use 2014 (million gallons per year)9
1442 Fuel for air transporta on (i.e. jet fuel) (million gallons per year)10
411
Hawaii’s rank among 50 states for energy prices11
1 Fuel for ground transporta on (million gallons per year)12
448
Electric Utilities Each of Hawaii’s six main islands has its own electrical grid, not connected to any other island. Hawaiian Electric Company (HECO) and its subsidiaries, Maui Electric (MECO) and Hawaii Electric Light Company (HELCO), serve about 95% of the State’s popula on.13 The island of Kauai is served by Kauai Island U lity Coopera ve (KIUC). 14 15

Electric Utilities
3 | DBEDT Hawaii State Energy Office |Hawaii Energy Facts & Figures, May 2015
COMPETITIVE BIDDING
Hawaii’s electric u li es deliver electricity generated with their own units as well as power generated by Independent Power Producers (IPPs). If new or replacement genera on is required, HECO, MECO, and HELCO are required to follow the “Compe ve Bidding Framework” for new genera on with capaci es greater than 5 MW (Oahu) or 2.72 MW (MECO, HELCO), or receive a waiver of the compe ve bidding requirements from the Hawaii Public U li es Commission (PUC).16 Current procurement ac vi es include:17
HECO: A Request for Proposals (RFP) for 600‐800 gigawa ‐hours (or 200 MW) of as‐available renewable electricity for use on Oahu is being redra ed per a July 2013 Order from the PUC. The redra ed RFP will remove references to the Lanai Wind Project and eliminate solicita ons for an undersea transmission cable. Also in July 2013, the PUC opened a new docket to examine whether the cable may be in the public interest.
MECO: On July 11, 2013, the PUC closed the compe ve bidding proceedings to acquire up to 50MW of new, renewable firm dispatchable capacity genera on resources on the island of Maui. The commission will consider future requests from MECO to open another proceeding to conduct a RFP for firm genera on upon a demonstra on of need and a plan focused on customer needs.
HELCO: In February 2015, HELCO announced the selec on of Ormat18 for a new 25 MW geothermal power plant on the Island of Hawaii. HELCO and Ormat will be commencing nego a on to contract for the sale of new power to be generated from this new geothermal power plant and submit such agreement to the PUC for review and approval.
CONVERTING MW OF CAPACITY INTO MWh OF ELECTRICITY PRODUCTION
Generators do not always produce at full capacity, due to resource limits (sun not shining, wind not blowing), maintenance requirements, or power not needed.
The “capacity factor” is the percent of me a facility is expected to operate at full capacity (or its equivalent, in terms of energy produc on) over a one year period. For example, if a facility has a capacity of 1 MW and a capacity factor of 100%, it will generate (1MW)* (24 hours/day)* (365 days/year) = 8,760 MWh per year.
CAPACITY FACTOR ASSUMPTIONS FOR RENEWABLE RESOURCES
Capacity Factors (assumed)*
MWh produced
per MW capacity19
Biomass‐Direct Firing 80% 7,000
Wind (Oahu, Hawaii, Kauai)** 35% 3,100
Wind (Lanai, Molokai) 40% 3,500
Wind (Maui) 45% 3,900
Geothermal 96% 8,400
Hydro 44% 3,900
Solar (roo op) 23% 2,000
Solar (u lity) 24% 2,100
Ocean 35% 3,100
Capacity factors presented in this table are assump ons used by Booz Allen, under contract to the Na onal Renewable Energy Laboratory, in the Hawaii Clean Energy Ini a ve Scenario Analysis, Appendix C, Slide 26. March 2012. *Actual capacity factors may vary from the assump ons presented here. **The Pakini Nui wind farm (on Hawaii island) generally has an annual capacity factor of over 60%.

4 | DBEDT Hawaii State Energy Office |Hawaii Energy Facts & Figures, May 2015
Electric Utilities: Customers & Rates
Residen al electricity use, rates, and average bills are shown below for 2013 and 2012. In general, rates were fairly stable and electricity use declined, so bills also declined.20
Residen al Electricity Use, Rates, and Average Bill, 2013
Oahu Hawaii Kauai Maui Molokai Lanai State
Average use (kWh/month)
523 473 464 557 329 430 514
Average cost per kWh
$ 0.35 $ 0.42 $ 0.44 $ 0.38 $ 0.46 $ 0.46 $ 0.37
Average monthly bill
$ 181 $ 199 $ 205 $ 211 $ 153 $ 199 $ 189
Residen al Electricity Use, Rates, and Average Bill, 2012
Oahu Hawaii Kauai Maui Molokai Lanai State
Average use (kWh/month)
561 494 465 574 345 413 543
Average cost per kWh
$ 0.35 $ 0.42 $ 0.45 $ 0.39 $ 0.46 $
0.47 $ 0.37
Average monthly bill
$ 197 $ 210 $ 209 $ 222 $ 159 $ 192 $ 203
FEED ‐ IN TARIFF (FIT)
The FIT queue is now closed.21 Prior to this, renewable electricity suppliers with generators smaller than 5 MW would be eligible to par cipate in the HECO Companies’ Feed in Tariff,22 supplying as‐available power to the u lity at constant, contracted rates over 20 years.
Feed‐in Tariff (FIT) Rates, Hawaiian Electric Companies' Service Areas
Tier Island
Photovoltaics (PV) Concentra ng Solar
Power (CSP) On‐Shore Wind In‐line Hydro
rate (¢/kWh)
size limit
rate (¢/kWh)
size limit
rate (¢/kWh)
size limit
rate (¢/kWh)
size limit
1 All Islands
21.8 * 20 kW
26.9 * 20 kW 16.1 20 kW 21.3 20 kW
27.4 ** 33.1 **
2
Oahu 18.9 *
500 kW 25.4 *
500 kW 13.8 100 kW 18.9 100 kW 23.8 ** 27.5 **
Maui & Hawaii
18.9 * 250 kW
25.4 * 500 kW 13.8 100 kW 18.9
100 kW 23.8 ** 27.5 **
Lanai & Molokai
18.9 * 100 kW
25.4 * 100 kW 13.8 100 kW 18.9
100 kW 23.8 ** 27.5 **
3
Oahu 19.7 *
5 MW 31.5 *
5 MW 12.0 5 MW ‐‐ ‐‐ 23.6 ** 33.5 **
Maui & Hawaii
19.7 * 2.72 MW
31.5 * 2.72 MW ‐‐ ‐‐ ‐‐ ‐‐
23.6 ** 33.5 ** * With tax credit of 35%. ** With tax rebate of 24.5%.
HECO and the Independent Observer submi ed a joint plan to the PUC for administering the FIT queues in
September 2013. The joint plan was accepted by the PUC on 12/5/14.23 Future revisions or modifica ons
to the FIT program will be addressed in Docket No. 2014‐0192 or 2014‐0183.
FIT aggregate limits: Oahu: 60 MW; Big Island: 10 MW; Maui, Lanai, Molokai (combined): 10 MW

5 | DBEDT Hawaii State Energy Office |Hawaii Energy Facts & Figures, May 2015
Electric Utilities: Customers & Rates NET ENERGY METERING24
Customers who generate renewable solar, wind, hydro, or biomass energy on their own property may be eligible for “net energy metering” (NEM) to offset their own use.
If the customer uses more electricity than is produced, the customer pays for that net amount.
If the customer produces more electricity than used, the customer pays a minimum bill (e.g. $17 for Oahu residen al customers) or customer charge, and excess credits are carried forward to the next month, for up to 12 months.
About 12% of Hawaiian Electric Companies residen al electric u lity customers had roo op PV systems as of December 2014.25
On August 26, 2014, under PUC Docket 2001‐0206, the HECO companies delivered to the PUC the Reliability Standards Working Group distributed genera on interconnec on plan (DGIP). The DGIP has been merged into the Distributed Energy Resource (DER26) Docket (PUC Docket No. 2014‐0192) along with other relevant proceedings, and is presently under review. Among other things, the DER should “include ac onable strategies and implementa on plans for distribu on system upgrades and u liza on of advanced inverter technical func onality to enable distribu on circuit solar PV penetra ons to be increased over me in a safe and reliable manner.”
KIUC: New interconnec ons use Schedule Q27 (100 kW or less) and “NEM Pilot”28 (200 kW or less; 20¢/kWh for excess).
Sample Loca onal Value Maps for HECO, HELCO, and MECO Service Territories (h p://www.hawaiianelectric.com/portal/site/
heco/menuitem.508576f78baa14340b4c0610c510b1ca/?vgnetoid=47a22314e39e8310VgnVCM10000005041aacRCRD&vgnextchannel=f1230488c7d00410VgnVCM10000005041aacRCRD&vgnex mt=default)

6 | DBEDT Hawaii State Energy Office |Hawaii Energy Facts & Figures, May 2015
Renewable Energy “Renewable Energy”29 is energy from:
Sun (i.e. solar)
Wind
Falling water (i.e. hydropower)
Bioenergy, including biomass (e.g. crops, agricultural and animal residues, municipal and other solid waste); biofuels, and biogas
Geothermal
Ocean water, including ocean thermal energy conversion (OTEC) and wave energy
Hydrogen produced from renewable energy sources
In 2014, approximately 21.3% of Hawaii’s electricity was generated from renewable sources. Renewable electricity produc on is primarily from bioenergy, wind, and geothermal, with solar, especially distributed photovoltaics, increasing rapidly.30
Renewable resource poten al, statewide, is greater than current electricity demand.31

Renewable Energy Electricity must be used, transmi ed, or stored at the instant it is produced. If renewable energy is not used when it’s produced, it is usually curtailed (i.e., not used).
Baseload genera on facili es produce energy at a constant rate. They generally do not react (ramp up or ramp down) quickly.
Dispatchable (cycling and peaking) units produce power when called upon by the u lity, to fill gaps between produc on and load; they can ramp up and down quickly.
Independent power producer contracts may govern which units are brought on‐line (dispatched) first when load is increasing, and which are taken off‐line first, when load is decreasing. A new facility generally will not displace an older facility’s place in the dispatch order, unless there is a technical reason for the u lity to do so.
Intermi ent (as‐available) energy, such as from photovoltaic and wind independent power producers, may be curtailed at mes of low load. The yellow line in the graph shows solar systems, on a sunny day, reducing mid‐day demand for electricity
from other sources.
Electric vehicle charging, if managed so that it occurs at mes of low load, can use energy that otherwise may have been curtailed.
7 | DBEDT Hawaii State Energy Office |Hawaii Energy Facts & Figures, May 2015
Percent of Hawaii’s electricity from renewable sources (2014)
21.3% Renewable genera on required (i.e. Renewable Por olio Standard, “RPS”) by 12/31/201532
15%
Renewable genera on required (RPS) by 12/31/2020
25% Renewable genera on required (RPS) by 12/31/2030 40%
“Levelized Cost of Energy” is the price per kilowa ‐hour required for an energy project to break even; it does not include risk or return on investment. Costs (land, construc on, labor) are different for every project.
The Transparent Cost Database33 compiles cost informa on from studies and projects across the United States. The box & whisker chart below shows the data distribu on using five numbers: The minimum (bo om of the whisker), lowest 25% (below green box), median, highest 25% (above blue box), and maximum point (top of the whisker). Where fewer than three data points are available, the individual data points (green diamonds) are shown. Yellow diamonds are US Department of Energy es mates.
Maximum
Minimum
Median
Upper 25%
Lower 25%
Percent of Peak Load

Renewable Energy: RPS
8 | DBEDT Hawaii State Energy Office |Hawaii Energy Facts & Figures, May 2015
Renewable Por olio Standard (“RPS”) Compliance34
“The Hawaiian Electric Companies’ RPS Status Report is filed annually and calculates the RPS percentage based on total sales for the previous calendar year in accordance with the RPS law. This RPS Compliance metric es mates the percent of sales that is represented by renewable energy. This metric approximates how the RPS will be calculated from 2015 forward when electrical savings from energy efficiency and solar water hea ng will not be counted towards achievement of RPS compliance.”
System Renewable Energy (“System RE”)35
“The System Renewable Energy metric differs from the Renewable Por olio Standard because it es mates the percent of total net genera on that is represented by renewable energy rather than being based on sales. Net genera on is the amount of electricity generated and transmi ed to the u lity grid from the source (i.e., power plant). Genera on from independent power producers (“IPPs”) and u lity power plants is recorded at the net genera on level. Sales are lower than the net genera on due to losses in transmi ng the electricity from the source to the customers. Therefore, the System Renewable Energy will result in values lower than the RPS.”
Total Renewable Energy (“Total RE”) 36
“The Total Renewable Energy metric differs from the RPS because it is based on total energy and not sales. Similar to the RPS, the contribu on from customer‐sited renewable genera on is included as part of the renewable energy generated and must also be added to the total net genera on of the system.”

Bioenergy
9 | DBEDT Hawaii State Energy Office |Hawaii Energy Facts & Figures, May 2015
“Bioenergy” includes both electricity genera on and fuel produc on from biomass.
Biomass is plant and animal ma er, including energy crops, wood, grasses, algae, vegetable oils, and agricultural and municipal wastes. Bioenergy produc on poten al in Hawaii depends on the availability of land and feedstock; CO2 sources (for algae); markets and values for primary products (electricity, fuels) and by‐products (animal feed); and overall revenues compared to costs.
Fuel ethanol could be blended with petroleum‐based fuels. Hawaii’s energy consump on es mates for major energy sources in 2012 are shown below:
Coal (Thousand Short Tons) 803
Natural Gas (Billion cubic feet) 3
Petroleum (Thousand Barrels) 42,359
Hydroelectric Power (Million Kilowa ‐Hours) 115
Fuel Ethanol (Thousand Barrels) 1,250
Hawaii’s Energy Consump on Es mates37
Bioenergy facili es:38
Kauai: ‐ Green Energy is planning to build a facility that will produce 6.7 MW from woodchips. ‐ Pacific Light & Power is planning to develop a High Solids Anaerobic Diges on project that will produce 4.5 MW from organic material.
Oahu: ‐ H‐POWER39 produces 10%40 of Oahu’s electricity from more than 600,000 tons of waste. ‐ Hawaii Gas’ Campbell Industrial Park Synthe c Natural Gas Facility produces 0.1 MGY and aims to increase the renewable components of its gas supply. ‐ HECO’s Campbell Industrial Park Genera ng Sta on simple‐cycle unit produces 110 MW from sustainable biodiesel. ‐ HECO is planning to own and operate a biofuel capable power plant at Schofield Barracks that will produce 50 MW. ‐ Honolulu Interna onal Airport is planning to build 4 generators for their Emergency Power Facility that will produce 10 MW from renewable fuel.
Maui: ‐ Hawaiian Commercial and Sugar’s (HC&S) 2 steam plants and 3 hydroelectric plants produces 16 MW from renewable crop sources. ‐ Maui County has contracted for an Integrated Waste Conversion and Energy Project that will produce at least 1.5 MW.41 ‐ Maui Electric Co. is planning to develop a Mahinahina Energy Park that will produce 4.5‐6 MW energy from sorghum or other energy crops.
Hawaii Island: Hu Honua is planning to develop biomass generators that will produce 21.5MW from eucalyptus biomass.

Bioenergy
10 | DBEDT Hawaii State Energy Office |Hawaii Energy Facts & Figures, May 2015
Waste materials (such as used cooking oil) and by‐products from food, feed, or fiber produc on, although limited in
quan ty, are o en the first bioenergy feedstocks due to their rela vely low cost and the need for reduced waste
management costs.
Since biodiesel fuel imports for electricity produc on began in 2010, the rela ve cost of the imported biodiesel fuel has been significantly higher than for the fossil‐based fuels used for electricity genera on in Hawaii.42 In December 2014, fuel oil averaged $108.22/bbl, diesel fuel averaged $122.02/bbl, and biodiesel averaged $210.11/bbl.43 Crops may also be cul vated to produce biomass materials (oils, fiber, sugar) usable for electricity or fuel produc on.
Studies conducted in 2010 indicate that 136,000 suitable acres could be available without displacing current farming in
Hawaii; with biomass produc on of 10 ‐ 20 tons of fiber per acre per year, poten al would be about 1.4 ‐ 2.7 million
tons of biomass per year.44 As a reference, two million tons of biomass, if burned in conven onal biomass combus on
processes, would generate energy equivalent45 to two million barrels (84 million gallons) of oil.
Algae has also been receiving a en on, due to high yields per acre and poten al use of CO2. The 8.3 million tons46 of
CO2 produced by large energy facili es (power plants and refineries) in Hawaii could theore cally support the
produc on of over 0.56 million gallons of oil per year.
Facility Input (feedstocks) Output (products) Produc on Capacity
Aina Koa Pono 1. Remove invasive species. 2. Plant crops.
Renewable diesel, gasoline, biochar
16‐24 million gallons per year (mgy) (planned)
Big Island Biodiesel Used cooking oil, grease trap waste, crop oils
Biodiesel, glycerin, animal feed
5 mgy (built)
Cellana Algae Algae oil, animal feed 2500+ gallons per year per acre by 2018 (built)
Hawaii BioEnergy, LLC Renewable Fuels Project
Eucalyptus, energy grasses, other
Renewable fuel oil, jet fuel, gasoline; feeds, fer lizers, electricity possible
Fuel oil replacement: 10‐20 mgy (planned)
Hawaii Gas Renewable Natural Gas (RNG) Plant
Animal and plant fats and oils
Renewable methane, hydro‐gen, propane
1 mgy (built)
Kauai Algae Farm Algae Algae oil TBD (built)
Pacific Biodiesel Honolulu Plant Local feedstock and cooking oil
Biodiesel 1 mgy (built)
Hawaii Biofuel Projects47
Biofuel, a renewable energy source that can be stored and transported in a manner similar to fossil fuels, can o en be used in exis ng equipment and be blended with petroleum fuels. One ton of biomass replaces approximately one barrel of oil.
Hawaii’s current use of petroleum‐based fuels (million gallons/yr)
1,800 Algae oil yields demonstrated on Kauai48 2000
gal/acre
Hawaii’s current cost per gallon of biofuels49 $5 Hawaii’s poten al liquid biofuel waste produc on (mil gal/yr)50
97
Hawaii’s current cost per kWh for biofuel generated51
60¢/kWh Hawaii’s poten al ethanol produc on from energy crops52
1202

Hawaii EV Dealers by County
Electric Vehicles
11 | DBEDT Hawaii State Energy Office |Hawaii Energy Facts & Figures, May 2015
An electric vehicle (EV) uses electricity in place of gasoline, reducing the need for petroleum‐based fuel. Since EVs can use electricity produced from renewable resources available in Hawaii (i.e. sun, wind, hydropower, ocean energy, geothermal energy), the transi on from gasoline fueled vehicles to EVs supports Hawaii’s energy independence goals.
Based on statewide averages, the amount of fossil fuel used to power an electric vehicle in Hawaii is 31% less than the fossil fuel required to power a similar gasoline‐fueled vehicle.53 This is expected to get even be er as renewable energy increases in Hawaii.
Registered EVs and Public Charging Sta ons in Hawaii, May 201554
County Electric Vehicles
Level 255 Charging Sta on
Ports
Level 356 Charging Sta on
Ports
Total Ports
Oahu 2,571 244 5 249
Maui 629 68 35 103
Hawaii 160 51 2 53
Kauai 118 32 1 33
Total statewide 3,479 395 43 438
Fuel cost comparisons show approximate savings between internal combus on engine and electric vehicles. The example above shows that fuel costs are lower for the Nissan LEAF than for a comparable gasoline fueled vehicle.
Fuel Cost Comparison
Vehicle 2014 Nissan Versa
2014 Honda Civic
2014 Nissan LEAF59
Fuel Type Gasoline Gasoline Electricity
Miles Per Gallon (MPG) 30 mpg Combined 324 miles total range
35mpg Combined 462 miles total range
114 Combined MPG 84 miles total range
Fuel Costs $ 4.25/gallon $ 4.25/gallon Electricity: $ 0.38/kWh
Cost to Drive 25 Miles $ 3.54 $ 3.04 $ 2.85
Fuel Cost per Year60 $ 1,700 $ 1,450 $ 1,400
County Nissan LEAF
GM/ Chevy Volt
Mitsubishi iMiEV
Toyota plug‐in Prius
Ford Focus, C‐MAX, Fusion
BMW i3
Cadillac ELR
Porsche Panamera S E‐hybrid
Tesla
Oahu 3 3 1 3 4 1 1 1 1
Maui 1 1 0 1 1 0 0 0 0
Hawaii 1 1 0 2 0 0 0 0 0
Kauai 1 1 0 1 1 0 0 0 0
State of Hawaii
6 6 1 7 6 1 1 1 1
Kia (es mated summer 2015)
3
1
2
1
7

EV Quick Facts
EVs on the Move
EVs have a greater ini al purchase price58 than comparable gasoline‐fueled vehicles. Most experts, including Hawaii’s auto dealers, believe that widespread acceptance of EVs will grow as a full ba ery charge provides greater driving range and the cost of EVs more closely matches the cost of conven onal internal combus on engine (ICE) vehicles.
The first car to arrive in Hawaii was Electric.61 Year 1899
Amount of energy a fully charged Nissan LEAF has poten al to tap
24kWh
Best temperature range to operate lithium ion ba eries (most common EV ba eries today).
68°‐ 95° Fahrenheit
Hawaii ranks second in the na on behind California in the number of EVs registered in the state registered light cars and trucks in Hawaii are Electric.62
4.2 out of every 1,000 registered light cars and trucks in Hawaii are EV
Cost for a government or commercial property owner to install a Level 2 charging sta on is
Approximately $6,000‐$8,000 per sta on.
A rela vely simple project in Hawaii can range from
$4,000 to $25,000; however, prices vary
considerably.63
Electric Vehicles
12 | DBEDT Hawaii State Energy Office |Hawaii Energy Facts & Figures, May 2015
Hawaii’s electric vehicle policies and incen ves include:
Free parking is provided in state and county government lots, facili es, and at parking meters. (Act 168 of 2012, Hawaii Revised Statutes, 291‐71, Note)
Vehicles with EV license plates are exempt from High Occupancy Vehicle lane restric ons. (Act 168 of 2012, Hawaii Revised Statutes, 291‐71, Note)
Parking lots with at least one hundred public parking spaces are required to have at least one parking space, equipped with an EV charging system, reserved exclusively for EVs. (Hawaii Revised Statutes 291‐71)
Non‐EVs parked in a space designated and marked as reserved for EVs shall be fined not less than $50 nor more than $100. (Hawaii Revised Statutes 291‐72)
Hawaiian Electric Co. offer EV Time of Use Rates designed to incen vize customers, through lower rates, to charge their EVs during off‐peak mes of day.
Mul ‐family residen al dwellings or townhomes cannot prohibit the placement or use of EV charging systems altogether. (Hawaii Revised Statutes, 196‐7.5)
EV Sta ons Hawaii
The Hawaii State Energy Office developed a mobile app designed to help drivers locate publicly available EV charging sta ons statewide. EV Sta ons Hawaii helps drivers pinpoint charging sta ons as well as provide detailed informa on of the sta on giving them the confidence that they can recharge while on the road. The free app is available for Apple and Android smartphones and mobile devices.
h p://energy.hawaii.gov/testbeds‐ini a ves/ev‐ready‐program/ev‐sta ons‐hawaii‐mobile‐app

Con nued geothermal explora on will contribute to be er understanding of Hawaii’s geothermal resources. Ormat is exploring on Maui, focusing on the southwest ri zone of Haleakala, with par al funding from the U.S. Department of Energy (USDOE). The University of Hawaii (UH) is also exploring ri zones on Hawaii Island using a non‐invasive technique called magnetotellurics designed to detect subsurface electrical conduc vity. The Hawaii Play Fairway Project, managed by UH and supported by USDOE, will compile and integrate all geothermal‐relevant data across the state into a map showing the probability of encountering a resource in the subsurface. In essence, this will provide the first statewide geothermal resource assessment conducted since the late 1970s.
Geothermal resources are difficult to characterize without explora on and drilling since Hawaii’s high‐temperature resources are usually more than a mile beneath the surface. However, es mates from explora on efforts in the 1970s and ‘80s indicate that there may be more than 1,000 MW of geothermal reserves65 (recoverable heat at drillable depths) on Maui and Hawaii islands, which would be sufficient to collec vely power Maui, Hawaii Island, and about one quarter of Oahu or, alterna vely, about 60% of Oahu’s energy needs. Reaching that level of produc on would require interconnec on of the islands’ grids. Geothermal electricity is cheaper than that produced from petroleum fuels in Hawaii, and also generally cheaper than other forms of renewable electricity.
Geothermal
13 | DBEDT Hawaii State Energy Office |Hawaii Energy Facts & Figures, May 2015
Map of Geothermal Resource Areas (Source: GeothermEx, 2005)
Hawaii’s single geothermal power plant, Ormat’s Puna Geothermal Venture (PGV) facility located on the Island of Hawaii, produced 255 gigawa ‐hours (GWh) in 2014 which was approximately 24% of the total electricity distributed on Hawaii Island in 201464. The PGV facility, which began opera ng in 1993, produces both baseload and dispatched electricity.
In August 2014, the Hawaii Electric Light Company (HELCO) filed an updated Power Supply Improvement Plan with the Hawaii Public U li es Commission (PUC) which specifies addi onal geothermal genera on on the west side of the island by 2025 and no addi onal geothermal capacity on the east side of the island. Resul ng from a request for proposals issued by HELCO in November 2012; in February 2015, HELCO announced it had selected Ormat to provide HELCO with 25 megawa s (MW) of new geothermal power on Hawaii Island. The next step in this process is for HELCO and Ormat to nego ate a contract for the sale of the new power to be generated. If an agreement is reached, it will be submi ed to the PUC for review and approval. All other applicable facility permits and approvals would be required. The loca on of the proposed new facility is not yet publically available.
Current geothermal produc on Capacity in Hawaii
38 MW
Contracted price for first 25 MW of electricity from PGV66
18.8¢ on peak 15.9¢ off peak per kilowa ‐hour (kWh)
Es mated probable reserves, Maui & Hawaii
1,000 MW
Contracted price for next 5 MW
11.8¢ / kWh
Median levelized cost of geothermal energy, U.S.67
6¢ per kWh
Contracted price for next 8 MW
9¢ / kWh
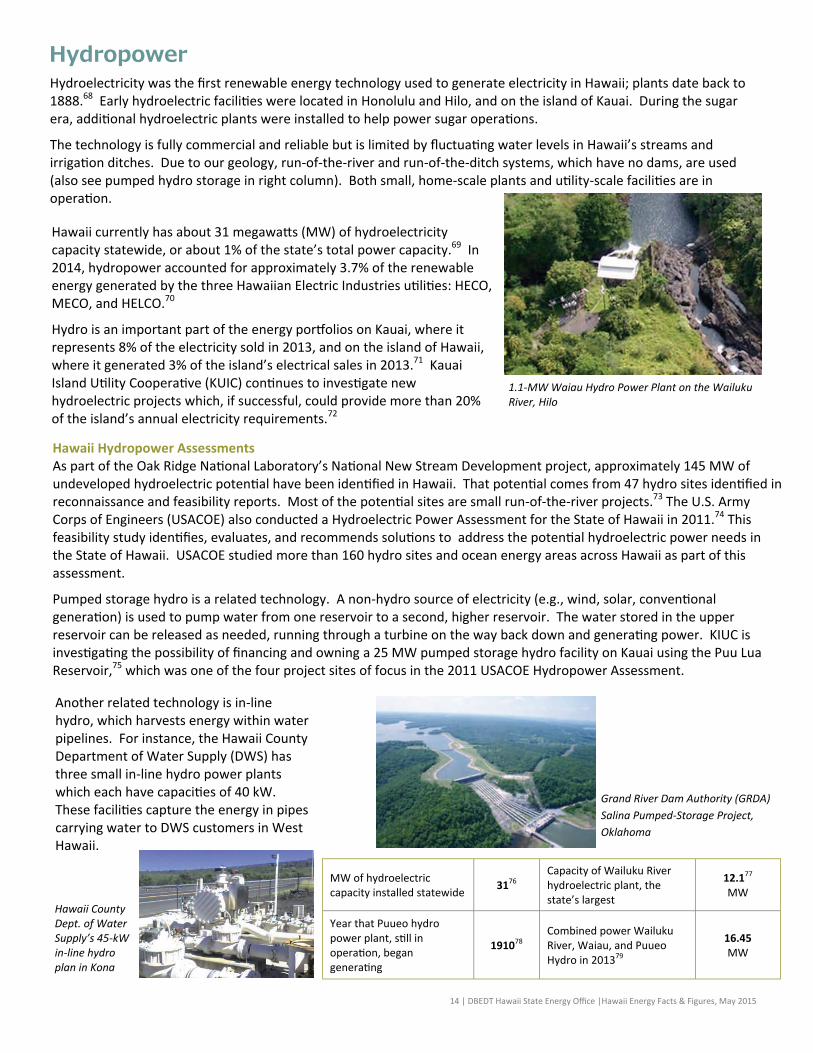
Hydropower
14 | DBEDT Hawaii State Energy Office |Hawaii Energy Facts & Figures, May 2015
Hydroelectricity was the first renewable energy technology used to generate electricity in Hawaii; plants date back to 1888.68 Early hydroelectric facili es were located in Honolulu and Hilo, and on the island of Kauai. During the sugar era, addi onal hydroelectric plants were installed to help power sugar opera ons.
The technology is fully commercial and reliable but is limited by fluctua ng water levels in Hawaii’s streams and irriga on ditches. Due to our geology, run‐of‐the‐river and run‐of‐the‐ditch systems, which have no dams, are used (also see pumped hydro storage in right column). Both small, home‐scale plants and u lity‐scale facili es are in opera on.
1.1‐MW Waiau Hydro Power Plant on the Wailuku River, Hilo
Hawaii currently has about 31 megawa s (MW) of hydroelectricity capacity statewide, or about 1% of the state’s total power capacity.69 In 2014, hydropower accounted for approximately 3.7% of the renewable energy generated by the three Hawaiian Electric Industries u li es: HECO, MECO, and HELCO.70
Hydro is an important part of the energy por olios on Kauai, where it represents 8% of the electricity sold in 2013, and on the island of Hawaii, where it generated 3% of the island’s electrical sales in 2013.71 Kauai Island U lity Coopera ve (KUIC) con nues to inves gate new hydroelectric projects which, if successful, could provide more than 20% of the island’s annual electricity requirements.72
Hawaii Hydropower Assessments As part of the Oak Ridge Na onal Laboratory’s Na onal New Stream Development project, approximately 145 MW of undeveloped hydroelectric poten al have been iden fied in Hawaii. That poten al comes from 47 hydro sites iden fied in reconnaissance and feasibility reports. Most of the poten al sites are small run‐of‐the‐river projects.73 The U.S. Army Corps of Engineers (USACOE) also conducted a Hydroelectric Power Assessment for the State of Hawaii in 2011.74 This feasibility study iden fies, evaluates, and recommends solu ons to address the poten al hydroelectric power needs in the State of Hawaii. USACOE studied more than 160 hydro sites and ocean energy areas across Hawaii as part of this assessment.
Pumped storage hydro is a related technology. A non‐hydro source of electricity (e.g., wind, solar, conven onal genera on) is used to pump water from one reservoir to a second, higher reservoir. The water stored in the upper reservoir can be released as needed, running through a turbine on the way back down and genera ng power. KIUC is inves ga ng the possibility of financing and owning a 25 MW pumped storage hydro facility on Kauai using the Puu Lua Reservoir,75 which was one of the four project sites of focus in the 2011 USACOE Hydropower Assessment.
Another related technology is in‐line hydro, which harvests energy within water pipelines. For instance, the Hawaii County Department of Water Supply (DWS) has three small in‐line hydro power plants which each have capaci es of 40 kW. These facili es capture the energy in pipes carrying water to DWS customers in West Hawaii.
Hawaii County Dept. of Water Supply’s 45‐kW in‐line hydro plan in Kona
MW of hydroelectric capacity installed statewide
3176 Capacity of Wailuku River hydroelectric plant, the state’s largest
12.177 MW
Year that Puueo hydro power plant, s ll in opera on, began genera ng
191078 Combined power Wailuku River, Waiau, and Puueo Hydro in 201379
16.45
MW
Grand River Dam Authority (GRDA)
Salina Pumped‐Storage Project,
Oklahoma

Oahu-Maui Grid Tie
15 | DBEDT Hawaii State Energy Office |Hawaii Energy Facts & Figures, May 2015
The Interisland Cable Grid‐Tie Project (a.k.a., the Oahu‐Maui Interisland Transmission System) is an inves ga on by the Hawaii Public U li es Commission (PUC) into the viability of connec ng the electricity grids of Maui and Oahu with a 200 MW High Voltage Direct Current (HVDC) cable. DBEDT is strongly in favor of the project due to the significant economic, environmental and community benefits that it will bring to Hawaii ratepayers. The Cable is a key enabler of achieving the state’s Renewable Por olio Standards (RPS).
The type of system being proposed is a two‐way “grid‐e” (not the one‐way “gen‐ e” transmission cable that
was proposed earlier). This adds significant value to Hawaii’s public and ratepayers because it will allow Oahu and Maui to coordinate opera on of their respec ve electric grids, and provide flexibility to add significantly more clean, renewable energy genera on in the most economical and equitable manner.
Eventually, the goal is to connect Maui to Hawaii Island to create an integrated system and take advantage of the Big Island’s abundant renewable resources.
Hawaii’s islands are already connected by several telecommunica ons cables.
DBEDT es mates the overall savings on both islands at up to $423 million (2020‐2050) before taking into considera on the environmental benefits. Taking into account the reduc on of greenhouse gases and other emissions, the net benefit would rise to $551 million. These figures include fuels savings of approximately $1 billion. Other significant benefits include: 80
The 200 MW HVDC cable bundle is no more than 10 inches in diameter. The bundle shown in the picture is for transmission of 500 MW.
Economic Lower and more uniform electricity prices for Maui and Oahu; Lower fuel costs and less exposure to price vola lity; Increased capacity factors for wind genera on; Greater u liza on of lower cost genera on resources; Reduced curtailment of intermi ent renewable energy; Reduced environmental compliance costs; and Lower opera ng reserve requirements.
Environmental Lower nitrogen oxides (NOx), sulfur oxides (SOx), par culate ma er (PM), and carbon dioxide (CO2) emissions;
Higher penetra on of renewable energy genera on; and Increased flexibility in si ng new renewable genera on.
Public Policy Helps the State meet RPS requirements and the objec ves of the Hawaii Clean Energy Ini a ve (HCEI), i.e., 40% renewable energy by 2030;
Reduced dependence on fossil fuels; and A model for poten ally connec ng with Hawaii Island in the future.
There have been at least 22 similar projects globally, including the following noteworthy ones: Trans Bay Cable (California), 53 miles: 660 MW installed in 2010.
Cross Sound Cable (New York ‐ Connec cut), 24 miles: 330 MW installed in 2002.
Neptune (New York‐New Jersey), 50 miles: 660 MW installed in 2007.
NorNed (Netherlands – Norway) (longest HVDC submarine cable), 360 miles: 700 MW installed in 2008.
SAPEI (Italy) (deepest HVDC submarine cable, at 5,380 feet), 261 miles: 1000 MW installed in 2011.
Longest undersea power cable 360
miles Deepest undersea power cable
5,380
feet
Highest capacity undersea
HVDC system
2,000
MW
Es mated installed cost of Oahu to Maui grid e81
$526
million
Year of installa on, first HVDC
undersea power cable 1954
Es mated net benefit of Oahu‐Maui grid e, (including social costs of carbon)82
$551
million
Expected undersea
transmission cable life in years 30‐50
2012 legisla on: regulatory structure for
inter‐island power cables Act 165

Ocean
16 | DBEDT Hawaii State Energy Office |Hawaii Energy Facts & Figures, May 2015
Surrounded by the Pacific Ocean, Hawaii is rich in ocean renewable energy resources. Ocean energy includes both hydrokine c and thermal resources.
Hydrokine c technologies tap the movement in the ocean—waves, currents and des—to generate electricity. Ocean Thermal Energy Conversion (OTEC) makes use of
the temperature differences between warm surface waters and cold, deep ocean waters.
Hawaii has superior poten al for wave energy and OTEC. However, ocean current and dal resources are not as promising with presently‐envisioned technologies in Hawaii.
Ocean energy research, development and demonstra on projects are taking place in Hawaii and elsewhere in the world.
The Hawaii Na onal Marine Renewable Energy Center (HINMREC) at the University of Hawaii‐Manoa is one of three federally‐funded centers for marine energy research and development in the na on. HINMREC worked with the Department of Defense to establish a mul ple‐berth wave energy test center at Kaneohe Bay, Oahu. The first new tenant, NWEI, has been selected to occupy the exis ng 30‐meter‐deep berth. An Environmental Assessment, resul ng in a Finding of No Significant Impact, was completed on two new berths, at 60 m and 80 m depths, in February 2014. Construc on is an cipated to begin in 2014.
The first ocean wave‐generated electricity ever transmi ed to the grid in the USA was generated by an Ocean Power Technologies (OPT) PowerBuoy at Kaneohe Bay in 2010. In a coopera ve program with the U.S. Navy, three OPT buoys were deployed from 2004 to 2011.
OPT’s PB40 PowerBuoy in Kaneohe Bay, Oahu
The Natural Energy Laboratory of Hawaii Authority (NELHA) at Keahole Point, Kona, is among the world’s premier OTEC research centers. Major milestones in OTEC were achieved at NELHA in the 1980s and ‘90s, including a 1‐MW floa ng OTEC pilot plant, Mini‐OTEC (the world’s first demonstra on of net power output from a closed‐cycle plant) and other demonstra ons in both open‐ and closed‐cycle OTEC.
NELHA’s cold seawater supply pipes are the deepest large‐diameter pipelines in the world’s oceans, extending to 2,000‐foot depths. The laboratory’s loca on, with access to both warm surface water and cold deep ocean water, makes it a prime site for OTEC R&D. Presently, Makai Ocean Engineering is opera ng a heat exchanger test facility at NELHA, tes ng components and materials. A 100‐kW OTEC generator has been added to the test facility and is expected to be opera onal in 2015, a er an interconnec on study has been completed and permits obtained.
A one‐megawa OTEC demonstra on facility at NELHA is in the planning stages and power plants up to 100 MW in capacity have been proposed for loca ons off Oahu. OTEC heat exchanger test facility
at NELHA
Number of berths expected at Kaneohe wave test center
3
Projected Levelized Cost of Electricity (LCOE) for commercial ocean energy83
23¢‐25¢/kWh
Energy poten al of trade wind waves in Hawaiian waters84
10‐15 kW/meter
Temperature of cold, deep seawater at NELHA85
6°C (43°F)
Number of opera ng hours achieved by OPT PowerBuoy PB40 at Kaneohe Bay86
>5,600 hours
Temperature range of warm surface seawater at NELHA87
24° – 28.5°C (75° – 83°F)

Smart Grid
17 | DBEDT Hawaii State Energy Office |Hawaii Energy Facts & Figures, May 2015
What is Smart Grid?88
The electric “grid” is a network of transmission lines, substa ons, transformers and more that deliver electricity from power plants to homes and businesses. It’s what electric lights and appliances are plugged into. A “smart grid” is one that has more automa c sensors, controls, energy storage, and intelligent systems to be er manage the complexity of constantly fluctua ng demand and produc on of electricity efficiently and cost‐effec vely. Some common “smart grid” components are: Smart (“Advanced”) Meters ‐ Provide mely and detailed energy use informa on for customers ‐ Allow for me of use rates Sensors, controls, and forecas ng ‐ Monitor condi ons in real me ‐ Allow higher penetra on of renewables Energy Storage (ba eries, capacitors, flywheels,
pumped hydro, hydrogen) ‐ Allow for increased renewable energy penetra on ‐ Stabilize the grid by condi oning power and smoothing fluctua ons Demand Response (managing electricity use in response to available supply) DOE gave $3.4 billion in grants for smart grid projects and grid upgrades in recent years90
Smart Grid Market is Large89
Poten al Market in Hawaii Residen al and commercial building energy management systems may become even more effec ve when connected to a u lity‐wide smart grid.
Over 500,000 housing units and condos91, and tens of thousands of commercial and government buildings statewide, can take advantage of smart grid technologies.
Over $57 million has been invested in Smart Grid demonstra on projects in Hawaii.92
Exis ng Smart Grid Projects in Hawaii
Name Descrip on Key Companies Loca on
HECO Smart Grid and Smart Meter Ini al Phase
First phase for an island wide rollout of smart grid technology and smart meters, pending approval by the Public U li es Commission. During the ini al phase, about 5,200 smart meters will be installed in homes and businesses.93
HECO, Silver Spring Networks, Blue Planet Founda on, Hawaii Energy
Moanalua Valley, parts of Pearl City, Kaimuki, Kahala, Diamond Head and Waikiki, Oahu
DOE Renewable and Distributed Systems Integra on (RDSI) Maui Smart Grid Demonstra on Project
Develop a distribu on management system that aggregates distributed genera on, energy storage, and demand response technologies with $7 million in DOE funds and $8 million in industry funds.94
HNEI, HECO/MECO, General Electric, First Wind
Maui Meadows and Wailea, Maui
JUMPSmart Maui Project
Develop advanced technologies that automate EV charging and demand response to allow more renewable energy on the grid. NEDO will invest $37 million in the project.95
NEDO, Hitachi, Mizuho, Cyber‐Defense, US DOE, NREL, HECO/MECO, HNEI, MEDB, Maui County & DBEDT
Kihei, Maui
KIUC Smart Grid Demonstra on
Installa on of advanced metering infrastructure (AMI) and other smart grid technologies for grid management and energy efficiency informa on. Total cost of around $11 million for 33,000 meters in five years.96
KIUC, USDOE Kauai
Honeywell Fast Demand Response
Industrial and Commercial programs available for designa ng non‐essen al facili es that can be turned off during cri cal energy situa ons with ten minutes’ no ce or less.97
HECO, Honeywell Oahu
Hawaiian Electric/ Stem 1 MW Distributed Storage
Stem will deploy behind‐the‐meter energy storage in a demonstra on project with HECO to support grid response services. Stem’s energy storage and data analy cs predict and respond to spikes in customers’ electricity demand. Installa ons are expected to be completed by March 2015.98
Stem, Hawaiian Electric, Hawaii Energy Excelerator
Oahu TBD. HECO and Stem will enlist commercial & industrial customers with roo op PV.

Solar
18 | DBEDT Hawaii State Energy Office |Hawaii Energy Facts & Figures, May 2015
Due to Hawaii’s extremely high energy prices, superior solar resource and progressive energy policies, the state has experienced unprecedented growth in solar genera on. Solar energy in 2014 provided 29 percent of Hawaii’s renewable energy genera on.
Solar Energy as a % of Total Renewable Genera on in Hawaii 201499
Most photovoltaic systems are installed under the u li es’ net metering program. Both residen al and commercial en es par cipate in the program. There are approximately 51,534 photovoltaic systems currently installed, providing a capacity of 381 MW.
Number of PV Systems
Capacity (MW)
HECO100 36,042 268.9
HELCO 7,745 54.7
MECO 7,387 56.9
KIUC101 1,875 12.3
TOTAL 53,409 392.8
From 2007‐2014, solar capacity nearly doubled annually. However since 2013, and due to new u lity interconnec on requirements, total solar genera on growth has materially slowed down. The graph below shows growth Hawaii’s total solar genera on.
Total Photovoltaic (PV) Genera on102 by Year (GWh) Hawaii’s progressive energy polices suppor ng PV include: Net Energy Metering (NEM), which allows residen al customers to receive full retail value for excess solar energy occasionally fed to the grid; and
State tax incen ves.
The integra on of large amounts of solar genera on has proven to be a challenge for the u lity due to the rapid growth of the solar industry, the intermi ent nature of solar power and the condi on of Hawaii’s islanded, centralized electric grid infrastructure. Poten al solu ons include advanced or “smart” inverter se ngs, ba ery storage and interconnec ng the island grids. To this end, the Hawaii State Energy Office has provided input in various technical and regulatory inves ga ve proceedings designed to clear the current backlog of PV systems awai ng interconnec on by the HECO Companies as well as modernizing the electric u lity system to allow for greater renewable penetra on and transparency, network interoperability and distributed intelligence.103
Exis ng U lity Scale Solar Projects
Project Name Year Installed Island Developer Capacity
La Ola Solar Farm 2006 Lanai Castle & Cooke 1.1 MW
Kapolei Sustainable Energy Park 2011 Oahu Forest City, Hoku 1.18 MW
Kapaa Solar Project 2011 Kauai Kapaa Solar, KIUC 1.21 MW
Port Allen Solar Facility 2012 Kauai A&B, McBryde, KIUC 6 MW
Kalaeloa Renewable Energy Park
2013 Oahu Hanwha Solar Ener‐gy, Swinerton,
Scatec, Hunt Dev
5 MW
Kalaeloa Solar Power II 2013 Oahu SunPower, Dept. of Hawaiian Homelands
5 MW
MP2 Solar Project 2013 Kauai REC Solar, KIUC 300 kW
Pearl Harbor Peninsula 2013 Oahu Forest City, NAVFAC, HECO, HOKU
1.23 MW
Koloa Solar Farm 2014 Kauai Solar City, KIUC 12 MW
Percentage of electricity generated by solar, 2014 statewide104
5.9% Na onwide rank of cumula ve installed PV capacity per capita, 2013105
3rd
Penetra on of roo op PV, residen al106
~12% Levelized cost of PV, Hawaii u lity scale107
~13‐15¢ /kWh
Power density of PV array108
11‐19 wa s per square foot
Wa s per PV module (i.e. “panel”)109
60 ‐ 445 wa s/panel
Installed cost, U.S., residen al110
$3.29 / W Installed cost, U.S., u lity‐scale111
$1.80 / W
Statewide 2014 construc on expenditures a ributed to solar112
7.4% Acres per megawa (Hawaii, u lity‐scale)113
3.3 – 7.2 acres/MW

Wind
19 | DBEDT Hawaii State Energy Office |Hawaii Energy Facts & Figures, May 2015
Wind energy is Hawaii’s second most u lized renewable energy resource, accoun ng for about 30.2% of the state’s total renewable energy genera on in 2014.114
Hawaii has one of the most robust and consistent wind regimes in the world, with capacity factors exceeding those commonly found elsewhere. In 2011, the capacity factor of the Pakini Nui wind farm on the Big Island was 65%; Kaheawa I on Maui was 47%; and the Hawi wind farm on the Big Island was 45%.115
Exis ng projects in Hawaii are located on the islands of Oahu, Maui, and Hawaii.
Electricity Produced from Wind Energy in Hawaii, by Island and Service Area116
Challenges Facing Wind Energy Development in Hawaii Endangered avian and plant species can complicate the si ng and development of wind projects in Hawaii’s unique environments. Proac ve measures, such as the development of area‐wide habitat conserva on plans, could be helpful for species protec on as well as easier project si ng in the future.
Given the height of wind turbines and limited sites suitable for wind development in Hawaii, visual impacts may be of concern; they should be iden fied early and addressed carefully, working with local communi es.
Exis ng U lity Scale Projects
Project Name Year
Installed Island Developer
Capacity (MW)
Acres Acres per MW
Hawi Renewable Development117
2006 Hawaii Hawi
Renewables 10.5 250 23.8
Kaheawa I Wind Farm118 2006 Maui First Wind 30 200 6.7
Pakini Nui Wind Farm119 2007 Hawaii
Tawhiri Power
20.5 67 3.3
Kahuku Wind Farm120 2011 Oahu First Wind 30 578 19.3
Kawailoa Wind Farm121 2012 Oahu First Wind 69 650 9.4
Kaheawa II Wind Farm122 2012 Maui First Wind 21 143 6.8
Auwahi Wind123 2012 Maui Sempra
Genera on 21 68 3.2
Installed Wind Energy Produc on Capacity by Service Area124
Current installed wind capacity in Hawaii125
202 MW Average land area used per MW of wind
9.7 acres
Height of 2.3 MW wind turbine126
456 . Levelized cost of wind energy127
7¢ per kWh

Permitting
20 | DBEDT Hawaii State Energy Office |Hawaii Energy Facts & Figures, May 2015
Permi ng any large project in Hawaii, including a u lity‐scale renewable energy project, requires a thorough understanding of local processes, issues, and stakeholders. The tools described below provide informa on on these topics, as well as guidance to assist appropriate project si ng and due diligence. These tools also seek to lower project “so ” costs by reducing the resources needed to undergo the permi ng processes128 without removing any of the environmental or community safeguard processes in place. Many local federal, state, and county agencies contributed to the development to these tools. Some of these tools were featured by the Na onal Associa on of State Energy Officials (NASEO) as a best‐prac ce other state energy offices could use to abate so costs associated with renewable energy permi ng processes.129
Developer & Investor Center, Self‐Help Suite (Hawaii State Energy Office)
The Hawaii State Energy Office’s interac ve Developer & Investor Center and Self‐Help Suite provide comprehensive informa on on the si ng, permi ng, and development of renewable energy facili es in Hawaii. Updates to these resources will be released in late 2015. (h p://energy.hawaii.gov/developer‐investor/project‐permi ng‐assistance‐and‐resources)
Renewable Energy Permi ng Wizard (Hawaii State Energy Office)
The Wizard was developed to help those proposing renewable energy projects understand the county, state, and federal permits that may be required for their individual projects. So ware upgrades and content updates to the Wizard were completed in October 2014, with addi onal content edits to be implemented by the Hawaii State Energy Office in 2015. (h p://wizard.hawaiicleanenergyini a ve.org/)
Renewable EnerGIS Mapping Tool (Hawaii State Energy Office, Office of Planning)
Renewable EnerGIS provides renewable energy resource and site informa on for specific Hawaii loca ons selected by the user. EnerGIS helps stakeholders understand the renewable energy poten al and permi ng requirements for selected sites. Upgrades to EnerGIS are planned for release in 2016. (h p://energy.hawaii.gov/resources/renewable‐energis‐map)

Electronic permi ng is another effec ve method of streamlining the permit review process without removing any of the environmental or community safeguards in place.130 Some examples of state and county agencies u lizing electronic permi ng include:
e‐Permi ng Portal (Hawaii Department of Health / DOH)
The DOH Environmental Health Administra on (EHA) e‐Permi ng Portal provides access to environmental permit applica ons. e‐Permi ng allows for efficient and accurate electronic applica on compila on and submission, tracking, processing, management, and fee payment. (h ps://eha‐cloud.doh.hawaii.gov/epermit/)
Electronic Plan Review and Building Permit Status (County of Kauai)
Kauai's Department of Public Works, Building Division, offers online tools to submit building permits electronically (Electronic Plan Review or "ePlan") and get informa on on Building Permit status, details, and other relevant informa on. (h p://www.kauai.gov/Government/Departments/PublicWorks/BuildingDivision/ElectronicPlanReview/tabid/392/Default.aspx)
[UNDER DEVELOPMENT] Online Permi ng (Department of Land and Natural Resources
DBEDT and DLNR are currently developing new online permi ng tools for DLNR’s Engineering Division and Division of Forestry and Wildlife. These tools are scheduled for public release in late 2015.
Facts about permi ng renewable energy projects in Hawaii
Permi ng costs in Hawaii can range from 1% to 20% of overall project construc on costs.131 Large energy projects in Hawaii average 15 federal, state, and county permits. It can take 1‐5 years to permit a large renewable energy project in Hawaii. Hawaii’s Energy Policy: Balance technical, economic, environmental, & cultural considera ons.
Common solu ons to renewable energy permi ng issues in Hawaii
Know the requirements and processes ‐ retain professionals with experience in Hawaii. Meaningful community par cipa on ‐ engage public early in the project design process. Engage all stakeholders ‐ iden fy and address all issues early in the process. Site projects appropriately ‐ minimize environmental impacts, seek compa ble areas. Be diligent ‐ go slow in the beginning to go fast in the end. 1 submi al / 1 review ‐ present agencies w/ well‐planned projects, complete applica ons. Electronic permit processing ‐ saves me, reduces back & forth, transparency, tracking.
Permitting
21 | DBEDT Hawaii State Energy Office |Hawaii Energy Facts & Figures, May 2015
Online Building Permits (City and County of Honolulu/CCH)
CCH’s Department of Planning and Permi ng website provides for the electronic submission and processing of building permits required for residen al solar hea ng, photovoltaic, and electric vehicle charger installa ons in the City and County of Honolulu. Building Permit status can also be monitored online. (h p://dppweb.honolulu.gov/DPPWeb/Default.aspx?PossePresenta on=OnlineBuildingPermit&PosseObjectDef=j_OnlineBP)

22 | DBEDT Hawaii State Energy Office |Hawaii Energy Facts & Figures, May 2015
Energy Efficiency Portfolio Standards This graph shows Hawaii Energy Efficiency Portfolio Standard (EEPS) levels from 2008‐2014. The EEPS requires that by 2030 annual energy savings amount to 30% of annual electricity sales statewide. Excluding KIUC, we are at 21.3% for the RPS (vs. 18% in 2013) and 17.3% for the EEPS (vs. 15.7% in 2013) for a total of 38.6% (vs. 33.7% in 2013). An Energy Efficiency Potential Study, initiated by the Public Utilities Commission, indicates that there is the potential of exceeding this goal by 50% by 2030.
A major contributor to EEPS is Hawaii Energy (HE), a ratepayer‐funded energy conservation and efficiency program that serves all islands except Kauai, which is handled by Kauai Island Utility Cooperative. HE is administered by Leidos Engineering, LLC, under contract with the Hawaii Public Utilities Commission.
For HE’s program year ending June 30, 2014, the program invested more than $32 million to deliver approximately 1.75 billion kilowatt hours (kWh) in lifetime system level energy savings at a cost of just 1.8 cents per kWh. The energy saved is enough to power 239,237 single‐family homes for a year or half of all households in the state. It is also equivalent to eliminating 2.6 million barrels of oil from being imported to Hawaii and burned to generate electricity. HE delivered over $20.4 million in incentives driving customer energy bill savings of over $49.5 million for the first year and more than $517 million over the lifetime of the energy efficiency measures installed.
Energy Performance Contracting Energy performance contracting (EPC) provides building owners with the opportunity to design, install, and maintain energy‐efficient equipment without significant upfront cost. Costs are paid over time from the energy savings. DBEDT provides technical assistance on energy performance contracting to state and county agencies.
Twelve projects initiated since 1996: University of Hawaii at Hilo Hawaii Health Services Corporation Judiciary Department of Accounting and General
Services Phase I Department of Accounting and General
Services Phase II Department of Public Safety (4 prisons) Department of Transportation ‐ Airports University of Hawaii Community Colleges Counties of Hawaii and Kauai; C&C of Honolulu
Preliminary data show: The projects include over 190 buildings and over 14
million square feet Annual cost savings for all projects is over $40 million,
representing an average of nearly 45% savings Hawaii is ranked 1st in the nation per capita for energy
performance contracting (Energy Services Coalition)
Over 20 years, the projects will: Save over $830 million in electricity costs Provided over $469 million of direct (total investment)
and indirect (repair/maintenance/taxes) impacts to the economy
Claim over $6 million in rebate incentives Created over 2,670 jobs due to contract investments
23 | DBEDT Hawaii State Energy Office |Hawaii Energy Facts & Figures, May 2015
Energy Performance Contracting Hawaii honored with national energy award for third consecutive year
For the third consecutive year, the State of Hawaii was nationally recognized and awarded the Energy Services Coalition’s (ESC)* Race to the Top for leading the nation in per capita energy performance contracting for state and county buildings. Hawaii led the nation with $235.74 invested per capita; national average is $48.93 per capita. Hawaii was well ahead of second place Kentucky with EPC investment of $172.84 per capita and third place Delaware at $154.47 per capita.
The State Energy Office has been providing technical assistance for performance contrac ng to state agencies and coun es since 1996. The EPC projects vary widely and include courthouses, community colleges, hospitals, prisons, and airports.
*ESC is a na onal nonprofit organiza on, composed of a network of experts from a wide range of organiza ons, working
together at the state and local levels to increase energy efficiency and building upgrades through energy performance contrac ng.
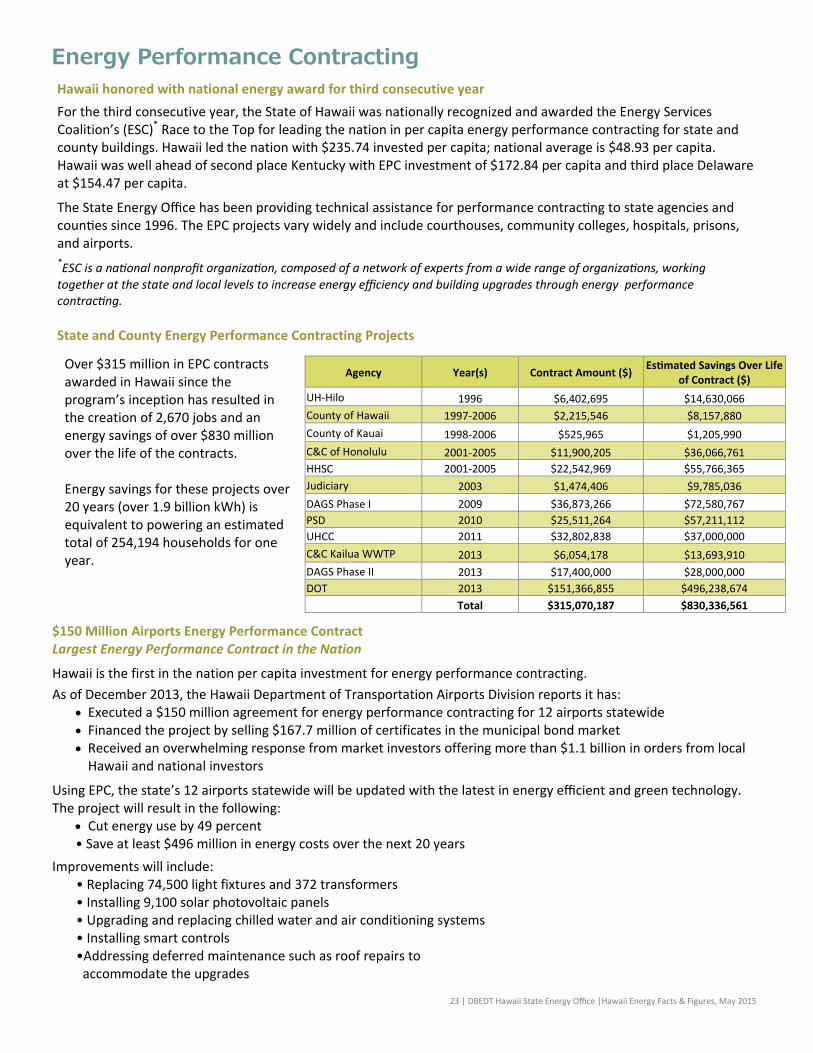
State and County Energy Performance Contracting Projects
Over $315 million in EPC contracts awarded in Hawaii since the program’s inception has resulted in the creation of 2,670 jobs and an energy savings of over $830 million over the life of the contracts. Energy savings for these projects over 20 years (over 1.9 billion kWh) is equivalent to powering an estimated total of 254,194 households for one year.
$150 Million Airports Energy Performance Contract Largest Energy Performance Contract in the Nation
Hawaii is the first in the nation per capita investment for energy performance contracting.
As of December 2013, the Hawaii Department of Transportation Airports Division reports it has: Executed a $150 million agreement for energy performance contracting for 12 airports statewide Financed the project by selling $167.7 million of certificates in the municipal bond market Received an overwhelming response from market investors offering more than $1.1 billion in orders from local Hawaii and national investors
Using EPC, the state’s 12 airports statewide will be updated with the latest in energy efficient and green technology. The project will result in the following:
Cut energy use by 49 percent • Save at least $496 million in energy costs over the next 20 years
Improvements will include: • Replacing 74,500 light fixtures and 372 transformers • Installing 9,100 solar photovoltaic panels • Upgrading and replacing chilled water and air conditioning systems • Installing smart controls •Addressing deferred maintenance such as roof repairs to accommodate the upgrades
Agency Year(s) Contract Amount ($) Es mated Savings Over Life
of Contract ($)
UH‐Hilo 1996 $6,402,695 $14,630,066
County of Hawaii 1997‐2006 $2,215,546 $8,157,880
County of Kauai 1998‐2006 $525,965 $1,205,990
C&C of Honolulu 2001‐2005 $11,900,205 $36,066,761
HHSC 2001‐2005 $22,542,969 $55,766,365
Judiciary 2003 $1,474,406 $9,785,036
DAGS Phase I 2009 $36,873,266 $72,580,767
PSD 2010 $25,511,264 $57,211,112
UHCC 2011 $32,802,838 $37,000,000
C&C Kailua WWTP 2013 $6,054,178 $13,693,910
DAGS Phase II 2013 $17,400,000 $28,000,000
DOT 2013 $151,366,855 $496,238,674
Total $315,070,187 $830,336,561
Power Purchase Agreements DOT‐Airports signed a 20‐year power purchase agreement in 2009 for a total of seven (7) photovoltaic systems
totaling 901 kW of capacity. Through a second round of power purchase agreements in 2011, DOT‐Airports awarded development of photovoltaic
renewable energy generation systems at 15 sites. Seven (7) power purchase agreements have been signed for a total capacity of 606 kW. The remaining eight (8) are pending, but are planned for an additional 2.69 MW. In an earlier power purchase agreement, DOT‐Airports installed nearly 1.4 MW of photovoltaic systems at seven airports and harbors facilities in the state. A total of nearly 5.2 MW of photovoltaics has been installed.
In January 2014, OpTerra Energy Solutions was awarded the Energy Efficiency and Sustainability Master Plan RFP. DOE is rebranding this program “Ka Hei.” Under the Ka Hei Program, OpTerra will conduct whole school audits beginning 2015 to determine energy and water efficiencies for each DOE school. Based on these audits, DOE will determine the feasibility to fund these energy and water efficiency projects, either through the Ka Hei Program or using bond funds.
State Building Code Update: The State Building Code Council voted on a proposed draft to update the International
Energy Conservation Code of 2015; Administrative Rules must be prepared once the draft is approved. 24 | DBEDT Hawaii State Energy Office |Hawaii Energy Facts & Figures, May 2015
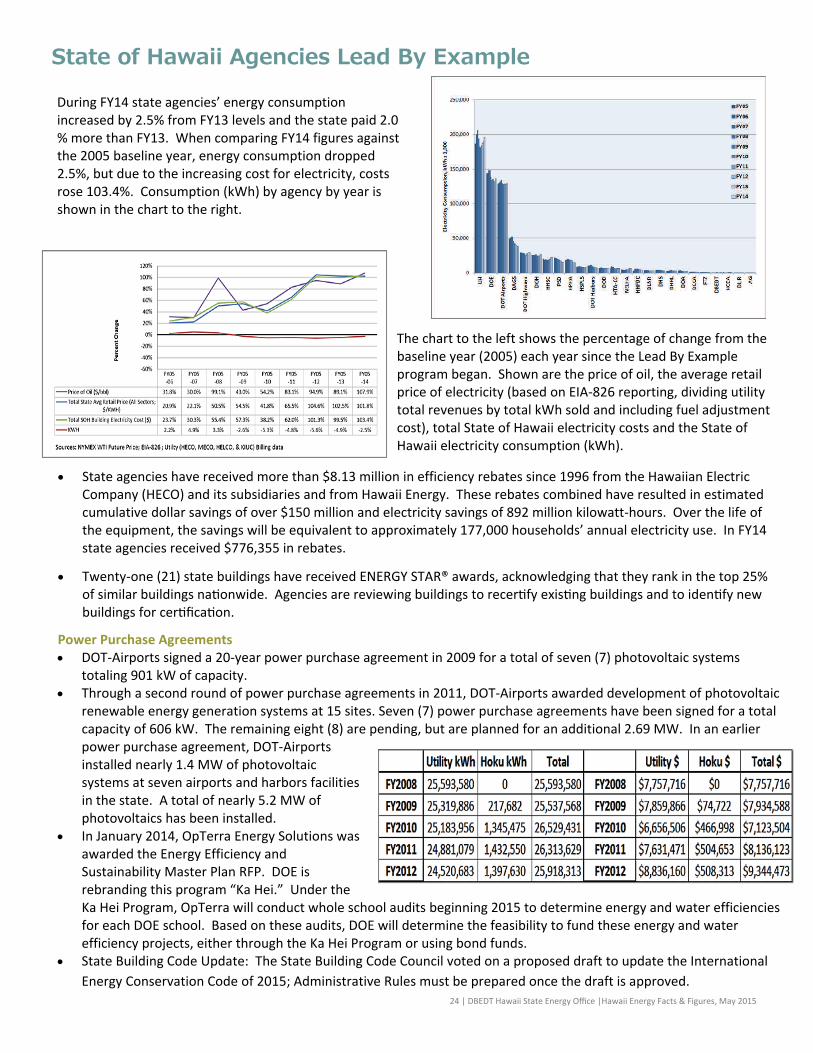
State of Hawaii Agencies Lead By Example
During FY14 state agencies’ energy consumption increased by 2.5% from FY13 levels and the state paid 2.0 % more than FY13. When comparing FY14 figures against the 2005 baseline year, energy consumption dropped 2.5%, but due to the increasing cost for electricity, costs rose 103.4%. Consumption (kWh) by agency by year is shown in the chart to the right.
The chart to the left shows the percentage of change from the baseline year (2005) each year since the Lead By Example program began. Shown are the price of oil, the average retail price of electricity (based on EIA‐826 reporting, dividing utility total revenues by total kWh sold and including fuel adjustment cost), total State of Hawaii electricity costs and the State of Hawaii electricity consumption (kWh).
State agencies have received more than $8.13 million in efficiency rebates since 1996 from the Hawaiian Electric Company (HECO) and its subsidiaries and from Hawaii Energy. These rebates combined have resulted in estimated cumulative dollar savings of over $150 million and electricity savings of 892 million kilowatt‐hours. Over the life of the equipment, the savings will be equivalent to approximately 177,000 households’ annual electricity use. In FY14 state agencies received $776,355 in rebates.
Twenty‐one (21) state buildings have received ENERGY STAR® awards, acknowledging that they rank in the top 25% of similar buildings na onwide. Agencies are reviewing buildings to recer fy exis ng buildings and to iden fy new buildings for cer fica on.

25 | DBEDT Hawaii State Energy Office |Hawaii Energy Facts & Figures, May 2015
Leadership in Energy and Environmental Design Leadership in Energy and Environmental Design (LEED) The U.S. Green Building Council (USGBC) released its annual ranking of the Top 10 States for LEED, on which the State of Hawaii placed sixth. Last year, Hawaii placed ninth. The list highlights the regions around the country that are at the forefront of the movement for sustainable building design, construction and operation. Utilizing less energy and water, LEED‐certified spaces save money for families, businesses and taxpayers; reduce carbon emissions; and contribute to a healthier environment for residents, workers and the larger community. The per‐capita list is based on 2010 U.S. Census data and includes commercial and institutional green building projects that were certified throughout 2014. Hawaii certified 30 projects (public and private) in 2014 representing 2,657,808 square feet of real estate, or 1.95 square feet per resident. The certified buildings included numerous private developments, as well as some state and county buildings.
Twenty‐nine (29) State of Hawaii buildings are LEED certified or pending certification since 2006. An additional 43 LEED projects are in the process toward the goal of certification.
Hawaii remains a member of the U.S. Green Buildings Council (USGBC), the non‐profit entity which administers the LEED program. DAGS is developing LEED application guidelines to be used by state agencies.
There are over 30 LEED Accredited Professionals on staff at six state agencies; DAGS, DBEDT, DOE, DOT, HPHA and UH. Currently additional state personnel are in training for this goal. The state requires all new construction and major renovation to meet LEED Silver standards, to the extent possible. DBEDT continues to offer LEED training opportunities for state agency staff. Six years ago, there was only one LEED Accredited Professional (AP) working for the state.
ENERGY STAR® Buildings Agencies and private sector building owners and managers can benchmark buildings to compare energy usage with other buildings in their portfolio or similar buildings nationally to identify investment priorities. If a building’s performance, as reflected in its ENERGY STAR score, ranks in the top 25% of all buildings of its type, it can be certified as an ENERGY STAR building. Since 2000, 75 Hawaii buildings have received the ENERGY STAR certification. They include 27 public and 48 private buildings. During this time, DBEDT has assisted with the benchmarking and certification of 36 public and private (buildings should be certified annually). The chart below shows the rapidly increasing number of ENERGY STAR certified buildings in the state.

26 | DBEDT Hawaii State Energy Office |Hawaii Energy Facts & Figures, May 2015
Hawaii Green Business Program The state’s Hawaii Green Business Program assists and recognizes businesses that strive to operate in an environmentally, culturally and socially responsible manner. As a partnership between the state’s Department of Health and the Department of Business, Economic Development and Tourism; the Board of Water Supply; and the Chamber of Commerce of Hawaii, the program recognizes businesses that are committed to going green by implementing energy and resource efficiency practices. Not only does energy efficiency keep
utility costs down and create a more sustainable environment, the businesses are also collectively contributing to Hawaii’s energy efficiency goal. From 2009‐2013, the program has assisted and recognized over 80 business and government entities, from the hospitality, commercial office, retail, restaurant and food services sectors, resulting in the following savings: 12.7 million kWh of energy (equivalent to powering 1,720 homes for one year in Hawaii) 47.93 million gallons of water $3.313 million of energy cost
For more information on the Hawaii Green Business Program, visit energy.hawaii.gov/green‐business‐program
GreenSun Hawaii Loan Program DBEDT is closing down the GreenSun Hawaii Loan Loss Reserve Program. Any future loan activity will be handled by the Green Energy Market Securitization (GEMS) Program. For more information on the GEMS Program, visit gems.hawaii.gov. Following is a summary of the GreenSun Hawaii Loan Loss Reserve Program and its accomplishments during its three years of operation.
Program Objectives
A State of Hawaii credit enhancement program that was funded by a grant from the U.S. Department of Energy
Provided local financial institutions with access to a loan loss reserve (LLR) which could cover up to 100% of actual losses
Enabled participating lenders to: ‐ Extend loan availability to a larger pool of borrowers ‐ Offer more aggressive rates and terms than may otherwise be available without this credit enhancement
Public‐private partnership with the ability to leverage $4.25 million in federal funds into $85 million in energy efficiency and renewable energy equipment loans statewide
Program Purpose Supported loans for all property owners
Eligible Residential Loan Purposes: ‐ ENERGY STAR refrigerators and air conditioners ‐ Solar Thermal Hot Water System ‐ Solar Electric (PV) System ‐ Heat Pumps ‐ Insulation installed with an ENERGY STAR air conditioner
Eligible Non‐Residential Loan Purposes: ‐ Lighting Retrofits & Upgrades/Air Conditioning Retrofits & Upgrades ‐ Solar Thermal Systems/Solar Electric (PV) Systems ‐ Energy Efficiency Windows, Cool Roofs & all other installations eligible for Hawaii Energy/KIUC Rebates ‐ Loan related fees
Required energy efficiency improvements before renewable improvements were funded

GreenSun Hawaii Loan Program Participants
12 participating Lenders statewide 42 authorized Contractors statewide
Impacts GreenSun Hawaii was a public‐private partnership that had the ability to leverage $4.25 million in federal funds into $85 million in energy efficiency and renewable energy equipment loans statewide
Impacts include:
GreenSun Hawaii covered 194 low‐interest loans amounting to over $4.7 million
The estimated energy savings for these installations is 28.9 million kWh of electricity over the life of the installations which will save participants’ in excess of $12.8 million over the life of the installations
Annual CO2 reduction of 2,171,627 lbs. (43.4 million lbs. over the life of the installations)
Energy savings over the life of the equipment is equivalent to powering 3,916 households
27 | DBEDT Hawaii State Energy Office |Hawaii Energy Facts & Figures, May 2015

1 U.S. Energy Information Administration, http://www.eia.gov/electricity/data/state/annual_generation_state.xls. 2013 data will be available 11/14. 2 DBEDT’s Monthly Energy Trends, http://dbedt.hawaii.gov/economic/data_reports/energy-trends/ 3 http://www.eia.gov/electricity/monthly/epm_table_grapher.cfm?t=epmt_5_06_a. Table 5.6A Average Retail Price of Electricity to Ultimate
Customers by End-use Sector—located at http://www.eia.gov/electricity/monthly/ 4 Source: 2008-2014 Annual RPS Reports to the Hawaii PUC. http://dms.puc.hawaii.gov/dms/. RPS Docket Number: 2007-0008. Due to the
unavailability of information, the “Renewable Energy and Energy Efficiency Portfolio Standards chart excludes Kauai Island Utility Cooperative information.
5 DBEDT’s Monthly Energy Trends, http://dbedt.hawaii.gov/economic/data_reports/energy-trends/ 6 Volumes. Source: Biofuels Study; DBEDT; 2012. http://energy.hawaii.gov/wp-content/uploads/2011/10/BiofuelsStudy_Act203_Dec2012.pdf 7 DBEDT’s Monthly Energy Trends, http://dbedt.hawaii.gov/economic/data_reports/energy-trends-2/ 8 DBEDT’s Monthly Energy Trends, http://dbedt.hawaii.gov/economic/data_reports/energy-trends-2/ 9 1 barrel = 42 U.S. gallons. 10 DBEDT’s Monthly Energy Trends, http://dbedt.hawaii.gov/economic/data_reports/energy-trends-2/ 11 Electricity: http://www.eia.gov/state/rankings/#/series/31 (last accessed 4/14/15); natural gas: http://www.eia.gov/state/rankings/#/series/28
(last accessed 9/24/14) 12 DBEDT’s Monthly Energy Trends, http://dbedt.hawaii.gov/economic/data_reports/energy-trends-2/ 13 The State of Hawaii Data Book 2013 Tables 17.07 and 17.10 & Hawaiian Electric Industries 2013 Annual Report, “Generation Statistics”. 14 KUIK grid is separate from HECO’s infrastructure. 15 All-time system peak as reported 7/24/14 in Electric Light & Power/POWERGRID International, “Saft to supply energy storage system for Hawaii
utility.” http://www.elp.com/articles/2014/07/saft-to-supply-energy-storage-system-for-hawaii-utility.html. 16 Hawaiian Electric Company, http:// www.heco.com/waiverprojects 17 Hawaiian Electric Company, http://generationbidding.heco.com 18 On 2/23/13, HELCO released an RFP for up to 50 MW of geothermal capacity on the Island of Hawaii. Concluding its analysis of the parties
submitting application to this RFP, HELCO selected Ormat. 19 The amount of electricity produced per year = facility capacity x 24 hours/day x 365 days/year x capacity factor. 20 Residential electricity use, rates, and average bill obtained from DBEDT’s 2012 and 2013 Data Book,
http://dbedt.hawaii.gov/economic/databook/db2013/ & http://dbedt.hawaii.gov/economic/databook/db2012/. (Table 17.10) 21 The FIT queue was closed pursuant to Docket No. 2013-0194, Order No. 32499. 22 HECO, http://www.heco.com/fit/ 23 The FIT queue joint plan was accepted by the PUC on December 5, 2014 under Docket No. 2013-0194, Order No. 32499. 24 Database of State incentives for Renewable Energy, http://www.dsireusa.org/incentives/incentive.cfm?Incentive_Code=HI04R&re=0&ee=0 25 Source: PUC Docket No: 2014-0192 filed by Hawaiian Electric Industries on 1/21/15, Page 1, first bullet point under “Summary of This Filing”. 26 The DER docket proceeding was formally initiated on March 31, 2015 in PUC Order No. 32737, and calls for the utilities and other docket
interveners from government, industry and advocacy groups to develop joint recommendations to 1) revise interconnection rules to allow for new distributed functions and capabilities such as energy storage or other grid-supportive services, 2) transition the current net energy metering (NEM) program, if necessary, and 3) create new market choices for non-exporting and "smart" exporting distributed energy systems.
27 Kauai Island Utility Cooperative (KIUC), http://kauai.coopwebbuilder.com/sites/kauai.coopwebbuilder.com/files/schedule_q_eff_092012.pdf 28 http://kauai.coopwebbuilder.com/files/42_schedule_nem_effective_june_3_2011.pdf 29 Hawaii Revised Statutes, Chapter 269-91. 30 Source: 2007-2013 Annual RPS Reports to the Hawaii PUC. http://dms.puc.hawaii.gov/dms/. RPS Docket Number: 2007-0008. KIUC RSP data
for 2014 was unavailable at the time of this publication. 31 National Renewable Energy Laboratory, Hawaii Clean Energy Initiative Scenario Analysis, 2012; and DBEDT. 32 Chapter 269-91 et.seq., Hawaii Revised Statutes. http://www.capitol.hawaii.gov/hrscurrent/Vol05_Ch0261-0319/HRS0269/HRS_0269-0091.htm 33 National Renewable Energy Laboratory, http://en.openei.org/apps/TCDB/ 34 http://www.hawaiianelectric.com/heco/_hidden_Hidden/Community/Renewable-Energy?cpsextcurrchannel=1 35 http://www.hawaiianelectric.com/heco/_hidden_Hidden/Community/Renewable-Energy?cpsextcurrchannel=1 36 http://www.hawaiianelectric.com/heco/_hidden_Hidden/Community/Renewable-Energy?cpsextcurrchannel=1 37 Naphtha data from facility-level data, USEPA (http://ghgdata.epa.gov/ghgp/main.do#/facility/) and USEIA
(http://www.eia.gov/beta/api/qb.cfm?category=1017) 38 Aside from the sited source for endnotes #37 and #38, the source for the remaining section under “Bioenergy facilities” section was obtained
from https://energy.ehawaii.gov/epd/public/energy-projects-map.html. 39 The Honolulu Program of Waste Energy Recovery (HPOWER) is the waste-to-energy facility of the City and County of Honolulu. 40 http://www.opala.org/solid_waste/archive/How_our_City_manages_our_waste.html 41 http://hightechmaui.com/maui-county-continues-to-lead-the-way-in-renewable-energy/ 42 DBEDT, Biofuels Report to the Legislature in Response to Act 203, 2012. http://energy.hawaii.gov/wp-
content/uploads/2011/10/BiofuelsStudy_Act203_Dec2012.pdf
Endnotes/References and Links

43 DBEDT Research and Economic Analysis Division, Monthly Energy Trend Highlights, August 2014 44 Hawaii Natural Energy Institute, Bioenergy Master Plan, 2010. http://energy.hawaii.gov/resources/hawaii-state-energy-office-publications 45 Sugar industry rule of thumb, for combustion process without pre-drying of biomass (Hawaiian Commercial and Sugar,
http://www.hcsugar.com/energy_and_the_environment.shtml). 46 EPA Facility Level Information on Greenhouse Gases Tool, http://ghgdata.epa.gov/ghgp/main.do 47 Hawaii Renewable Energy Projects Directory, Hawaii State Energy Office, https://energy.ehawaii.gov/epd/public/energy-projects-map.html 48 With CO2 from power plant. General Atomics, DARPA-funded Kauai algae facility, Congressional Briefings, Washington, D.C. (March 2012). 49 Source: Monthly Energy Trend, READ, DBEDT: The Potential for biofuels production in Hawaii, DBEDT. 50 Source: Monthly Energy Trend, READ, DBEDT: The Potential for biofuels production in Hawaii, DBEDT. 51 Source: Monthly Energy Trend, READ, DBEDT: The Potential for biofuels production in Hawaii, DBEDT. 52 Source: Monthly Energy Trend, READ, DBEDT: The Potential for biofuels production in Hawaii, DBEDT. 53 State of Hawaii, Driving EVs Forward: A Case Study of the Market Introduction and Deployment of the EV in Hawaii, 2012.
http://energy.hawaii.gov/wp-content/uploads/2011/10/ReportMauiElectricVehicleAlliance_12_20_12.pdf 54 http://dbedt.hawaii.gov/economic/energy-trends-2/ 55 Level 2 charging is at 240 volts. All electric vehicles are equipped for this type of charging. A “charger” can have one or more ports. The number
of “ports” determines how many vehicles each charger can service at a time. One “port” can service one vehicle. 56 Level 3, also known as “fast charging,” can provide an 80% charge for some vehicles in less than 30 minutes, depending on vehicle and charger
specifications. Not all vehicles can use fast charging. 58 Ranging from mid-$30,000 to $40,000. 59 Fuel cost comparisons show approximate savings between internal combustion engine and electric vehicles. The example shows that fuel costs
are lower for the Nissan Leaf than for a comparable gasoline fueled vehicle. Nissan Leaf: 24 kWh battery; 0.34 kWh per mile. 60 Based on fuel prices, 45% highway, 55% city driving, and 12, 078 annual miles per year from Hawaii State Data Book.
http://dbedt.hawaii.gov/economic/databook/ 61 The Hawaiian gazette., October 10, 1899, Page 4, Image 4 http://chroniclingamerica.loc.gov/lccn/sn83025121/1899-10-10/ed-1/seq-4/ 62 EIA https://www.yahoo.com/autos/s/california-washington-lead-other-states-electric-car-ownership-133329346.html 63 Hawaii State Energy Office, Report to the Maui Electric Vehicle Alliance Driving EVs Forward: A Case Study of the Market Introduction and Deployment of the EV in Hawaii (PDF) 64 2014 Annual RPS Reports to the Hawaii PUC. RPS Docket Number: 2007-0008: http://dms.puc.hawaii.gov/dms/. 65 GeothermEx, 2005; Assessment of Energy Reserves and Costs of Geothermal Resources in Hawaii. 66 HELCO avoided cost as of Sept. 1, 2014:
http://www.hawaiianelectric.com/vcmcontent/StaticFiles/FileScan/PDF/EnergyServices/Tarrifs/HECO/AvoidCost.pdf 67 Levelized Cost of Energy Calculator and Transparent Cost Database, 46 values, last accessed Sept. 26, 2014. Minimum: $0.04; Maximum: $0.10;
Median $0.06. http://en.openei.org/apps/TCDB/ 68 Myatt, Carl; Hawaii, The Electric Century; 1991 69 2013 Annual RPS Reports to the Hawaii PUC. RPS Docket Number: 2007-0008: http://dms.puc.hawaii.gov/dms/. 70 As of print, 2014 figures were not available for Kauai. 71 Source: 2007-2013 Annual RPS Reports to the Hawaii PUC. http://dms.puc.hawaii.gov/dms/. RPS Docket Number: 2007-0008 72 Kauai Island Utility Cooperative 2013 RPS Report, RPS Docket Number: 2007-0008: http://dms.puc.hawaii.gov/dms/. 73 http://nhaap.ornl.gov/nsd/ 74 http://energy.hawaii.gov/wp-content/uploads/2011/10/HydroelectricPowerAssess.pdf 75 Kauai Island Utility Cooperative 2013 RPS Report, RPS Docket Number: 2007-0008: http://dms.puc.hawaii.gov/dms/. 76 Hawaii State Energy Office data. 77 Hawaii Electric Light Company, Inc.; “2012 Electricity Production & Purchased Power Summary.” 78 http://www.hawaiianelectric.com/heco/Clean-Energy/Renewable-Energy-Basics/Hydroelectricity, accessed May 2014. 79 Hawaii Electric Light Company, Inc.; “2012 Electricity Production & Purchased Power Summary.” 80 For the range of estimated net benefits, i.e., savings, in Net Present Value terms please see DBEDT’s Initial Public Comments in Response to
Hawaii Public Utilities Commission Order No. 31356, Table 1, p 22; NextEra Hawaii LLC’s Initial Public Comments Regarding the Public Interest Benefits of an Oahu-Maui Interisland Transmission System, Table 1.2, p 8; and the HECO IRP Action Plan (Docket No. 2012-0036) Table 108, 109 and 110.
81 See DBEDT’s Initial Public Comments in Response to Hawaii Public Utilities Commission Order No. 31356 in PUC Docket No. 2013-0169. 82 See DBEDT’s Initial Public Comments in Response to Hawaii Public Utilities Commission Order No. 31356 in PUC Docket No. 2013-0169. 83 OpenEI Transparent Cost Database, last accessed Sept. 24, 2014, http://en.openei.org/apps/TCDB/. Based on Intergovernmental Panel on
Climate Change (IPCC) Annex 3. 84 Data from HINMREC. http://hinmrec.hnei.hawaii.edu/wp-content/uploads/2009/12/Wave-Resource-Report-October-11-2010.pdf. 85 NELHA website, http://nelha.org/about/facilities.html 86 Data from Ocean Power Technologies, Inc. 87 NELHA website, http://nelha.hawaii.gov/wp-content/uploads/2013/05/PIP-Aug-2013.pdf. 88 SmartGrid.gov: http://www.smartgrid.gov/the_smart_grid 89 Worldwide Smart Grid Spending to Hit $46 Billion in 2015: http://www.treehugger.com/clean-technology/worldwide-smart-grid-spending-hit-464-billion.html

90 Recovery Act- Smart Grid Investment Grants: http://energy.gov/oe/technology-development/smart-grid/recovery-act-smart-grid-investment-
grants 91 Hawaii Data Book: http://hawaii.gov/dbedt/info/economic/databook/db2011/section01.pdf 92 Sum of stated investment in “Existing Smart Grid Projects in Hawaii” 93 http://www.hawaiianelectric.com/heco/Clean-Energy/Smart-Grid-and-Smart-Meters 94 University of Hawaii RDSI Demonstration Project: http://www.smartgrid.epri.com/doc/Hawaii%20RDSI%20Final.pdf 95 DBEDT Press Release: http://energy.hawaii.gov/wp-content/uploads/2011/09/NR-MOU-Signing-NEDO-Hawaii.11.22.11.pdf 96 KIUC Smart Meter FAQs: http://website.kiuc.coop/content/smart-meter-faqs 97 Honeywell Press Release: http://honeywell.com/News/Pages/Honeywell-And-Hawaiian-Electric-To-Use-Demand-Response-To-Integrate-
Renewables-And-Reduce-Fossil-Fuel-Dependence.aspx 98 http://www.hawaiianelectric.com/heco/_hidden_Hidden/CorpComm/Stem-Strengthens-Grid-Response-for-Hawaiian-Electric-Company?cpsextcurrchannel=1 99 Source: 2007-2013 Annual RPS Reports to the Hawaii PUC. http://dms.puc.hawaii.gov/dms/. RPS Docket Number: 2007-0008. 2014 KIUC RPS
data was unavailable and not reflected in the 2014 statistics. 100 From HECO website, http://www.heco.com/heco/_hidden_Hidden/CorpComm/Rooftop-PV-enjoys-another-strong-year-in-
Hawaii?cpsextcurrchannel=1 101 Source: 2007-2013 Annual NEM, FIT Reports to the Hawaii PUC, http://puc.hawaii.gov/reports/energy-reports/ 102 Source: 2007 -2013 Annual RPS, NEM Reports to the Hawaii PUC, http://puc.hawaii.gov/reports/energy-reports/ . DBEDT calculation: solar
generation (MWh) divided by HECO net sales (MWh). 103 On April 28, 2014, the Hawaii Public Utilities Commission issued a series of decisions and orders calling for the HECO Companies to provide
power supply and distribution resource plans, including resolution of PV interconnection delays. In particular, see decisions, orders, and participant responses in PUC Docket No. 2011-0206 (the “RSWG Docket”); Docket No. 2014-0192 (“the DER docket”) and Docket No. 2014-0130 (“Rule 14H Docket”). http://dms.puc.hawaii.gov/dms/index.jsp.
104 Source: 2007 -2013 Annual RPS Reports to the Hawaii PUC, http://puc.hawaii.gov/reports/energy-reports/ . 2014 KIUC RPS data was unavailable at the time of this report and was excluded from this statistic.
105 http://energy.hawaii.gov/wp-content/uploads/2011/09/NR_EnvironAmerica_7.23.13.pdf 106 Source: PUC Docket No: 2014-0192 filed by Hawaiian Electric Industries on 1/21/15. 107 Based on PPA waiver bids under 16 cents/kWh in PUC Dockets No. 2013-0156 and 2013-0381 and 16.1 cents/kWh in HECO’s Kahe Utility-Scale
Photovoltaic (“PV”) Generating System, Hawaiian Electric Application, Verification, Exhibits 1-11; Oct. 22, 2013. PUC Docket No. 2013-0360. 108 Module output ranges from about 11 to 19 watts per square foot. Sanchez, Justine; “PV Module Selection.” In Home Power issue #163,
October/November 2014. 109 California Energy Commission. List of Eligible SB1 Guidelines Compliant Photovoltaic Modules, Updated as of March 1, 2013.
http://www.gosolarcalifornia.org/equipment/pv_modules.php 110 Represents median national price. ”Tracking the Sun VII: An Historical Summary of the Installed Price of Photovoltaics in the United States from
1998 to 2013;” Galen Barbose, Samantha Weaver, and Naim Darghouth; Lawrence Berkeley National Laboratory; September 2014. 111 Represents median national price. Ibid. 112 Source: DBEDT, March 2014. 113 Maunalani, 0.3 MW, 1.5 acres; La Ola, 1.5 MW, 10 acres; Hoku/Forest City, 1.2 MW, 4 acres; Kapaa, 1.21 MW, 5 acres; Port Allen, 6 MW, 20
acres; Kalaeloa SunPower, 5 MW, 36 acres; Kaleloa Scatec Solar project, 5 MW, 20 acres; Kalaeloa Home Lands Solar, 5 MW, 29 acres. 114 Source: 2007 -2014 Annual RPS Reports to the Hawaii PUC, http://puc.hawaii.gov/reports/energy-reports/. Due to the unavailability of KIUC
2014 RPS data at the time of this report, statistic does not reflect KIUC’s data. 115 Wind capacity factors was computed by accessing EIA 860 and EIA 923 for the denominator and numerator, respectively. 116 Source: 2007 -2014 Annual RPS Reports to the Hawaii PUC, http://puc.hawaii.gov/reports/energy-reports/ . 117 http://www.edf-re.com/about/press/construction_of_hawi_wind_farm_to_begin_in_november_2005 ;
http://www.nrel.gov/news/features/feature_detail.cfm/feature_id=1748 118 http://www.businesswire.com/news/home/20120705005753/en/Wind-Announces-Completion-Kaheawa-Wind-II-Project 119 Actual footprint is 26 acres. Personal communication, Steven Pace, 4/26/13. Parcel size is 67 acres. http://www.hawaiipropertytax.com.
http://www.heco.com/portal/site/heco/menuitem.508576f78baa14340b4c0610c510b1ca 120 http://hawaii.gov/dlnr/dofaw/hcp/Kahuku_HCP_Text.pdf 121 http://oeqc.doh.hawaii.gov/Shared%20Documents/EA_and_EIS_Online_Library/Oahu/2010s/2010-09-23-OA-EISPN-Kawailoa-Wind-Farm.pdf 122 http://www.businesswire.com/news/home/20120705005753/en/Wind-Announces-Completion-Kaheawa-Wind-II-Project 123 http://www.semprausgp.com/_/downloads/pdfs/Final_EIS_for_Auwahi_Wind.pdf 124 RPS reports. http://dms.puc.hawaii.gov/dms/. RPS Docket Number: 2007-0008 125 RPS reports and PUC fillings. 126 Siemens turbines at Kawailoa, 90 m hub height. 127 US Department of Energy program estimate, Transparent Cost Database, 110 values, last accessed March 24, 2015. Minimum: $0.04; Median
$0.07; Maximum $0.11. http://en.openei.org/apps/TCDB/ 128 Renewable Energy Permitting Barriers in Hawaii: Experience from the Field, National Renewable Energy Laboratory (March 2013). http://www.nrel.gov/docs/fy13osti/55630.pdf 129 NASEO Best Practices Review: Streamlined Renewable Energy Permitting Initiatives (Nov. 2013).
http://www.naseo.org/data/sites/1/documents/publications/NASEO-Best-Practices-Review--Streamlined-RE-Permitting-Initiatives.pdf 130 Renewable Energy Permitting Barriers in Hawaii: Experience from the Field, National Renewable Energy Laboratory (March 2013). http://www.nrel.gov/docs/fy13osti/55630.pdf

131 Renewable Energy Permitting Barriers in Hawaii: Experience from the Field, National Renewable Energy Laboratory (March 2013).
http://www.nrel.gov/docs/fy13osti/55630.pdf