Embed Size (px)
Citation preview
May 2008 US Sensor Calibration 1
Ultrasonic Sensors Calibration
Omar A. Daud Truc-Vien T. Nguyen
May 16, 2008
May 2008 US Sensor Calibration 2
Plan
Ultrasonic sensors Calibration Approaches Analysis Conclusion
May 2008 US Sensor Calibration 3
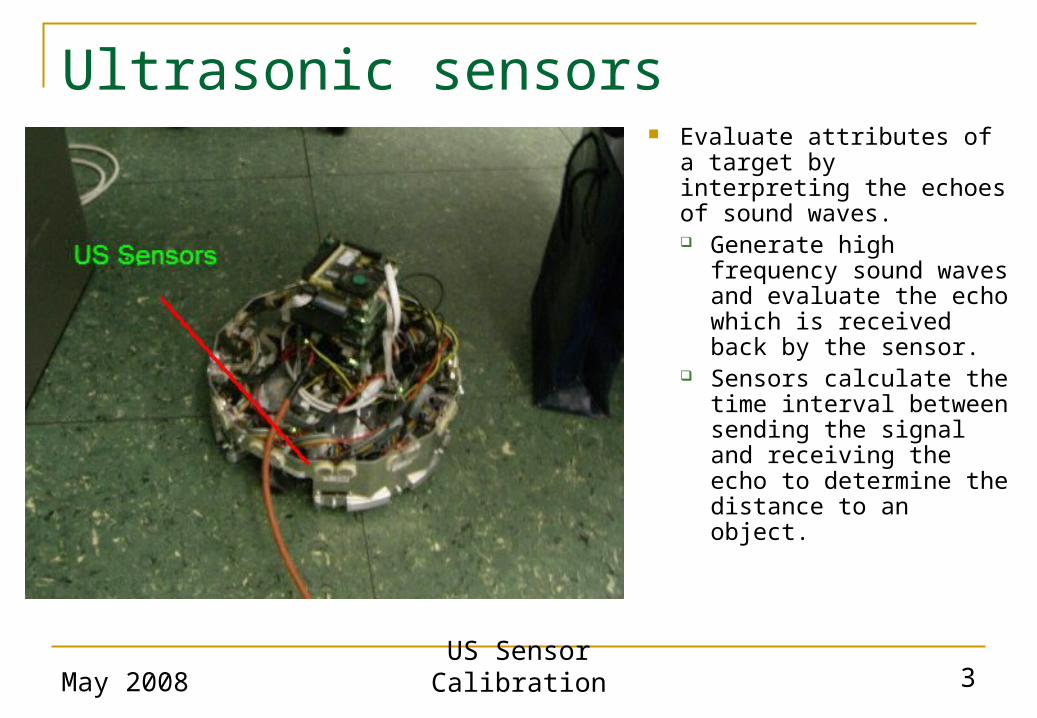
Evaluate attributes of a target by interpreting the echoes of sound waves. Generate high
frequency sound waves and evaluate the echo which is received back by the sensor.
Sensors calculate the time interval between sending the signal and receiving the echo to determine the distance to an object.
Ultrasonic sensors
May 2008 US Sensor Calibration 4
Plan
Ultrasonic sensors Calibration Approaches Analysis Conclusion
May 2008 US Sensor Calibration 5
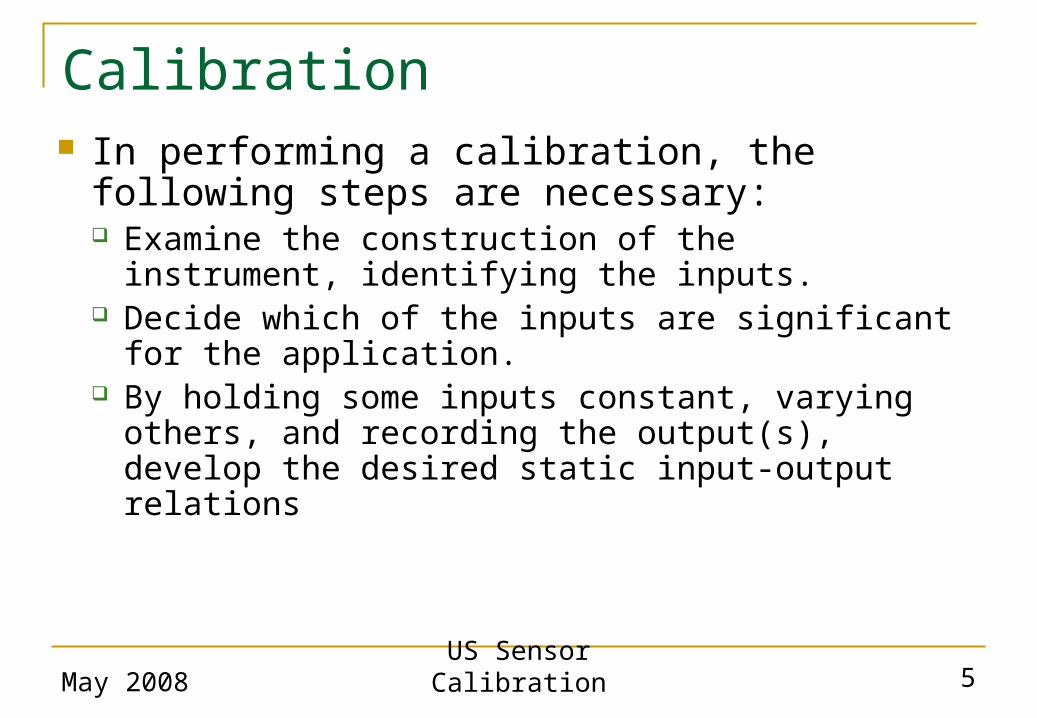
In performing a calibration, the following steps are necessary: Examine the construction of the instrument, identifying
the inputs. Decide which of the inputs are significant for the
application. By holding some inputs constant, varying others, and
recording the output(s), develop the desired static input-output relations
Calibration
May 2008 US Sensor Calibration 6
Plan
Ultrasonic sensors Calibration Approaches Analysis Conclusion
May 2008 US Sensor Calibration 7
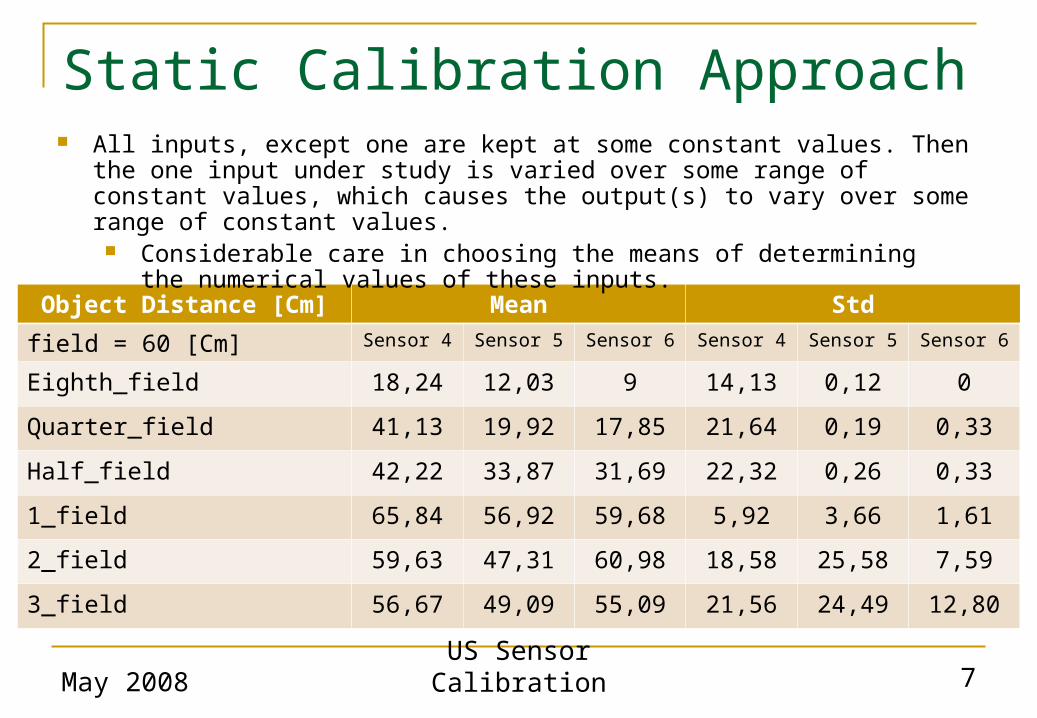
Static Calibration Approach
Object Distance [Cm] Mean Std
field = 60 [Cm] Sensor 4 Sensor 5 Sensor 6 Sensor 4 Sensor 5 Sensor 6
Eighth_field 18,24 12,03 9 14,13 0,12 0
Quarter_field 41,13 19,92 17,85 21,64 0,19 0,33
Half_field 42,22 33,87 31,69 22,32 0,26 0,33
1_field 65,84 56,92 59,68 5,92 3,66 1,61
2_field 59,63 47,31 60,98 18,58 25,58 7,59
3_field 56,67 49,09 55,09 21,56 24,49 12,80
All inputs, except one are kept at some constant values. Then the one input under study is varied over some range of constant values, which causes the output(s) to vary over some range of constant values.
Considerable care in choosing the means of determining the numerical values of these inputs.
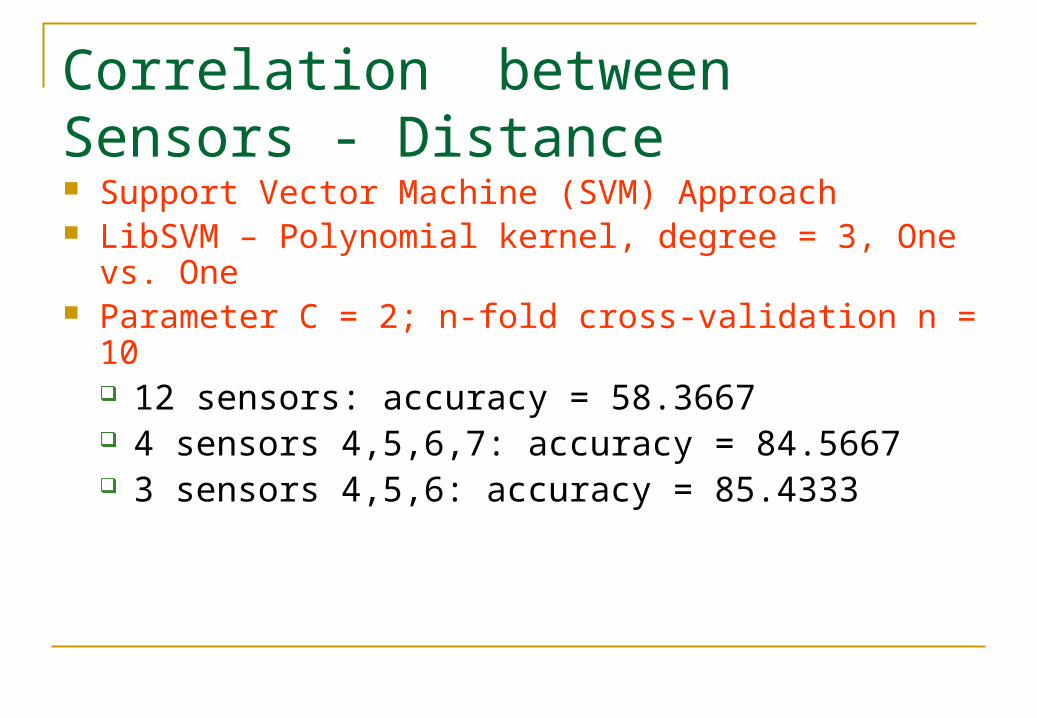
Support Vector Machine (SVM) Approach LibSVM – Polynomial kernel, degree = 3, One vs. One Parameter C = 2; n-fold cross-validation n = 10
12 sensors: accuracy = 58.3667 4 sensors 4,5,6,7: accuracy = 84.5667 3 sensors 4,5,6: accuracy = 85.4333
Correlation between Sensors - Distance
May 2008 US Sensor Calibration 9
Plan
Ultrasonic sensors Calibration Approaches Analysis Conclusion
May 2008 US Sensor Calibration 10
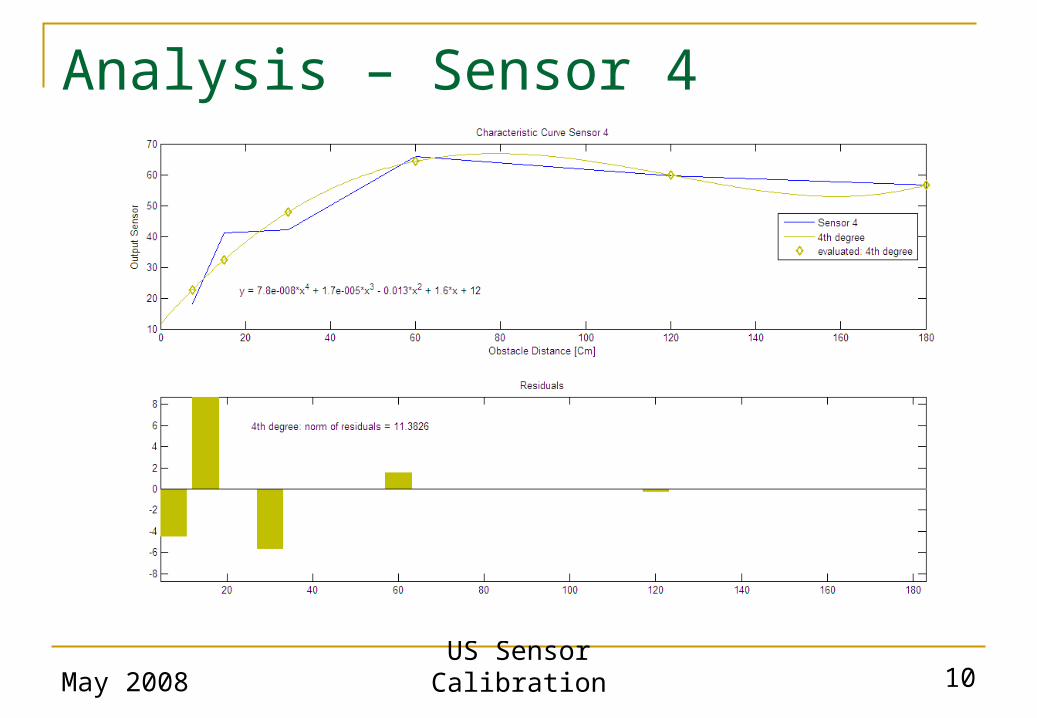
Analysis – Sensor 4
May 2008 US Sensor Calibration 11
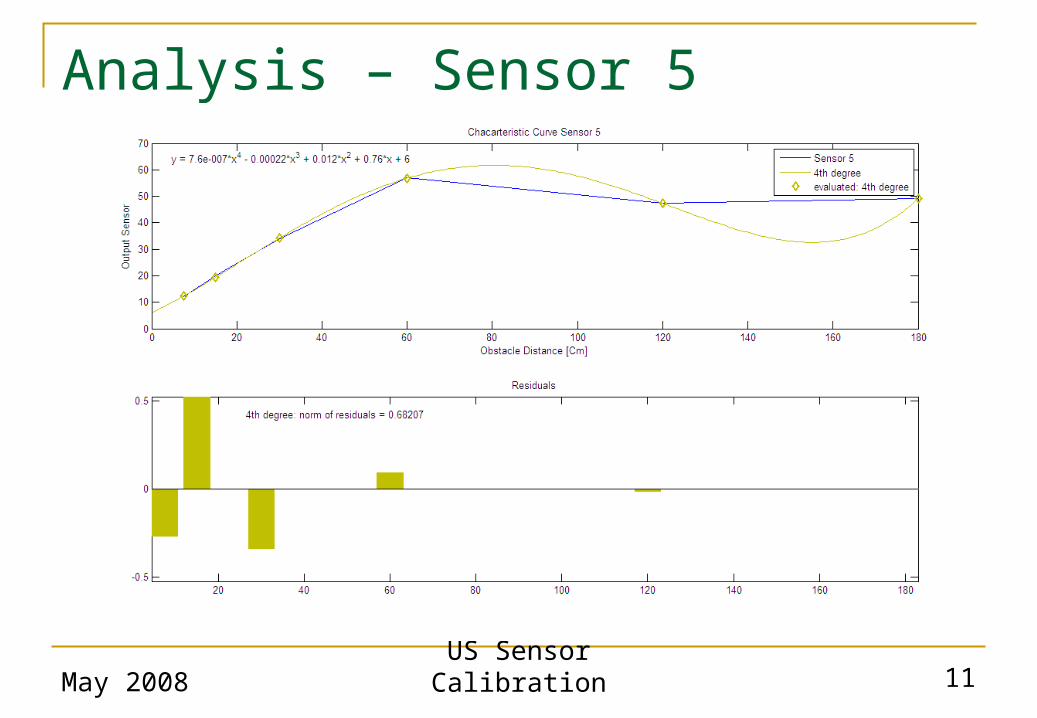
Analysis – Sensor 5

May 2008 US Sensor Calibration 12
Analysis – Sensor 6
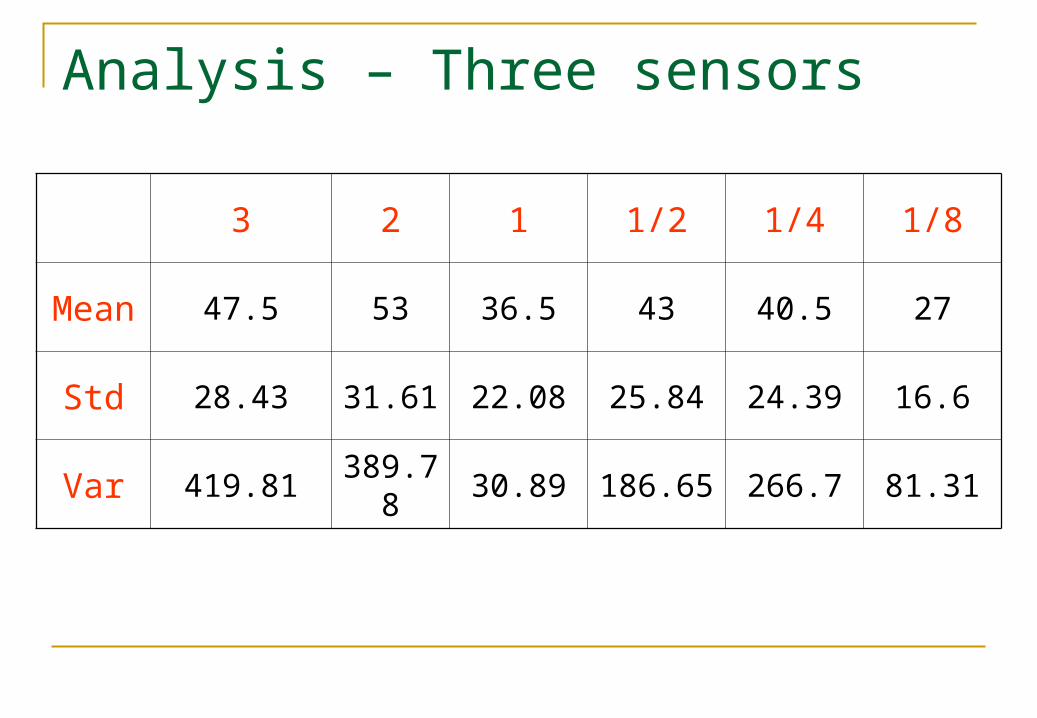
Analysis – Three sensors
3 2 1 1/2 1/4 1/8
Mean 47.5 53 36.5 43 40.5 27
Std 28.43 31.61 22.08 25.84 24.39 16.6
Var 419.81 389.78 30.89 186.65 266.7 81.31
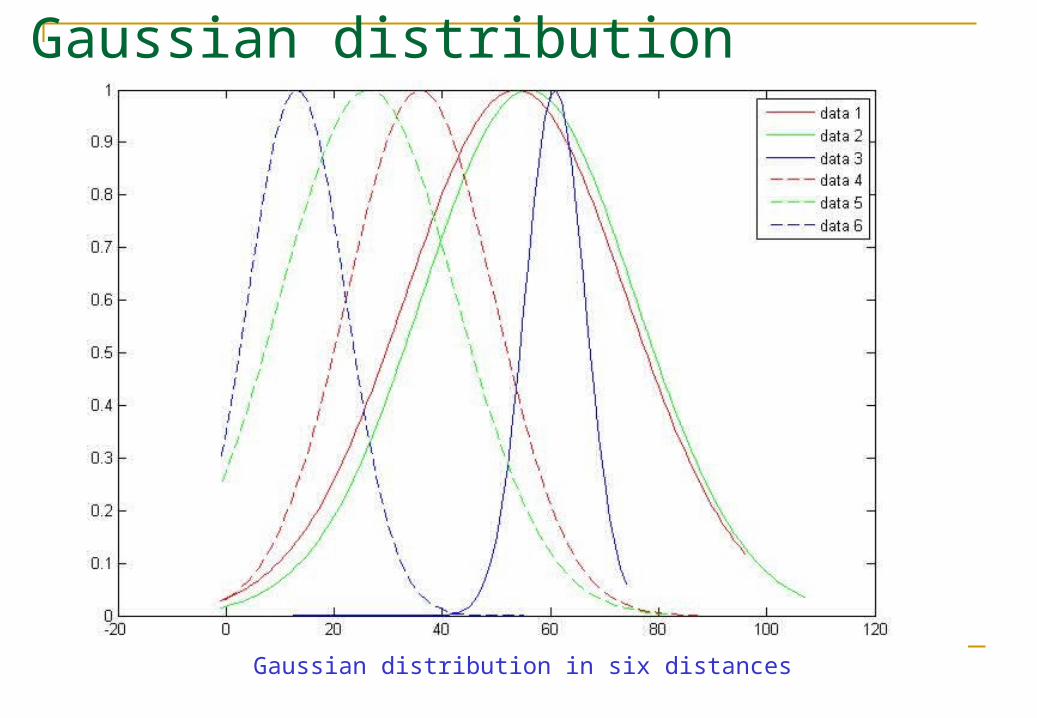
Gaussian distribution in six distances
Gaussian distribution
May 2008 US Sensor Calibration 15
Plan
Ultrasonic sensors Calibration Approaches Analysis Conclusion
May 2008 US Sensor Calibration 16
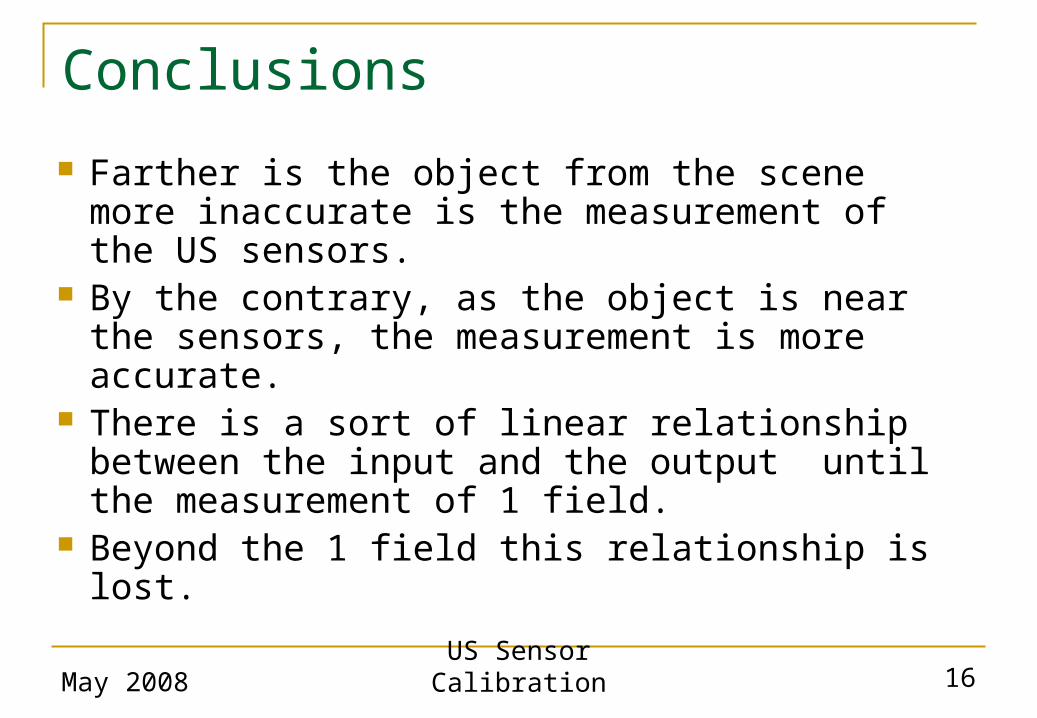
Farther is the object from the scene more inaccurate is the measurement of the US sensors.
By the contrary, as the object is near the sensors, the measurement is more accurate.
There is a sort of linear relationship between the input and the output until the measurement of 1 field.
Beyond the 1 field this relationship is lost.
Conclusions