Embed Size (px)
Citation preview
© The Chartered Institute of Management Accountants 2005
May 2005 Examinations Managerial Level Paper P2 – Management Accounting – Decision Management Question Paper 2 Examiner’s Brief Guide to the Paper 16 Examiner’s Answers 17 The answers published here have been written by the Examiner and should provide a helpful guide for both tutors and students. Published separately on the CIMA website (www.cimaglobal.com/students) from mid-September 2005 is a Post Examination Guide for this paper, which provides much valuable and complementary material including indicative mark information. © 2005 The Chartered Institute of Management Accountants. All rights reserved. No part of this publication may be reproduced, stored in a retrieval system, or transmitted, in any form or by any means, electronic, mechanical, photocopying, recorded or otherwise, without the written permission of the publisher.
P2 2 May 2005
Management Accounting Pillar
Managerial Level Paper
P2 – Management Accounting - Decision Management
25 May 2005 – Wednesday Morning Session
Instructions to candidates
You are allowed three hours to answer this question paper
You are allowed 20 minutes reading time before the examination begins during which you should read the question paper, and if you wish, make annotations on the question paper. However, you will not be allowed, under any circumstances, to open the answer book and start writing or use your calculator during this reading time.
You are strongly advised to carefully read the question requirement before attempting the question concerned. The requirements for the questions in Sections B and C are contained in a dotted box.
Answer the ONE compulsory question in Section A. This is comprised of eight sub-questions and is on pages 2 to 5.
Answer ALL THREE compulsory questions in Section B on pages 6 to 8.
Answer TWO of the three questions in Section C on pages 9 to 13.
Maths Tables and Formulae are provided on pages 15 to 17. These pages are detachable for ease of reference.
Write your full examination number, paper number and the examination subject title in the spaces provided on the front of the examination answer book. Also write your contact ID and name in the space provided in the right hand margin and seal to close.
Tick the appropriate boxes on the front of the answer book to indicate which questions you have answered.
P2 –
Dec
isio
n M
anag
emen
t
May 2005 3 P2
SECTION A – 20 MARKS [the indicative time for answering this section is 36 minutes] ANSWER ALL EIGHT SUB-QUESTIONS
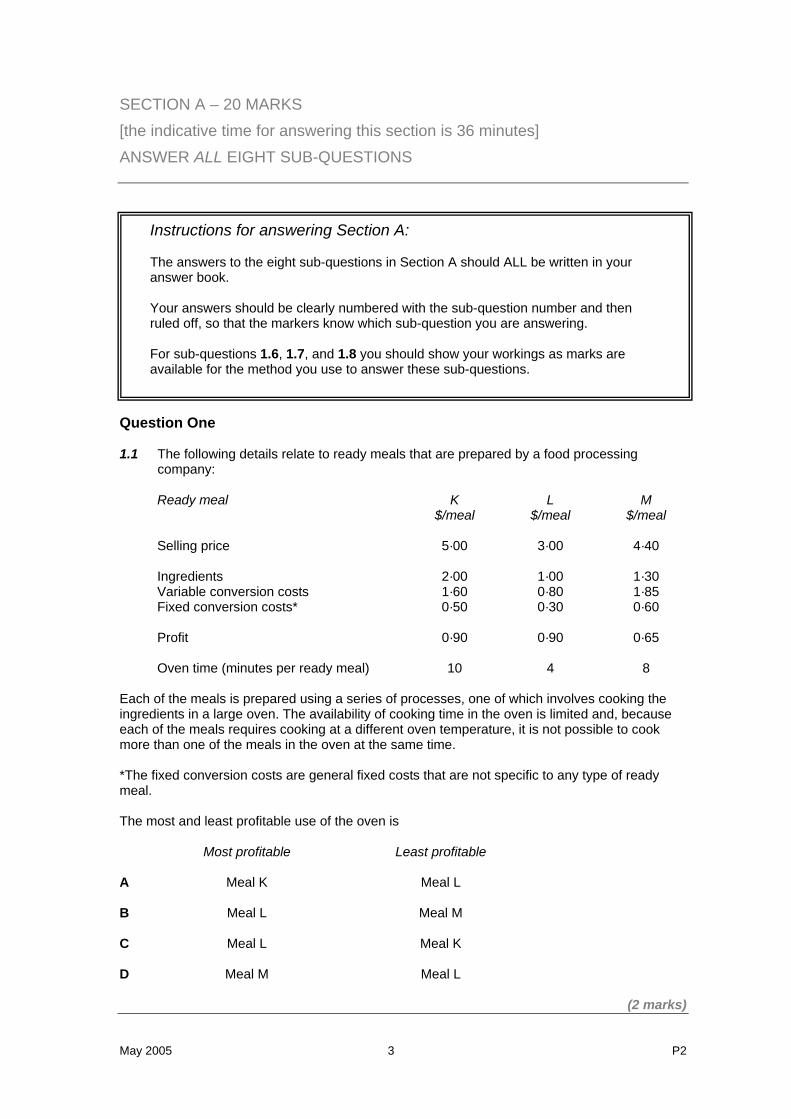
Question One 1.1 The following details relate to ready meals that are prepared by a food processing
company: Ready meal K L M $/meal $/meal $/meal Selling price 5·00 3·00 4·40 Ingredients 2·00 1·00 1·30 Variable conversion costs 1·60 0·80 1·85 Fixed conversion costs* 0·50 0·30 0·60 Profit 0·90 0·90 0·65 Oven time (minutes per ready meal) 10 4 8 Each of the meals is prepared using a series of processes, one of which involves cooking the ingredients in a large oven. The availability of cooking time in the oven is limited and, because each of the meals requires cooking at a different oven temperature, it is not possible to cook more than one of the meals in the oven at the same time. *The fixed conversion costs are general fixed costs that are not specific to any type of ready meal. The most and least profitable use of the oven is Most profitable Least profitable
A
Meal K Meal L
B
Meal L Meal M
C
Meal L Meal K
D
Meal M Meal L
(2 marks)
Instructions for answering Section A: The answers to the eight sub-questions in Section A should ALL be written in your answer book. Your answers should be clearly numbered with the sub-question number and then ruled off, so that the markers know which sub-question you are answering. For sub-questions 1.6, 1.7, and 1.8 you should show your workings as marks are available for the method you use to answer these sub-questions.
P2 4 May 2005
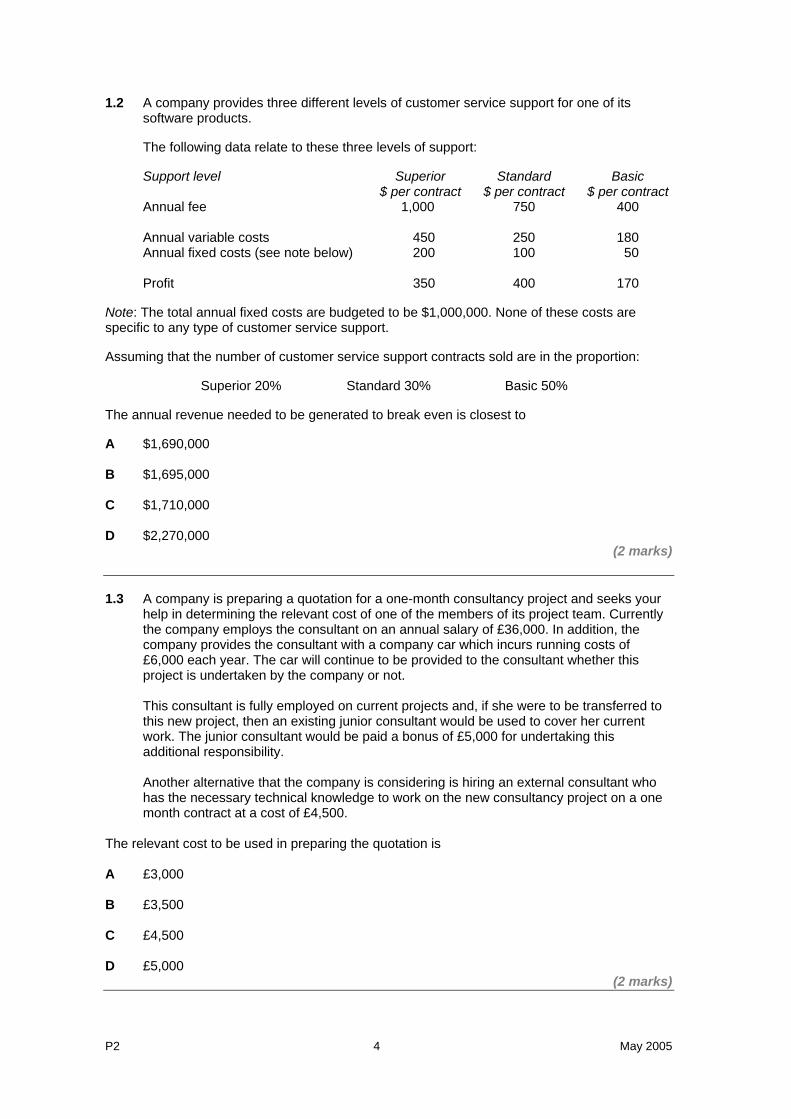
1.2 A company provides three different levels of customer service support for one of its software products.
The following data relate to these three levels of support:
Support level Superior Standard Basic $ per contract $ per contract $ per contract Annual fee 1,000 750 400 Annual variable costs 450 250 180 Annual fixed costs (see note below) 200 100 50 Profit 350 400 170 Note: The total annual fixed costs are budgeted to be $1,000,000. None of these costs are specific to any type of customer service support. Assuming that the number of customer service support contracts sold are in the proportion:
Superior 20% Standard 30% Basic 50% The annual revenue needed to be generated to break even is closest to A $1,690,000 B $1,695,000 C $1,710,000 D $2,270,000
(2 marks) 1.3 A company is preparing a quotation for a one-month consultancy project and seeks your
help in determining the relevant cost of one of the members of its project team. Currently the company employs the consultant on an annual salary of £36,000. In addition, the company provides the consultant with a company car which incurs running costs of £6,000 each year. The car will continue to be provided to the consultant whether this project is undertaken by the company or not. This consultant is fully employed on current projects and, if she were to be transferred to this new project, then an existing junior consultant would be used to cover her current work. The junior consultant would be paid a bonus of £5,000 for undertaking this additional responsibility. Another alternative that the company is considering is hiring an external consultant who has the necessary technical knowledge to work on the new consultancy project on a one month contract at a cost of £4,500.
The relevant cost to be used in preparing the quotation is
A £3,000 B £3,500 C £4,500 D £5,000
(2 marks)
May 2005 5 P2
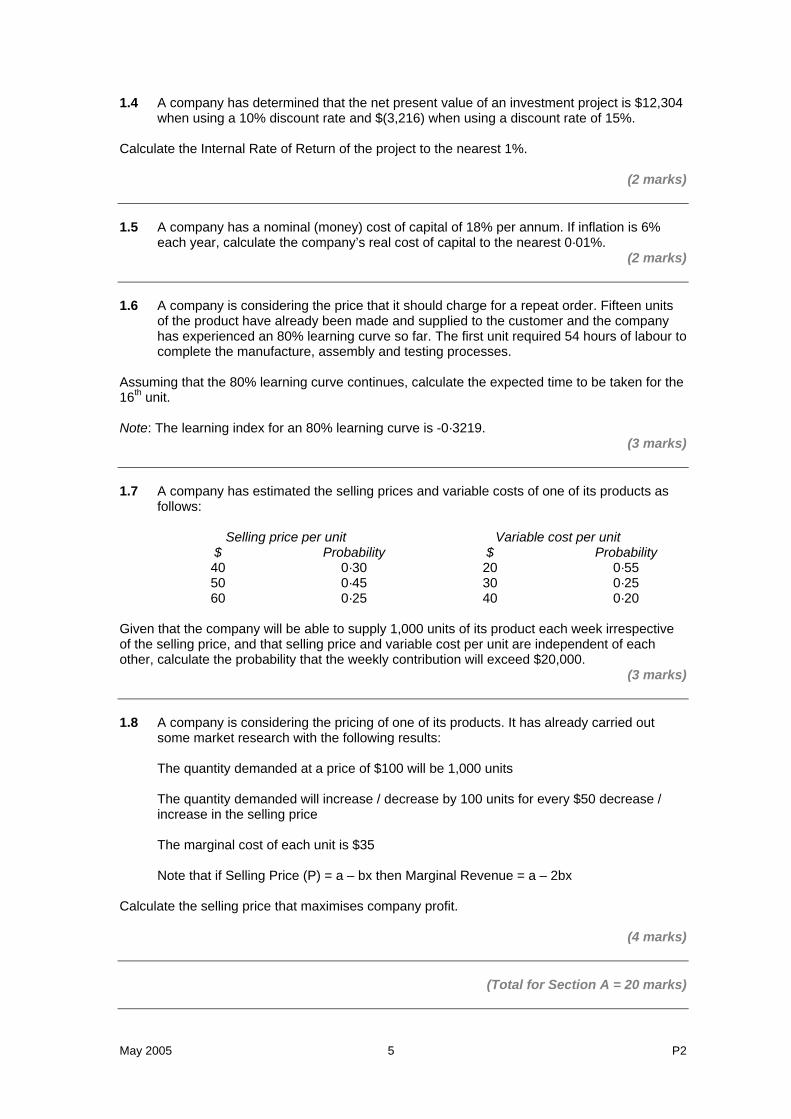
1.4 A company has determined that the net present value of an investment project is $12,304 when using a 10% discount rate and $(3,216) when using a discount rate of 15%.
Calculate the Internal Rate of Return of the project to the nearest 1%.
(2 marks) 1.5 A company has a nominal (money) cost of capital of 18% per annum. If inflation is 6%
each year, calculate the company’s real cost of capital to the nearest 0·01%. (2 marks)
1.6 A company is considering the price that it should charge for a repeat order. Fifteen units
of the product have already been made and supplied to the customer and the company has experienced an 80% learning curve so far. The first unit required 54 hours of labour to complete the manufacture, assembly and testing processes.
Assuming that the 80% learning curve continues, calculate the expected time to be taken for the 16th unit. Note: The learning index for an 80% learning curve is -0·3219.
(3 marks) 1.7 A company has estimated the selling prices and variable costs of one of its products as
follows: Selling price per unit Variable cost per unit $ Probability $ Probability
40 0·30 20 0·55 50 0·45 30 0·25 60 0·25 40 0·20
Given that the company will be able to supply 1,000 units of its product each week irrespective of the selling price, and that selling price and variable cost per unit are independent of each other, calculate the probability that the weekly contribution will exceed $20,000.
(3 marks) 1.8 A company is considering the pricing of one of its products. It has already carried out
some market research with the following results:
The quantity demanded at a price of $100 will be 1,000 units
The quantity demanded will increase / decrease by 100 units for every $50 decrease / increase in the selling price
The marginal cost of each unit is $35
Note that if Selling Price (P) = a – bx then Marginal Revenue = a – 2bx
Calculate the selling price that maximises company profit.
(4 marks)
(Total for Section A = 20 marks)
P2 6 May 2005
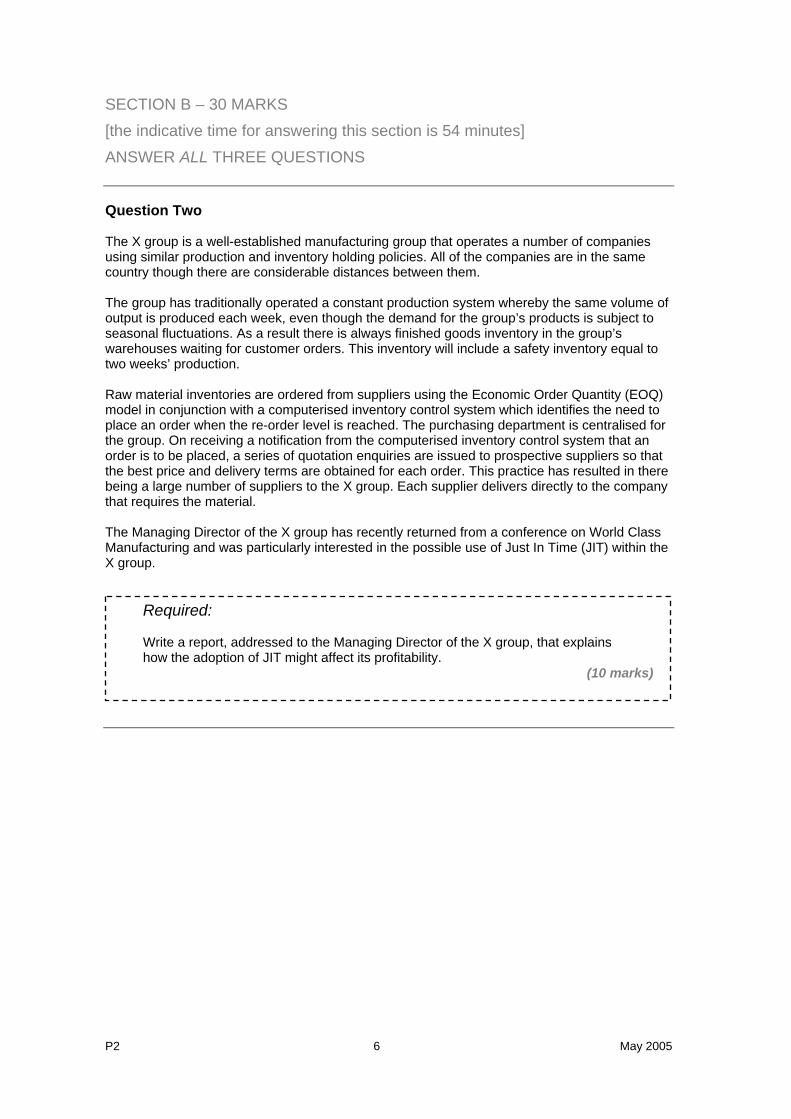
SECTION B – 30 MARKS [the indicative time for answering this section is 54 minutes] ANSWER ALL THREE QUESTIONS Question Two The X group is a well-established manufacturing group that operates a number of companies using similar production and inventory holding policies. All of the companies are in the same country though there are considerable distances between them. The group has traditionally operated a constant production system whereby the same volume of output is produced each week, even though the demand for the group’s products is subject to seasonal fluctuations. As a result there is always finished goods inventory in the group’s warehouses waiting for customer orders. This inventory will include a safety inventory equal to two weeks’ production. Raw material inventories are ordered from suppliers using the Economic Order Quantity (EOQ) model in conjunction with a computerised inventory control system which identifies the need to place an order when the re-order level is reached. The purchasing department is centralised for the group. On receiving a notification from the computerised inventory control system that an order is to be placed, a series of quotation enquiries are issued to prospective suppliers so that the best price and delivery terms are obtained for each order. This practice has resulted in there being a large number of suppliers to the X group. Each supplier delivers directly to the company that requires the material. The Managing Director of the X group has recently returned from a conference on World Class Manufacturing and was particularly interested in the possible use of Just In Time (JIT) within the X group.
Required: Write a report, addressed to the Managing Director of the X group, that explains how the adoption of JIT might affect its profitability.
(10 marks)
May 2005 7 P2
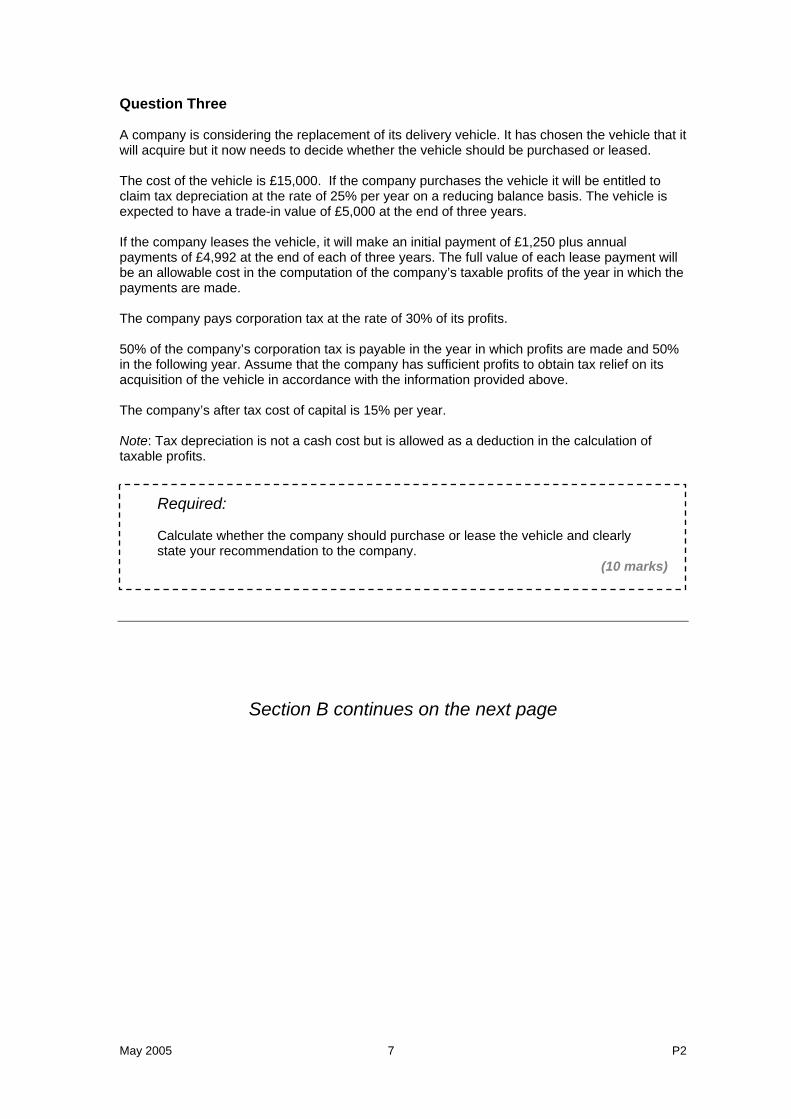
Question Three A company is considering the replacement of its delivery vehicle. It has chosen the vehicle that it will acquire but it now needs to decide whether the vehicle should be purchased or leased. The cost of the vehicle is £15,000. If the company purchases the vehicle it will be entitled to claim tax depreciation at the rate of 25% per year on a reducing balance basis. The vehicle is expected to have a trade-in value of £5,000 at the end of three years. If the company leases the vehicle, it will make an initial payment of £1,250 plus annual payments of £4,992 at the end of each of three years. The full value of each lease payment will be an allowable cost in the computation of the company’s taxable profits of the year in which the payments are made. The company pays corporation tax at the rate of 30% of its profits. 50% of the company’s corporation tax is payable in the year in which profits are made and 50% in the following year. Assume that the company has sufficient profits to obtain tax relief on its acquisition of the vehicle in accordance with the information provided above. The company’s after tax cost of capital is 15% per year. Note: Tax depreciation is not a cash cost but is allowed as a deduction in the calculation of taxable profits.
Required: Calculate whether the company should purchase or lease the vehicle and clearly state your recommendation to the company.
(10 marks)
Section B continues on the next page
P2 8 May 2005
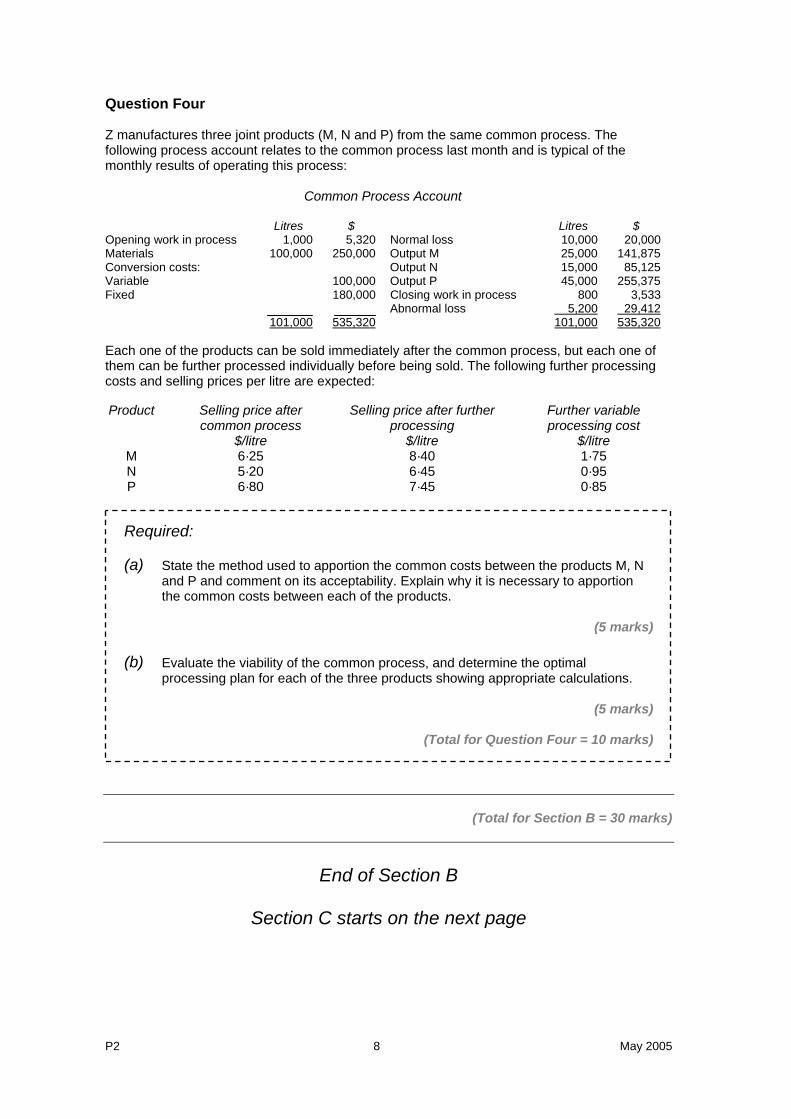
Question Four Z manufactures three joint products (M, N and P) from the same common process. The following process account relates to the common process last month and is typical of the monthly results of operating this process:
Common Process Account
Litres $ Litres $ Opening work in process 1,000 5,320 Normal loss 10,000 20,000 Materials 100,000 250,000 Output M 25,000 141,875 Conversion costs: Output N 15,000 85,125 Variable 100,000 Output P 45,000 255,375 Fixed 180,000 Closing work in process 800 3,533 Abnormal loss 5,200 29,412 101,000 535,320 101,000 535,320 Each one of the products can be sold immediately after the common process, but each one of them can be further processed individually before being sold. The following further processing costs and selling prices per litre are expected: Product Selling price after
common process Selling price after further
processing Further variable processing cost
$/litre $/litre $/litre M 6·25 8·40 1·75 N 5·20 6·45 0·95 P 6·80 7·45 0·85
Required:
(a) State the method used to apportion the common costs between the products M, N and P and comment on its acceptability. Explain why it is necessary to apportion the common costs between each of the products.
(5 marks)
(b) Evaluate the viability of the common process, and determine the optimal
processing plan for each of the three products showing appropriate calculations.
(5 marks)
(Total for Question Four = 10 marks)
(Total for Section B = 30 marks)
End of Section B
Section C starts on the next page
May 2005 9 P2
SECTION C – 50 MARKS [the indicative time for answering this section is 90 minutes] ANSWER TWO QUESTIONS OUT OF THREE
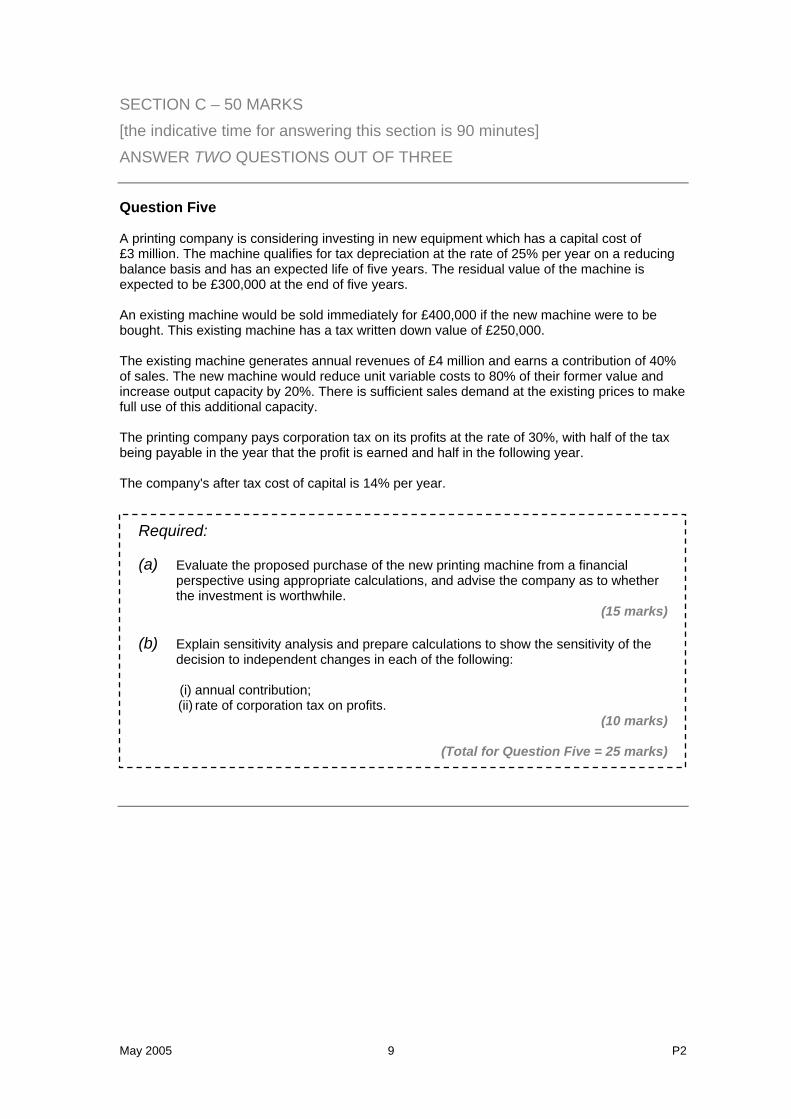
Question Five A printing company is considering investing in new equipment which has a capital cost of £3 million. The machine qualifies for tax depreciation at the rate of 25% per year on a reducing balance basis and has an expected life of five years. The residual value of the machine is expected to be £300,000 at the end of five years. An existing machine would be sold immediately for £400,000 if the new machine were to be bought. This existing machine has a tax written down value of £250,000. The existing machine generates annual revenues of £4 million and earns a contribution of 40% of sales. The new machine would reduce unit variable costs to 80% of their former value and increase output capacity by 20%. There is sufficient sales demand at the existing prices to make full use of this additional capacity. The printing company pays corporation tax on its profits at the rate of 30%, with half of the tax being payable in the year that the profit is earned and half in the following year. The company's after tax cost of capital is 14% per year.
Required:
(a) Evaluate the proposed purchase of the new printing machine from a financial perspective using appropriate calculations, and advise the company as to whether the investment is worthwhile.
(15 marks)
(b) Explain sensitivity analysis and prepare calculations to show the sensitivity of the decision to independent changes in each of the following:
(i) annual contribution; (ii) rate of corporation tax on profits.
(10 marks)
(Total for Question Five = 25 marks)
P2 10 May 2005
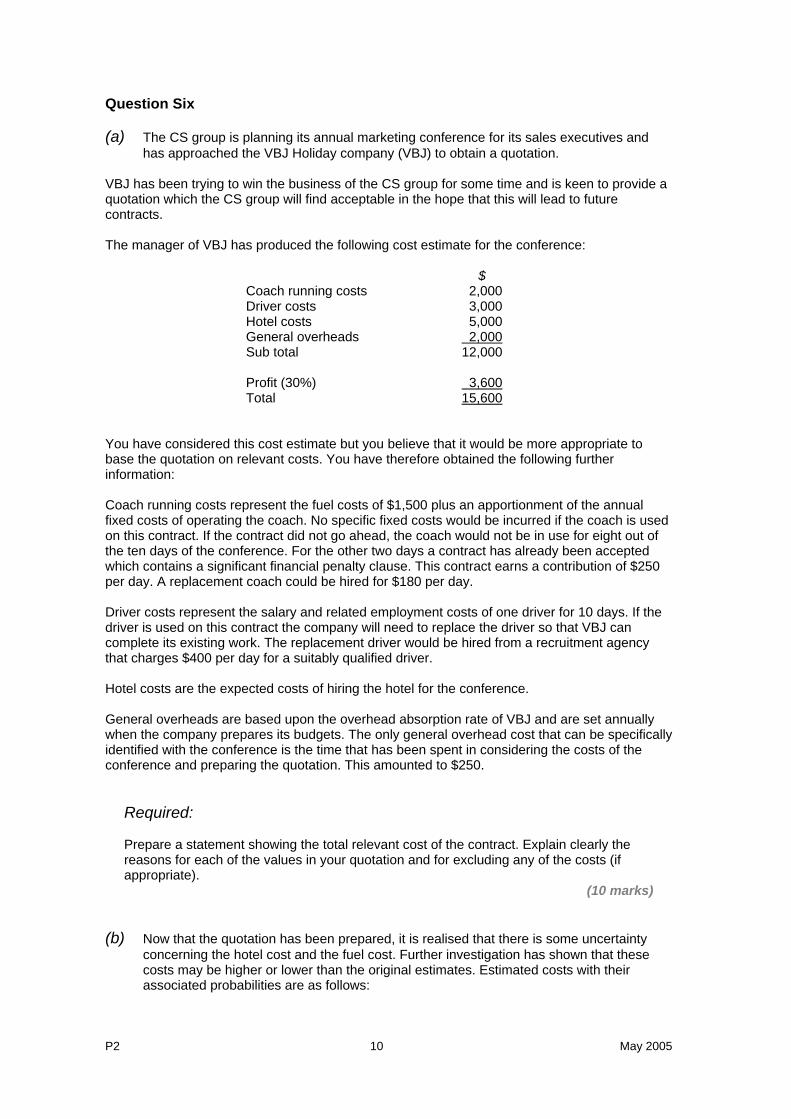
Question Six (a) The CS group is planning its annual marketing conference for its sales executives and
has approached the VBJ Holiday company (VBJ) to obtain a quotation. VBJ has been trying to win the business of the CS group for some time and is keen to provide a quotation which the CS group will find acceptable in the hope that this will lead to future contracts. The manager of VBJ has produced the following cost estimate for the conference:
$ Coach running costs 2,000 Driver costs 3,000 Hotel costs 5,000 General overheads 2,000 Sub total 12,000 Profit (30%) 3,600 Total 15,600
You have considered this cost estimate but you believe that it would be more appropriate to base the quotation on relevant costs. You have therefore obtained the following further information: Coach running costs represent the fuel costs of $1,500 plus an apportionment of the annual fixed costs of operating the coach. No specific fixed costs would be incurred if the coach is used on this contract. If the contract did not go ahead, the coach would not be in use for eight out of the ten days of the conference. For the other two days a contract has already been accepted which contains a significant financial penalty clause. This contract earns a contribution of $250 per day. A replacement coach could be hired for $180 per day. Driver costs represent the salary and related employment costs of one driver for 10 days. If the driver is used on this contract the company will need to replace the driver so that VBJ can complete its existing work. The replacement driver would be hired from a recruitment agency that charges $400 per day for a suitably qualified driver. Hotel costs are the expected costs of hiring the hotel for the conference. General overheads are based upon the overhead absorption rate of VBJ and are set annually when the company prepares its budgets. The only general overhead cost that can be specifically identified with the conference is the time that has been spent in considering the costs of the conference and preparing the quotation. This amounted to $250.
Required: Prepare a statement showing the total relevant cost of the contract. Explain clearly the reasons for each of the values in your quotation and for excluding any of the costs (if appropriate).
(10 marks)
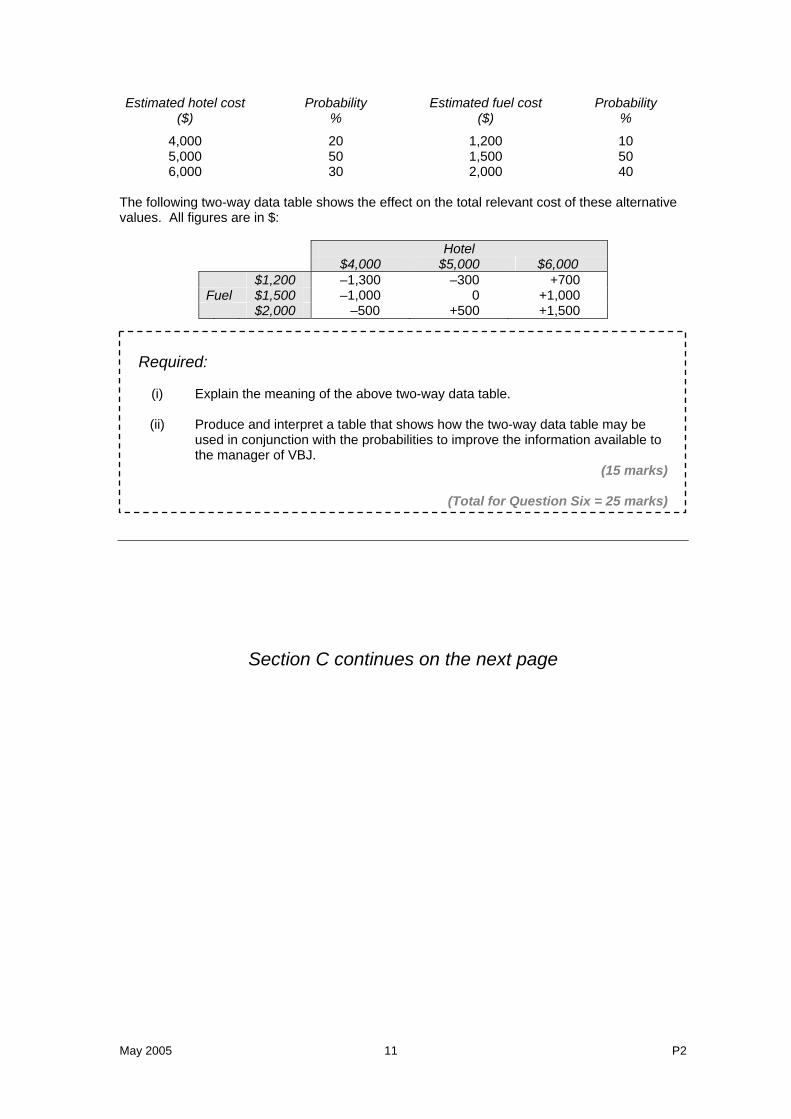
(b) Now that the quotation has been prepared, it is realised that there is some uncertainty concerning the hotel cost and the fuel cost. Further investigation has shown that these costs may be higher or lower than the original estimates. Estimated costs with their associated probabilities are as follows:
May 2005 11 P2
Estimated hotel cost ($)
Probability %
Estimated fuel cost ($)
Probability %
4,000 20 1,200 10 5,000 50 1,500 50 6,000 30 2,000 40
The following two-way data table shows the effect on the total relevant cost of these alternative values. All figures are in $:
Hotel $4,000 $5,000 $6,000 $1,200 –1,300 –300 +700 Fuel $1,500 –1,000 0 +1,000 $2,000 –500 +500 +1,500
Required:
(i) Explain the meaning of the above two-way data table.
(ii) Produce and interpret a table that shows how the two-way data table may be
used in conjunction with the probabilities to improve the information available to the manager of VBJ.
(15 marks)
(Total for Question Six = 25 marks)
Section C continues on the next page
P2 12 May 2005
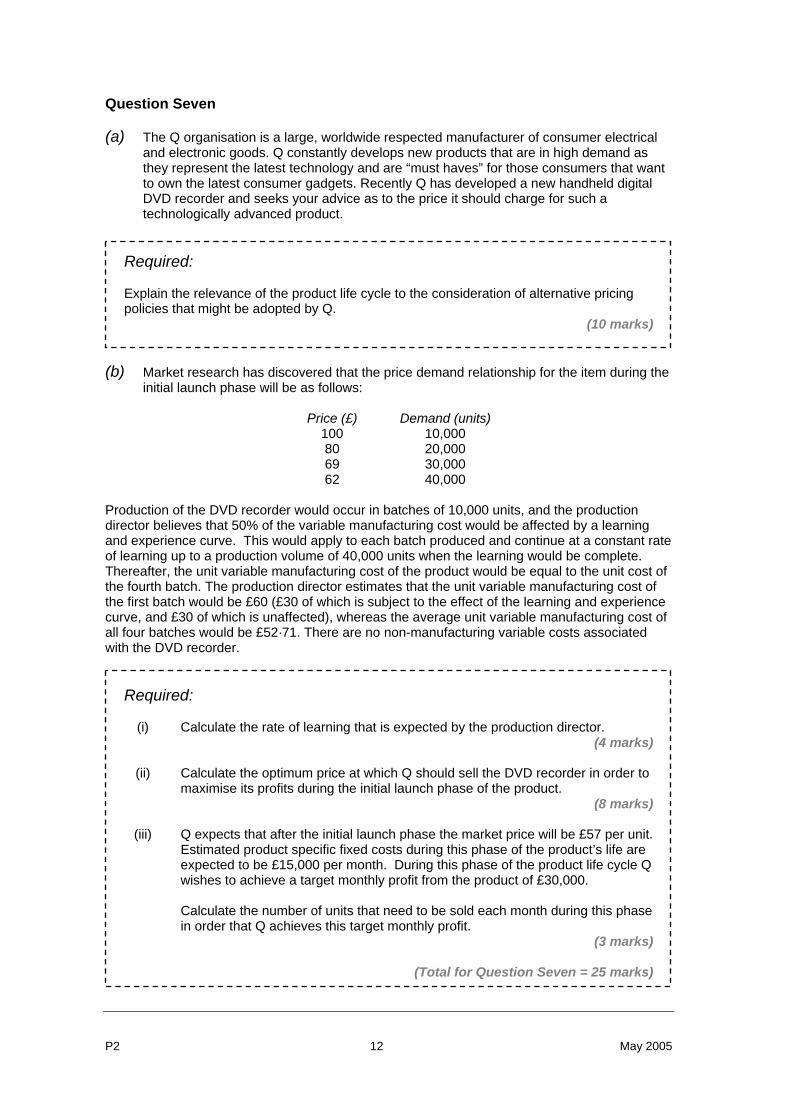
Question Seven (a) The Q organisation is a large, worldwide respected manufacturer of consumer electrical
and electronic goods. Q constantly develops new products that are in high demand as they represent the latest technology and are “must haves” for those consumers that want to own the latest consumer gadgets. Recently Q has developed a new handheld digital DVD recorder and seeks your advice as to the price it should charge for such a technologically advanced product.
Required: Explain the relevance of the product life cycle to the consideration of alternative pricing policies that might be adopted by Q.
(10 marks)
(b) Market research has discovered that the price demand relationship for the item during the
initial launch phase will be as follows:
Price (£) Demand (units) 100 10,000 80 20,000 69 30,000 62 40,000
Production of the DVD recorder would occur in batches of 10,000 units, and the production director believes that 50% of the variable manufacturing cost would be affected by a learning and experience curve. This would apply to each batch produced and continue at a constant rate of learning up to a production volume of 40,000 units when the learning would be complete. Thereafter, the unit variable manufacturing cost of the product would be equal to the unit cost of the fourth batch. The production director estimates that the unit variable manufacturing cost of the first batch would be £60 (£30 of which is subject to the effect of the learning and experience curve, and £30 of which is unaffected), whereas the average unit variable manufacturing cost of all four batches would be £52·71. There are no non-manufacturing variable costs associated with the DVD recorder.
Required:
(i) Calculate the rate of learning that is expected by the production director. (4 marks)
(ii) Calculate the optimum price at which Q should sell the DVD recorder in order to
maximise its profits during the initial launch phase of the product. (8 marks)
(iii) Q expects that after the initial launch phase the market price will be £57 per unit.
Estimated product specific fixed costs during this phase of the product’s life are expected to be £15,000 per month. During this phase of the product life cycle Q wishes to achieve a target monthly profit from the product of £30,000.
Calculate the number of units that need to be sold each month during this phase in order that Q achieves this target monthly profit.
(3 marks)
(Total for Question Seven = 25 marks)
May 2005 13 P2
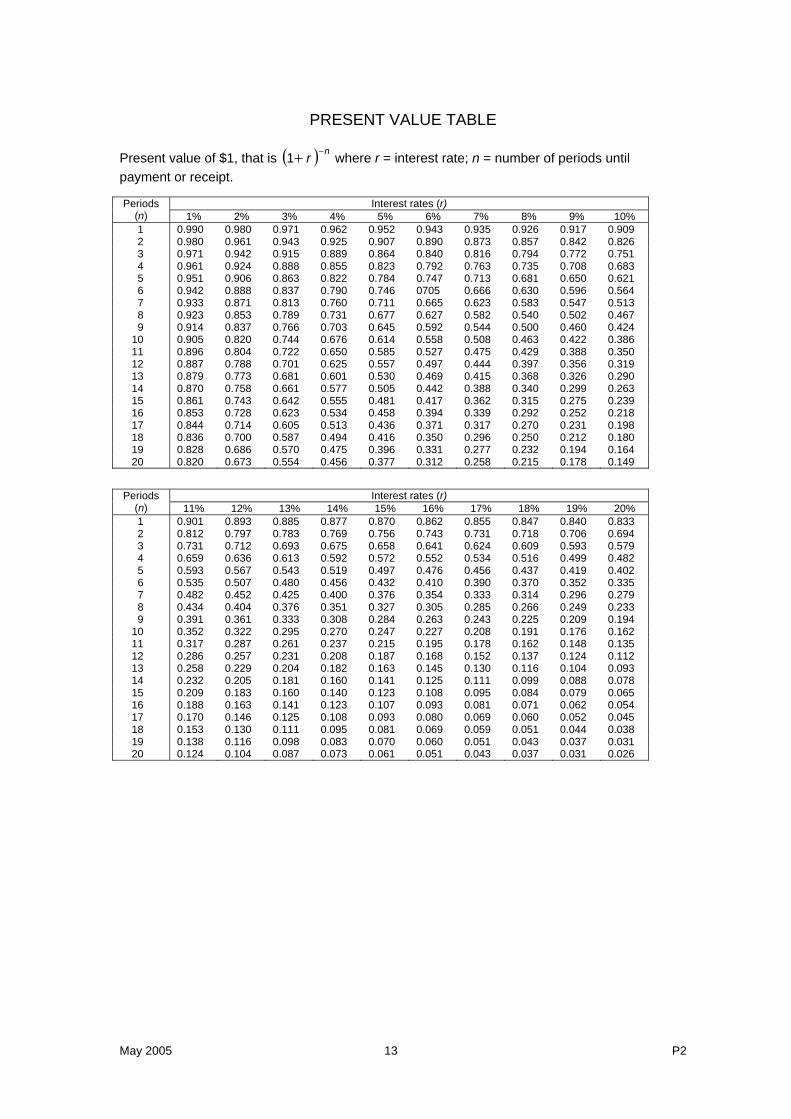
PRESENT VALUE TABLE
Present value of $1, that is ( ) nr −+1 where r = interest rate; n = number of periods until payment or receipt.
Interest rates (r) Periods (n) 1% 2% 3% 4% 5% 6% 7% 8% 9% 10% 1 0.990 0.980 0.971 0.962 0.952 0.943 0.935 0.926 0.917 0.909 2 0.980 0.961 0.943 0.925 0.907 0.890 0.873 0.857 0.842 0.826 3 0.971 0.942 0.915 0.889 0.864 0.840 0.816 0.794 0.772 0.751 4 0.961 0.924 0.888 0.855 0.823 0.792 0.763 0.735 0.708 0.683 5 0.951 0.906 0.863 0.822 0.784 0.747 0.713 0.681 0.650 0.621 6 0.942 0.888 0.837 0.790 0.746 0705 0.666 0.630 0.596 0.564 7 0.933 0.871 0.813 0.760 0.711 0.665 0.623 0.583 0.547 0.513 8 0.923 0.853 0.789 0.731 0.677 0.627 0.582 0.540 0.502 0.467 9 0.914 0.837 0.766 0.703 0.645 0.592 0.544 0.500 0.460 0.424 10 0.905 0.820 0.744 0.676 0.614 0.558 0.508 0.463 0.422 0.386 11 0.896 0.804 0.722 0.650 0.585 0.527 0.475 0.429 0.388 0.350 12 0.887 0.788 0.701 0.625 0.557 0.497 0.444 0.397 0.356 0.319 13 0.879 0.773 0.681 0.601 0.530 0.469 0.415 0.368 0.326 0.290 14 0.870 0.758 0.661 0.577 0.505 0.442 0.388 0.340 0.299 0.263 15 0.861 0.743 0.642 0.555 0.481 0.417 0.362 0.315 0.275 0.239 16 0.853 0.728 0.623 0.534 0.458 0.394 0.339 0.292 0.252 0.218 17 0.844 0.714 0.605 0.513 0.436 0.371 0.317 0.270 0.231 0.198 18 0.836 0.700 0.587 0.494 0.416 0.350 0.296 0.250 0.212 0.180 19 0.828 0.686 0.570 0.475 0.396 0.331 0.277 0.232 0.194 0.164 20 0.820 0.673 0.554 0.456 0.377 0.312 0.258 0.215 0.178 0.149
Interest rates (r) Periods
(n) 11% 12% 13% 14% 15% 16% 17% 18% 19% 20% 1 0.901 0.893 0.885 0.877 0.870 0.862 0.855 0.847 0.840 0.833 2 0.812 0.797 0.783 0.769 0.756 0.743 0.731 0.718 0.706 0.694 3 0.731 0.712 0.693 0.675 0.658 0.641 0.624 0.609 0.593 0.579 4 0.659 0.636 0.613 0.592 0.572 0.552 0.534 0.516 0.499 0.482 5 0.593 0.567 0.543 0.519 0.497 0.476 0.456 0.437 0.419 0.402 6 0.535 0.507 0.480 0.456 0.432 0.410 0.390 0.370 0.352 0.335 7 0.482 0.452 0.425 0.400 0.376 0.354 0.333 0.314 0.296 0.279 8 0.434 0.404 0.376 0.351 0.327 0.305 0.285 0.266 0.249 0.233 9 0.391 0.361 0.333 0.308 0.284 0.263 0.243 0.225 0.209 0.194 10 0.352 0.322 0.295 0.270 0.247 0.227 0.208 0.191 0.176 0.162 11 0.317 0.287 0.261 0.237 0.215 0.195 0.178 0.162 0.148 0.135 12 0.286 0.257 0.231 0.208 0.187 0.168 0.152 0.137 0.124 0.112 13 0.258 0.229 0.204 0.182 0.163 0.145 0.130 0.116 0.104 0.093 14 0.232 0.205 0.181 0.160 0.141 0.125 0.111 0.099 0.088 0.078 15 0.209 0.183 0.160 0.140 0.123 0.108 0.095 0.084 0.079 0.065 16 0.188 0.163 0.141 0.123 0.107 0.093 0.081 0.071 0.062 0.054 17 0.170 0.146 0.125 0.108 0.093 0.080 0.069 0.060 0.052 0.045 18 0.153 0.130 0.111 0.095 0.081 0.069 0.059 0.051 0.044 0.038 19 0.138 0.116 0.098 0.083 0.070 0.060 0.051 0.043 0.037 0.031 20 0.124 0.104 0.087 0.073 0.061 0.051 0.043 0.037 0.031 0.026
P2 14 May 2005
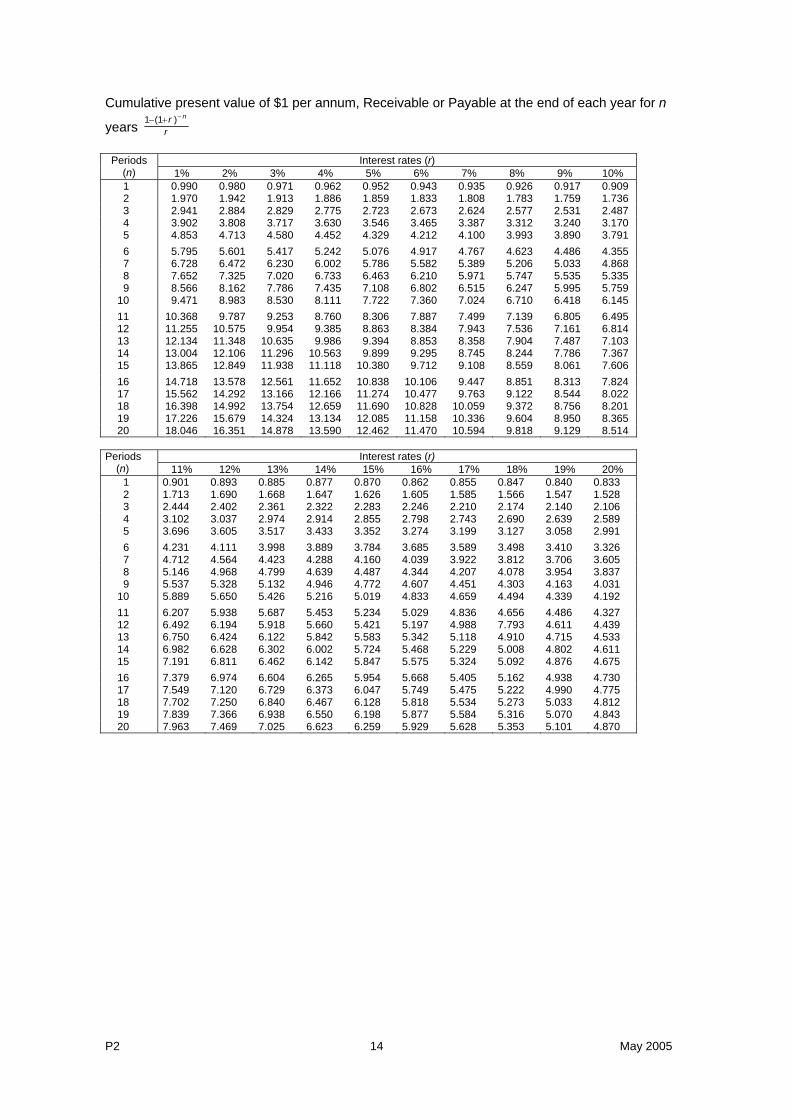
Cumulative present value of $1 per annum, Receivable or Payable at the end of each year for n
years rr n−+− )(11
Interest rates (r) Periods
(n) 1% 2% 3% 4% 5% 6% 7% 8% 9% 10% 1 0.990 0.980 0.971 0.962 0.952 0.943 0.935 0.926 0.917 0.909 2 1.970 1.942 1.913 1.886 1.859 1.833 1.808 1.783 1.759 1.736 3 2.941 2.884 2.829 2.775 2.723 2.673 2.624 2.577 2.531 2.487 4 3.902 3.808 3.717 3.630 3.546 3.465 3.387 3.312 3.240 3.170 5 4.853 4.713 4.580 4.452 4.329 4.212 4.100 3.993 3.890 3.791 6 5.795 5.601 5.417 5.242 5.076 4.917 4.767 4.623 4.486 4.355 7 6.728 6.472 6.230 6.002 5.786 5.582 5.389 5.206 5.033 4.868 8 7.652 7.325 7.020 6.733 6.463 6.210 5.971 5.747 5.535 5.335 9 8.566 8.162 7.786 7.435 7.108 6.802 6.515 6.247 5.995 5.759 10 9.471 8.983 8.530 8.111 7.722 7.360 7.024 6.710 6.418 6.145 11 10.368 9.787 9.253 8.760 8.306 7.887 7.499 7.139 6.805 6.495 12 11.255 10.575 9.954 9.385 8.863 8.384 7.943 7.536 7.161 6.814 13 12.134 11.348 10.635 9.986 9.394 8.853 8.358 7.904 7.487 7.103 14 13.004 12.106 11.296 10.563 9.899 9.295 8.745 8.244 7.786 7.367 15 13.865 12.849 11.938 11.118 10.380 9.712 9.108 8.559 8.061 7.606 16 14.718 13.578 12.561 11.652 10.838 10.106 9.447 8.851 8.313 7.824 17 15.562 14.292 13.166 12.166 11.274 10.477 9.763 9.122 8.544 8.022 18 16.398 14.992 13.754 12.659 11.690 10.828 10.059 9.372 8.756 8.201 19 17.226 15.679 14.324 13.134 12.085 11.158 10.336 9.604 8.950 8.365 20 18.046 16.351 14.878 13.590 12.462 11.470 10.594 9.818 9.129 8.514
Interest rates (r) Periods
(n) 11% 12% 13% 14% 15% 16% 17% 18% 19% 20% 1 0.901 0.893 0.885 0.877 0.870 0.862 0.855 0.847 0.840 0.833 2 1.713 1.690 1.668 1.647 1.626 1.605 1.585 1.566 1.547 1.528 3 2.444 2.402 2.361 2.322 2.283 2.246 2.210 2.174 2.140 2.106 4 3.102 3.037 2.974 2.914 2.855 2.798 2.743 2.690 2.639 2.589 5 3.696 3.605 3.517 3.433 3.352 3.274 3.199 3.127 3.058 2.991 6 4.231 4.111 3.998 3.889 3.784 3.685 3.589 3.498 3.410 3.326 7 4.712 4.564 4.423 4.288 4.160 4.039 3.922 3.812 3.706 3.605 8 5.146 4.968 4.799 4.639 4.487 4.344 4.207 4.078 3.954 3.837 9 5.537 5.328 5.132 4.946 4.772 4.607 4.451 4.303 4.163 4.031 10 5.889 5.650 5.426 5.216 5.019 4.833 4.659 4.494 4.339 4.192 11 6.207 5.938 5.687 5.453 5.234 5.029 4.836 4.656 4.486 4.327 12 6.492 6.194 5.918 5.660 5.421 5.197 4.988 7.793 4.611 4.439 13 6.750 6.424 6.122 5.842 5.583 5.342 5.118 4.910 4.715 4.533 14 6.982 6.628 6.302 6.002 5.724 5.468 5.229 5.008 4.802 4.611 15 7.191 6.811 6.462 6.142 5.847 5.575 5.324 5.092 4.876 4.675 16 7.379 6.974 6.604 6.265 5.954 5.668 5.405 5.162 4.938 4.730 17 7.549 7.120 6.729 6.373 6.047 5.749 5.475 5.222 4.990 4.775 18 7.702 7.250 6.840 6.467 6.128 5.818 5.534 5.273 5.033 4.812 19 7.839 7.366 6.938 6.550 6.198 5.877 5.584 5.316 5.070 4.843 20 7.963 7.469 7.025 6.623 6.259 5.929 5.628 5.353 5.101 4.870
May 2005 15 P2
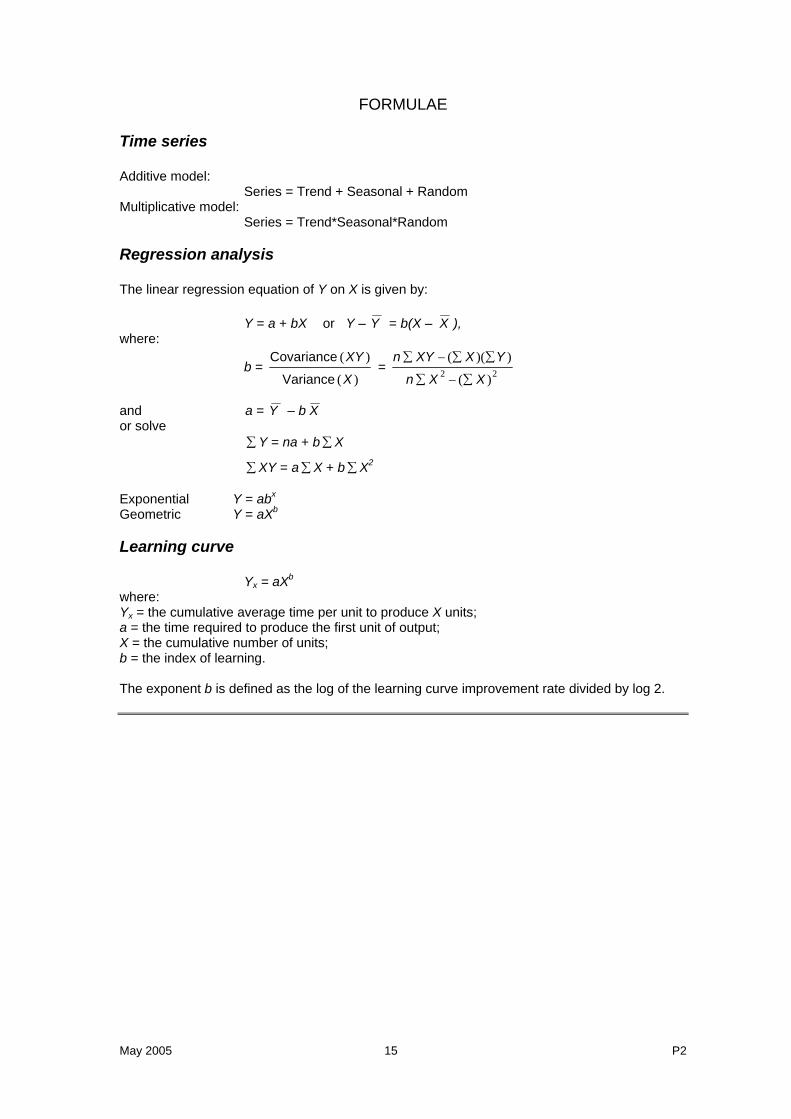
FORMULAE Time series Additive model:
Series = Trend + Seasonal + Random Multiplicative model:
Series = Trend*Seasonal*Random
Regression analysis The linear regression equation of Y on X is given by:
Y = a + bX or Y – Y = b(X – X ), where:
b = )(
)(
X
XY
Variance
Covariance = 22 )(
))((
XXn
YXXYn
∑−∑
∑∑−∑
and a = Y – b X or solve
∑Y = na + b∑X
∑XY = a∑X + b∑X2
Exponential Y = abx Geometric Y = aXb
Learning curve
Yx = aXb
where: Yx = the cumulative average time per unit to produce X units; a = the time required to produce the first unit of output; X = the cumulative number of units; b = the index of learning. The exponent b is defined as the log of the learning curve improvement rate divided by log 2.
P2 16 May 2005
The Examiner for Management Accounting – Decision Management offers to future candidates and to tutors using this booklet for study purposes, the following
background and guidance on the questions included in this examination paper.
Section A – Question One – Compulsory Question One comprises 8 objective test sub-questions which are designed to complement the syllabus content and learning outcome coverage of the remaining questions on the paper. Some of these questions are in a multiple choice format, whilst others require short answers.
Section B – Questions Two, Three and Four – Compulsory Question Two requires candidates to prepare a report that explains how the adoption of a Just in Time (JIT) approach to its manufacturing systems might affect its profitability. This requires a comparison between the existing system and JIT in order to identify the differences and how they would affect the company’s profitability. This addresses the learning outcome Evaluate the impacts of just in time production, the theory of constraints and total quality management on efficiency, inventory and cost in section D of the syllabus. Question Three requires candidates to calculate whether it is beneficial for a company to purchase or lease a vehicle. Candidates must recognise that this is a long term decision involving relevant costs and taxation and requiring the application of discounting techniques. This addresses the learning outcome Evaluate project proposals using the techniques of investment appraisal in Section B of the syllabus. Question Four is divided into two parts. Part (a) requires candidates to identify the method that has been used to apportion the common costs of a process between its joint product outputs and then to comment on the acceptability of the method used. Part (b) requires candidates to evaluate the viability of the common process and determine the optimal production plan for each of the three joint products. This addresses the learning outcome Explain why joint costs must be allocated to final products for financial reporting purposes, but why this is unhelpful when decisions concerning process and product viability have to be taken in Section A of the syllabus.
Section C – answer two of three questions Question Five is divided into two parts. Part (a) requires candidates to evaluate the proposed purchase of a new machine. Candidates must recognise that this is a long-term decision involving relevant costs and revenues as well as taxation which requires the use of discounting techniques. This addresses the learning outcomes Apply the principles of relevant cash flow analysis to long-run projects that continue for several years; and evaluate project proposals using the techniques of investment appraisal in Section B of the syllabus. Part (b) requires candidates to measure the sensitivity of two of the input variables in the project. This addresses the learning outcome Apply sensitivity analysis to cash flow parameters to identify those to which net present value is particularly sensitive also in Section B of the syllabus. Question Six is divided into two parts. Part (a) requires candidates to identify the relevant costs associated with a short-term decision making situation. This addresses the learning outcome Discuss the principles of decision making including the identification of relevant cash flows and their use alongside non-quantifiable factors in making rounded judgements in Section A of the syllabus. In part (b) candidates are required to explain the meaning of the two-way data table provided and to produce another table showing how the two-way data table may be used with probability analysis to improve the information available to the manager. This addresses the learning outcome Analyse risk and uncertainty by calculating expected values and standard deviations together with probability tables and histograms in Section C of the syllabus. Question 7 is divided into two parts. Part (a) requires candidates to discuss the relevance of the product life cycle to pricing policies. This addresses the learning outcome Explain the concept of life cycle costing and how life cycle costs interact with marketing strategies at each stage of the life cycle in Section D of the syllabus. Part (b) requires candidates to calculate the rate of learning that is expected to occur and apply this to a pricing decision before determining a breakeven level of activity. This addresses the learning outcomes Apply variable / fixed cost analysis in multiple product contexts to breakeven analysis and product mix decision making, including circumstances where there are multiple constraints and linear programming methods are needed to reach “optimal” solutions and Apply an approach to pricing based on profit maximisation in imperfect markets and evaluate the financial consequences of alternative pricing strategies in Section A of the syllabus and the learning outcome Explain and apply learning and experience curves to estimate time and cost for new products and services in Section D of the syllabus.
May 2005 17 P2
Managerial Level Paper
P2 – Management Accounting – Decision Management
Examiner’s Answers
SECTION A Answer to Question One 1.1
K L M Contribution per meal $1·40 $1·20 $1·25Minutes 10 4 8 Contribution per minute $0·14 $0·30 $0·16
The correct answer is C. 1.2
Contract Contribution Weight Contribution x Weight Superior $550 2 $1,100 Standard $500 3 $1,500 Basic $220 5 $1,100 $3,700
packages 27.270$3,700
$1,000,000=
Each package has a sales value of $6,250 so the breakeven sales value is $1,689,188.
The correct answer is A. 1.3 The correct answer is C.
The lowest cost option is to hire the external consultant.
P2 18 May 2005
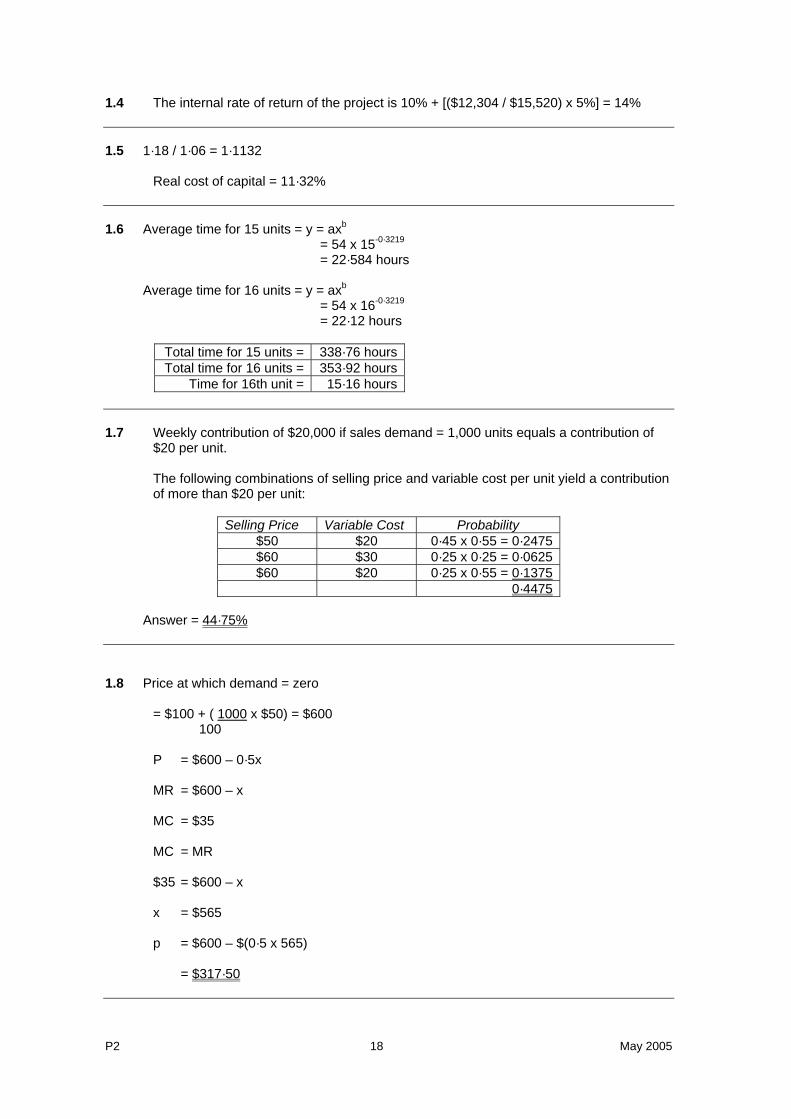
1.4 The internal rate of return of the project is 10% + [($12,304 / $15,520) x 5%] = 14% 1.5 1·18 / 1·06 = 1·1132
Real cost of capital = 11·32% 1.6 Average time for 15 units = y = axb
= 54 x 15-0·3219
= 22·584 hours
Average time for 16 units = y = axb
= 54 x 16-0·3219
= 22·12 hours
Total time for 15 units = 338·76 hoursTotal time for 16 units = 353·92 hours
Time for 16th unit = 15·16 hours 1.7 Weekly contribution of $20,000 if sales demand = 1,000 units equals a contribution of
$20 per unit.
The following combinations of selling price and variable cost per unit yield a contribution of more than $20 per unit:
Selling Price Variable Cost Probability
$50 $20 0·45 x 0·55 = 0·2475$60 $30 0·25 x 0·25 = 0·0625$60 $20 0·25 x 0·55 = 0·1375
0·4475 Answer = 44·75% 1.8 Price at which demand = zero
= $100 + ( 1000 x $50) = $600 100 P = $600 – 0·5x MR = $600 – x MC = $35 MC = MR $35 = $600 – x x = $565 p = $600 – $(0·5 x 565) = $317·50
May 2005 19 P2
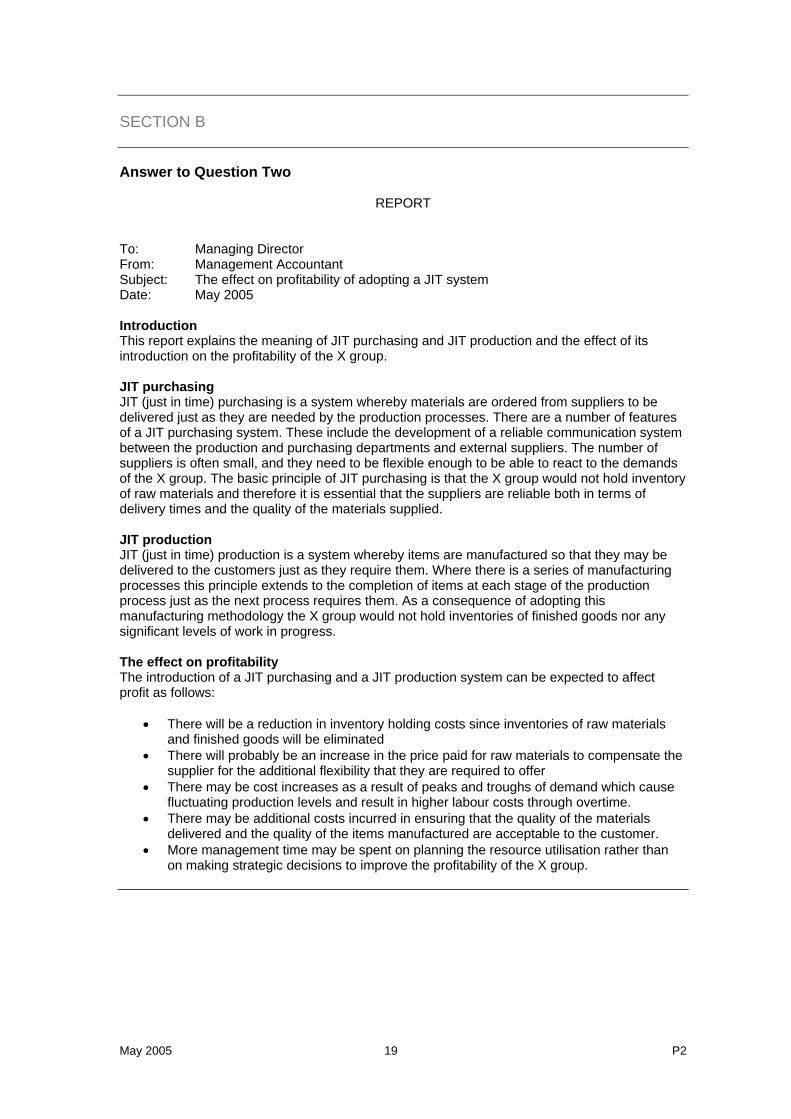
SECTION B Answer to Question Two
REPORT
To: Managing Director From: Management Accountant Subject: The effect on profitability of adopting a JIT system Date: May 2005 Introduction This report explains the meaning of JIT purchasing and JIT production and the effect of its introduction on the profitability of the X group. JIT purchasing JIT (just in time) purchasing is a system whereby materials are ordered from suppliers to be delivered just as they are needed by the production processes. There are a number of features of a JIT purchasing system. These include the development of a reliable communication system between the production and purchasing departments and external suppliers. The number of suppliers is often small, and they need to be flexible enough to be able to react to the demands of the X group. The basic principle of JIT purchasing is that the X group would not hold inventory of raw materials and therefore it is essential that the suppliers are reliable both in terms of delivery times and the quality of the materials supplied. JIT production JIT (just in time) production is a system whereby items are manufactured so that they may be delivered to the customers just as they require them. Where there is a series of manufacturing processes this principle extends to the completion of items at each stage of the production process just as the next process requires them. As a consequence of adopting this manufacturing methodology the X group would not hold inventories of finished goods nor any significant levels of work in progress. The effect on profitability The introduction of a JIT purchasing and a JIT production system can be expected to affect profit as follows:
• There will be a reduction in inventory holding costs since inventories of raw materials and finished goods will be eliminated
• There will probably be an increase in the price paid for raw materials to compensate the supplier for the additional flexibility that they are required to offer
• There may be cost increases as a result of peaks and troughs of demand which cause fluctuating production levels and result in higher labour costs through overtime.
• There may be additional costs incurred in ensuring that the quality of the materials delivered and the quality of the items manufactured are acceptable to the customer.
• More management time may be spent on planning the resource utilisation rather than on making strategic decisions to improve the profitability of the X group.
P2 20 May 2005
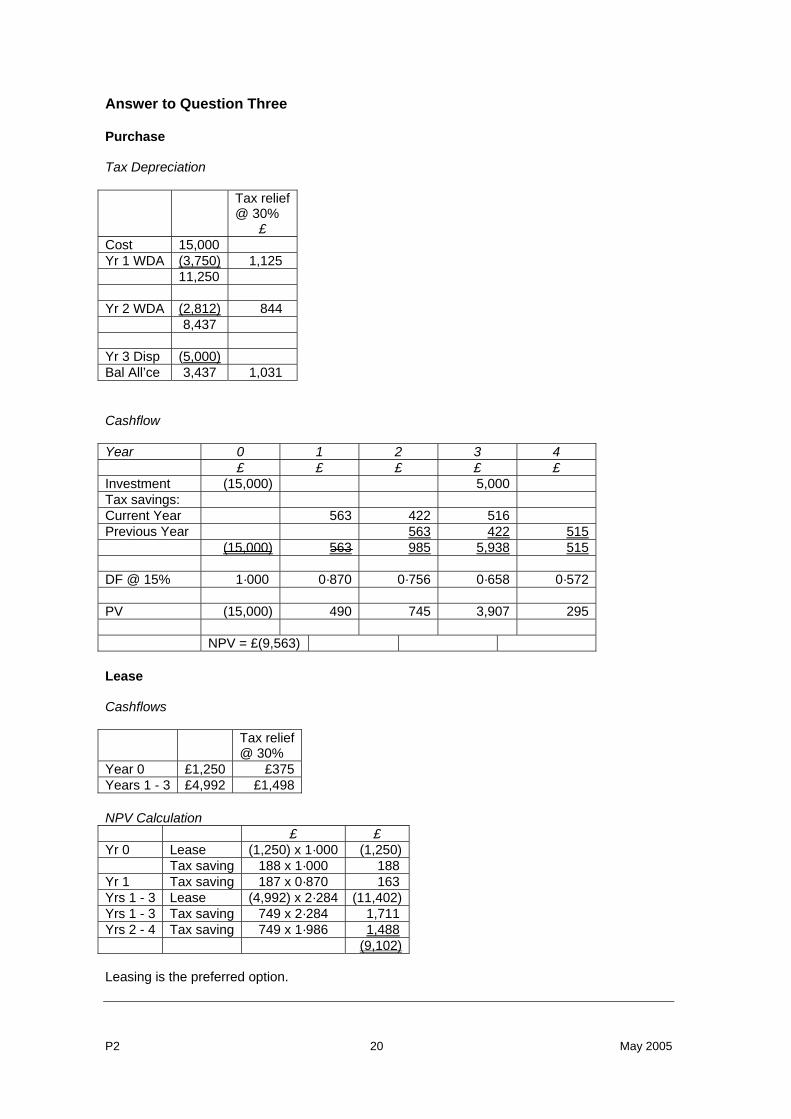
Answer to Question Three Purchase Tax Depreciation Tax relief
@ 30% £
Cost 15,000 Yr 1 WDA (3,750) 1,125 11,250 Yr 2 WDA (2,812) 844 8,437 Yr 3 Disp (5,000) Bal All’ce 3,437 1,031 Cashflow Year 0 1 2 3 4 £ £ £ £ £ Investment (15,000) 5,000 Tax savings: Current Year 563 422 516 Previous Year 563 422 515 (15,000) 563 985 5,938 515 DF @ 15% 1·000 0·870 0·756 0·658 0·572 PV (15,000) 490 745 3,907 295 NPV = £(9,563) Lease Cashflows Tax relief
@ 30% Year 0 £1,250 £375 Years 1 - 3 £4,992 £1,498 NPV Calculation £ £ Yr 0 Lease (1,250) x 1·000 (1,250) Tax saving 188 x 1·000 188 Yr 1 Tax saving 187 x 0·870 163 Yrs 1 - 3 Lease (4,992) x 2·284 (11,402)Yrs 1 - 3 Tax saving 749 x 2·284 1,711 Yrs 2 - 4 Tax saving 749 x 1·986 1,488 (9,102) Leasing is the preferred option.
May 2005 21 P2
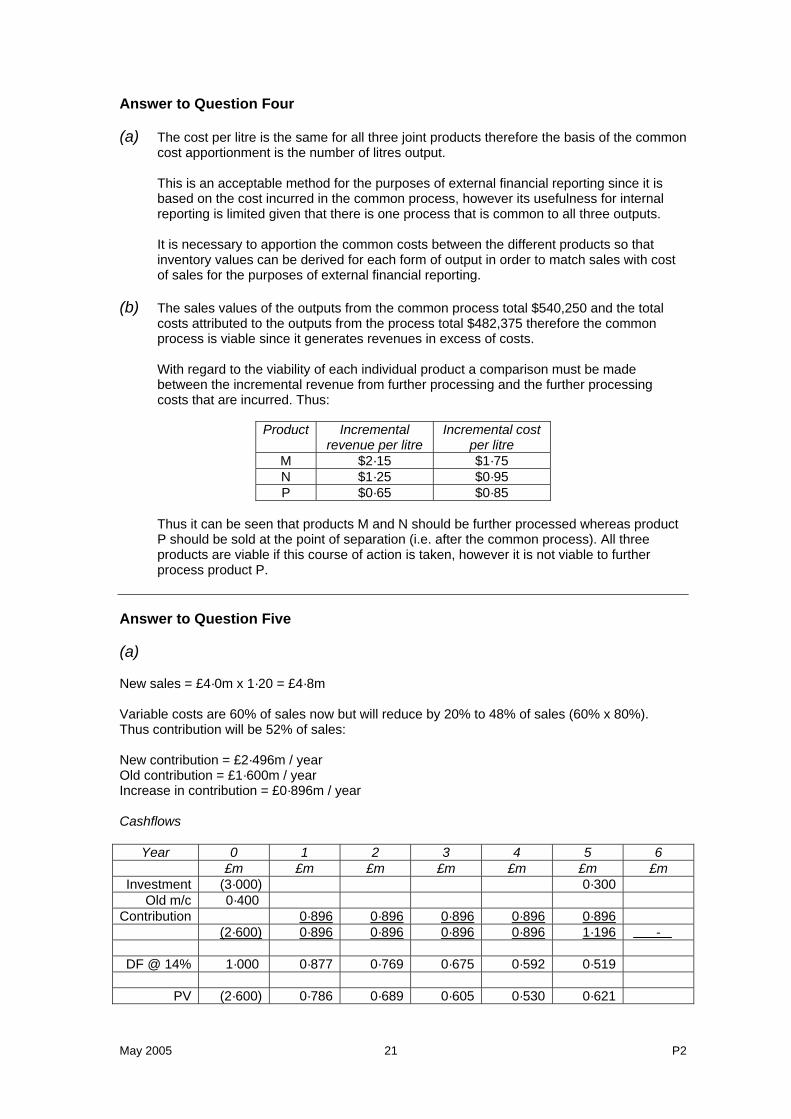
Answer to Question Four (a) The cost per litre is the same for all three joint products therefore the basis of the common
cost apportionment is the number of litres output.
This is an acceptable method for the purposes of external financial reporting since it is based on the cost incurred in the common process, however its usefulness for internal reporting is limited given that there is one process that is common to all three outputs.
It is necessary to apportion the common costs between the different products so that inventory values can be derived for each form of output in order to match sales with cost of sales for the purposes of external financial reporting.
(b) The sales values of the outputs from the common process total $540,250 and the total
costs attributed to the outputs from the process total $482,375 therefore the common process is viable since it generates revenues in excess of costs.
With regard to the viability of each individual product a comparison must be made between the incremental revenue from further processing and the further processing costs that are incurred. Thus:
Product Incremental
revenue per litre Incremental cost
per litre M $2·15 $1·75 N $1·25 $0·95 P $0·65 $0·85
Thus it can be seen that products M and N should be further processed whereas product P should be sold at the point of separation (i.e. after the common process). All three products are viable if this course of action is taken, however it is not viable to further process product P.
Answer to Question Five (a) New sales = £4·0m x 1·20 = £4·8m Variable costs are 60% of sales now but will reduce by 20% to 48% of sales (60% x 80%). Thus contribution will be 52% of sales: New contribution = £2·496m / year Old contribution = £1·600m / year Increase in contribution = £0·896m / year Cashflows
Year 0 1 2 3 4 5 6 £m £m £m £m £m £m £m Investment (3·000) 0·300
Old m/c 0·400 Contribution 0·896 0·896 0·896 0·896 0·896
(2·600) 0·896 0·896 0·896 0·896 1·196 -
DF @ 14% 1·000 0·877 0·769 0·675 0·592 0·519
PV (2·600) 0·786 0·689 0·605 0·530 0·621
P2 22 May 2005
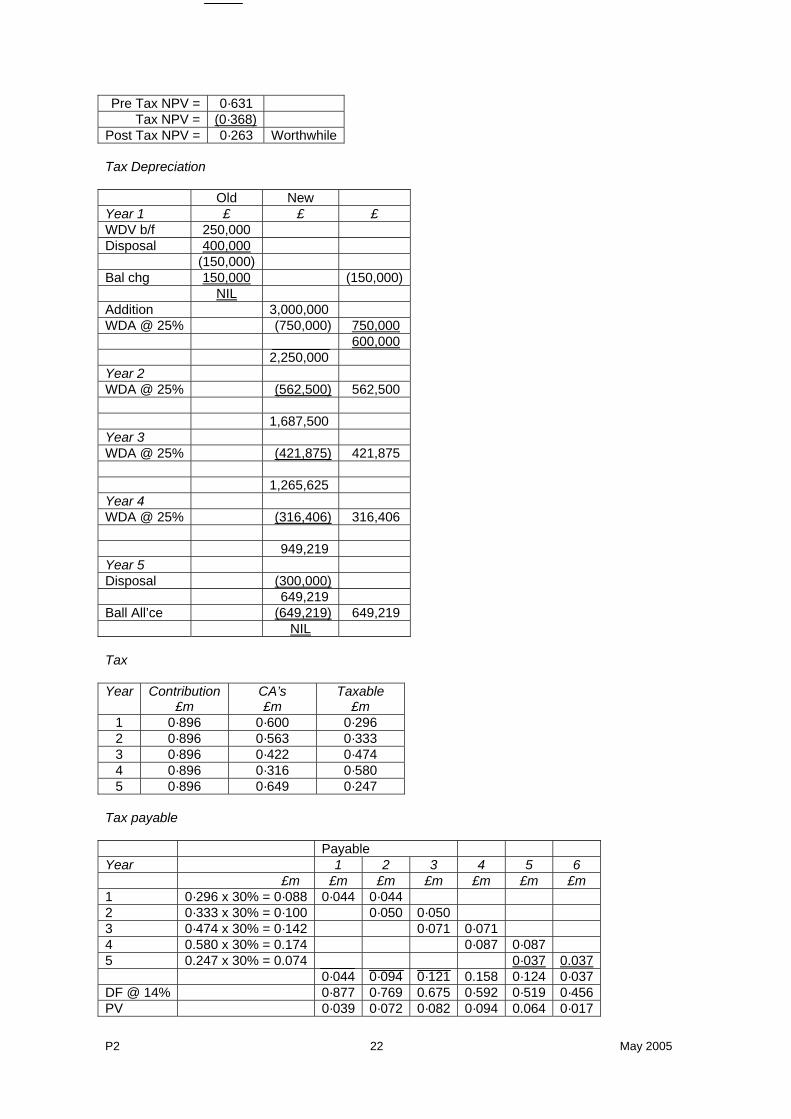
Pre Tax NPV = 0·631 Tax NPV = (0·368)
Post Tax NPV = 0·263 Worthwhile Tax Depreciation Old New Year 1 £ £ £ WDV b/f 250,000 Disposal 400,000 (150,000) Bal chg 150,000 (150,000) NIL Addition 3,000,000 WDA @ 25% (750,000) 750,000 600,000 2,250,000 Year 2 WDA @ 25% (562,500) 562,500 1,687,500 Year 3 WDA @ 25% (421,875) 421,875 1,265,625 Year 4 WDA @ 25% (316,406) 316,406 949,219 Year 5 Disposal (300,000) 649,219 Ball All’ce (649,219) 649,219 NIL Tax Year Contribution
£m CA’s £m
Taxable £m
1 0·896 0·600 0·296 2 0·896 0·563 0·333 3 0·896 0·422 0·474 4 0·896 0·316 0·580 5 0·896 0·649 0·247
Tax payable Payable Year 1 2 3 4 5 6 £m £m £m £m £m £m £m 1 0·296 x 30% = 0·088 0·044 0·044 2 0·333 x 30% = 0·100 0·050 0·050 3 0·474 x 30% = 0·142 0·071 0·071 4 0.580 x 30% = 0.174 0·087 0·087 5 0.247 x 30% = 0.074 0·037 0.037 0·044 0·094 0·121 0.158 0·124 0·037 DF @ 14% 0·877 0·769 0.675 0·592 0·519 0·456 PV 0·039 0·072 0·082 0·094 0.064 0·017
May 2005 23 P2
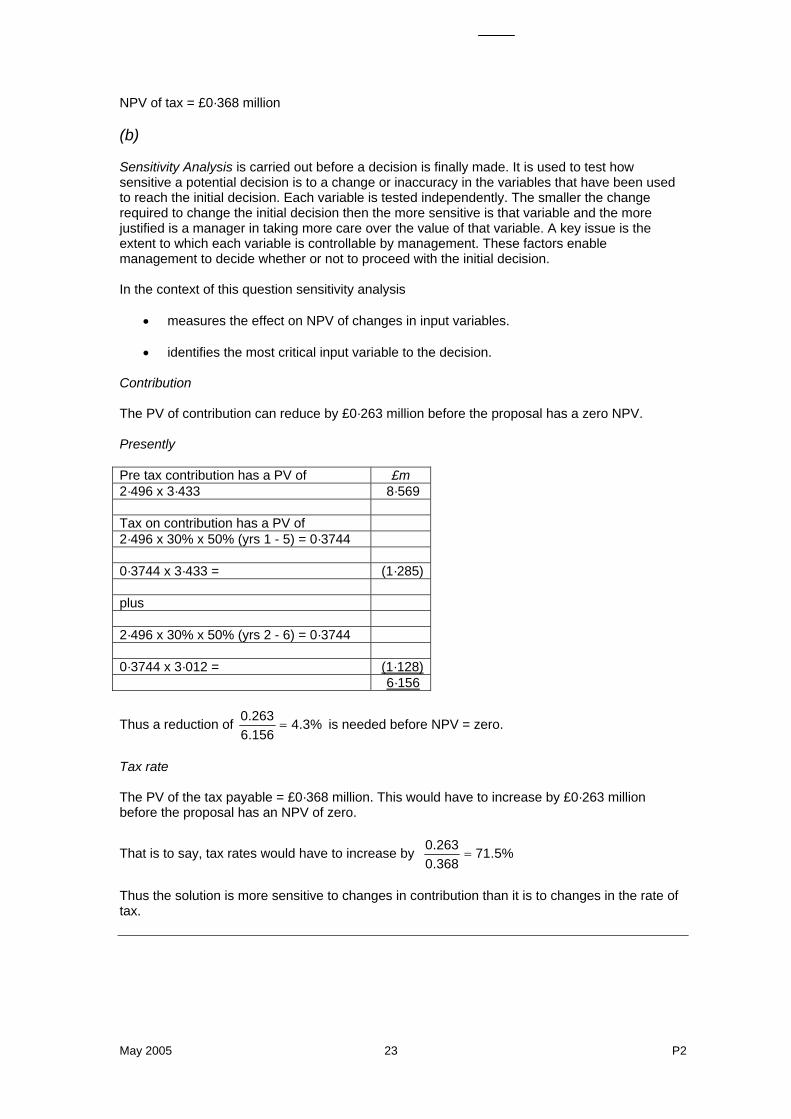
NPV of tax = £0·368 million (b) Sensitivity Analysis is carried out before a decision is finally made. It is used to test how sensitive a potential decision is to a change or inaccuracy in the variables that have been used to reach the initial decision. Each variable is tested independently. The smaller the change required to change the initial decision then the more sensitive is that variable and the more justified is a manager in taking more care over the value of that variable. A key issue is the extent to which each variable is controllable by management. These factors enable management to decide whether or not to proceed with the initial decision. In the context of this question sensitivity analysis
• measures the effect on NPV of changes in input variables.
• identifies the most critical input variable to the decision. Contribution The PV of contribution can reduce by £0·263 million before the proposal has a zero NPV. Presently Pre tax contribution has a PV of £m 2·496 x 3·433 8·569 Tax on contribution has a PV of 2·496 x 30% x 50% (yrs 1 - 5) = 0·3744 0·3744 x 3·433 = (1·285) plus 2·496 x 30% x 50% (yrs 2 - 6) = 0·3744 0·3744 x 3·012 = (1·128) 6·156
Thus a reduction of %3.4156.6263.0
= is needed before NPV = zero.
Tax rate The PV of the tax payable = £0·368 million. This would have to increase by £0·263 million before the proposal has an NPV of zero.
That is to say, tax rates would have to increase by %5.71368.0263.0
=
Thus the solution is more sensitive to changes in contribution than it is to changes in the rate of tax.
P2 24 May 2005
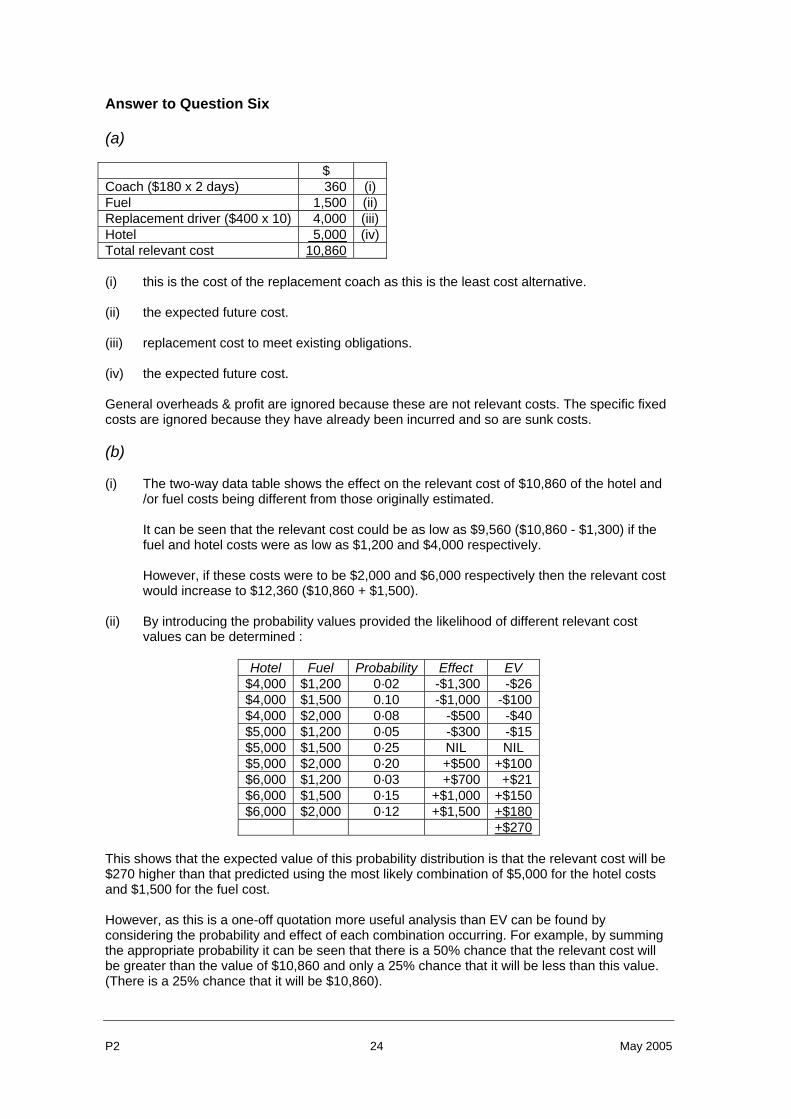
Answer to Question Six (a) $ Coach ($180 x 2 days) 360 (i) Fuel 1,500 (ii) Replacement driver ($400 x 10) 4,000 (iii)Hotel 5,000 (iv)Total relevant cost 10,860 (i) this is the cost of the replacement coach as this is the least cost alternative. (ii) the expected future cost. (iii) replacement cost to meet existing obligations. (iv) the expected future cost. General overheads & profit are ignored because these are not relevant costs. The specific fixed costs are ignored because they have already been incurred and so are sunk costs. (b) (i) The two-way data table shows the effect on the relevant cost of $10,860 of the hotel and
/or fuel costs being different from those originally estimated.
It can be seen that the relevant cost could be as low as $9,560 ($10,860 - $1,300) if the fuel and hotel costs were as low as $1,200 and $4,000 respectively.
However, if these costs were to be $2,000 and $6,000 respectively then the relevant cost would increase to $12,360 ($10,860 + $1,500).
(ii) By introducing the probability values provided the likelihood of different relevant cost
values can be determined :
Hotel Fuel Probability Effect EV $4,000 $1,200 0·02 -$1,300 -$26$4,000 $1,500 0.10 -$1,000 -$100$4,000 $2,000 0·08 -$500 -$40$5,000 $1,200 0·05 -$300 -$15$5,000 $1,500 0·25 NIL NIL $5,000 $2,000 0·20 +$500 +$100$6,000 $1,200 0·03 +$700 +$21$6,000 $1,500 0·15 +$1,000 +$150$6,000 $2,000 0·12 +$1,500 +$180
+$270 This shows that the expected value of this probability distribution is that the relevant cost will be $270 higher than that predicted using the most likely combination of $5,000 for the hotel costs and $1,500 for the fuel cost. However, as this is a one-off quotation more useful analysis than EV can be found by considering the probability and effect of each combination occurring. For example, by summing the appropriate probability it can be seen that there is a 50% chance that the relevant cost will be greater than the value of $10,860 and only a 25% chance that it will be less than this value. (There is a 25% chance that it will be $10,860).
May 2005 25 P2
Answer to Question Seven (a) The Product Life Cycle comprises 4 stages:
• Introduction • Growth • Maturity • Decline
In the Introduction stage the company needs to price the product to achieve its market strategy using either penetration or skimming pricing policies. A penetration policy is used with the objective of achieving a high level of demand very quickly by using a low price that is affordable to a large number of potential customers. This has the effect of discouraging new suppliers to the market because the unit profitability is relatively low, but the high volume of sales enables the initial supplier to recover their development costs. A skimming policy is particular appropriate to a product that has a novelty value or that is technologically advanced. Such a policy uses a price that is high and thus restricts the volume of sales since only high worth customers can afford the product, but the high unit profitability enables the initial supplier to recover their development costs. However, the high unit profitability attracts competitors to the market so that it is important for the initial supplier to be able to reduce the price and prevent new entrants to the market from benefiting from being able to reverse engineer the product and make significant profits from little or no development investment. The Q organisation is launching a technologically advanced product which will be demanded by high worth customers who are proud to be amongst the first to own such a state of the art product. This is exactly the type of product for which a price skimming policy is appropriate. The initial price will be high as this will quickly recover the development costs of the product. The high worth customers will not be deterred from buying the product as it will be sold on the basis of its technological value rather than its price. Competitors will be attracted to the product by its high price and will seek to compete with it by introducing their own version of the product at much lower development costs (by reverse engineering Q's product) so it is important for Q to reduce the price during the growth stage of the product’s life cycle. There may be many price reductions during this phase so that the product gradually becomes more affordable to lower social economic groups. As the product enters the maturity stage the price will need to be lowered further, though a normal contribution ratio would continue to be earned. Oligopolistic competition is often found in this stage, but provided Q has gained market share and survived until this stage the opportunity to make profit and cash surpluses should exist. However, in this type of market the price will tend to be set by the market and Q will have to accept that price. Thus Q will need to focus on the control of its costs to ensure that the product remains profitable. When the product enters the decline phase a loyal group of customers may continue to be prepared to pay a reasonable price and at this price the product will continue to be profitable, especially as costs continue to reduce. Eventually the price will be lowered to marginal cost or even lower in order to sell off inventories of what is now an obsolete product as it has been replaced by a more technologically advanced item.
P2 26 May 2005
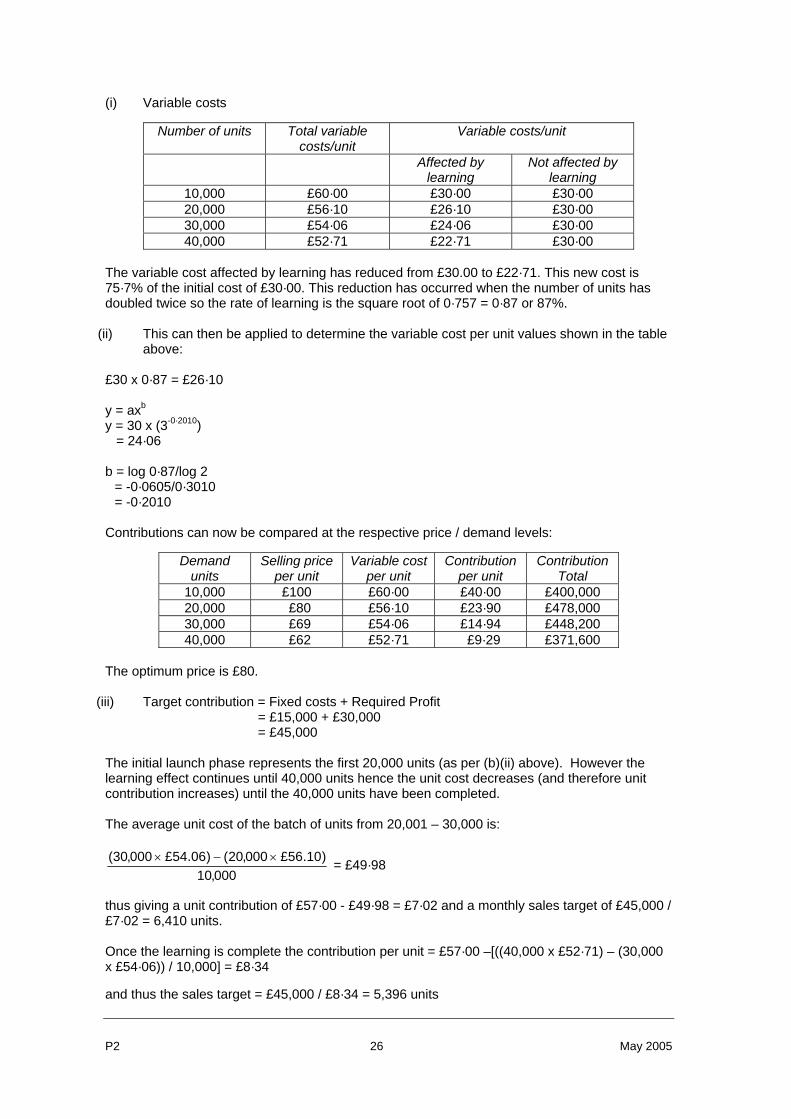
(i) Variable costs
Number of units Total variable costs/unit
Variable costs/unit
Affected by learning
Not affected by learning
10,000 £60·00 £30·00 £30·00 20,000 £56·10 £26·10 £30·00 30,000 £54·06 £24·06 £30·00 40,000 £52·71 £22·71 £30·00
The variable cost affected by learning has reduced from £30.00 to £22·71. This new cost is 75·7% of the initial cost of £30·00. This reduction has occurred when the number of units has doubled twice so the rate of learning is the square root of 0·757 = 0·87 or 87%.
(ii) This can then be applied to determine the variable cost per unit values shown in the table above:
£30 x 0·87 = £26·10 y = axb
y = 30 x (3-0·2010) = 24·06 b = log 0·87/log 2
= -0·0605/0·3010 = -0·2010
Contributions can now be compared at the respective price / demand levels:
Demand units
Selling price per unit
Variable cost per unit
Contribution per unit
Contribution Total
10,000 £100 £60·00 £40·00 £400,000 20,000 £80 £56·10 £23·90 £478,000 30,000 £69 £54·06 £14·94 £448,200 40,000 £62 £52·71 £9·29 £371,600
The optimum price is £80.
(iii) Target contribution = Fixed costs + Required Profit
= £15,000 + £30,000 = £45,000
The initial launch phase represents the first 20,000 units (as per (b)(ii) above). However the learning effect continues until 40,000 units hence the unit cost decreases (and therefore unit contribution increases) until the 40,000 units have been completed. The average unit cost of the batch of units from 20,001 – 30,000 is:
000,10)10.56£000,20()06.54£000,30( ×−× = £49·98
thus giving a unit contribution of £57·00 - £49·98 = £7·02 and a monthly sales target of £45,000 / £7·02 = 6,410 units. Once the learning is complete the contribution per unit = £57·00 –[((40,000 x £52·71) – (30,000 x £54·06)) / 10,000] = £8·34 and thus the sales target = £45,000 / £8·34 = 5,396 units