Embed Size (px)
Citation preview

1
KANDİLLİ OBSERVATORY AND EARTHQUAKE
RESEARCH INSTITUDE
May 19, 2011 KUTAHYA-SIMAV
EARTHQUAKE
Prepared by; Dr. Can Zülfikar Res. Assist. Yaver Kamer Res. Assist. Eren Vuran
June, 2011
ISTANBUL

2
Contents Contents ................................................................................................................................................ 2 List of Figures ......................................................................................................................................... 3 List of Tables .......................................................................................................................................... 6 1 Introduction ....................................................................................................................................... 7 2 Regional Geology ............................................................................................................................ 11 3 Regional Seismotectonic Characteristics ......................................................................................... 12 4 Earthquake Source Parameters ........................................................................................................ 15 5 Statistical Properties of the Earthquake ........................................................................................... 16 6 Ground Motion and Damage Estimations ....................................................................................... 18 7 Strong Ground Motion Recordings ................................................................................................. 20 8 Building Types ................................................................................................................................ 27
8.1 4-5 Storey Reinforced Concrete Buildings .............................................................................. 27 8.2 7-8 Storey Reinforced Concrete Buildings .............................................................................. 30 8.3 Masonry Buildings ................................................................................................................... 34
9 Building Vulnerability Class ........................................................................................................... 40 10 Building Damage Levels ................................................................................................................. 41 11 Building Damages ........................................................................................................................... 43 12 Intensity of Earthquake .................................................................................................................... 63 13 Results and Recommendations ........................................................................................................ 67

3
List of Figures Figure 1: Spatial distribution of the main shock and aftershocks .............................................. 7
Figure 2: Intensity distribution at large scale ............................................................................ 8
Figure 3: Seismic zonation of Kütahya province .................................................................... 11
Figure 4: Regional geology map .............................................................................................. 12
Figure 5: General tectonic map of Western Anatolian region ................................................ 13
Figure 6: Sındırgı-Sincanlı Fault Zone .................................................................................... 14
Figure 7: Distibution of the M≥5.0 earthquakes in the region in the last century (1900-2010)
.......................................................................................................................................... 14
Figure 8: Three dimensional distributions of the aftershocks .................................................. 16
Figure 9: Magnitude and energy release of aftershocks .......................................................... 17
Figure 10: Surface distribution of energy released in the aftershocks .................................... 17
Figure 11: Estimated intensity maps at different scales ........................................................... 18
Figure 12: Estimated Intensity Distribution Surface ............................................................... 19
Figure 13: Distributions of Damage Classes D3 and D4 ........................................................ 19
Figure 14: PGA Distribution Map ........................................................................................... 21
Figure 15: PGV Distribution Map ........................................................................................... 21
Figure 16: Comparison of actual PGA values with GMPEs .................................................... 22
Figure 17: Comparison of actual PSA 0.2 values with GMPEs ............................................. 23
Figure 18: Comparison of actual PSA 1.0s values with GMPEs ............................................. 23
Figure 19: Acceleration-time records of stations 4305 and 4504 ............................................ 24
Figure 20: High frequency content of station 4504.................................................................. 24
Figure 21: Free particle motion diagram of station 4504 ....................................................... 25
Figure 22: Response spectra compared with TSC 2007 .......................................................... 26
Figure 23: Simav town, typical 4-5 storey RC buildings -1 .................................................... 27
Figure 24: Simav town, typical 4-5 storey RC buildings - 2 ................................................... 27
Figure 25: Simav town, typical 4-5 storey RC buildings - 3 ................................................... 28
Figure 26: Buildings adjacently constructed in town center -1 ............................................... 28
Figure 27: Buildings adjacently constructed in town center - 2 .............................................. 29
Figure 28: Recently constructed buildings ............................................................................... 29
Figure 29: Simav town, EsenlerDistrict, cooperative constructions ........................................ 30
Figure 30: 8 storey star buildings, side view - 1 ...................................................................... 31
Figure 31: 8 storey star buildings, side view – 2 ..................................................................... 31
Figure 32: 8 storey rectangular buildings ............................................................................... 32
4
Figure 33: 7 storey rectangular buildings - 1 .......................................................................... 32
Figure 34: 7 storey rectangular buildings – 2 ......................................................................... 33
Figure 35: Approximate adobe element dimensions ................................................................ 34
Figure 36: A street view, having adobe and brick masonry buildings - 1 ............................... 34
Figure 37: A street view, having adobe and brick masonry buildings - 2 ............................... 35
Figure 38: 2-3 storey brick masonry buildings, adjacent to collapsed adobe masonry building
.......................................................................................................................................... 35
Figure 39: 2 storey adobe masonry buildings – 1 .................................................................... 36
Figure 40: 2 storey adobe masonry buildings - 2 .................................................................... 36
Figure 41: 2 and 3storey abode masonry buildings ................................................................. 37
Figure 42: Brick masonry mosque, constructed in 1962 .......................................................... 37
Figure 43: A stone masonry mosque, constructed in the middle of 17th century and recently
restored ............................................................................................................................ 38
Figure 44: 3 storey brick masonry building ............................................................................. 38
Figure 45: 3 storey building of which infill bricks are being used as a structural load bearing
elements, combined with RC beams!!! ............................................................................. 39
Figure 46: Quantifying amount of damage; ratio of damaged buildings of a particular level
over all building stock ...................................................................................................... 42
Figure 47: Collapsed building at the town center .................................................................... 44
Figure 48: South-east corner column of the collapsed building .............................................. 45
Figure 49: South-west corner column of the collapsed building ............................................. 45
Figure 50: North-west corner column of the collapsed building ............................................. 46
Figure 51: Beam-column joint detail of the north-west corner ................................................ 46
Figure 52: One of few examples for heavy structural damage, column behaved as a short
column ,infill walls were composed of fired structural bricks instead of standart infill
wall bricks. ....................................................................................................................... 47
Figure 53: Same building with previous picture, similar damage pattern............................... 47
Figure 54: Heavy structural damage at column ends .............................................................. 47
Figure 55: Damaged building, in front of the collapsed building, crack on the column extends
from ground floor to roof. ................................................................................................ 48
Figure 56: Damaged building, in front of the collapsed building, cracked infill wall at side . 48
Figure 57: Damaged building, which was apperantly damaged during previous earthquakes,
plaster was repaired, but same locations cracked again in this earthquake ................... 49

5
Figure 58: Non-structural infill wall damage on a new building which is still under
construction ...................................................................................................................... 49
Figure 59: Roof damage ........................................................................................................... 50
Figure 60: Infill wall damage, front and side view .................................................................. 50
Figure 61: Infill wall damage and spalling of the plaster of structural members, front and side
view .................................................................................................................................. 51
Figure 62: Damage at outer infill walls ................................................................................... 51
Figure 63: Damage at 7 storey rectangular building, spalling of concrete cover,widespread
infill wall cracks ............................................................................................................... 52
Figure 64: Damage at 7 storey rectangular building, moderate non-structural damage ....... 52
Figure 65: Damage at 8 storey star buildings, moderate non-structural damage ................... 53
Figure 66: Recently completed building of hospital complex, cracks at infill walls, but
building is still at operational level ................................................................................. 53
Figure 67: Another building of the hospital complex, which is completed in the begining of
2000’s, biochemistry lab. , all machines have displaced and smaller ones (like monitor)
turned over during earthquake ........................................................................................ 54
Figure 68: Hospital building, completed in the begining of 2000’s, biochemistry lab. (same
room) , machine has displaced, and infill wall cracked during earthquake .................... 54
Figure 69: Hospital building, completed in the begining of 2000’s, infill wall crack ............. 55
Figure 70: Hospital building, completed in the begining of 2000’s, infill wall crack ............. 55
Figure 71: Hospital building, completed in the begining of 2000’s, infill wall crack ............. 56
Figure 72: Building next to hospital complex – staircase infill wall cracks, spalling of plaster
.......................................................................................................................................... 56
Figure 73: Building next to hospital complex – staircase infill wall cracks, spalling of plaster
(ground floor, being used as pharmacy and optician) ..................................................... 57
Figure 74: Cracks on beam-column joint of the RC part of school building ........................... 57
Figure 75: Staircase damage of the RC part of school building, general practice of the
territory is to build staircase slabs so thin and without any beam to support the slab ... 58
Figure 76: Cracks on outer walls of masonry part of the school building .............................. 58
Figure 77: Cracks on outer walls of masonry part of the school building, 2nd floor .............. 59
Figure 78: Inside of masonry part of the school building- spalling of plaster ........................ 59
Figure 79: Large crack between masonry and RC parts of the school building ...................... 60
Figure 80: Gökçeler village, grade 3 damaged building, front view ....................................... 60
Figure 81: Gökçeler village, grade 3 damaged building, side view ........................................ 61

6
Figure 82: Cracks on brick masonry mosque .......................................................................... 61
Figure 83: Spalling of plaster on ground floor of 3 storey brick masonry building ................ 62
Figure 84: Spalling of plaster on ground floor of 2 storey brick masonry building ................ 62
Figure 85: Number of responses vs time since earthquake ...................................................... 64
Figure 86: Distribution of responses with various intensity levels .......................................... 65
Figure 87: Intensity vs. Distance graph ................................................................................... 66
List of Tables Table 1: Source parameters determined by KOERI .................................................................. 7
Tablo 2: Epicentral distances of nearby populated areas ......................................................... 8
Tablo 3: Building damage and casualties due to past earthquakes ........................................... 9
Tablo 4: Damage distributions (source: Governorship of Kütahya - 28.06.2011) ................. 10
Tablo 5: May19,2011 Simav Earthquake Source Parameters ................................................. 15
Table 6: Recorded Ground Motion Parameters ...................................................................... 20
Table 7: GMPE Models used in the comparisons .................................................................... 22
Table 9: Building vulnerability classes in EMS-98 .................................................................. 40
Table 10: Building damage levels for masonry buildings in EMS-98 ..................................... 41
Table 11: Building damage levels for RC buildings in EMS-98 .............................................. 42

7
1 Introduction
An earthquake with a magnitude of Ml=5.9 struck in Simav, Kutahya on May 19, 2011 at 23:15 local time. The intensity of the earthquake near the epicenter has been determined as (Io=VI-VII). The earthquake has been felt mainly in the province of Kutahya, together with the Agean and Marmara regions. In the province of Kütahya and its counties the event has been felt strongly, whereas in İstanbul, Yalova, Bursa, Balıkesir, Çanakkale, İzmir, Manisa, Uşak, Eskişehir, Afyonkarahisar and Ankara the intensity has been weak. Slight damage was observed mainly in the county center of Simav, Gökçeler village and the town of Demirci. Minor damage was also observed in the counties of Şaphane, Pazarlar, Hisarcık and Gediz. As a result of the earthquake 2 people have lost their lives and nearly 100 people have been injured.
Table 1: Source parameters determined by KOERI
Date Time (L.T.) Lat-Lon
South-East
Depth
(km)
Magnitude
Ml Mw
Intensity
(Io)
Location
19.05.2011
23:15
39.139-29.102
8.0
5.9 5.7
VI-VII Simav
Figure 1: Spatial distribution of the main shock and aftershocks

8
Tablo 2: Epicentral distances of nearby populated areas
Location Distance to
epicenter (km)
Level of
proximityLocation
Distance to
epicenter (km)
Level of
proximity
Söğüt 2.9 1 Başkonak 11.6 9
Kapıkaya. 4.9 2 Kızılçukur 12.0 10
Karacaören 5.7 3 Çitgöl 12.1 11
Hacıahmetoğlu 6.9 4 Güney 15.3 12
İnlice 7.5 5 Demirci 15.5 13
Gökçeler 7.7 6 Pazarlar 17.5 14
Yenipınar 8.7 7 Şaphane 18.0 15
Simav 11.6 8
Figure 2: Intensity distribution at large scale
The county center of Simav together with towns and villages in the vicinity of the epicenter have been affected by the earthquake. Casualty and building damage resulting from past earthquakes in the region is presented in Table 3.

9
Tablo 3: Building damage and casualties due to past earthquakes
10
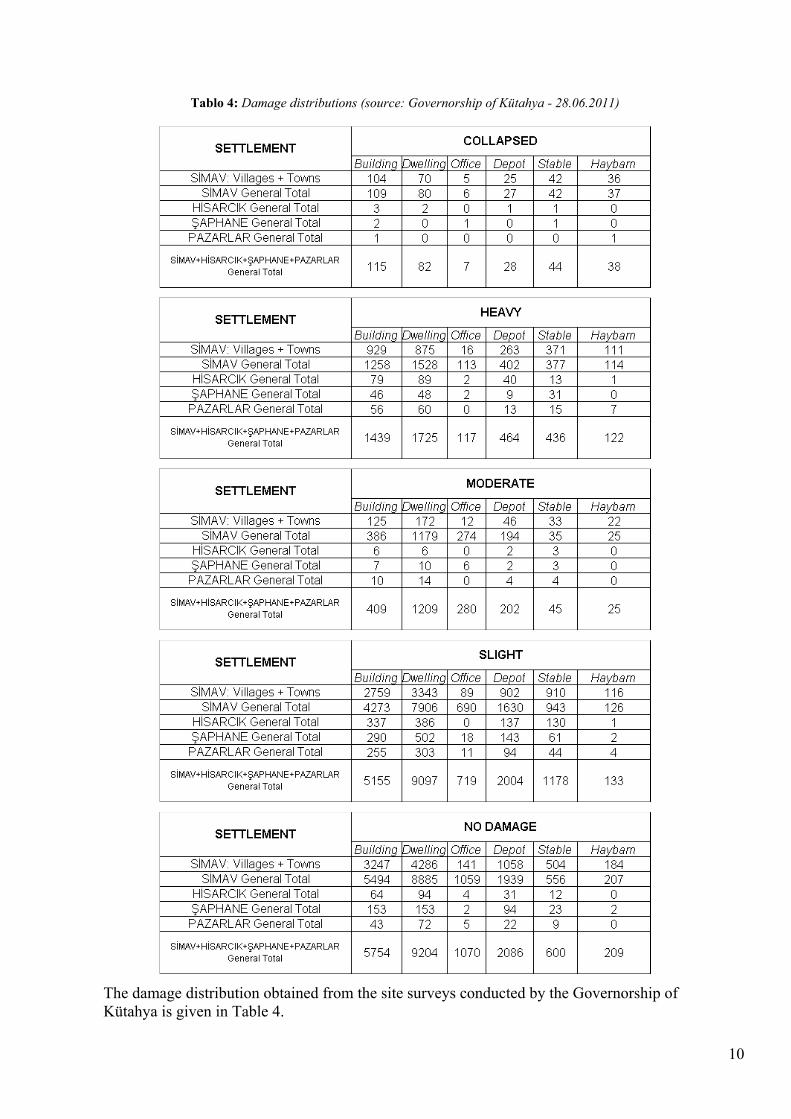
Tablo 4: Damage distributions (source: Governorship of Kütahya - 28.06.2011)
The damage distribution obtained from the site surveys conducted by the Governorship of Kütahya is given in Table 4.

11
As seen in the seismic zonation map of the Kütahya province given in Figure 3 the settlements affected by the earthquake reside mainly in a 1st degree seismic zone.
Figure 3: Seismic zonation of Kütahya province
2 Regional Geology
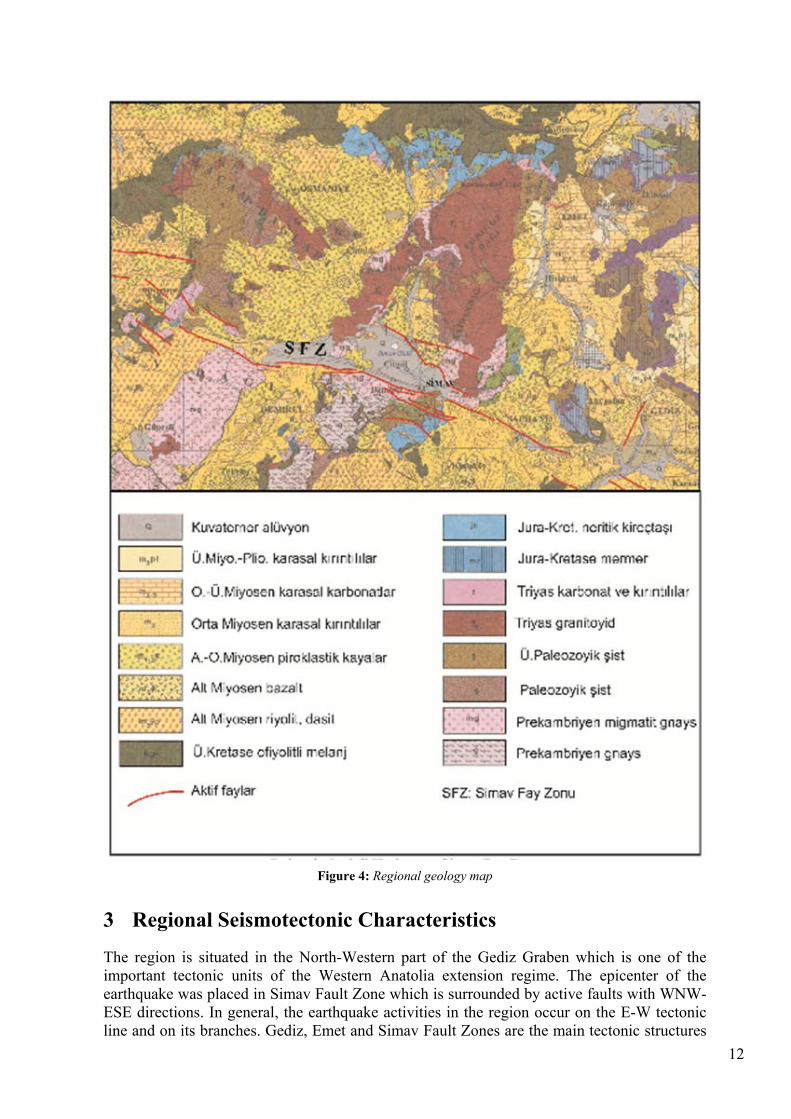
The region is located in the northeastern part of Menderes massif which is commonly affected by extensional tectonic regime. This part of the massif is represented by Precambrian – Tertiary aged rock units. The Simav detachment Fault separates footwall and hanging wall rock units which shows different litholojic, metamorphisim and deformation characteristics. The footwall rock units consist of medium-high grade metamorphites, pegmatoids and granitoids. The hangingwall rock units contain schist-marble and ophiolitic mélange units. All these units are covered by Neogene-Quaternary sedimentary and volcanic rocks (Isik, 2004). The regional geology map and Simav Fault Zone is shown in Figure 4.
12
Figure 4: Regional geology map
3 Regional Seismotectonic Characteristics
The region is situated in the North-Western part of the Gediz Graben which is one of the important tectonic units of the Western Anatolia extension regime. The epicenter of the earthquake was placed in Simav Fault Zone which is surrounded by active faults with WNW-ESE directions. In general, the earthquake activities in the region occur on the E-W tectonic line and on its branches. Gediz, Emet and Simav Fault Zones are the main tectonic structures
13
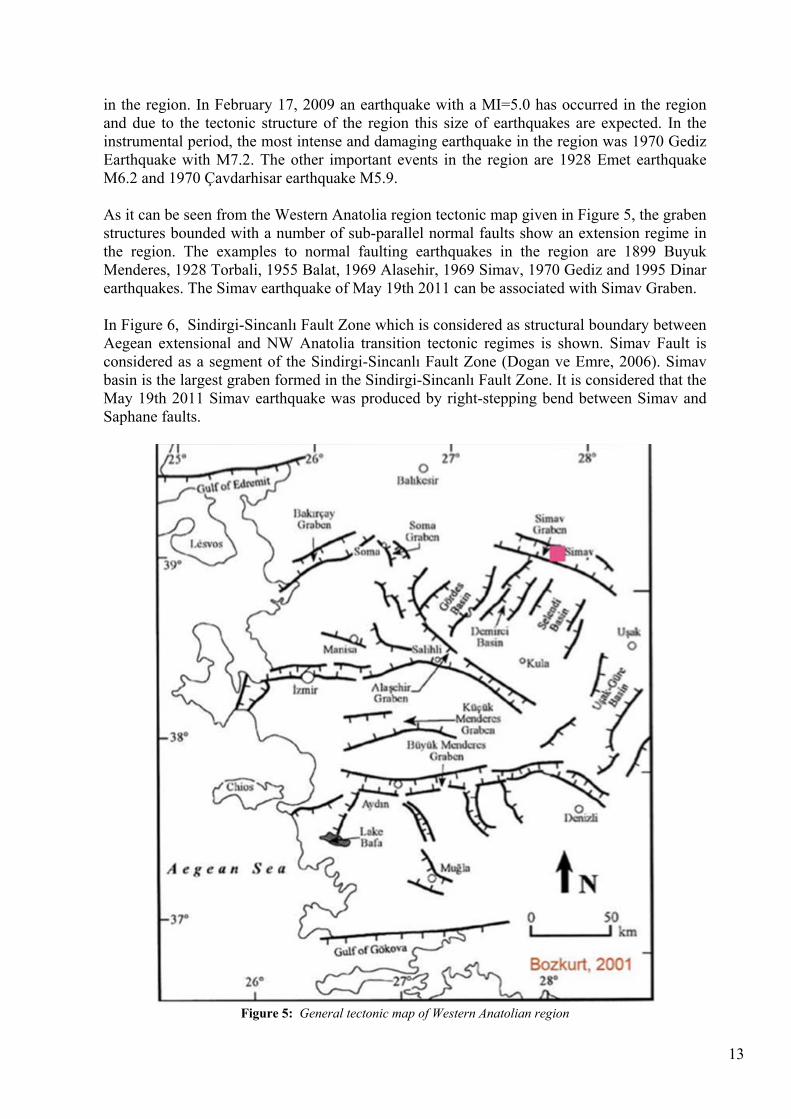
in the region. In February 17, 2009 an earthquake with a MI=5.0 has occurred in the region and due to the tectonic structure of the region this size of earthquakes are expected. In the instrumental period, the most intense and damaging earthquake in the region was 1970 Gediz Earthquake with M7.2. The other important events in the region are 1928 Emet earthquake M6.2 and 1970 Çavdarhisar earthquake M5.9. As it can be seen from the Western Anatolia region tectonic map given in Figure 5, the graben structures bounded with a number of sub-parallel normal faults show an extension regime in the region. The examples to normal faulting earthquakes in the region are 1899 Buyuk Menderes, 1928 Torbali, 1955 Balat, 1969 Alasehir, 1969 Simav, 1970 Gediz and 1995 Dinar earthquakes. The Simav earthquake of May 19th 2011 can be associated with Simav Graben. In Figure 6, Sindirgi-Sincanlı Fault Zone which is considered as structural boundary between Aegean extensional and NW Anatolia transition tectonic regimes is shown. Simav Fault is considered as a segment of the Sindirgi-Sincanlı Fault Zone (Dogan ve Emre, 2006). Simav basin is the largest graben formed in the Sindirgi-Sincanlı Fault Zone. It is considered that the May 19th 2011 Simav earthquake was produced by right-stepping bend between Simav and Saphane faults.
Figure 5: General tectonic map of Western Anatolian region

14
Figure 6: Sındırgı-Sincanlı Fault Zone
Figure 7: Distribution of the M≥5.0 earthquakes in the region in the last century (1900-2010)

15
4 Earthquake Source Parameters
The source mechanism solutions and parameters are given in Table 5.
Tablo 5: May19,2011 Simav Earthquake Source Parameters
May 19, 2011 Simav Earthquake Source Mechanism Parameters:
Tarih-Saat: 19.05.2011 23:15:23
Koordinat: 39.152K 29.088D
Büyüklük: 5.9
Derinlik: 7.6 km
Açıklama: SİMAV (KÜTAHYA)
May 19, 2011 Simav Earthquake Source Mechanism Solution:

16
5 Statistical Properties of the Earthquake
The three dimensional distributions of the aftershock hypocenters is given in Figure 8. Most of the aftershocks have occurred at depths of 5-10km.
Figure 8: Three dimensional distributions of the aftershocks
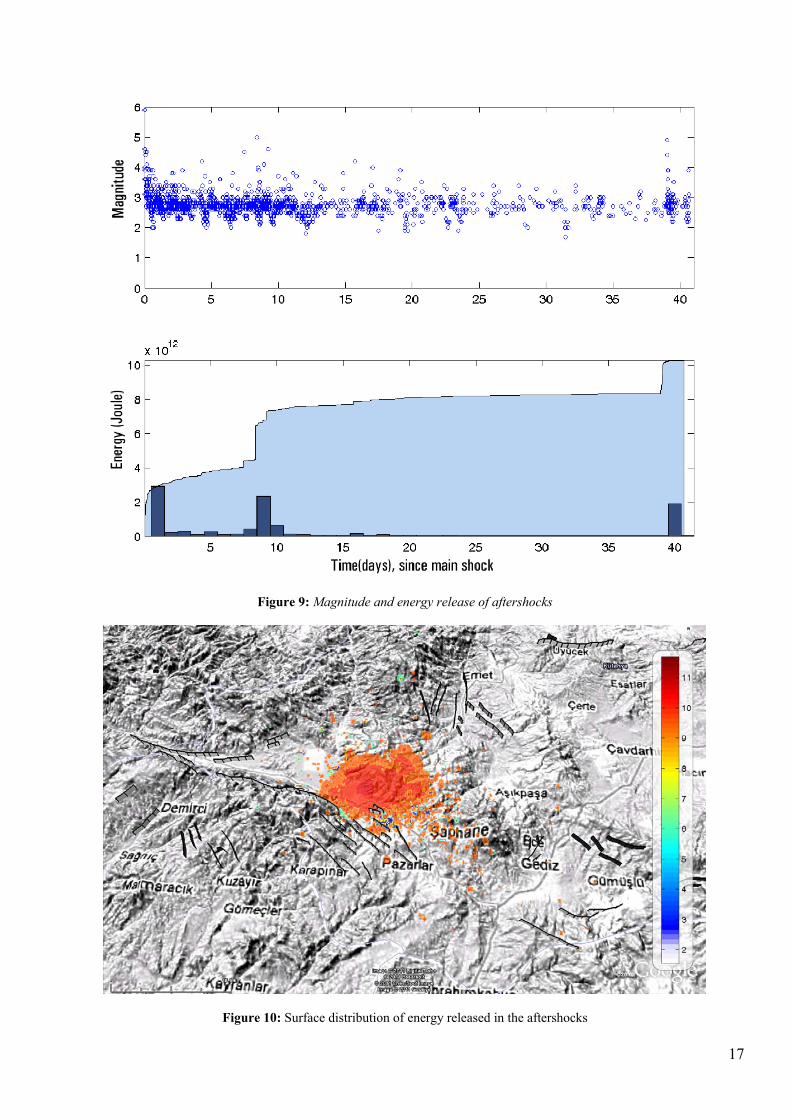
As seen in the magnitude-time graph of the aftershocks, given in Figure 9, the occurrence rate has decreased with time. In order to analyze the energy dissipation of the aftershocks, the following formula has been used to obtain the energy released with each event. In this equation E is energy in Joules, while M is the surface wave magnitude.
log( ) 4.8 1.5E M= +
The daily and cumulative energy release is shown in Figure 9. As seen in this graph, the total energy released during 40 days period is about 1013 Joule. This is the equivalent of an earthquake with a Ms5.4 magnitude. The surface distribution of the released energy, given in Figure 10, depicts a densification in the northwest-southeast directivity.
17
Figure 9: Magnitude and energy release of aftershocks
Figure 10: Surface distribution of energy released in the aftershocks

18
6 Ground Motion and Damage Estimations
ELER (Earthquake Loss Estimation Routine) software developed by BU-KOERI, Earthquake Engineering Department within the NERIES project JRA3 group has been used to obtain the ground motion and damage estimations after the earthquake. The earthquake parameters required by the software have been provided by the National Earthquake Monitoring Center (UDIM). The intensity distribution maps given in Figure 11 have been automatically generated and published on KOERI’s website within a few minutes of the earthquake. According to these maps the intensity in the vicinity of the epicenter is at the order of VI. A closer look at the intensity distribution surface, given in Figure 12, reveals that the intensity at the epicenter is close to level VII.
Figure 11: Estimated intensity maps at different scales
In order to obtain the estimated shaking intensity firstly the peak ground acceleration and velocity distributions have been generated using Boore & Atkinson (2008) ground motion prediction equation (GMPE). Afterwards the PGA and PGV parameters have been converted to shaking intensity using the instrumental intensity equation developed by Wald et. al (1999). The building damage estimations have been calculated using the previously obtained shaking intensity distributions and the building inventory of the region. The building numbers in damages classes from D1 to D5 have been calculated as: D1= 9741, D2= 1592, D3= 208, D4= 14 and D5= 0. The distributions of damage classes D3 and D4 are given in Figure 13.

19
Figure 12: Estimated Intensity Distribution Surface
Figure 13: Distributions of Damage Classes D3 and D4

20
7 Strong Ground Motion Recordings
The ground motion resulting from the main shock has been recorded by a total of 84 stations managed by the National Strong Ground Motion Network. The acceleration records are publicly available on the agency’s website (http://daphne.deprem.gov.tr). The ground motion parameters of the stations located within a 150 km radius of the epicenter are given in Table-6. A single ground motion value has been calculated for each station, by taking the geometric mean of the two horizontal components.
Table 6: Recorded Ground Motion Parameters
Station Distance PGA CAV PGV PSA 1s PSA 0.2s Arias İntensity Trifunac Duration
(km) (gal) (cm/s) (cm/s) (gal) (gal) (cm/s) (s)
4305 9.98 91.16 20.65 1.49 8.52 135.60 1.10 0.58
4306 26.80 73.93 256.94 7.09 16.42 184.17 7.29 14.45
4304 31.48 97.90 271.14 3.64 11.15 152.31 6.53 17.06
4504 39.00 687.37 658.55 17.40 16.22 791.70 95.59 7.00
6401 58.40 47.40 154.39 3.99 6.12 72.62 2.80 10.55
1009 62.81 16.39 81.74 1.08 8.06 34.49 0.36 27.93
4301 84.88 29.07 160.08 1.88 5.74 95.41 1.59 22.70
1613 87.93 20.60 122.57 1.44 4.24 45.17 0.88 28.02
4506 110.08 9.65 111.08 1.61 17.13 18.83 0.45 49.22
4502 111.50 17.65 127.08 2.88 6.44 30.62 0.81 34.14
1614 116.34 42.72 127.93 2.89 7.76 119.27 1.70 12.72
2607 118.90 7.25 53.52 0.83 0.00 20.09 0.13 44.43
1102 119.56 13.05 52.73 0.90 0.00 36.15 0.20 25.86
1601 121.52 4.27 31.77 0.36 17.98 7.41 0.04 39.38
2009 135.65 8.43 109.35 1.49 0.00 17.70 0.37 67.93
1618 136.09 14.36 66.09 0.94 5.70 29.49 0.34 24.57
2611 137.70 10.29 91.42 1.29 5.58 25.74 0.32 53.44
2610 138.18 11.16 83.86 1.49 4.18 25.27 0.35 31.62
1607 140.29 19.13 186.43 3.85 9.25 30.21 1.17 51.65
2605 140.85 13.29 60.66 0.89 0.00 47.99 0.23 27.09
2602 141.74 7.02 53.87 0.91 0.00 11.17 0.12 41.37
2604 141.79 9.92 57.64 0.97 2.16 16.14 0.19 29.56
1608 142.32 9.50 50.19 1.08 0.00 15.45 0.16 31.14
1609 143.91 19.43 152.35 1.96 3.40 40.82 0.82 48.67
2603 144.04 7.02 27.51 0.59 0.00 16.12 0.05 31.09
2614 144.14 4.25 24.10 0.57 0.00 6.89 0.04 26.20
1615 144.50 11.54 97.72 1.80 6.98 26.83 0.44 40.54
2613 145.11 9.88 68.72 1.12 4.44 23.31 0.22 36.44
2601 145.41 6.94 37.94 0.53 0.00 12.44 0.10 30.50
2616 146.61 4.82 30.55 0.47 0.00 10.58 0.04 39.25
1616 147.21 3.79 19.12 0.45 0.00 9.83 0.02 33.36
2010 148.35 2.37 33.45 0.63 0.00 4.02 0.04 58.85

21
The PGA and PGV distributions have been plotted using the actual station recordings. The stations are annotated by triangles, colored according to the amplitude of the recorded ground motion parameter.
Figure 14: PGA Distribution Map
Figure 15: PGV Distribution Map

22
The recorded ground motions have been compared with commonly used ground motion prediction equations (GMPEs). These comparisons were done for the GMPEs given in Table 7, taking into account the median values for bedrock sites (Vs30=760/s).
Table 7: GMPE Models used in the comparisons
Date Authors Abbreviation
1997 Abrahamson & Silva AS_97
2007 Boore & Atkinson BA_07
2007 Campbel & Bozorgnia CB_07
2007 Chiou & Youngs CY_07
1997 Boore vd. BJF_97
1997 Sadigh vd. SD_97
2008 Çeken vd. CE_08
2004 Kalkan & Gülkan KG_04
The comparisons were carried out for peak ground acceleration (PGA), and peak spectral accelerations at periods of 0.2s and 1.0s (PSA 02s, 1.0s). The actual recorded values are plotted against all GMPE models and the resulting difference is given in the form of absolute mean error. The results for three different ground motion parameters are given in Figure 16, 17 and 18 respectively.
Figure 16: Comparison of actual PGA values with GMPEs

23
Figure 17: Comparison of actual PSA 0.2 values with GMPEs
Figure 18: Comparison of actual PSA 1.0s values with GMPEs

24
As seen in the comparison figures, for each ground motion parameter the estimations closest to the observed values are obtained from a different GMPE model. Although for PGA and PSA 0.2 the estimation performances of the GMPEs are similar, for PSA 1.0s Chiou & Youngs (2007) model’s estimation errors are considerably low. Although for PSA 0.2 and 1.0s the station recordings are in well accordance with the GMPEs, it is also observed that for short periods station 4504 is above the median while for long periods station 4305 is below the median. The acceleration-time records of these two stations are given in Figure 19. Since station 4305 recorded only the first 6 seconds of the earthquake the high period spectral acceleration values are quiet low.
Figure 19: Acceleration-time records of stations 4305 and 4504
In order to investigate the high frequency content of the station 4504, the EW component has been plotted in detail in Figure 20. The spectrogram of the recording also reveals that high frequencies are dominant at the time of the peak amplitude, around 16s.
Figure 20: High frequency content of station 4504
The site survey of the station indicate that the shear wave velocity at the top 30m is Vs30= 336m/s which in turn suggests a relatively soft soil site. Since soft soils are expected to attenuate high frequencies further examination of the record is carried out by plotting its free particle diagram.

25
Figure 21: Free particle motion diagram of station 4504
The free particle motion diagram of the station 4305 record is given in Figure 21. The time is given in the vertical axis while the horizontal motion is given in the x-y plane. Additionally the accelerations acting upon the particle at each instance are shown as colored lines. From this diagram it is observed that during the initial peak at t=15.9s, the displacement is smooth. Whereas during the second peak at t=16.4s a sudden direction change is observed in a tightly constrained area. Finally the ground motion recordings of the closest stations 4306 (27km), 4304 (31km) and 6401(58km) have been investigated. The acceleration response spectra of these records are plotted against the design spectrum of the Turkish Seismic Code (TSC). The design spectrum is given for the 4 different site classes.

26
Figure 22: Response spectra compared with TSC 2007

27
8 Building Types
As a consequence of interviews with dwellers of the region and visual observations, building stock of Simav town can be assessed in three groups;
• 4-5 storey reinforced concrete (RC) buildings • 7-8 storey reinforced concrete (RC) buildings • Masonry buildings
8.1 4-5 Storey Reinforced Concrete Buildings
Large amount of building stock of Simav town center is composed of 4-5 storey RC buildings, built in between 1970-1990. Most of them have a roof floor, which is apparently added afterwards, not existed in the original design. Generally, these buildings have single apartment in each floor, and ground floor area is about 120-130 m2. Some examples of these buildings are presented in the following pictures.
Figure 23: Simav town, typical 4-5 storey RC buildings -1
Figure 24: Simav town, typical 4-5 storey RC buildings - 2

28
Figure 25: Simav town, typical 4-5 storey RC buildings - 3
4-5 storey buildings are constructed as individuals at outer regions and adjacent to each other at older residential districts in town center. In most of these buildings, ground floor height is a bit higher than other floors which may lead the building to collapse with soft storey mechanism. Even if, there was only one building collapsed in all buildings stock during the main and after shocks, for higher magnitude earthquakes building collapses due to soft storey mechanism may most probably occur.
Figure 26: Buildings adjacently constructed in town center -1
As shown in the pictures, buildings, having different heights and/or structural systems have been constructured adjacently, without any care whether the floor levels of adjacent buildings are at the same height. Another observation is that, in most of the buildings, balcony slabs designed as cantilever and with low thickness. In very few number of buildings, balcony slabs are supported by (at least) cantilever beams. Therefore, as will be shown in the following chapters, in many buildings these slabs are considerably deflected or failed.

29
Figure 27: Buildings adjacently constructed in town center - 2
In outer districts, relatively younger buildings (in the sense of building age, contruction year is 2000 or later) exist. These buildings are constructed as single or 2-3 buildings together by same contractor and with same structural design.
Figure 28: Recently constructed buildings
30
8.2 7-8 Storey Reinforced Concrete Buildings
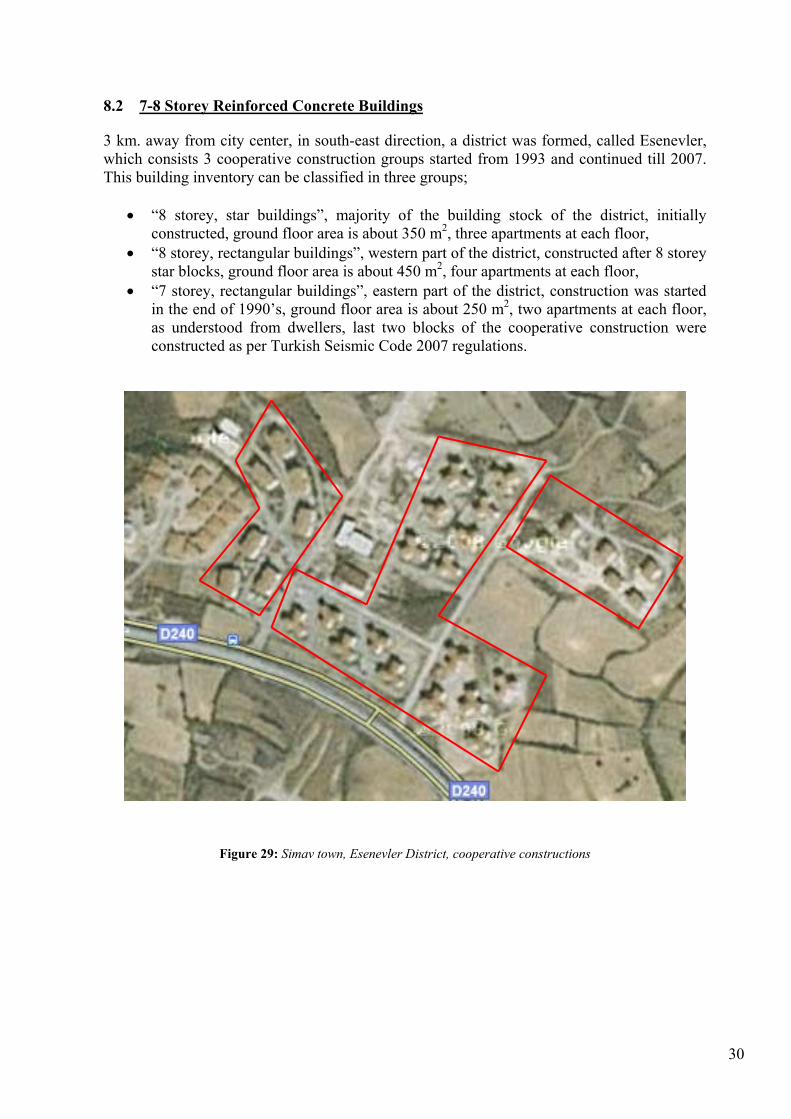
3 km. away from city center, in south-east direction, a district was formed, called Esenevler, which consists 3 cooperative construction groups started from 1993 and continued till 2007. This building inventory can be classified in three groups;
• “8 storey, star buildings”, majority of the building stock of the district, initially constructed, ground floor area is about 350 m2, three apartments at each floor,
• “8 storey, rectangular buildings”, western part of the district, constructed after 8 storey star blocks, ground floor area is about 450 m2, four apartments at each floor,
• “7 storey, rectangular buildings”, eastern part of the district, construction was started in the end of 1990’s, ground floor area is about 250 m2, two apartments at each floor, as understood from dwellers, last two blocks of the cooperative construction were constructed as per Turkish Seismic Code 2007 regulations.
Figure 29: Simav town, Esenevler District, cooperative constructions

31
Figure 30: 8 storey star buildings, side view - 1
Figure 31: 8 storey star buildings, side view – 2

32
Figure 32: 8 storey rectangular buildings
Figure 33: 7 storey rectangular buildings - 1

33
Figure 34: 7 storey rectangular buildings – 2
34
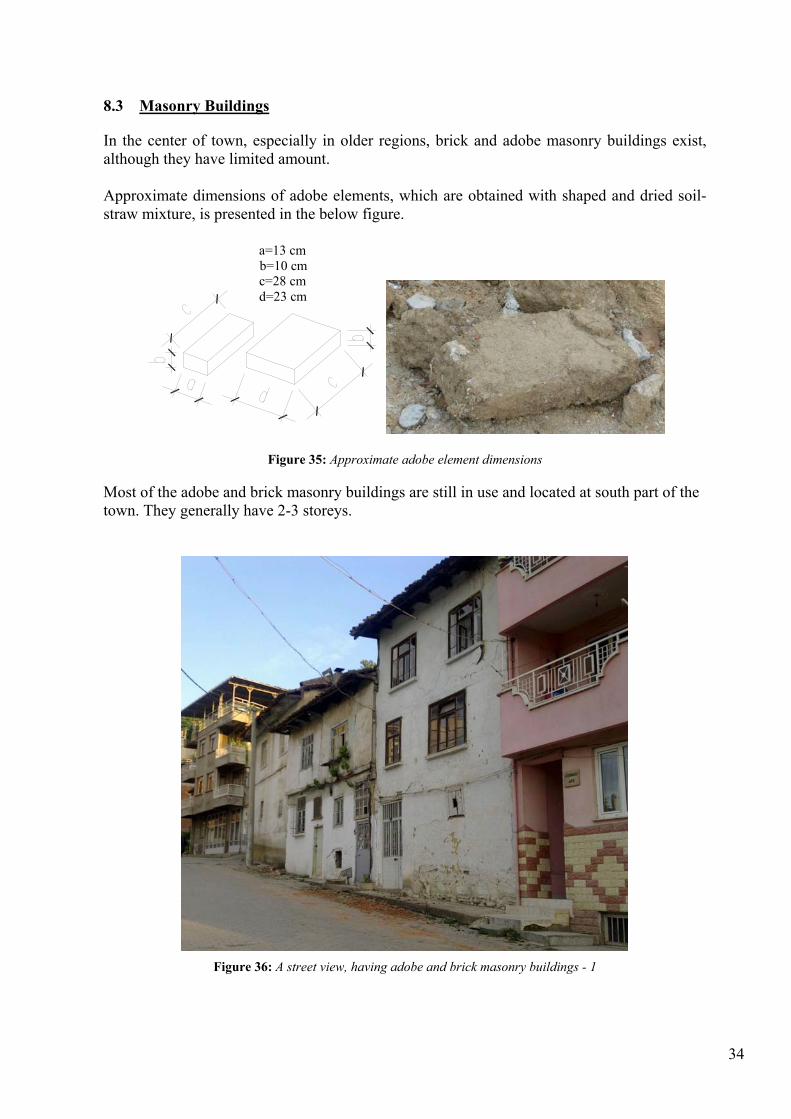
8.3 Masonry Buildings
In the center of town, especially in older regions, brick and adobe masonry buildings exist, although they have limited amount. Approximate dimensions of adobe elements, which are obtained with shaped and dried soil-straw mixture, is presented in the below figure.
a=13 cmb=10 cmc=28 cmd=23 cm
Figure 35: Approximate adobe element dimensions
Most of the adobe and brick masonry buildings are still in use and located at south part of the town. They generally have 2-3 storeys.
Figure 36: A street view, having adobe and brick masonry buildings - 1

35
Figure 37: A street view, having adobe and brick masonry buildings - 2
Figure 38: 2-3 storey brick masonry buildings, adjacent to collapsed adobe masonry building
36
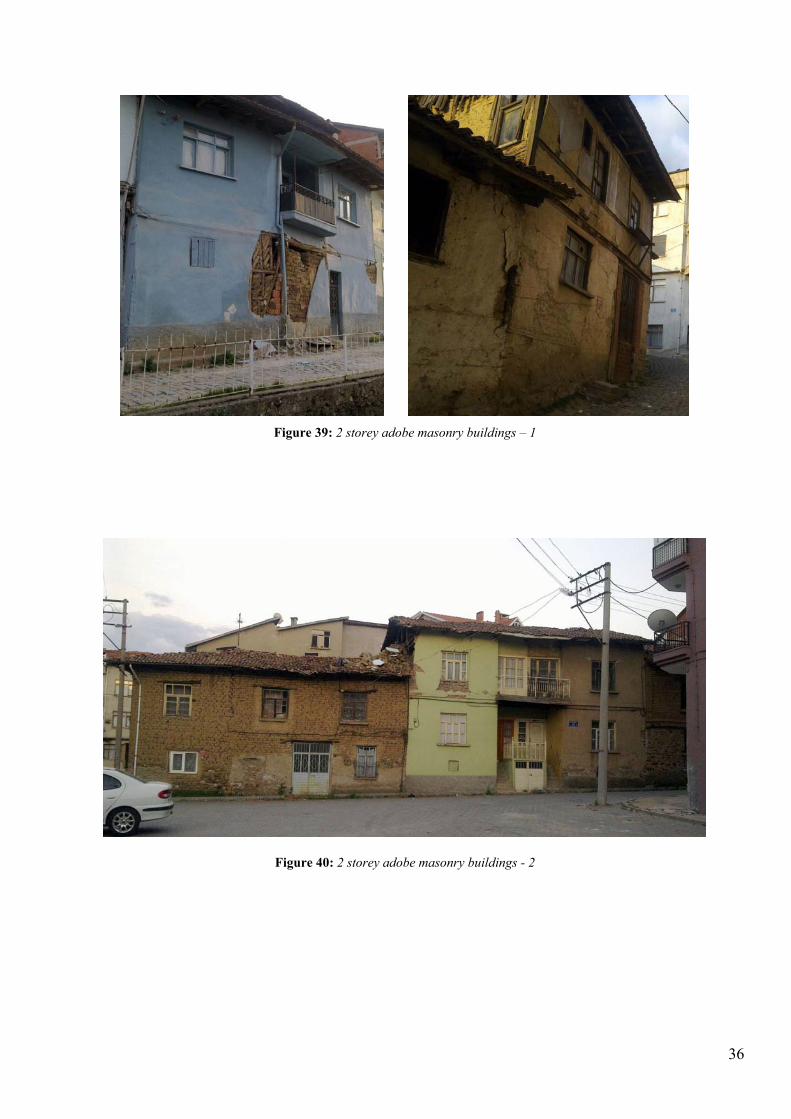
Figure 39: 2 storey adobe masonry buildings – 1
Figure 40: 2 storey adobe masonry buildings - 2

37
Figure 41: 2 and 3storey abode masonry buildings
Figure 42: Brick masonry mosque, constructed in 1962

38
Figure 43: A stone masonry mosque, constructed in the middle of 17th century and recently restored
Figure 44: 3 storey brick masonry building

39
Figure 45: 3 storey building of which infill bricks are being used as a structural load bearing elements,
combined with RC beams!!!

40
9 Building Vulnerability Class
Building vulnerability classes for masonry and RC buildings, based on European Macroseismic Scale (EMS-98), are presented in below table. According to below table, vulnerability class of masonry buildings can be identified as “A”, or “B” with most optimistic approach. RC structures were obviously designed without earthquake resistant design (ERD) principles, as shown in building damage pictures in the following chapter and visual field observations. Therefore, vulnerability class for RC stuructures can be identified between B and C.
Table 8: Building vulnerability classes in EMS-98
A B C D E F
Rubble stone, field stone
Adobe (earth brick)
Simple stone
Massive stone
Unreinforced, with manufactured stone units
Unreinforced, with RC floors
Reinforced or confined
Frame without ERD
Frame with moderate level of ERD
Frame with high level of ERD
Walls without ERD
Walls with moderate level of ERD
Walls with high level of ERD
Most likely vulnerability class
Probable range
Range of less probable, exceptional cases
Masonry
ReinforcedConcrete
Type of StructureVulnerability Class

41
10 Building Damage Levels
Building damage levels for masonry and RC buildings, based on European Macroseismic Scale (EMS-98), are presented in below table.
Table 9: Building damage levels for masonry buildings in EMS-98
Grade 1: Negligible to slight damage(no structural damage,slight non-structural damage)
Hair-line cracks in very few walls.Fall of small pieces of plaster only.Fall of loose stones from upper parts ofbuildings in very few cases.
Grade 2: Moderate damage(slight structural damage, moderatenon-structural damage)
Cracks in many walls.Fall of fairly large pieces of plaster.Partial collapse of chimneys.
Grade 3: Substantial to heavy damage(moderate structural damage,heavy non-structural damage)
Large and extensive cracks in most walls.Roof tiles detach. Chimneys fracture at theroof line; failure of individual non-structuralelements (partitions, gable walls).
Grade 4: Very heavy damage(heavy structural damage,very heavy non-structural damage)
Serious failure of walls; partial structuralfailure of roofs and floors.
Grade 5: Destruction(very heavy structural damage)
Total or near total collapse.

42
Table 10: Building damage levels for RC buildings in EMS-98
Grade 1: Negligible to slight damage(no structural damage,slight non-structural damage)
Fine cracks in plaster over frame membersor in walls at the base.Fine cracks in partitions and infills.
Grade 2: Moderate damage(slight structural damage,moderate non-structural damage)
Cracks in columns and beams of framesand in structural walls.Cracks in partition and infill walls; fall ofbrittle cladding and plaster. Falling mortarfrom the joints of wall panels.
Grade 3: Substantial to heavy damage(moderate structural damage,heavy non-structural damage)Cracks in columns and beam column jointsof frames at the base and at joints ofcoupled walls. Spalling of conrete cover,buckling of reinforced rods.Large cracks in partition and infill walls,failure of individual infill panels.
Grade 4: Very heavy damage(heavy structural damage,very heavy non-structural damage)Large cracks in structural elements withcompression failure of concrete andfracture of rebars; bond failure of beamreinforced bars; tilting of columns.Collapse of a few columns or of a singleupper floor.
Grade 5: Destruction(very heavy structural damage)
Collapse of ground floor or parts (e. g.wings) of buildings.
Figure 46: Quantifying amount of damage; ratio of damaged buildings of a particular level over all building
stock

43
11 Building Damages
Building damage investigations are summarized below, considering previously presented building damage level and vulnerability class tables;
• 60% of the 4-5 storey RC buildings, which compose the majority of the building stock as presented in section 8.1, are exposed to slight structural damage and moderate non-structural damage. This damage characteristic corresponds to grade 2 , as presented in building damage levels section.
• During building damage investigation, aftershocks had occured frequently. Therefore,
entry was prohibited for many buildings due to safety needs, thus forcing us to figure out damage patterns only from outside of the buildings. Under earthquake excitation, especially structural elements at outer axes are expected to get higher level of damage. However, considering small cross section areas and low concrete quality, central columns may have higher axial load ratio, thus leading to reach inelastic behaviour at lower moment capacity. In other words, “slight structural damage” comment shall be reconsidered after damage patterns on the structural elements inside the buildings are investigated.
• Generally, outer infill walls are composed of two layers of thin infill wall bricks,
consisting one layer of styrofoam which has 1.5 cm thickness. Because of low labor quality and absence of connection or binding within two brick layers, high level of damage at outer infill walls became inevitable. Although, infill wall damage patterns are considered as non-structural damage and will not affect load carrying capacity of the structure, it constitutes risk, causing injures and casualties via partial failure or out of plane turnover.
• Fine or wide cracks on many infill walls, classified as moderate or heavy non-
structural damage, partial failures and widespread existence of this damage pattern cause dwellers to describe the earthquake as “severe”, and buildings as “collapsed”.
• Very few number of buildings have damage grade 3, of which RC members cracked,
concrete cover spalled, reinforcement bars buckled, and defined as substantial to heavy damage. Afterall, there is only one collapsed building. Based on the visual observations, possible reasons for structural damage can be summarized as following;
o Reinforced concrete buildings are designed without earthquake resistant design
(ERD) principles. As mentioned before, majority of the building stock composed of 4-5 storey RC buildings, constructed between 1970-1990.
o In the collapsed building, there were beam-column joint failures of which the
column was totally splitted up from the joint.
o Transverse reinforcements in columns and beams, which are supposed to provide confinement effect on the section, were not designed with proper intervals, bar size and 135 degrees hooks.
o Column section dimensions seem to be inadequate and longitidunal
reinforcement bar sizes were usually small. Steel grade S220 was used as all reinforcement bars.

44
o Concrete quality seems to be low especially for older buildings. Concrete appears to be prepared primitevly with fine aggragate and low cement ratio. According to interviews with dwellers, ready-mixed concrete has been used in constructions since 2003.
• Considering above mentioned defects, more severe structural damage will be
inevitable under stronger earthquake excitations.
• Simav town was initially formed at a hillside and then extended towards to basin. Ground water level is high, and load carrying capacity of soil appears to be low. Definitely, soil conditions are effective on widespread damage. As mentioned in section Error! Reference source not found., masonry buildings were constructed at hillside, having stiff soil conditions, which is one reason that these higly vulnerable masonry buildings could survive with slight damage after the earthquake. However, at basin, under soft soil conditions, some buildings survived without any damage, which are located next to grade 2 damaged buildings. Therefore, this shows that soil conditon is not the only parameter that controls the level of damage as supposed. Beside soil conditons, structural design and construction based on earthquake resistant design principles, labor and material quality are also important.
In the below figures, parallel to above mentioned observations, some damaged buildings are shown from center of Simav town, and Gökçeler village. While looking through the pictures, one shall keep in mind that, buildings, exposed to damage grade 2 is around 50-60% and grade 3 is not more than 5% of the building stock.
Figure 47: Collapsed building at the town center

45
Figure 48: South-east corner column of the collapsed building
Figure 49: South-west corner column of the collapsed building

46
Figure 50: North-west corner column of the collapsed building
Figure 51: Beam-column joint detail of the north-west corner
47
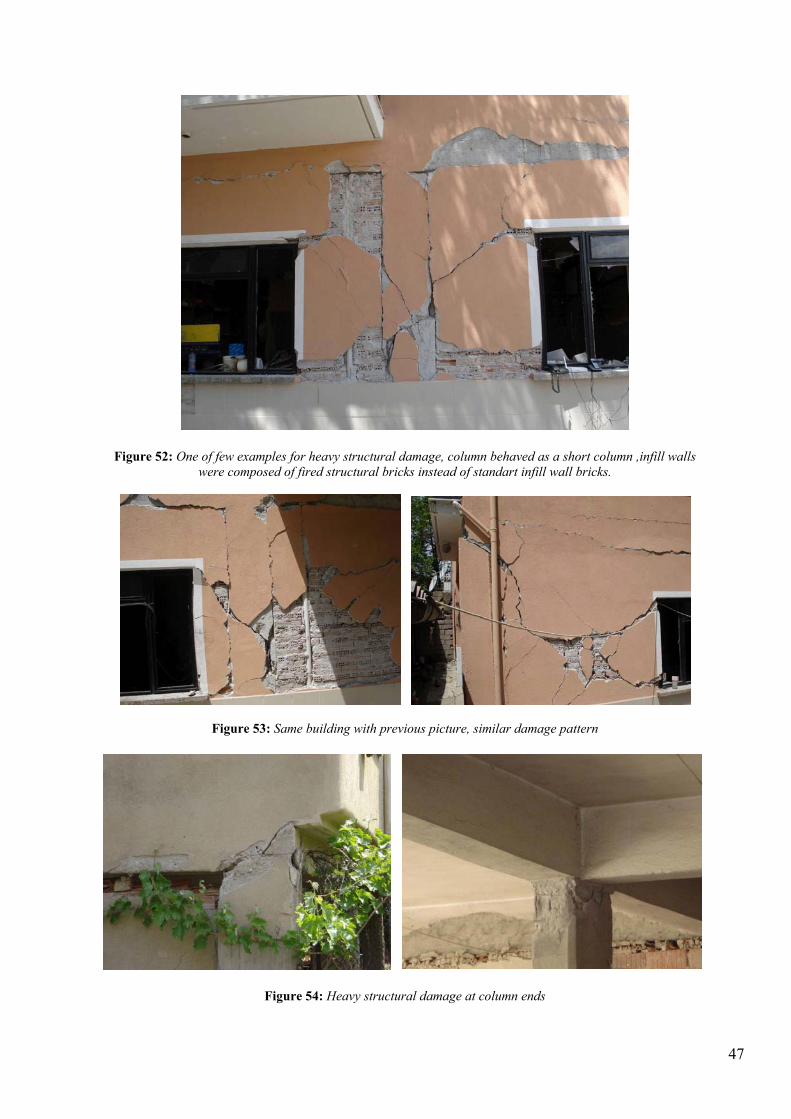
Figure 52: One of few examples for heavy structural damage, column behaved as a short column ,infill walls were composed of fired structural bricks instead of standart infill wall bricks.
Figure 53: Same building with previous picture, similar damage pattern
Figure 54: Heavy structural damage at column ends
48
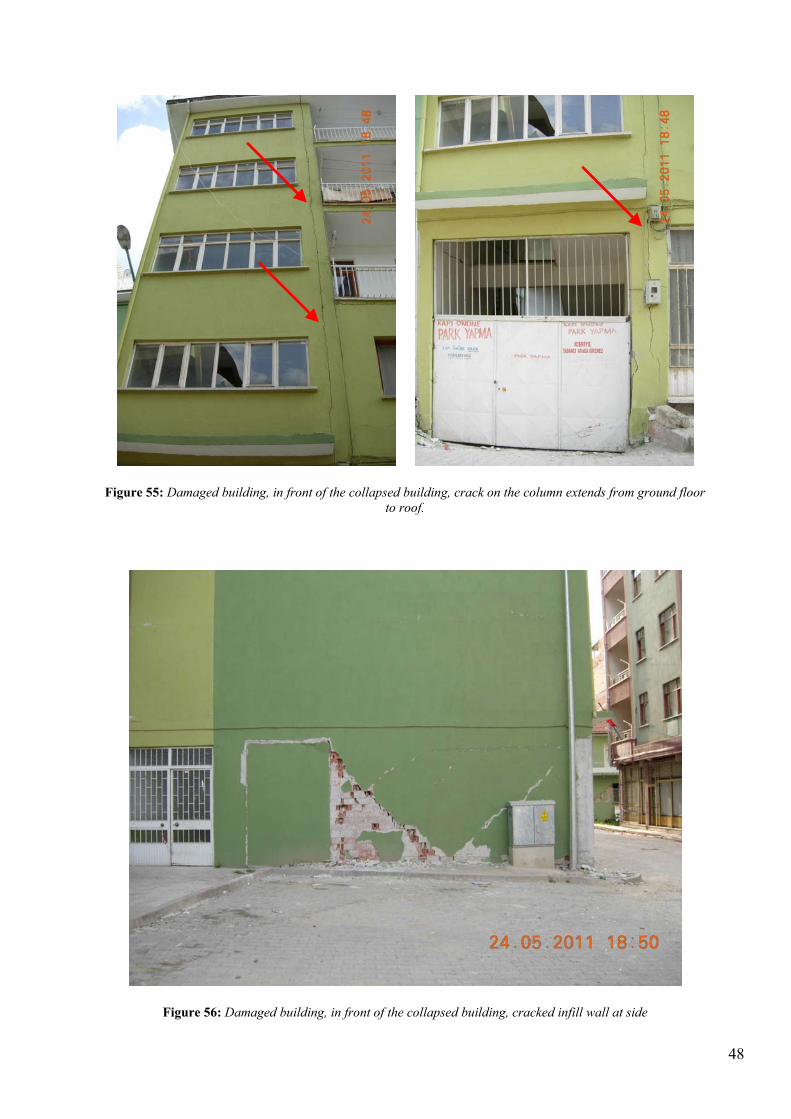
Figure 55: Damaged building, in front of the collapsed building, crack on the column extends from ground floor to roof.
Figure 56: Damaged building, in front of the collapsed building, cracked infill wall at side

49
Figure 57: Damaged building, which was apperantly damaged during previous earthquakes, plaster was repaired, but same locations cracked again in this earthquake
Figure 58: Non-structural infill wall damage on a new building which is still under construction

50
Figure 59: Roof damage
Figure 60: Infill wall damage, front and side view

51
Figure 61: Infill wall damage and spalling of the plaster of structural members, front and side view
Figure 62: Damage at outer infill walls
52
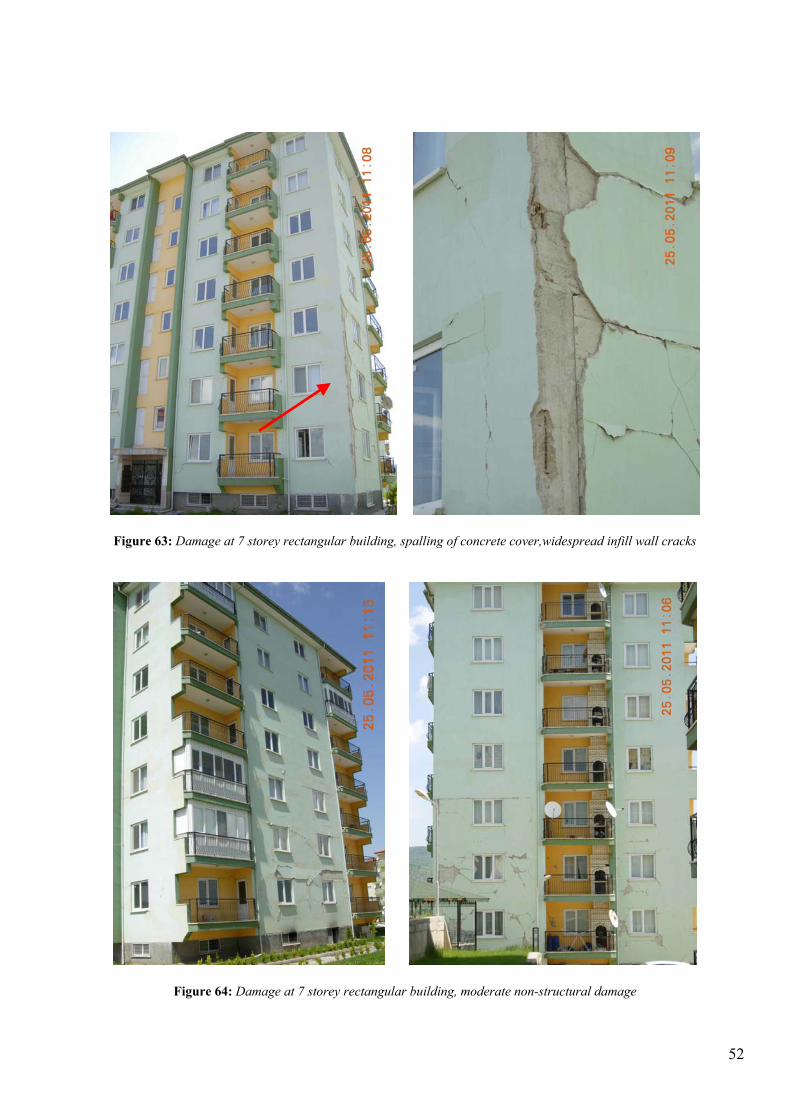
Figure 63: Damage at 7 storey rectangular building, spalling of concrete cover,widespread infill wall cracks
Figure 64: Damage at 7 storey rectangular building, moderate non-structural damage

53
Figure 65: Damage at 8 storey star buildings, moderate non-structural damage
Figure 66: Recently completed building of hospital complex, cracks at infill walls, but building is still at operational level

54
Figure 67: Another building of the hospital complex, which is completed in the begining of 2000’s, biochemistry lab. , all machines have displaced and smaller ones (like monitor) turned over during earthquake
Figure 68: Hospital building, completed in the begining of 2000’s, biochemistry lab. (same room) , machine has displaced, and infill wall cracked during earthquake

55
Figure 69: Hospital building, completed in the begining of 2000’s, infill wall crack
Figure 70: Hospital building, completed in the begining of 2000’s, infill wall crack

56
Figure 71: Hospital building, completed in the begining of 2000’s, infill wall crack
Figure 72: Building next to hospital complex – staircase infill wall cracks, spalling of plaster
57
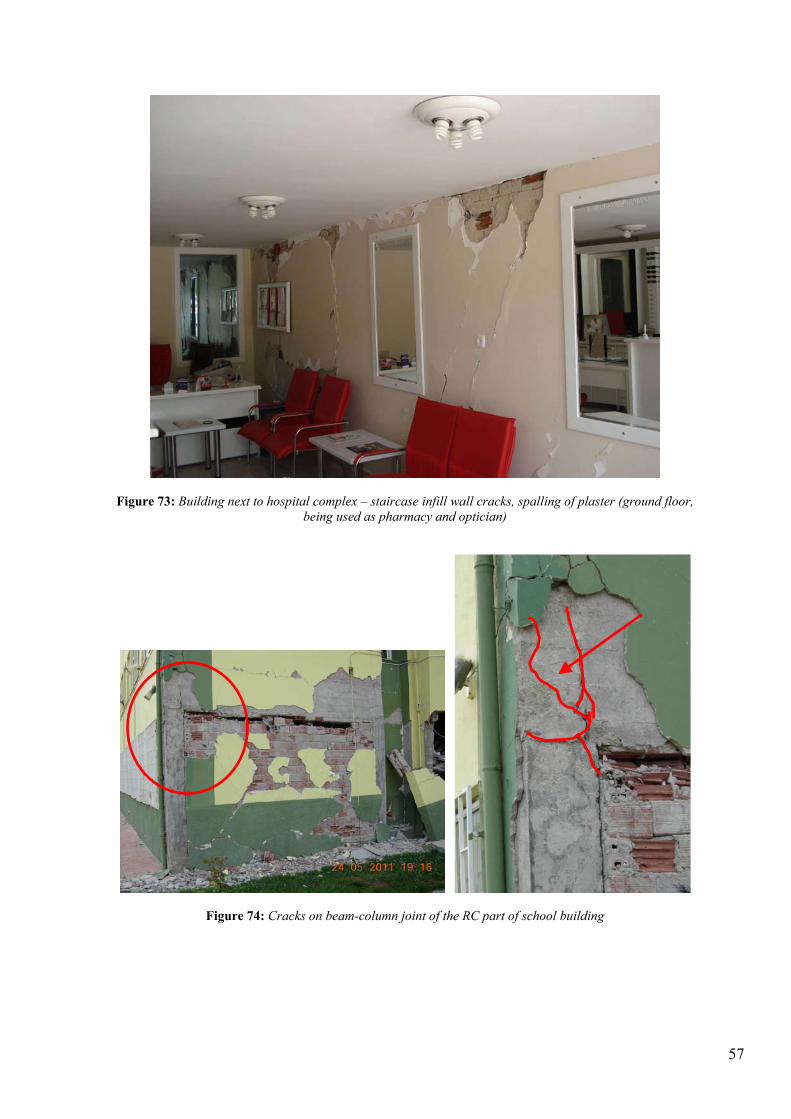
Figure 73: Building next to hospital complex – staircase infill wall cracks, spalling of plaster (ground floor, being used as pharmacy and optician)
Figure 74: Cracks on beam-column joint of the RC part of school building

58
Figure 75: Staircase damage of the RC part of school building, general practice of the territory is to build staircase slabs so thin and without any beam to support the slab
Figure 76: Cracks on outer walls of masonry part of the school building

59
Figure 77: Cracks on outer walls of masonry part of the school building, 2nd floor
Figure 78: Inside of masonry part of the school building- spalling of plaster

60
Figure 79: Large crack between masonry and RC parts of the school building
Figure 80: Gökçeler village, grade 3 damaged building, front view

61
Figure 81: Gökçeler village, grade 3 damaged building, side view
Figure 82: Cracks on brick masonry mosque
62
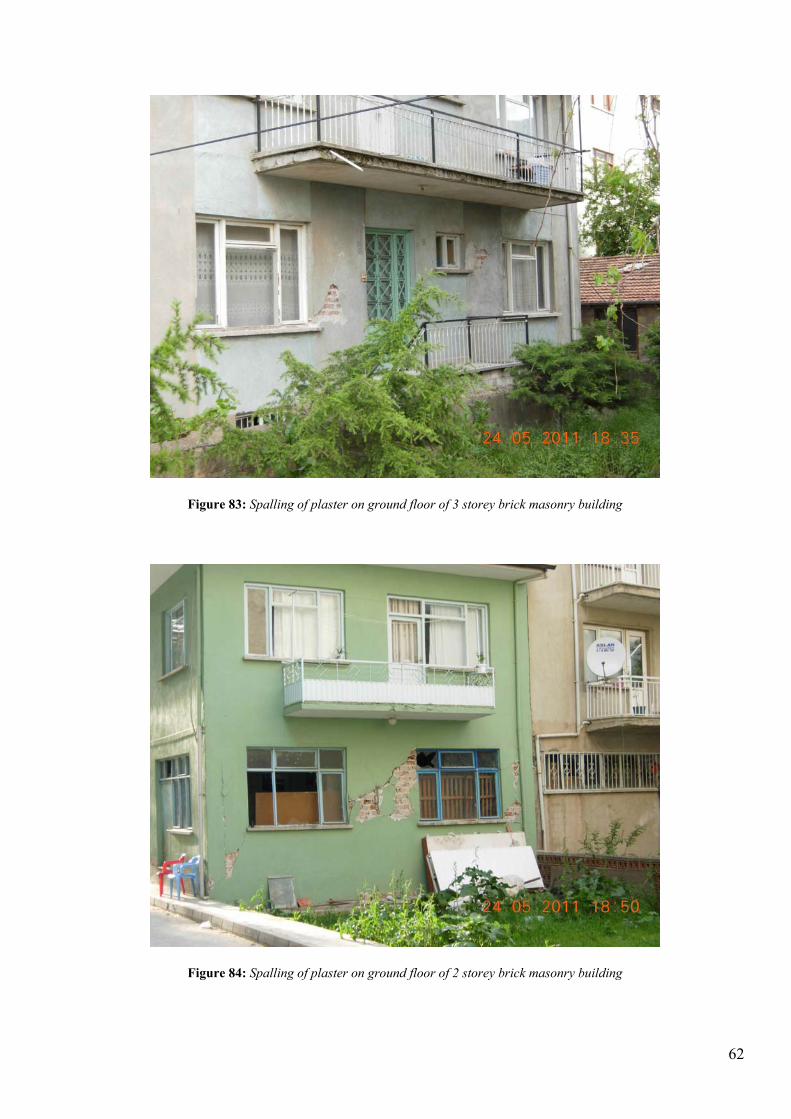
Figure 83: Spalling of plaster on ground floor of 3 storey brick masonry building
Figure 84: Spalling of plaster on ground floor of 2 storey brick masonry building

63
12 Intensity of Earthquake
Some definitions have been made in Building Vulnerability Class, Building Damage Levels and Building Damages sections and some pictures have been presented, in order to identify the intensity of 19.05.2011 Simav earthquake. If the current situtation is summarized as “Many buildings of vulnerability class B suffer damage of grade 2; a few of grade 3”, intensity of the earthquake can be identified as 7 (VII) according to European Macroseismic Scale (EMS-98). In addition to building damage levels and its extension, information taken by interviews with dwellers, about how the earthquake was felt is consistent with the ones, described for intensity 7earthquake at EMS-98. Detailed information about this subject can be found in the references. However, description of intensity level 7 and one level lower and higher intensity levels are presented. VI: Slightly damaging a) Felt by most indoors and by many outdoors. A few persons lose their balance. Many people
are frightened and run outdoors. b) Small objects of ordinary stability may fall and furniture may be shifted. In few instances
dishes and glassware may break. Farm animals (even outdoors) may be frightened. c) Damage of grade 1 is sustained by many buildings of vulnerability class A and B; a few of
class A and B suffer damage of grade 2; a few of class C suffer damage of grade 1. VII: Damaging a) Most people are frightened and try to run outdoors. Many find it difficult to stand
especially on upper floors. b) Furniture is shifted and top-heavy furniture may be overturned. Objects fall from shelves in
large numbers. Water splashes from containers, tanks and pools. c) Damage distribution,
Many buildings of vulnerability class A suffer damage of grade 3; a few of grade 4.
Many buildings of vulnerability class B suffer damage of grade 2; a few of grade 3.
A few buildings of vulnerability class C sustain damage of grade 2.
A few buildings of vulnerability class D sustain damage of grade 1.

64
VIII: Heavily damaging a) Many people find it difficult to stand, even outdoors. b) Furniture may be overturned. Objects like TV sets, typewriters etc. fall to the ground.
Tombstones may occasionally be displaced, twisted or overturned. Waves may be seen on very soft ground.
c) Damage distribution,
Many buildings of vulnerability class A suffer damage of grade 4; a few of grade 5.
Many buildings of vulnerability class B suffer damage of grade 3; a few of grade 4.
Many buildings of vulnerability class C suffer damage of grade 2; a few of grade 3.
A few buildings of vulnerability class D sustain damage of grade 2. Moreover, there is a web-based service called “Did you feel it?” which is performed under the scope of Earthquake Hazards Programme by USGS (United States Geological Survey) with the aim of getting information about how an earthquake is felt by people. After Simav earthquake, there had been over 1200 entries, describing the earthquake and its effects. In the below figure, number of responses is plotted depending on time since earthquake occurs. As shown, 90% of the responses came within 2 hours.
Figure 85: Number of responses vs time since earthquake

65
Figure 86: Distribution of responses with various intensity levels
Although, the intensity distribution, especially damage classification shown in above figure depends on individual responses and personal capability on observing such effects, the results are compatible with identified intensity level “7”, at the beginning of this section.

66
Figure 87: Intensity vs. Distance graph

67
13 Results and Recommendations
May 19, 2011 Simav earthquake occurred on the northwest of the Gediz Graben which is part of the West Anatolian expansion regime. This region, Simav Fault Zone, is surrounded by active faults with a West-Nortwest – East-Southeast directivity. The aftershocks, with depths mainly in the range of 5-10km, are distributed on a 30km length area parallel to the faults. A surface rupture was not observed during the field survey. The energy dissipation of the aftershocks recorded during the period of 40 days since the main shocks totals to an amount equivalent to the energy released during a magnitude Ms 5.4 event. The estimated intensity (Io=VI-VII), obtained from equations taking into account the magnitude and ground motion parameters, is found to be in good agreement with the field surveys. Using ground motion distributions generated using the ELER software (KRDAE, 2009), the peak ground motion has been estimated to be around 0.10g in the vicinity of the epicenter. Recordings obtained from stations close to the epicenter are found to be in good agreement with these estimations. Stations 4304 and 4305 have recorded peak ground motion values of 0.10g and 0.09 respectively. Right after the earthquake, the intensity distribution and the building inventory of the region have been utilized in the ELER software in order to estimate the building damages (D1= 9741, D2= 1592, D3= 208, D4= 14 and D5= 0). During site investigation, building types and building damages are evaluated based on European Macroseismic Scale, EMS-98. According to this preliminary damage assessment, it is observed that 60% of the 4-5 story RC buildings, which compose the majority of the building stock as presented in previous sections, are exposed to slight structural damage and moderate non-structural damage, of which corresponds to grade 2. Very few number of buildings have damage grade 3, meaning moderate structural and heavy non-structural damage. Once the buildings, exposed to structural damage, are investigated, reasons of structural damage can be summarized as; lack of earthquake resistant design principles, insufficient labor and material quality. Since considerable part of the building stock has these deficiencies, under more severe earthquakes, extensive moderate or heavy structural damage will be most likely.
Acknowledgements The authors would like to express their gratitude to Prof. Dr. Mustafa ERDİK, Director of B.U. KOERI, Dr. Doğan KALAFAT, Director of NEMC and Dr. Kıvanç KEKOVALI, Assistant Director of NEMC for their contribution and support during field investigation and the preparation of this report, and also to Kenan ÇİFTÇİ, governor of Kutahya Province, Mustafa İNGENÇ, assistant governor of Kutahya Province, Yüksel ÜNAL, governor of Simav district, Kasım KARAHAN, major of Simav municipality for their logistics support and hospitality.

68
References Doğan, A. ve Emre, Ö., 2006, Ege Graben Sistemi’nin Kuzey Sınırı: Sındırgı-Sincanlı Fay Zonu. 59. Türkiye Işık, V. (2004), “Kuzey Menderes Masifinde Simav Makaslama Zonunun Mikro-tektonik Özellikleri, Batı Anadolu, Türkiye”, Türkiye Jeoloji Bülteni, Cilt 47, Sayı 2, Ağustos 2004. Abrahamson, N. A., and W. J. Silva (1997), Empirical Response Spectral Attenuation Relations for Shallow Crustal Earthquakes, Seismological Research Letters, 68(1), 94-127. Boore, D. M. and G. M. Atkinson (2008). Ground-motion prediction equations for the average horizontal component of PGA, PGV, and 5%-damped PSA at spectral periods between 0.01 s and 10.0 s, Earthquake Spectra 24 Wald, D.J., Quitoriano, V., Heaton, T.H., and Kanamori, H., 1999b, Relationship between Peak Ground Acceleration, Peak Ground Velocity, and Modified Mercalli Intensity in California: Earthquake Spectra, v. 15, no. 3, p. 557-564. Boore, D. M., W. B. Joyner, and T. E. Fumal (1997), Equations for estimating horizontal response spectra and peak acceleration from western North American earthquakes: A summary of recent work, Seismological Research Letters, 68(1), 128-153. Campbell, K.W. and Bozorgnia, Y.(2008). NGA ground motion model for the geometric mean horizontal component of PGA, PGV, PGD and 5% damped linear elastic response spectra for periods ranging from 0.01 to 10 s. Earthquake Spectra, 24:139. Chiou, B.S.J. and Youngs, R.R. (2008) An NGA model for the average horizontal component of peak ground motion and response spectra. Earthquake Spectra, 24:173. Çeken U., Beyhan G. ve Gülkan P. (2008). Kuzeybatı Anadolu Depremleri için Kuvvetli YerHareketi Azalım İlişkisi, 18. Uluslararası Jeofizik Kongre ve Sergisi, Vol:3B14, ss:1-4,Maden Tetkik ve Arama Genel Müdürlüğü, Kültür Sitesi, Ankara, 14-17 Ekim. Kalkan E. Gülkan P (2004). Empirical Attenuation Equations for Vertical Ground Motion in Turkey, Earthquake Spectra, Vol. 20, No. 3, pp. 853-882. Sadigh, K., C. -Y. Chang, J. A. Egan, F. Makdisi, and R. R. Youngs (1997), Attenuation relationships for shallow crustal earthquakes based on California strong motion data, Seismological Research Letters, 68(1), 180-189. Eyidoğan; H., U. Güçlü; Z. Utku, E. Değirmenci (1991). Türkiye büyük Depremleri Makro-sismik Rehberi (1900-1988), İTÜ MF Jeofizik Müh. Bölümü Yayınları s.200. Campbell, K. W., and Bozorgnia, Y., 2008. Campbell-Bozorgnia NGA horizontal ground motion model for PGA, PGV, PGD and 5% damped linear elastic response spectra, Earthquake Spectra 24, 139–171 ELER, Earthquake Loss Estimation Routine, Technical and User Manuals V2.0, Bogazici University, KOERI, Earthquake Engineering Department, 2010

69
European Macroseismic Scale, EMS-98, European Seismological Commission, Subcommission on Engineering Seismology, Working Group Macroseismic Scales, Luxembourg, 1998 Samardjieva, E. and J. Badal, 2002. Estimation of the expected number of casualties caused by strong earthquakes. Bulletin of the Seismological Society of America, 92 (6), pp. 2310-2322, Aug 2002 İpek, M. Z. Uz ve U. Güçlü (1965). Sismolojik donelere göre Türkiye’de deprem bölgeleri, Ankara. Soysal, H., S. Sipahioğlu, D. Kolçak, Y. Altınok (1981). Türkiye ve Çevresinin Tarihsel Deprem Kataloğu, TUBİTAK Proje No: TBAK 341, 87s., İstanbul. Afet ve Acil Durum Yönetimi Başkanlığı web sitesi, www.afetacil.gov.tr MTA Genel Müdürlüğü web sitesi 1.500 000 Ölçekli Jeoloji haritası European Macroseismic Scale, EMS-98, European Seismological Commission, Subcommission on Engineering Seismology, Working Group Macroseismic Scales, Luxembourg, 1998