Embed Size (px)
Citation preview

May 19, 1999 1
Tutorial on Parallel Debuggers
Shirley [email protected]
University of Tennessee/Innovative Computing Laboratory
http://icl.cs.utk.edu/ARL MSRC Programming Tools PET
http://www.arl.hpc.mil/

May 19, 1999 2
Debuggers Available for MSRC Platforms
• Etnus TotalView - Origin 2000, IBM SP,Sun E10000
• Cray TotalView - Cray T3E
• SGI dbx, cvd - Origin 2000
• IBM pdbx, pedb - IBM SP
• Sun Prism - Sun E10000
• For more information:– http://www.arl.hpc.mil/RIB/repositories/PRG/catalog/
– http://www.nhse.org/rib/repositories/cewes_spp_tools/catalog/
May 19, 1999 3
Etnus TotalView
URL http://www.etnus.com/
Version 3.8, October 1998
Platforms IBM RS6000/SP, SGI IRIX, DECAlpha, Sun Solaris and SunOS
Languages/librariessupported
C, C++, Fortran 77/90, HPF,PVM, MPI
May 19, 1999 4
Etnus TotalView Features• Graphical user interface• Handles multiprocess multithreaded programs• Remote and distributed debugging (homogeneous
platforms only)• Automatic process acquisition for MPI, PVM, PGI
HPF, IBM PE• Capability of attaching to running processes• Can debug code not compiled with -g (but with
reduced capabilities)

May 19, 1999 5
Etnus TotalView Features (cont.)
• Load and examine core files
• Breakpoints and evaluation points
• Examine and change data
• Signal handling
• Message state display (new in version 3.8)
• No command-line interface
• Selected as the DOE ASCI debugger
May 19, 1999 6
Special Features for Multiprocess Programs
• Separate window for each process• Sharing of breakpoints among processes• Control of process groups for SPMD or MPMD
programs• Multiprocess barrier breakpoints• Single-stepping of process groups• Handles multiple symbol tables if more than one
executable

May 19, 1999 7
Starting TotalView% totalview [filename [corefile]] [options]
totalview Starts TotalView withoutloading a program or core file.You can then load a program byissuing the New ProgramWindow (n) command.
totalview filename Starts TotalView and loads theprogram specified by filename.
totalviewfilename corefile
Starts TotalView and loads theprogram specified by filenameand the core file specified bycorefile.
totalviewfilename –a args
Starts TotalView and passesarguments specified by args toprogram specified by filename.

May 19, 1999 8
Starting TotalView (cont.)
• To start an SGI MPI program under TotalView: %totalview mpirun -a <mpirun command line>
• TotalView starts up and shows you the code for mpirun. You should let the program run by using the Go Process (g) command.
• mpirun executes and starts the MPI processes. TotalView acquires them and asks if you want to stop them at startup.

May 19, 1999 9
TotalView Windows

May 19, 1999 10
TotalView Windows
Root window Lists process and thread information
Process window Displays stack trace, stack frame, andsource code for the selected thread ina process
Process groupwindow
Displays process groups formultiprocess programs
Variable window Displays address, data type, andvalue of local variable, register, orglobal variable (or the values storedin a block of memory)
May 19, 1999 11
Loading Executables
• If you did not lead an executable when starting TotalView, you can load one using the New Program Window (n) command, which causes a dialog box to appear into which you can enter the name of executable.
• If you use the New Program Window command to load the same executable again, TotalView does not reread the executable but reuses the existing symbol table. To make TotalView reread the executable, use the Reload Executable File command.

May 19, 1999 12
New Program Window Dialog Box

May 19, 1999 13
Reloading a Recompiled Executable
• To reload an updated program without existing from Totalview:– Confirm that the current process has exited. If it
has not, display the Arguments/Create/Signal submenu from the process window and select Delete Program (^Z).
– Confirm that duplicate copies of the process do not exist by using the ps command. If duplicate processes exist, delete them using the kill command.

May 19, 1999 14
Reloading (cont.)
– Recompile your program.– Display the Arguments/Create/Signal
submenu from the process window and select the Reload Executable File command.
– TotalView updates the process window with the new source file and loads a new executable file.
May 19, 1999 15
Attaching to Processes
• You can attach to single processes, multiprocess programs, and remote processes.
• To attach to a process, use either the Show All Unattached Processes (N) or New Program Window (n) commands.
May 19, 1999 16
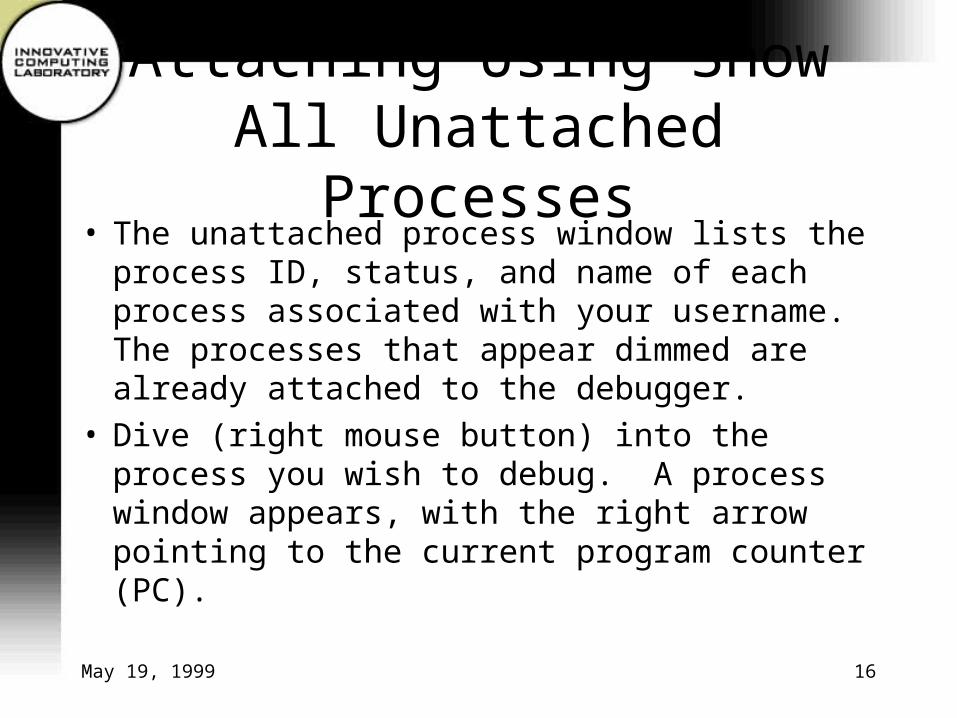
Attaching Using Show All Unattached Processes
• The unattached process window lists the process ID, status, and name of each process associated with your username. The processes that appear dimmed are already attached to the debugger.
• Dive (right mouse button) into the process you wish to debug. A process window appears, with the right arrow pointing to the current program counter (PC).

May 19, 1999 17
Unattached Processes Window

May 19, 1999 18
Attaching to an SGI MPI job
• To attach to a running SGI MPI job, you should attach to the mpirun process that started the job.
• TotalView attaches to the mpirun process and asks if you wish to attach to the slave MPI processes. If you select Yes, TotalView acquires all the MPI processes.

May 19, 1999 19
Detaching from Processes• You can detach from any processes to which you
have attached. • If you want to send the process a signal, select the
Set Continuation Signal command from the process window menu and choose the signal that TotalView should send to the process when it detaches from it. For example, to detach from a process and leave it stopped, set the continuation signal to SIGSTOP.
• Display the Arguments/Create/Signal menu from the process window and select Detach from Process.
May 19, 1999 20
Handling Signals
• If your program contains a signal handler, you may need to adjust the default way TotalView handles signals. To do so, display the Arguments/Create/Signal menu from the process window and select Set Signal Handling Mode.

May 19, 1999 21
Dialog Box for Set Signal Handling Mode Command
Note: The set of signal names and numbers shown in this dialog box are platform-specific.

May 19, 1999 22
Signal Handling Modes
Error Stops the process, places it in the error state, anddisplays an error in the title bar of the processwindow.
Stop Stops the process and places it in the stoppedstate. Select this signal handling mode if youwant the signal to be handled like SIGSTOP.
Resend Sends the signal to the process. If your programcontains a signal handling routine, use this modefor all signals that it handles.
Discard Discards the signal and restarts the processwithout a signal. Don’t use Discard mode forfatal signals, such as SIGSEGV and SIGBUS, orthe debugger can get caught in a loop.

May 19, 1999 23
Setting Search Paths• If you source code and executable files reside in a
number of different directories, you can set search paths for those directories using the Set Search Directory (d) command.
• By default, TotalView searches the following directories in order:
1. The current working directory (.)
2. The directories you specify with the Set Search Directory command, in the order you enter them in the dialog box.
3. If you specified a full pathname for the executable when you started TotalView, the directory specified.
4. The directories specified in your PATH environment variable.

May 19, 1999 24
Process/thread States
• Process and thread states are displayed in:– the root window, for processes and threads– the unattached processes window, for processes– the process and thread status bars of the process
window, for processes and threads– the thread list pane of the process window, for
threads

May 19, 1999 25
Possible Process/thread States(attached processes)
Exited ornever created
Blank Process only: does not exist.
Running R Thread: is running or can run.Process: all threads are runningor can run.
Mixed M Process only: some threads arerunning and some are notrunning.
Error <reason> E Thread: stopped because of errorreason.Process: one or more threads arein the Error state.
May 19, 1999 26
Possible Process/thread states (attached processes) (cont.)
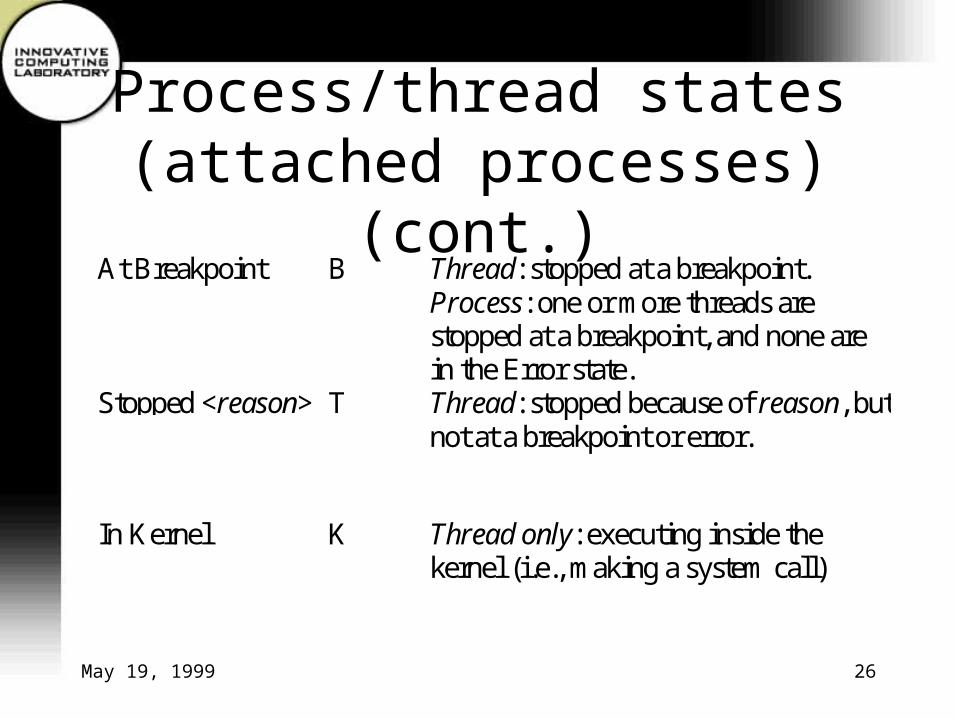
At Breakpoint B Thread: stopped at a breakpoint.Process: one or more threads arestopped at a breakpoint, and none arein the Error state.
Stopped <reason> T Thread: stopped because of reason, butnot at a breakpoint or error.
In Kernel K Thread only: executing inside thekernel (i.e., making a system call)

May 19, 1999 27
Possible Process/thread states(unattached processes)
Running R Process is running or can run.
Stopped T Process is stopped.
Idle I Process has been idle or sleeping formore than 20 seconds.
Sleeping S Process has been idle or sleeping forless than 20 seconds.
Zombie Z Process is a “zombie”, a child processthat has terminated and is waiting forits parent process to gather its status.

May 19, 1999 28
Process Window
May 19, 1999 29
Process Window Details
• Stack trace pane
• Stack frame pane
• Source code pane
• Thread list pane
• Action points pane
May 19, 1999 30
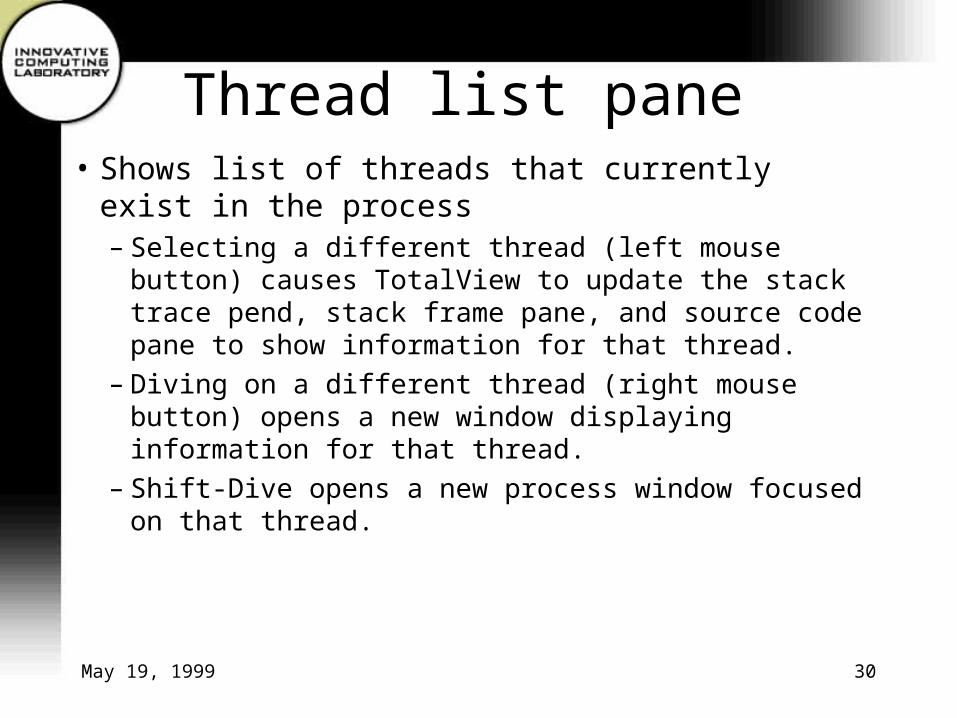
Thread list pane• Shows list of threads that currently exist in the
process– Selecting a different thread (left mouse button) causes
TotalView to update the stack trace pend, stack frame pane, and source code pane to show information for that thread.
– Diving on a different thread (right mouse button) opens a new window displaying information for that thread.
– Shift-Dive opens a new process window focused on that thread.

May 19, 1999 31
Thread IDs
• Thread ID in root window and thread list pane is in the format tid/systid.
• tid is the TotalView-assigned logical thread ID
• systid is the system-assigned thread id
• In other windows, TotalView uses the format pid.tid to identify threads within a process.

May 19, 1999 32
Stack trace pane
• Shows call stack of routines executed by the selected thread
• Move up and down call stack by selecting desired routine (i.e., stack frame)
• Selecting a different stack frame causes TotalView to update the stack frame pane and source code pane to show information for the selected routine.
May 19, 1999 33
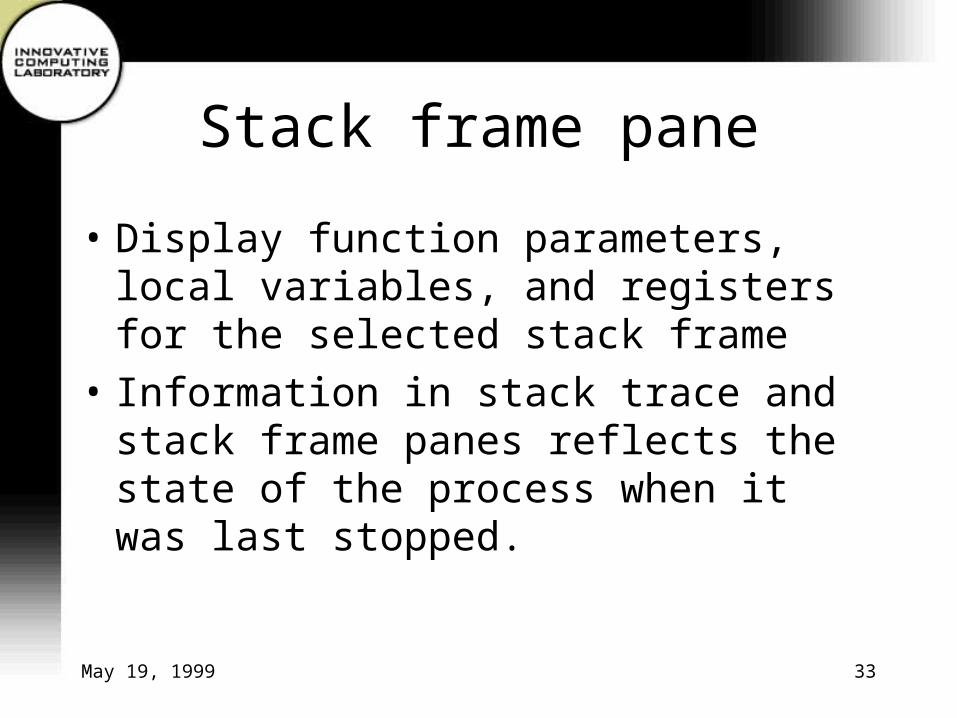
Stack frame pane
• Display function parameters, local variables, and registers for the selected stack frame
• Information in stack trace and stack frame panes reflects the state of the process when it was last stopped.

May 19, 1999 34
Source code pane• Shows source code for selected thread• Tag field to left contains line numbers.• Set breakpoint at any line that generated object
code, indicated by boxed line number.• Arrow in Tag field indicates current location of
program counter (PC) for selected thread.• Display source code for a given file or function by
using the Function or File (f) command.• Return to executing line of code for current stack
frame by using Current Stackframe (c) command.

May 19, 1999 35
Action points pane
• The action points pane shows the list of breakpoints and evaluation points for the process.
• If you dive (right mouse button) into an action point in the list, TotalView displays the line of source code containing the action point in the Source code pane.

May 19, 1999 36
Process/thread Navigation
• Only one process window is open initally.• Selecting a process in the Root Window causes
TotalView to find a process window for that process, or replace the contents of an existing process window with information for the selected process.
• Diving on a process in the root window causes TotalView to find or open a new process window for that process.

May 19, 1999 37
Process/thread Navigation (cont.)• Shift-Dive forces TotalView to open a new
process window for the dived-on process.• Use navigation buttons in upper corner of process
window to move up and down the process or thread list, or to go back to the previous contents of the process window.
• Whenever the process and/or thread is replaced in a process window, the previous contents are pushed onto a stack. Use the Go Back button to pop the stack.
May 19, 1999 38
Process/Thread Handling
• thread - task with an execution context
• process - address space or computer memory capable of running one or more threads
TotalView support for processes and threads is operating system dependent.

May 19, 1999 39
OS-dependent Characteristics of Process/Thread Control
• Synchronous vs. asynchronous stop– synchronous -- when one thread stops, they all stop.
– Asynchronous -- only the thread that encounters the stop condition stops.
• Synchronous vs. asynchronous run– synchronous -- when one thread runs, they all must run.
– Asynchronous -- only the thread that wants to run need run.
May 19, 1999 40
OS-dependent Characteristics (cont.)
• Atomic run - some OS’s allow the debugger to atomically continue a set of threads in a single operation.
• Read/write while running - some OS’s allow the debugger to read from (and possibly write to) a process while one or more threads are running.
• Multithreaded signal delivery - some OS’s allow the debugger to continue individual threads with their own signal values.

May 19, 1999 41
Controlling Program Execution
May 19, 1999 42
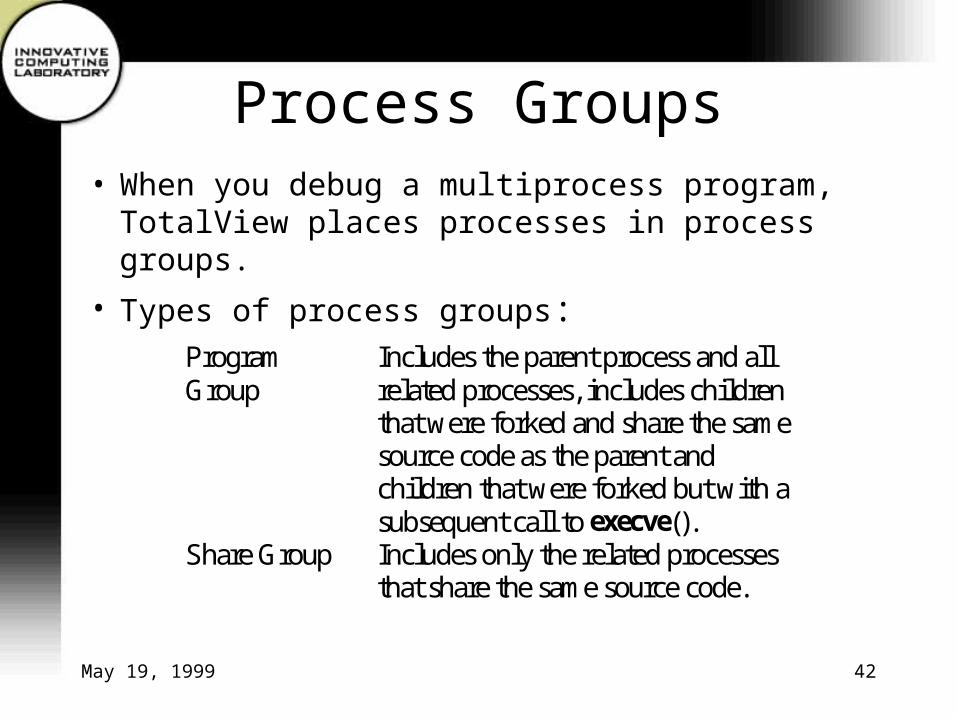
Process Groups• When you debug a multiprocess program,
TotalView places processes in process groups.
• Types of process groups:ProgramGroup
Includes the parent process and allrelated processes, includes childrenthat were forked and share the samesource code as the parent andchildren that were forked but with asubsequent call to execve().
Share Group Includes only the related processesthat share the same source code.

May 19, 1999 43
Process Groups (cont.)
• The parent process is named after the source program.
• Child processes that were forked have the same name as the parent, but with a numerical suffix (.n).
• Child processes that call execve() after they were forked have the parent’s name, the name of the new executable in angle brackets, and a numerical suffix.

May 19, 1999 44
Process Groups Window
Single Process Group Window

May 19, 1999 45
Starting Processes and Threads
• The following commands are available from a process window:– Go Process (g) creates and starts this process.
Resumes execution if the process is not being held and is stopped or at a breakpoint. Starting a process causes all threads in the process to resume execution.

May 19, 1999 46
Starting Processes and Threads (cont.)
– Go Group (G) creates and starts this process and all other proesses in the program group. Resumes execution and the execution of all process in the program group if the process is not being held and is stopped or at a breakpoint. Issuing Go Group on a process that is already running starts the other members of the program group.

May 19, 1999 47
Starting Processes and Threads (cont.)
– Go Thread (^G) starts this thread. Disabled if asynchronous run is not available.
May 19, 1999 48
Single Step Commands
• TotalView supports single stepping commands that allow you to do the following:– Execute one source line or machine instruction at
a time.
– Step over or into function calls.
– Run to a selected line that is a temporary breakpoint.
– Run until a function call returns.

May 19, 1999 49
Single Step Commands (cont.)
Step Executes the current line.
Next Executes the current line and steps overany function calls.
Run (toselection)
Executes from the line at the PC to a lineof code that is selected in the source codepane.
Run (out offunction)
Executes to the end of the current function.The PC stops at the instructionimmediately after the one that called thecurrent function.

May 19, 1999 50
Single Step Commands (cont.)
• To cancel a single step in progress, position the mouse pointer in the process window and press CTRL-C.

May 19, 1999 51
Single-Thread Single-Step Commands
• Single thread, single step commands include the menu keyword Thread.
• Single-thread operations can fail if they depend on the input or output of a thread that is not running.
• Single-thread commands are operable only on the Sun4 OS Sun5 OS, Alpha Digital UNIX, and AIX operating systems.
May 19, 1999 52
Group Single Step Commands
• Operate on a process group.• At command start, TotalView identifies processes
and threads that are similar to the primary process and thread. These processes form a step group; TotalView steps this group and stops only when all its members come to the command stopping point.
• Similar processes are in the same share group and have at least one thread with a PC that matches the PC of the primary thread.

May 19, 1999 53
Breakpoints
• To set a breakpoint, select a boxed line number in the source code pane of a process window. A boxed line number indicates that the line generated executable code. A STOP icon indicates that a breakpoint is set on the line. Selecting the STOP deletes the breakpoint.
• To see which processes are stopped at a breakpoint, select the PC Arrow line in the source code pane. TotalView dims the process ID in the root window if a process is not at the breakpoint.

May 19, 1999 54
Setting the Program Counter
• To resume execution of a thread at some statement other than the one where it stopped, you can reset the value of the program counter (PC). For example, you might want to:– skip over some code
– execute some code again after changing certain variables
– restart a thread that is in an error state

May 19, 1999 55
Setting the Program Counter (cont.)
• To set the PC to a selected line:– Select the line in the source code pane.– Select the Set PC to Selection… (p) command
from the Go/Halt/Step/Next/Hold submenu in the process window.

May 19, 1999 56
Stopping Processes and Threads
• To stop a process or thread, use one of the following commands from the process window:– Halt Process (h)– Halt Group (H)– Halt Thread (^H)
• Use the Update Process Info (u) command to update process information without stopping the process.
May 19, 1999 57
Holding and Releasing Processes• When a process is held, any command that would
otherwise cause the process to run has no effect.
• Manual hold and release are useful in the following cases:
– if you wish to run a subset of the processes, you can manually hold all but the ones you want to run.
– If a process is held at a process barrier point and you want to run it without first running all the other processes in the group to that barrier, you can release it manually and then run it.

May 19, 1999 58
Holding and Releasing Processes (cont.)
• You can toggle the hold/release state of a process by using the Hold/Release Process (w) command from the Go/Halt/Stop/Next/Hold submenu.
• You can hold an entire group by choosing the Hold Group command.
• You can release the group by choosing Release Group.
May 19, 1999 59
Deleting Processes
• Display the Arguments/Create/Signal submenu and select the Delete Program (^Z) command.
• If the process is part of a multiprocess program, TotalView deletes all related processes as well.
May 19, 1999 60
Restarting Processes
• You can use the Restart Program command to reinitialize a program that is running or one that is stopped but has not exited.
• If the selected process is part of a multiprocess program, TotalView deletes all related processes and restarts the program.

May 19, 1999 61
Setting Action Points

May 19, 1999 62
TotalView Action Points
• A breakpoint stops execution of processes and threads that reach it.
• A process barrier breakpoint holds each process that reaches it until all processes in the group reach it.
• An evaluation point causes a code fragment to execute when it is reached.

May 19, 1999 63
Action Point Numbers
• Assigned to breakpoints, process barrier breakpoints, and evaluation points.
• Appear in– Root window– Action points pane of Process window– Action points dialog box

May 19, 1999 64
Setting Breakpoints
• You typically set breakpoints before starting processes.
• To set a source-level breakpoint, select a boxed line number in the Tag field of the Source code pane. This causes a STOP sign to appear and the breakpoint to be listed in the Action points pane.
• To delete a breakpoint, select the STOP sign.
May 19, 1999 65
Setting Breakpoints (cont.)
• You can set (delete) a breakpoint while a process is running. (TotalView stops the process temporarily to insert the breakpoint and then continues running it).
• Set (delete) a breakpoint at the beginning of a specific function by typing ^B, which brings up a dialog box in which you can enter the function name.
May 19, 1999 66
Breakpoints for Multiple Processes• By default, a breakpoint is shared by all processes
in the share group (same executable).• By default, all processes that share a breakpoint
continue running until each reaches the breakpoint (different from what the TotalView User’s Guide says!)
• To change multiprocess options for a breakpoint, use the action point options dialog box.
• To change defaults, use Xresources or command line options (see the TotalView User’s Guide for details).

May 19, 1999 67
Evaluation Points
• Point where TotalView evaluates a code fragment.• Recommended to stop a process before setting an
evaluation point.• Can define an evaluation point at any source line
that generates executable code (marked with boxed line number in Tag field). Code fragment is executed before that line is executed.
• Code fragment can be written in Fortran or C (or assembler on Digital UNIX or AIX systems).

May 19, 1999 68
Evaluation Points (cont.)• Code fragment can include a branching instruction
(e.g., GOTO in C or Fortran).• Code fragment can contain special TotalView
built-in statements (e.g., to define breakpoints, process barrier points, or countdown breakpoints within the code fragment).
• TotalView evaluates code fragments in the context of the target program, which means you can refer to program variables and pass control to points in the target program.

May 19, 1999 69
Evaluation Points (cont.)
• Evaluation points do not permanently modify the source program nor do they create a permanent patch in the executable.
• If you save evaluation points to a file, TotalView can reapply them when you start a debugging session for that program.
• See the TotalView User’s Guide for details on what C and Fortran constructs are supported.

May 19, 1999 70
To set an evaluation point:
1. Dive (right mouse button) into the tag field for the instruction. TotalView displays the action points dialog box.
2. Select the EVAL button.
3. Select the button for the language you want to use to write the code fragment.
4. Select the evaluation text box and enter the code fragment.
5. Set options for multiprocess breakpoints if applicable.
6. Select the OK button to confirm..
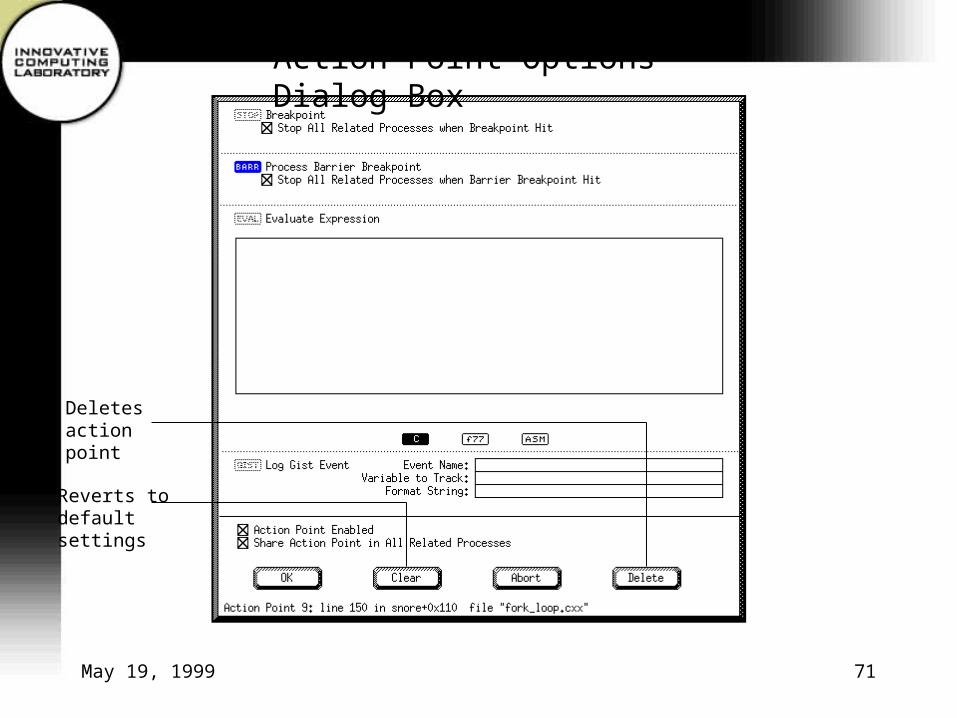
May 19, 1999 71
Action Point Options Dialog Box
Deletes action point
Reverts to default settings

May 19, 1999 72
Conditional Breakpoints
• By using evaluation points with TotalView intrinsic variables and built-in statements, you can define conditional breakpoints, including thread-specific breakpoints. For example,
- To define a breakpoint that is reached whenever variable i is greater than 20 but less than 25:
if (i>20 && i<25) $stop;

May 19, 1999 73
Conditional Breakpoints (cont.)
• Examples (cont.)
- To define a breakpoint that is reached every 10th time the $count statement is executed:
$count 10
- To cause thread 3 to stop when it evaluates this expression:
if ($tid == 3) $stop;

May 19, 1999 74
Example of Patching Incorrect Code
1 int check_for_error (int *error_ptr)
2 {3 *error_ptr = global_error;4 global_error = 0;5 return (global_error);6 }
Set an evaluation point on line 3 and specify the following code fragment:
if (error_ptr == NULL) goto 5;

May 19, 1999 75
Example of Patching in a Function Call
In the preceding example, patch in a printf statement that displays global _error. To do this, create an evaluation point on line 4 and specify the following code fragment:
printf (“global_error is %d\n”, global_error);

May 19, 1999 76
Process Barrier Breakpoint
• Stops each process in a group when the process reaches the process barrier point and holds each process until all processes in the group reach the barrier point.
• A process that is held at a barrier point cannot go forward until all processes in its group are at the barrier point, unless you release the process manually by using the Hold/Release Process (w) command.

May 19, 1999 77
Process Barrier Breakpoint (cont.)
• When all processes in the group have reached the barrier point, TotalView releases them from the held state, but they remain stopped until you take action on them.
• To set a process barrier breakpoint with the mouse, move the mouse to the line number where you want to set the barrier point and do Shift-Select. A BARR sign will appear.
• Or dive on the line number and use the Action Points options dialog box to set the barrier point.

May 19, 1999 78
Evaluating Expressions
• To evaluate an expression in the context of a particular process:
1. Use the Open Expression Window (e) command from the Process window.
2. Select the button for the language you wish to use.
3. Select the Expression box and enter the code fragment to be evaluated.
4. Select the Eval button.
The last statement in the code fragment can be a free-standing expression.
May 19, 1999 79
Evaluating Expressions (cont.)• Because code fragments are evaluated in
the context of the target process,– stack variables are evaluated according to the
currently selected stack frame,– assignment statements can affect the state of the
target process because they can change the value of a variable in the target process.
• See the TotalView User’s Guide for details on what C and Fortran constructs are supported.

May 19, 1999 80
Sample Expression Window
May 19, 1999 81
Examining and Changing Data

May 19, 1999 82
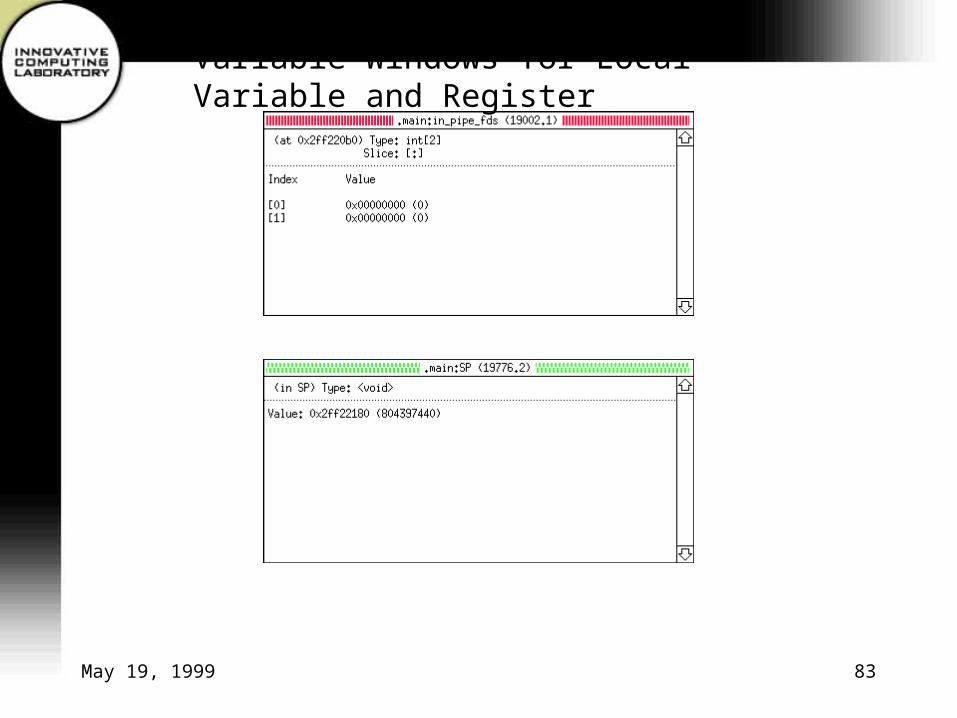
Displaying Local Variables and Registers• In the stack frame pane of the process window, dive into any
parameter, local variable, or register to display a variable window, or• Dive into any parameter or local variable in the source code pane, or • Use the Variable (v) command.• The variable window displays the name, address, data type, and
value for the object.• If you keep the variable window open while you continue to run the
process or thread,• TotalView updates the information whenever the process or thread
stops.
May 19, 1999 83
Variable Windows for Local Variable and Register
May 19, 1999 84
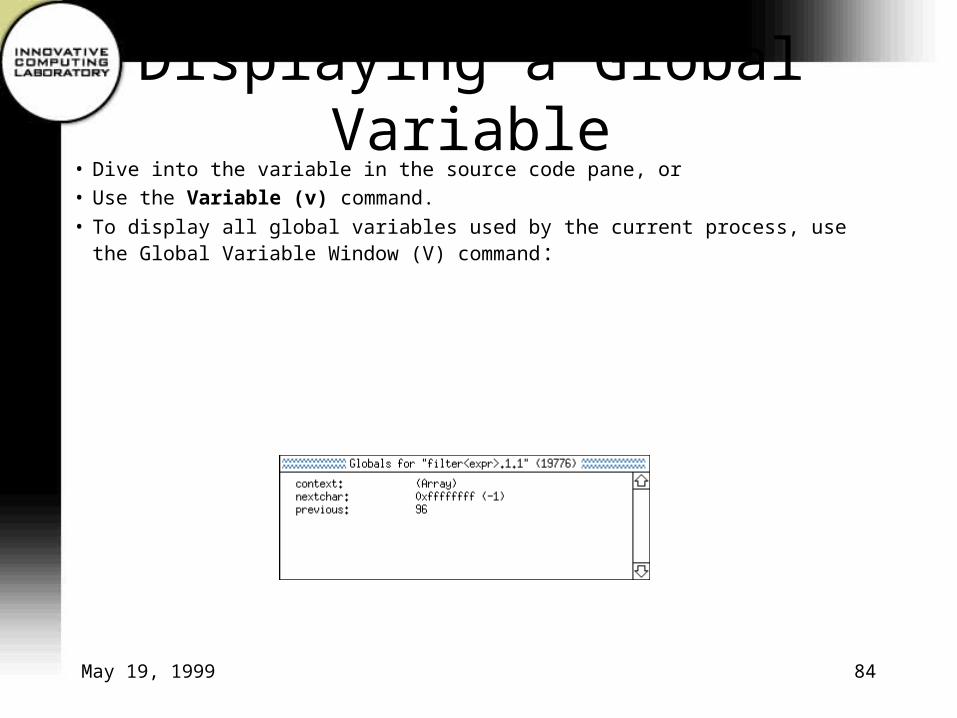
Displaying a Global Variable• Dive into the variable in the source code pane, or
• Use the Variable (v) command.
• To display all global variables used by the current process, use the Global Variable Window (V) command:

May 19, 1999 85
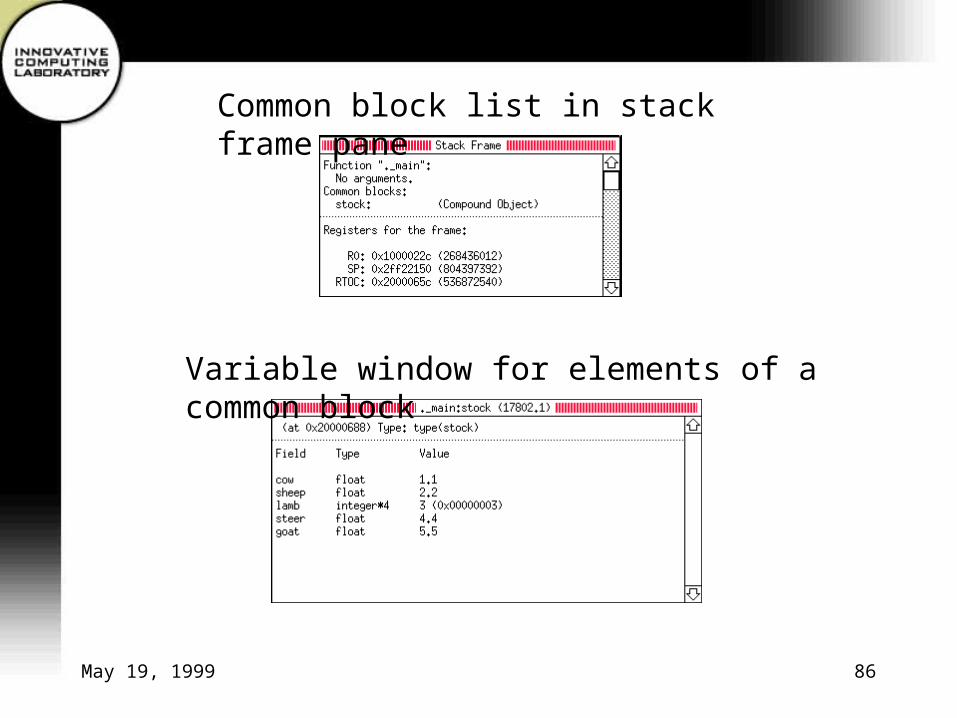
Displaying Fortran Common Blocks• Names of common block members have function
scope, not global scope.• Stack frame pane in process window displays the
name of each common block for a function.• Diving on a common block name in the stack
frame pane causes TotalView to display the entire common block in a variable window.
• Diving on a common block member name causes TotalView to search all common blocks for a matching member name and display the member in a variable window.
May 19, 1999 86
Common block list in stack frame pane
Variable window for elements of a common block

May 19, 1999 87
Diving in Variable Windows
• If the variable in a variable window is a pointer, structure, or array, you can dive into the contents. This additional dive is called a nested dive, and it replaces the original variable window contents with the new information but save the original contents on a stack.
• To “undive” from a nested dive, click the Dive (right) mouse button on the undive icon.

May 19, 1999 88
Nested Dive
Base window
First dive on the variable node_t*, a pointer
Nested window
Second dive on the value of node_t*

May 19, 1999 89
Displaying Areas of Memory• You can display areas of memory in hexadecimal
and decimal by using the Variable (v) command and entering either a hexadecimal address or a range of hexadecimal addresses in the dialog box.

May 19, 1999 90
Changing the Values of Variables
• You can change the value of any variable or the contents of any memory location as follows:– Select the value and use the editor to change the
value.– Press Return to confirm.
May 19, 1999 91
Changing the Data Type of a Variable
• The data type that you declared for a variable determines its format and size in the variable window.
• You can change how a data item is displayed by editing the data type.
• If the window contains a structure with fields, you can edit the types of the individual fields.
• You can use either the TotalView built-in type strings (User’s Guide, p. 165) or C cast syntax.
May 19, 1999 92
Changing the Data Type Example
For example, in
int *p = malloc(sizeof(int) * 20);
TotalView doesn’t know that p points to an array of integers. To display the array,
1. Dive on the variable p of type int*.
2. Change its type to int[20]*.
3. Dive on the value of the pointer to display the array.

May 19, 1999 93
Displaying Fortran 90 Modules and Functions• TotalView attempts to display the full module data
definition in the list of modules displayed in the stack frame pane.
• To display a list of all the modules TotalView knows about, use the Fortran Modules Window (M) command.
• TotalView uses the syntax modulename`functionname for a function from a module.
• TotalView uses the syntax parentfunction()`containedfunction for a contained function.
May 19, 1999 94
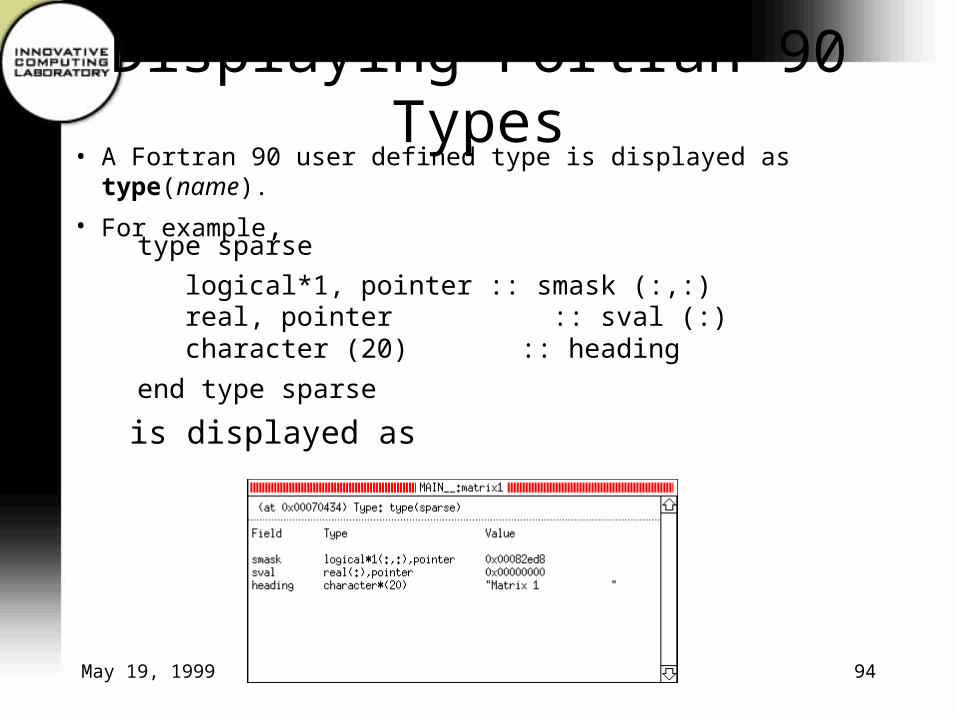
Displaying Fortran 90 Types• A Fortran 90 user defined type is displayed as type(name).
• For example,type sparse
logical*1, pointer :: smask (:,:) real, pointer :: sval (:) character (20) :: heading
end type sparse
is displayed as

May 19, 1999 95
F90 Deferred Shape Array Type• When TotalView displays the data for a deferred
shape array, it displays both the type used in the definition of the variable, and the actual type that the instance has.
• For example the type of a deferred shape rank 2 array of REAL data with runtime lower bounds of -1 and 2 and upper bounds of 5 and 10 would be shown as follows:
Type: real(:,:)Actual Type: real(-1:5,2:10) Slice: (:,:)

May 19, 1999 96
F90 Pointer Type
• TotalView displays Fortran 90 pointer types as type,pointer, which is the syntax used in Fortran 90 to create a pointer variable.
• To view the data itself, you must dive on the pointer value.
• For example, the type of a pointer to a rank 1 deferred shape array of real data would be displayed as
Type: real(:),pointer

May 19, 1999 97
F90 Pointer Type (cont.)
• The value of the pointer is displayed as the address of the data to which the pointer points, which is not necessarily the array element with the lowest address in the case of a pointer to an array.
• TotalView implicitly handles any slicing operations it uses to set up a pointer, or an assumed shape subroutine argument, so that the indices and values which it displays are the same as you would see in the Fortran code.

May 19, 1999 98
F90 Pointer Type (cont.)• For example, in the code
integer, dimension(10), target :: iainteger, dimension(:), pointer :: ipdo i = 1,10 ia(i) = iend doip => ia(10:1:-2)
after diving on the pointer value, ip displays as follows:
ip at 0x140000484) Type: integer*4(:) Actual Type: integer*4(5)--------------------------------------------------------Index Value(1) 10 (0x0000000a)(2) 8 (0x00000008)(3) 6 (0x00000006)(4) 4 (0x00000004)(5) 2 (0x00000002)

May 19, 1999 99
Displaying Array Slices• TotalView can display subsections of arrays,
called slices.• Every variable window that displays an array
contains a Slice field which you can edit to view subsections of the array.
• A slice description consists of lower_bound:upper_bound:stride
• For multidimensional arrays, you can specify a slice for each dimension using the following syntax:
C and C++ [slice][slice]Fortran (slice,slice,…)

May 19, 1999 100
Displaying Array Slices (cont.)
• You can use the stride of a slice either to skip elements or to invert the order in which array elements are displayed.
• When you use the Variable(v) command to display an array in a variable window, you can include a slice expression as part of the variable name. TotalView then initializes the slice field in the variable window to the slice descriptions that you specify.

May 19, 1999 101
Slice displaying the four corners of an array
Fortran array with inverse order and limited extent
May 19, 1999 102
Displaying “Laminated” Variables
• To display the value of the same variable in all processes of a parallel program, first bring up a variable window for the variable in one of the processes. Then use the Toggle Laminated Display (L) command from the data pane to display the value of the variable in all the processes.
• To display the value of a variable in all threads within a single process, use the Toggle Thread Laminated Display (l) command.

May 19, 1999 103
“Laminated” Variables (cont.)
• For example, the following is a display of the scalar variable rank in each of four processes of an MPI code:
main:rank (Laminated)(at 0x11ffff810) Type: int-------------------------------Process Valueflood.0 0x00000000 (0)flood.1 0x00000001 (1)flood.2 0x00000002 (2)flood.3 0x00000003 (3)

May 19, 1999 104
“Laminated” Variables (cont.)• If a corresponding variable cannot be found for a
process/thread, then “Has no matching call frame” is displayed for the value of the variable for that process/thread.
• If the variables are at different addresses in different processes/threads, then the address for each process/thread is displayed.
• If you dive through a pointer in a laminated data pane, the dive will apply to the appropriate pointer in each process/thread.
• If you update a value in a laminated data pane, you will be asked whether you want the update to apply to all the processes/threads or just the one you selected.

May 19, 1999 105
Visualizing Array Data
• The TotalView Visualizer works with the TotalView debugger to create graphic images of array data.
• The Visualizer can be launched by TotalView, or it can be run from the command line to visualize data dumped to a file.
• You can send data from TotalView to a third party visualizer or write you own visualizer program.
May 19, 1999 106
Launching the Visualizer
• By default, TotalView launches the visualizer when it is requested in a variable window or expression window or at an evaluation point.
• You can configure the following launch options:– whether or not visualization is enabled– the shell command used to launch the Visualizer– the maximum number of array dimensions TotalView
will export
• To change Visualizer launch options, select Visualize Launch Window from the Root window.

May 19, 1999 107
Saving Visualization Data
• To save visualization data to a file for later viewing, use the following visualizer launch string:
• To visualize the file, the the following command:
cat > your_file
% visualize -file your_file
May 19, 1999 108
Data Types that TotalView can Visualize
• The TotalView Visualizer can handle one or two dimensional arrays of character, integer, or floating point data located in memory (not registers).
• You can visualize arrays of more dimensions by using an array slice expression to extract an array of two dimensions.
May 19, 1999 109
Visualizing Data from a Variable Window
• Open a variable window for the array and stop program execution when the array values are those you want to visualize.
• With the desired array or array slice displayed in the variable window, use the Visualize (v) command to launch the visualizer.
• The first Visualize command launches the visualizer and creates the initial display.
May 19, 1999 110
Visualizing Data from aVariable Window (cont.)
• Subsequent Visualize commands send updated data values and cause the Visualizer to update its display.
• Visualization data displayed from a variable window is not automatically updated as you step through your program. You must explicitly request an update by reissuing the Visualize command.
• You can visualize laminated data pane displays, but because the process or thread index forms one of the dimensions, you are restricted to visualizing scalars or vectors.
May 19, 1999 111
Visualizing Data Using Expressions• You can use the $visualize built-in function in
expressions in an expression evaluation window or an evaluation point.
• Using $visualize in an evaluation point epxression provides an animated display of your data.
• The $visualize built-in function has the syntax
$visualize (array [,slice_string])
where slice_string, if present, is a quoted string containing a constant slice expression.
May 19, 1999 112
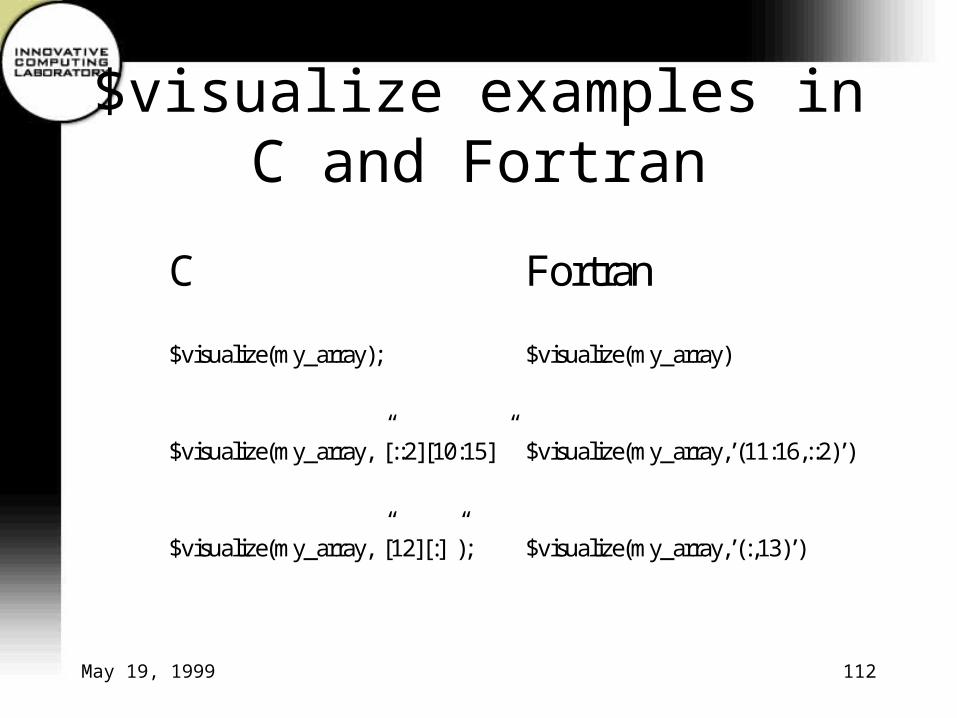
$visualize examples inC and Fortran
C Fortran
$visualize(my_array); $visualize(my_array)
$visualize(my_array,”[::2][10:15]” $visualize(my_array,’(11:16,::2)’)
$visualize(my_array,”[12][:]”); $visualize(my_array,’(:,13)’)

May 19, 1999 113
Visualizer Windows

May 19, 1999 114
Displaying Message State
• You can display the internal state of the SGI and IBM multithreaded MPI libraries by doing the following:– Issue the Message State Window (m) command
from the Process State submenu in the process window.
– Dive into fields in the message state window to display more detail.
May 19, 1999 115
Displaying Message State (cont.)
• For each communicator, TotalView displays the following fields:– Name of the communicator (if known)– Comm_size– Comm_rank– List of pending receive operations– List of pending unexpected messages– List of pending send operations


![groups.csail.mit.edugroups.csail.mit.edu/mac/ftpdir/thinkpad/archive/1999/1999-07.txtFrom cph@martigny.ai.mit.edu Thu Jul 1 01:31:12 1999 Received: from CS.UTK.EDU (CS.UTK.EDU [128.169.94.1])](https://img.pdfslide.us/doc/110x75/5a78ee6d7f8b9a43758b5485/cphmartignyaimitedu-thu-jul-1-013112-1999-received-from-csutkedu-csutkedu.jpg)