Embed Size (px)
Citation preview

Making Leaders Successful Every Day
May 18, 2011
State Of Enterprise Disaster Recovery Preparedness, Q2 2011by Rachel A. Dinesfor Infrastructure & Operations Professionals
© 2011 Forrester Research, Inc. All rights reserved. Forrester, Forrester Wave, RoleView, Technographics, TechRankings, and Total Economic Impact are trademarks of Forrester Research, Inc. All other trademarks are the property of their respective owners. Reproduction or sharing of this content in any form without prior written permission is strictly prohibited. To purchase reprints of this document, please email [email protected]. For additional reproduction and usage information, see Forrester’s Citation Policy located at www.forrester.com. Information is based on best available resources. Opinions reflect judgment at the time and are subject to change.
For Infrastructure & Operations Professionals
ExEcutIvE SuMMARyAdvancements in virtualization, hardware performance, and efficiency have given infrastructure and operations (I&O) leaders a wealth of options for delivering great services faster and more cheaply — and for surviving the plunge in global economic growth. But what about enterprise disaster recovery (DR) preparedness? This report outlines five trends in how enterprises are architecting their DR solutions today, including: secondary site configuration and separation, cloud recovery, tiers of applications, and causes of disasters. For I&O pros looking to improve their DR programs, the key is in process improvement. Rather than investing in the latest and greatest technology, focus on putting a solid framework in place of DR processes, and preparing for the most likely causes of downtime.
tAblE OF cOntEntSFive Trends In Disaster Recovery: What’s Changed Since 2007?
trend 1: tight budgets compel companies to consolidate Secondary Sites
trend 2: Recovery Site Separation Has become More Moderate
trend 3: Dedicated Infrastructure Still Dominates, but Interest In cloud Increases
trend 4: More And More Applications Are considered critical
trend 5: Most Declared Disasters And Disruptions Are Preventable With Proper Planning
REcOMMEnDAtIOnS
Focus Your DR Efforts On Improved Process And All Causes Of Downtime
Supplemental Material
nOtES & RESOuRcESForrester conducted a joint research study with Disaster Recovery Journal to get a snapshot of current DR planning, spending, and preparedness efforts as well as to understand the most common causes of downtime.
Related Research Documents“Wake-up call: you Aren’t Ready For A Disaster”February 9, 2011
“State Of Enterprise Disaster Recovery Preparedness: Q3 2009”november 4, 2009
“State Of Enterprise Disaster Recovery Preparedness: Q3 2008”January 7, 2009
May 18, 2011
State Of Enterprise Disaster Recovery Preparedness, Q2 2011Five trends In Disaster Recovery Preparedness, 2007 through 2010by Rachel A. Dineswith lindsey Kempton and laura Koetzle
2
8
9

© 2011, Forrester Research, Inc. Reproduction ProhibitedMay 18, 2011
State Of Enterprise Disaster Recovery Preparedness, Q2 2011 For Infrastructure & Operations Professionals
2
FIvE TREnDS In DISASTER RECOvERY: WhAT’S ChAngED SInCE 2007?
Much has changed in the political, economic, and technological world since 2007, but what’s changed in the world of DR? A recent study based on data from the joint Forrester Research/Disaster Recovery Journal surveys compared enterprise DR practices between 2007 and 2010 and found five overarching trends:
1. Secondary sites are being consolidated. In a recessionary climate, companies cut costs by consolidating their secondary sites. This isn’t necessarily a bad thing for resiliency, as long as the remaining sites are geographically separated and can replicate data between them.
2. Site separation is less extreme. Companies are not only consolidating their backup sites, they’re also decreasing the distance between them. This is a red flag for companies whose DR sites are close enough that they could be affected by the same disaster.
3. Dedicated sites remain the dominant model, but interest in DR in the cloud increases. I&O professionals clearly prefer dedicated infrastructure, but the compelling economic advantages of DR in the cloud is garnering interest.
4. Enterprises aren’t rigorously tiering their applications and services. The number of applications that enterprises consider critical is on the rise. To maximize DR efforts, companies should meticulously categorize their applications, prioritizing only those that are truly critical.
5. Most disasters are still caused by mundane events. That headlining disaster that you’re watching out for most likely won’t be what causes your downtime — instead, it’ll be a backhoe operator at the construction site next door who accidently severs your power or network lines.
Trend 1: Tight Budgets Compel Companies To Consolidate Secondary Sites
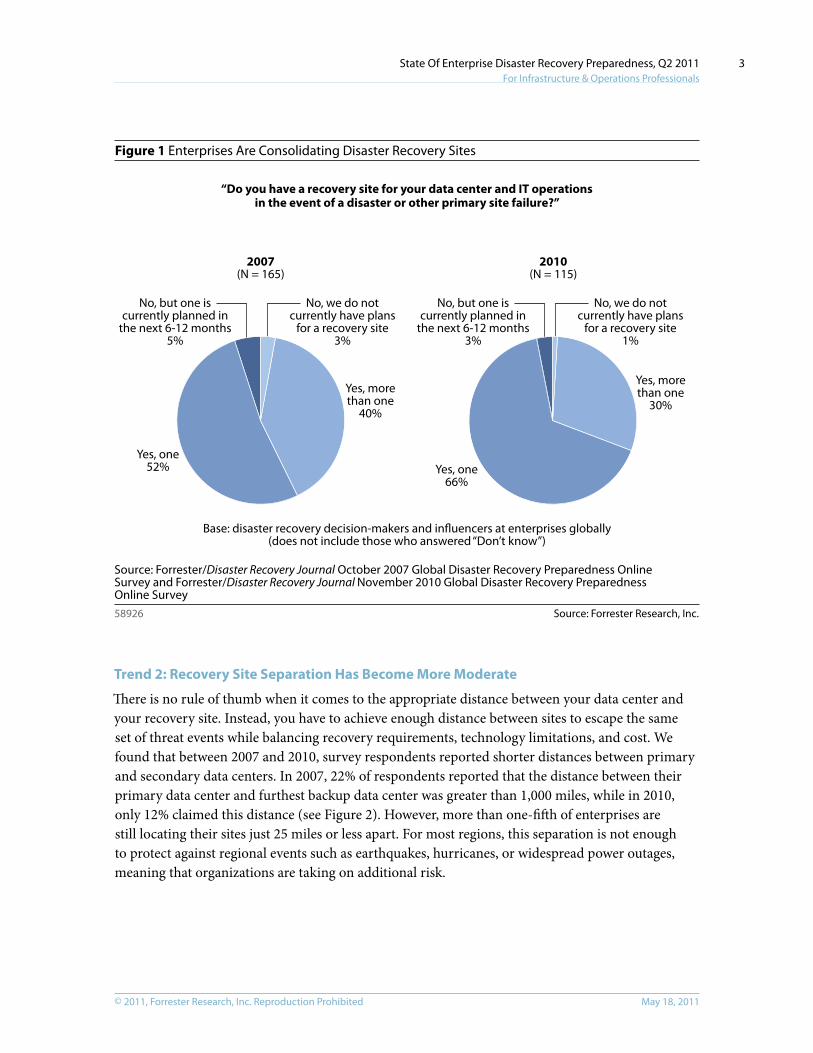
When the global economy began to decline in late 2008, DR budgets followed suit — which pushed firms to consolidate recovery sites. While approximately the same proportion of surveyed companies have secondary sites as in 2007, the number of secondary has decreased (see Figure 1). The likely cause of this consolidation is the declining or flat budgets plaguing disaster recovery budgets over the past few years.1 This consolidation is not necessarily a sign of poor planning or lack of preparation; many organizations’ recovery time and recovery points don’t justify having a three-site configuration, as long as the sites are separated geographically.
© 2011, Forrester Research, Inc. Reproduction Prohibited May 18, 2011
State Of Enterprise Disaster Recovery Preparedness, Q2 2011 For Infrastructure & Operations Professionals
3
Figure 1 Enterprises Are consolidating Disaster Recovery Sites
Source: Forrester Research, Inc.58926
No, we do notcurrently have plans
for a recovery site3%
No, but one iscurrently planned in
the next 6-12 months5%
No, we do notcurrently have plans
for a recovery site1%
No, but one iscurrently planned in
the next 6-12 months3%
2007(N = 165)
“Do you have a recovery site for your data center and IT operationsin the event of a disaster or other primary site failure?”
2010(N = 115)
Yes, morethan one
30%
Yes, one66%
Yes, morethan one
40%
Yes, one52%
Base: disaster recovery decision-makers and in�uencers at enterprises globally(does not include those who answered “Don’t know”)
Source: Forrester/Disaster Recovery Journal October 2007 Global Disaster Recovery Preparedness Online Survey and Forrester/Disaster Recovery Journal November 2010 Global Disaster Recovery PreparednessOnline Survey
Trend 2: Recovery Site Separation has Become More Moderate
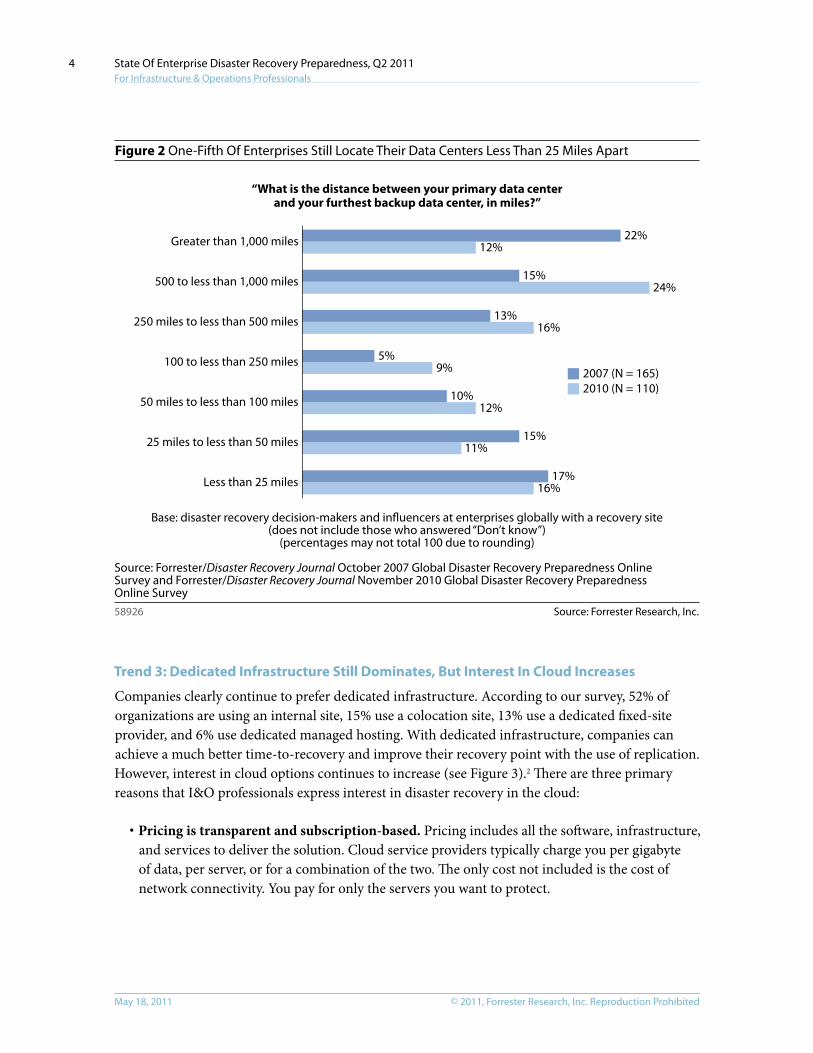
There is no rule of thumb when it comes to the appropriate distance between your data center and your recovery site. Instead, you have to achieve enough distance between sites to escape the same set of threat events while balancing recovery requirements, technology limitations, and cost. We found that between 2007 and 2010, survey respondents reported shorter distances between primary and secondary data centers. In 2007, 22% of respondents reported that the distance between their primary data center and furthest backup data center was greater than 1,000 miles, while in 2010, only 12% claimed this distance (see Figure 2). However, more than one-fifth of enterprises are still locating their sites just 25 miles or less apart. For most regions, this separation is not enough to protect against regional events such as earthquakes, hurricanes, or widespread power outages, meaning that organizations are taking on additional risk.
© 2011, Forrester Research, Inc. Reproduction ProhibitedMay 18, 2011
State Of Enterprise Disaster Recovery Preparedness, Q2 2011 For Infrastructure & Operations Professionals
4
Figure 2 One-Fifth Of Enterprises Still locate their Data centers less than 25 Miles Apart
Source: Forrester Research, Inc.58926
Less than 25 miles
25 miles to less than 50 miles
50 miles to less than 100 miles
100 to less than 250 miles
250 miles to less than 500 miles
500 to less than 1,000 miles
Greater than 1,000 miles
2007 (N = 165)2010 (N = 110)
“What is the distance between your primary data centerand your furthest backup data center, in miles?”
Base: disaster recovery decision-makers and in�uencers at enterprises globally with a recovery site(does not include those who answered “Don’t know”)
(percentages may not total 100 due to rounding)
Source: Forrester/Disaster Recovery Journal October 2007 Global Disaster Recovery Preparedness Online Survey and Forrester/Disaster Recovery Journal November 2010 Global Disaster Recovery Preparedness Online Survey
22%
16%
11%
12%
9%
16%
24%
12%
17%
15%
10%
5%
13%
15%
Trend 3: Dedicated Infrastructure Still Dominates, But Interest In Cloud Increases
Companies clearly continue to prefer dedicated infrastructure. According to our survey, 52% of organizations are using an internal site, 15% use a colocation site, 13% use a dedicated fixed-site provider, and 6% use dedicated managed hosting. With dedicated infrastructure, companies can achieve a much better time-to-recovery and improve their recovery point with the use of replication. However, interest in cloud options continues to increase (see Figure 3).2 There are three primary reasons that I&O professionals express interest in disaster recovery in the cloud:
· Pricing is transparent and subscription-based. Pricing includes all the software, infrastructure, and services to deliver the solution. Cloud service providers typically charge you per gigabyte of data, per server, or for a combination of the two. The only cost not included is the cost of network connectivity. You pay for only the servers you want to protect.

© 2011, Forrester Research, Inc. Reproduction Prohibited May 18, 2011
State Of Enterprise Disaster Recovery Preparedness, Q2 2011 For Infrastructure & Operations Professionals
5
· Deployment is fast and easy. Most of the recovery configuration can be done online, because there’s no need to reserve identical hardware, set up proprietary links, or negotiate your specific service-level agreements (SLAs). Since the backup is to virtual volumes and servers, you simply have to ensure that the right virtualization layers are in use. However, the cloud-based DR solutions on the market today are limited to x86 server environments only.
· The penalty for rehearsing is reduced. What good is a DR plan if you don’t test it to make sure it works? Traditional DR service providers recognize this but have to schedule rehearsals, reserve equipment, and often be on call for you during the rehearsal. All this prep costs money and is typically above and beyond the DR services contract. With cloud DR services, there’s usually little to no prep required, which allows you to rehearse more easily and at much lower cost.
While the cloud does have many appealing aspects, it’s important to remember that the cloud offerings for disaster recovery and business continuity are still relatively immature. As the market grows, I&O leaders should look for more robust and customizable solutions. You will likely never protect your critical systems using cloud-based services, but for less critical systems, the cloud is a viable, low-cost alternative.
Figure 3 Enterprises Are Interested In DR-As-A-Service, but Adoption Is Still low
Source: Forrester Research, Inc.58926
“What are your firm’s plans to adopt IT-recovery as a servicebased on virtual infrastructure at the service provider?”
Implemented, not expanding
Expanding/upgrading implementation
Planning to implement in the next 12 months
Planning to implement in a year or more
Interested but no plans
Not interested
Don’t know
Base: 649 IT hardware decision-makers and in�uencers at enterprises globally
Source: Forrsights Hardware Survey, Q3 2010
5%
4%
4%
9%
43%
33%
2%
© 2011, Forrester Research, Inc. Reproduction ProhibitedMay 18, 2011
State Of Enterprise Disaster Recovery Preparedness, Q2 2011 For Infrastructure & Operations Professionals
6
Trend 4: More And More Applications Are Considered Critical
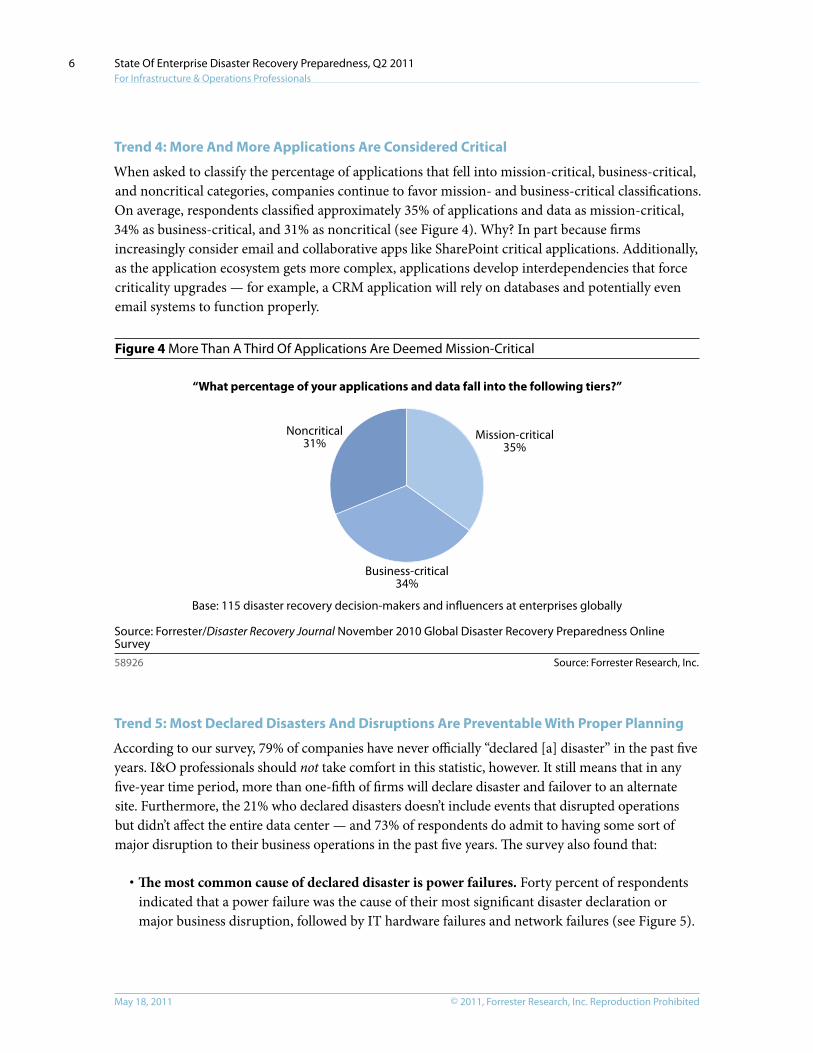
When asked to classify the percentage of applications that fell into mission-critical, business-critical, and noncritical categories, companies continue to favor mission- and business-critical classifications. On average, respondents classified approximately 35% of applications and data as mission-critical, 34% as business-critical, and 31% as noncritical (see Figure 4). Why? In part because firms increasingly consider email and collaborative apps like SharePoint critical applications. Additionally, as the application ecosystem gets more complex, applications develop interdependencies that force criticality upgrades — for example, a CRM application will rely on databases and potentially even email systems to function properly.
Figure 4 More than A third Of Applications Are Deemed Mission-critical
Source: Forrester Research, Inc.58926
“What percentage of your applications and data fall into the following tiers?”
Mission-critical35%
Business-critical34%
Noncritical31%
Base: 115 disaster recovery decision-makers and in�uencers at enterprises globally
Source: Forrester/Disaster Recovery Journal November 2010 Global Disaster Recovery Preparedness OnlineSurvey
Trend 5: Most Declared Disasters And Disruptions Are Preventable With Proper Planning
According to our survey, 79% of companies have never officially “declared [a] disaster” in the past five years. I&O professionals should not take comfort in this statistic, however. It still means that in any five-year time period, more than one-fifth of firms will declare disaster and failover to an alternate site. Furthermore, the 21% who declared disasters doesn’t include events that disrupted operations but didn’t affect the entire data center — and 73% of respondents do admit to having some sort of major disruption to their business operations in the past five years. The survey also found that:
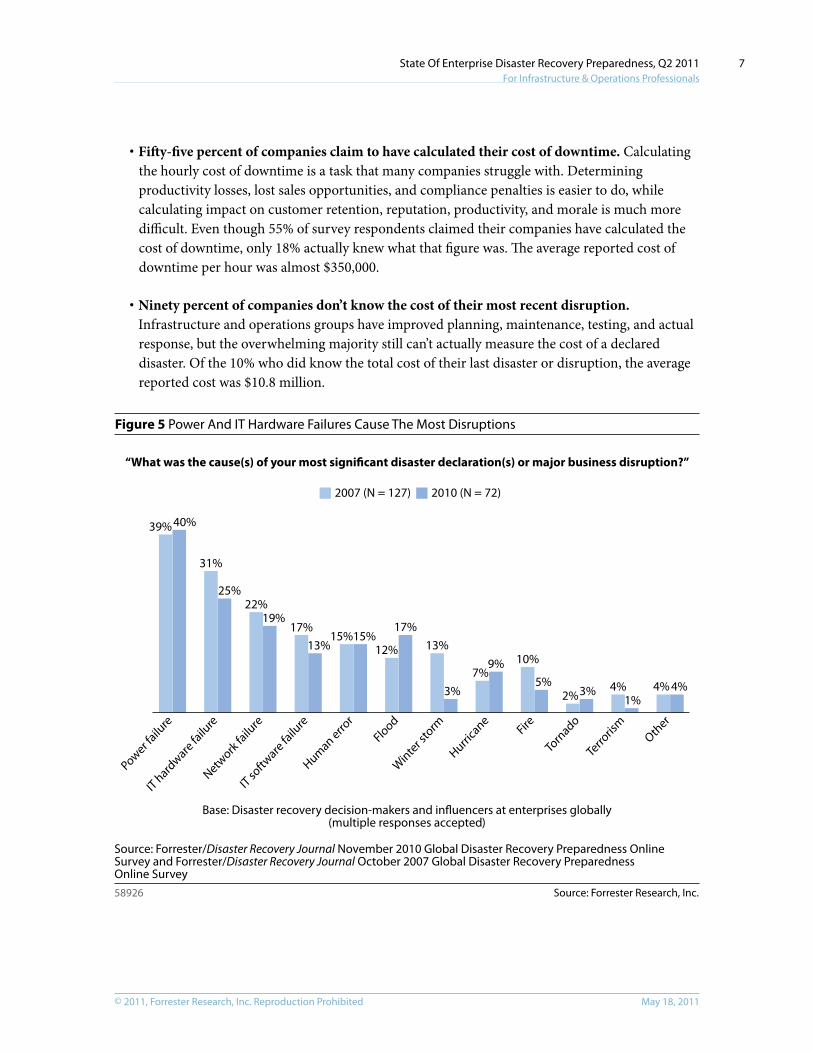
· The most common cause of declared disaster is power failures. Forty percent of respondents indicated that a power failure was the cause of their most significant disaster declaration or major business disruption, followed by IT hardware failures and network failures (see Figure 5).
© 2011, Forrester Research, Inc. Reproduction Prohibited May 18, 2011
State Of Enterprise Disaster Recovery Preparedness, Q2 2011 For Infrastructure & Operations Professionals
7
· Fifty-five percent of companies claim to have calculated their cost of downtime. Calculating the hourly cost of downtime is a task that many companies struggle with. Determining productivity losses, lost sales opportunities, and compliance penalties is easier to do, while calculating impact on customer retention, reputation, productivity, and morale is much more difficult. Even though 55% of survey respondents claimed their companies have calculated the cost of downtime, only 18% actually knew what that figure was. The average reported cost of downtime per hour was almost $350,000.
· Ninety percent of companies don’t know the cost of their most recent disruption. Infrastructure and operations groups have improved planning, maintenance, testing, and actual response, but the overwhelming majority still can’t actually measure the cost of a declared disaster. Of the 10% who did know the total cost of their last disaster or disruption, the average reported cost was $10.8 million.
Figure 5 Power And It Hardware Failures cause the Most Disruptions
Source: Forrester Research, Inc.58926
39%
31%
22%
17%15%
12% 13%
7%10%
2%4% 4%
40%
25%
19%
13%15%
17%
3%
9%5%
3%1%
4%
“What was the cause(s) of your most significant disaster declaration(s) or major business disruption?”
Power failu
re
IT hardware
failu
re
Network fa
ilure
IT softw
are fa
ilure
Human erro
rFlood
Hurrica
ne
Winte
r sto
rm Fire
Torn
ado
Terro
rism
Other
Base: Disaster recovery decision-makers and in�uencers at enterprises globally(multiple responses accepted)
Source: Forrester/Disaster Recovery Journal November 2010 Global Disaster Recovery Preparedness Online Survey and Forrester/Disaster Recovery Journal October 2007 Global Disaster Recovery Preparedness Online Survey
2007 (N = 127) 2010 (N = 72)
© 2011, Forrester Research, Inc. Reproduction ProhibitedMay 18, 2011
State Of Enterprise Disaster Recovery Preparedness, Q2 2011 For Infrastructure & Operations Professionals
8
R E c O M M E n D A t I O n S
FOCuS YOuR DR EFFORTS On IMPROvED PROCESS AnD All CAuSES OF DOWnTIME
In a recent Forrester survey of senior It and business executives at enterprises worldwide, 68% stated that significantly upgrading DR and business continuity capabilities was a high or critical priority over the next 12 months.3 As the global economy recovers, investments of both time and money in DR preparedness will improve, as it clearly continues to be a priority with strategic senior executives, stakeholders, partners, and customers. However, with more critical applications to protect than before, and with fewer sites and less budget to do it with, DR managers have their work cut out for them. I&O professionals who are looking to improve their DR programs should focus on:
· Improving process and governance. Forrester often finds that companies have deployed cutting-edge technologies to protect their mission-critical systems but don’t always have the processes in place to achieve the levels of availability and resiliency that they aspire to.
· Preparing for the most likely causes of downtime. While natural disasters better fit the profile of “disaster” in the traditional sense, it’s the mundane events that are most likely to cause an outage. Get prepared for the most likely causes of downtime first, then focus efforts on the less likely causes.
· Demonstrating business value. Enterprises need to put more effort into calculating their cost of downtime. When asked in the Forrester/DRJ survey what their hourly cost of downtime was, only 18% of respondents could actually report the figure. calculating your cost of downtime is a complex and time-consuming task but also an important step in building the business case for improved DR funding.

© 2011, Forrester Research, Inc. Reproduction Prohibited May 18, 2011
State Of Enterprise Disaster Recovery Preparedness, Q2 2011 For Infrastructure & Operations Professionals
9
SuPPlEMEnTAl MATERIAl
Methodology
In the fall of 2010, Forrester Research and the Disaster Recovery Journal (DRJ) conducted an online survey of 200 DRJ members. In this survey:
· Forty-three percent of respondents were from companies that had 0 to 999 employees; 25% had 1,000 to 4,990 employees; 19% had 5,000 to 19,999 employees; and 14% had 20,000 or more employees.
· Ninety-one percent of respondents were from North America; 2% were from South America; 6% were from Europe, the Middle East, and Africa; and 2% were from Asia.
· All respondents were decision-makers or influencers in regard to planning and purchasing technology and services related to disaster recovery.
· Respondents were from a variety of industries.
In October 2007, Forrester Research and the Disaster Recovery Journal (DRJ) conducted an online survey of 250 DRJ members. In this survey:
· Thirty-three percent of respondents were from companies that had 0 to 999 employees; 25% had 1,000 to 4,999 employees; 20% had 5,000 to 19,999 employees; and 22% had 20,000 or more employees.
· Eighty-three percent of respondents were from North America; 3% were from South America; 8% were from Europe, the Middle East, and Africa; and 6% were from Asia.
· All respondents were decision-makers or influencers in regard to planning and purchasing technology and services related to disaster recovery.
· Respondents were from a variety of industries.
Both the 2010 and 2007 surveys used a self-selected group of respondents (DRJ members) and are therefore not random. These respondents are more sophisticated than the average. They read and participate in business continuity (BC) and disaster recovery publications, online discussions, etc. They have above-average knowledge of best practices and technology in BC/DR. While nonrandom, the surveys are still a valuable tool in understanding where advanced users are today and where the industry is headed.

© 2011, Forrester Research, Inc. Reproduction ProhibitedMay 18, 2011
State Of Enterprise Disaster Recovery Preparedness, Q2 2011 For Infrastructure & Operations Professionals
10
EnDnOTES1 It isn’t surprising that when the global economy began to decline in late 2008, DR budgets declined sharply
as well. Overall, DR spending has declined since we last fielded this survey in 2007. According to our 2010 survey, 53% of respondents spend less than $500,000 annually on disaster recovery. This is down from the 2007 study, in which only 45% of respondents spent less than $500,000 on DR annually. See the February 9, 2011, “Wake-Up Call: You Aren’t Ready For A Disaster” report.
2 Cloud-based recovery services back up or replicate physical or virtual servers to the service provider’s multitenant environment, which consists of virtual servers and shared storage. In the case of a disaster declaration, the service provider recovers your servers as virtual servers hosted in their environment. With these services, you can recover your systems in hours with just a few minutes to a few hours of data loss but without the cost of dedicated IT infrastructure, storage-based replication, and high bandwidth, low latency network connectivity between your data center and the service provider. See the July 24, 2009, “How The Cloud Will Transform Disaster Recovery Services” report.
3 Source: Forrsights Budgets And Priorities Tracker Survey, Q2 2010.

Forrester Research, Inc. (Nasdaq: FORR)
is an independent research company
that provides pragmatic and forward-
thinking advice to global leaders in
business and technology. Forrester
works with professionals in 19 key roles
at major companies providing
proprietary research, customer insight,
consulting, events, and peer-to-peer
executive programs. For more than 27
years, Forrester has been making IT,
marketing, and technology industry
leaders successful every day. For more
information, visit www.forrester.com.
Headquarters
Forrester Research, Inc.
400 Technology Square
Cambridge, MA 02139 USA
Tel: +1 617.613.6000
Fax: +1 617.613.5000
Email: [email protected]
Nasdaq symbol: FORR
www.forrester.com
M a k i n g l e a d e r s S u c c e s s f u l E v e r y D a y
58926
For information on hard-copy or electronic reprints, please contact Client Support
at +1 866.367.7378, +1 617.613.5730, or [email protected].
We offer quantity discounts and special pricing for academic and nonprofit institutions.
For a complete list of worldwide locationsvisit www.forrester.com/about.
Research and Sales Offices
Forrester has research centers and sales offices in more than 27 cities
internationally, including Amsterdam; Cambridge, Mass.; Dallas; Dubai;
Foster City, Calif.; Frankfurt; London; Madrid; Sydney; Tel Aviv; and Toronto.