Embed Size (px)
Citation preview

2
Price movement of Oilseeds on NCDEX & MCX (April 2016)
Source: SMC Research
Price movement of Oilseeds on Spot markets (April 2016)
Source: SMC Research
®
-6.02
-3.89
-2.63
1.49
2.73
5.52
12.42
-10.00
-5.00
0.00
5.00
10.00
15.00
Crude Palm Oil (BMD)
Soy oil (CBOT)
Soybean (NCDEX)
Soy oil (NCDEX)
Crude Palm Oil (MCX)
Mustard (NCDEX)
Soybean (CBOT)
(% Change)
-0.25
0.62
3.45
6.19
-1.00
0.00
1.00
2.00
3.00
4.00
5.00
6.00
7.00
Soybean (Indore) Refined Soy oil (Indore) Crude Palm Oil (Kandla) Mustard (Jaipur)
(% Change)
3
®
Market Movements Ahead
Domestic Fundamentals: Soybean
�Soybean futures (June) is likely to face resistance near 4200 levels & trade with a bearish bias. The counter may even fall towards 3850-3800 levels.
�USDA forecasts India soybean production for 2016/17 at 11.70 million tons, up 58% from last year. The increase is based on the assumption of normal yields.
�Yield is forecast at 0.97 tons per hectare, up nearly 50 percent from last year and up 5.0 percent from the 5-year average.
�Harvested area is forecast at 12.0 million hectares, up 5.3 percent from last year.
�India's summer monsoon season begins in June and ends in September. Soybean planting usually coincides with the beginning of the summer monsoon in June and ends in July. Harvest typically begins in September and lasts until November.
�The sentiments for this counter are bearish as India weather department forecast monsoon to hit Andaman Nicobar island by May 20 and Kerala coast by June 1, which may encourage Kharif oilseed sowing.
�Poor soy meal exports from India, disparity in crushing the beans and likely better domestic planting will remain bearish factors for the counter.
�Recently, some soybean processors and poultry farmers have urged the Indian government to allow the imports of genetically modified soybean.
�Aggressive buying due to poor soy meal exports and cheaper edible imports leading to disparity on crushing the beans followed by lower bean production.
�The market participants are more focused on demand for soybean and soybean meal.
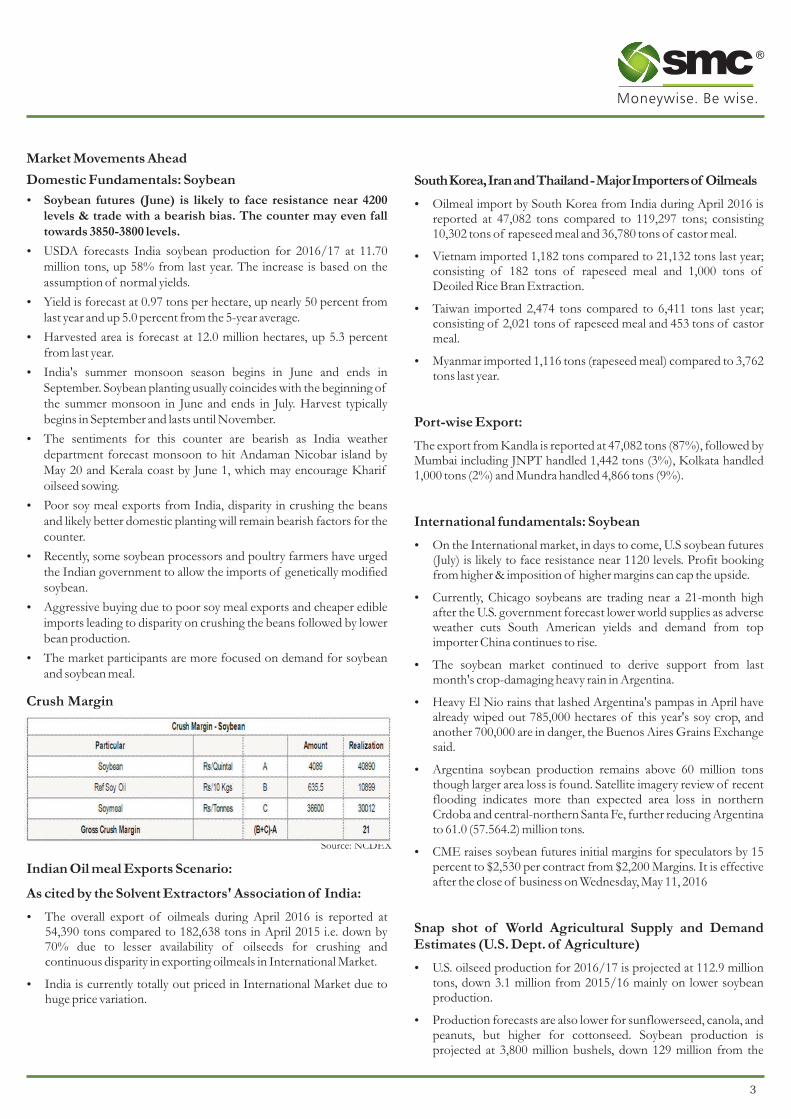
Crush Margin
Indian Oil meal Exports Scenario:
As cited by the Solvent Extractors' Association of India:
�The overall export of oilmeals during April 2016 is reported at 54,390 tons compared to 182,638 tons in April 2015 i.e. down by 70% due to lesser availability of oilseeds for crushing and continuous disparity in exporting oilmeals in International Market.
�India is currently totally out priced in International Market due to huge price variation.
South Korea, Iran and Thailand - Major Importers of Oilmeals
�Oilmeal import by South Korea from India during April 2016 is reported at 47,082 tons compared to 119,297 tons; consisting 10,302 tons of rapeseed meal and 36,780 tons of castor meal.
�Vietnam imported 1,182 tons compared to 21,132 tons last year; consisting of 182 tons of rapeseed meal and 1,000 tons of Deoiled Rice Bran Extraction.
�Taiwan imported 2,474 tons compared to 6,411 tons last year; consisting of 2,021 tons of rapeseed meal and 453 tons of castor meal.
�Myanmar imported 1,116 tons (rapeseed meal) compared to 3,762 tons last year.
Port-wise Export:
The export from Kandla is reported at 47,082 tons (87%), followed by Mumbai including JNPT handled 1,442 tons (3%), Kolkata handled 1,000 tons (2%) and Mundra handled 4,866 tons (9%).
International fundamentals: Soybean
�On the International market, in days to come, U.S soybean futures (July) is likely to face resistance near 1120 levels. Profit booking from higher & imposition of higher margins can cap the upside.
�Currently, Chicago soybeans are trading near a 21-month high after the U.S. government forecast lower world supplies as adverse weather cuts South American yields and demand from top importer China continues to rise.
�The soybean market continued to derive support from last month's crop-damaging heavy rain in Argentina.
�Heavy El Nio rains that lashed Argentina's pampas in April have already wiped out 785,000 hectares of this year's soy crop, and another 700,000 are in danger, the Buenos Aires Grains Exchange said.
�Argentina soybean production remains above 60 million tons though larger area loss is found. Satellite imagery review of recent flooding indicates more than expected area loss in northern Crdoba and central-northern Santa Fe, further reducing Argentina to 61.0 (57.564.2) million tons.
�CME raises soybean futures initial margins for speculators by 15 percent to $2,530 per contract from $2,200 Margins. It is effective after the close of business on Wednesday, May 11, 2016
Snap shot of World Agricultural Supply and Demand Estimates (U.S. Dept. of Agriculture)
�U.S. oilseed production for 2016/17 is projected at 112.9 million tons, down 3.1 million from 2015/16 mainly on lower soybean production.
�Production forecasts are also lower for sunflowerseed, canola, and peanuts, but higher for cottonseed. Soybean production is projected at 3,800 million bushels, down 129 million from the
Source: NCDEX

4
®
Period-wise comparison of Soymeal & Rapemeal Exports (Qty. in M.T)
Source: SEA of India
Month-wise Soymeal Export V/s Average International Prices of Oilmeals & Exchange
Source: SEA of India
Month-wise Rapemeal Export V/s Average International Prices of Oilmeals & Exchange
Source: SEA of India
2015 crop on lower harvested area and trend yields. Supplies are projected at 4,230 million bushels, up 1.9 percent from 2015/16 with higher beginning stocks more than offsetting lower production.
�The U.S. soybean crush for 2016/17 is projected at 1,915 million bushels, up 35 million from 2015/16. Domestic soybean meal disappearance is projected to increase with expected gains in U.S. meat production.
�With limited gains for competing exporters, U.S. soybean meal exports are projected at 12.0 million short tons, up 0.5 million from 2015/16.
�Soybean exports are forecast at 1,885 million bushels, up 145 million from the revised 2015/16 projection. Sharply reduced stocks in South America this fall will limit competition during the first half of the marketing year.
�In addition, limited soybean production gains are projected for the 2016/17 South American harvest in early 2017.
�With forecasted global soybean import growth of 3.8 percent, the U.S. soybean export share is projected at 37 percent, up slightly from 2015/16 and near the 5-year average.
�U.S. ending stocks for 2016/17 are forecast at 305 million bushels, down 95 million from the revised 2015/16 projection.
�The 2016/17 U.S. season-average soybean price range is forecast at $8.35 to $9.85 per bushel compared with $8.85 per bushel in 2015/16.
�Soybean meal prices are forecast at $300 to $340 per short ton, compared with $310 per ton for 2015/16.
�Soybean oil prices are forecast at 30.5 to 33.5 cents per pound compared with 30.0 cents for 2015/16.
�Global oilseed production for 2016/17 is projected at 533.8 million tons, up 2.1 percent from 2015/16.
�Global soybean production is projected at 324.2 million tons, up 8.3 million with gains for India, Brazil, Ukraine, and Argentina, partly offset by lower U.S. production.
�The Brazil soybean crop is projected at 103.0 million tons, up 4.0 million on higher area and yields. China soybean production is projected higher on increased harvested area as policy changes reduce incentives to plant corn.
�The Argentina soybean crop is projected at 57.0 million tons, up 0.5 million from the revised 2015/16 crop.
�The 2015/16 crop is projected at 56.5 million tons, down 2.5 million mainly on lower area resulting from flooding in April.
�Total global oilseed supplies are up less than 1 percent from 2015/16. With crush projected to increase 2.3 percent, global oilseed ending stocks are projected at 76.9 million tons, down 9.5 percent from 2015/16.
�Global protein meal consumption is projected to increase 3.2 percent in 2016/17. Protein meal consumption is projected to increase 3.7 percent in China which accounts for 32 percent of global protein consumption gains.
7,707
1,127
430
1,442
440
450
460
470
480
490
500
0
1,000
2,000
3,000
4,000
5,000
6,000
7,000
8,000
9,000
Jan '16 Feb '16 Mar '16 Apr '16
Price in US$ FAS/FOB/Tons/Indian PortQty. in M.T
Month-wise Soymeal Export Average International Prices of Oilmeals & Exchange
1,990
9,803
7,260
14,163
200
220
240
260
280
300
320
0
2,000
4,000
6,000
8,000
10,000
12,000
14,000
16,000
Jan '16 Feb '16 Mar '16 Apr '16
Price in US$ FAS/FOB/Tons/Indian PortQty. in M.T.
Month-wise Soymeal Export Average International Prices of Oilmeals & Exchange
1,830,926
1,593,5291,633,622
861,080
232,874
10,706
460,517
271,215 253,215
359,269
240,972
33,216
5,000
205,000
405,000
605,000
805,000
1,005,000
1,205,000
1,405,000
1,605,000
1,805,000
2,005,000
Jan '11 - Apr '11 Jan '12 - Apr '12 Jan '13 -Apr'13 Jan '14 - Apr '14 Jan '15 -Apr '15 Jan'16 -Apr '16 Jan '11 - Apr '11 Jan '12 - Apr '12 Jan '13 -Apr'13 Jan '14 - Apr '14 Jan '15 -Apr '15 Jan'16 -Apr '16
Soymeal Rape meal
5
®
�Global soybean exports are projected at 138.3 million tons, up 4.3 percent from 2015/16.
�China soybean imports are projected at 87.0 million tons, up 4.0 million from 2015/16.
�Global vegetable oil consumption is projected at 183.8 million tons, up 3.0 percent in 2016/17 led by increases for India, China, and Indonesia.
�Global vegetable oil ending stocks are projected at 16.9 million tons, down 7.9 percent from 2015/16.
China import of soybean
Chinese soybean imports surged 33 percent higher in April from a year ago, setting a monthly record, amid strong demand for soymeal and soyoil. China imported 7.07 million tonnes of soybeans in April, up 15.9 percent compared to the previous month, preliminary figures issued by the General Administration of Customs showed. This is a record for April imports. March imports were also a monthly record and soybean imports have surged in 2016 on rising demand for soymeal for hog farms in China.
Mustard:
�Mustard futures (June) is expected to consolidate in the range of 4285-4600 levels. The downside may remain capped as the fundamentals attached to this oilseed counter are strong & will possibly lend support to the mustard prices.
�Lower than expected crop and dwindling supplies are likely to support prices from any major fall.
�Mustard seed downside is limited as nearly 40% new crop has already arrived from estimated production of 58 lakh tonnes.
�In the current scenario, the demand for mustard oil is also improving, but very slowly.
�The market participants are anticipating current lackluster trend may continue for another couple of days, and spike in demand and prices likely ahead amid expected demand from pickle industry.
�In the advance estimate by department of agriculture, Government of Rajasthan has forecasted Rajasthan's 2015/16 rapeseed-mustard production up by 22% at 3.5 million tonnes compared to 2.87 million tonnes in2014/15. The department had estimated Rajasthan's 2015/16 RM seed production at 3.49 million tonnes.
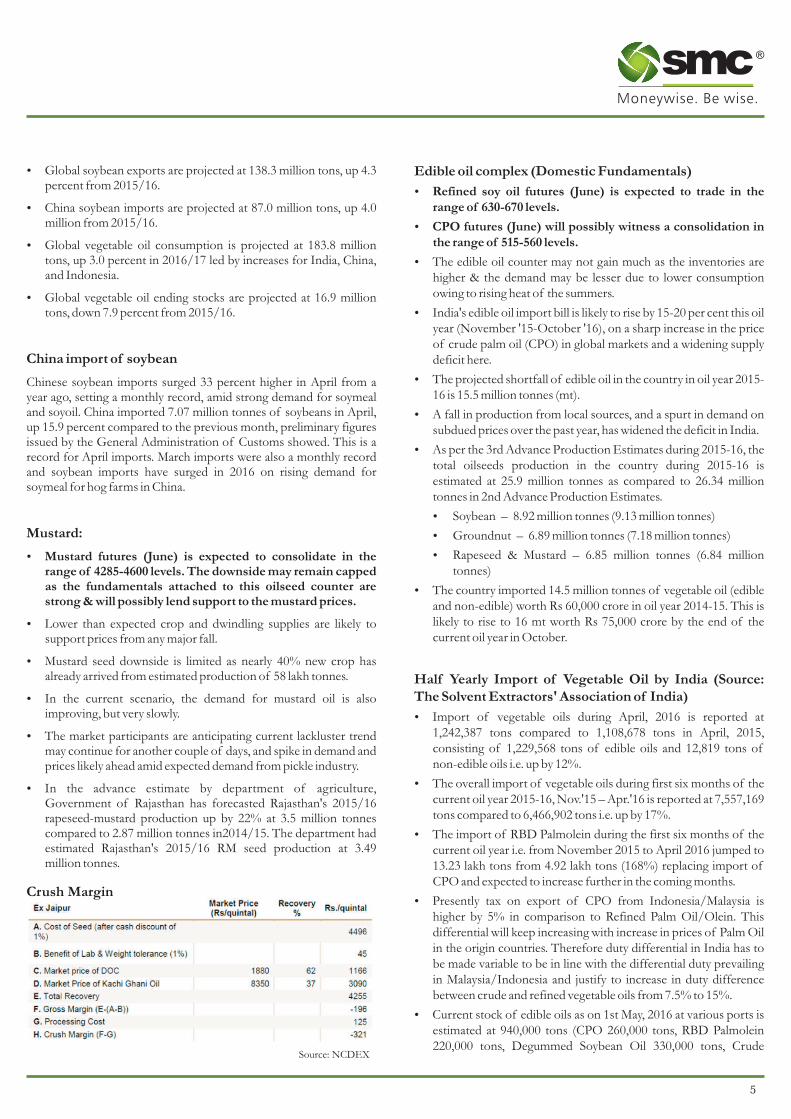
Edible oil complex (Domestic Fundamentals)
�Refined soy oil futures (June) is expected to trade in the range of 630-670 levels.
�CPO futures (June) will possibly witness a consolidation in the range of 515-560 levels.
�The edible oil counter may not gain much as the inventories are higher & the demand may be lesser due to lower consumption owing to rising heat of the summers.
�India's edible oil import bill is likely to rise by 15-20 per cent this oil year (November '15-October '16), on a sharp increase in the price of crude palm oil (CPO) in global markets and a widening supply deficit here.
�The projected shortfall of edible oil in the country in oil year 2015-16 is 15.5 million tonnes (mt).
�A fall in production from local sources, and a spurt in demand on subdued prices over the past year, has widened the deficit in India.
�As per the 3rd Advance Production Estimates during 2015-16, the total oilseeds production in the country during 2015-16 is estimated at 25.9 million tonnes as compared to 26.34 million tonnes in 2nd Advance Production Estimates.
�Soybean – 8.92 million tonnes (9.13 million tonnes)
�Groundnut – 6.89 million tonnes (7.18 million tonnes)
�Rapeseed & Mustard – 6.85 million tonnes (6.84 million tonnes)
�The country imported 14.5 million tonnes of vegetable oil (edible and non-edible) worth Rs 60,000 crore in oil year 2014-15. This is likely to rise to 16 mt worth Rs 75,000 crore by the end of the current oil year in October.
Half Yearly Import of Vegetable Oil by India (Source: The Solvent Extractors' Association of India)
�Import of vegetable oils during April, 2016 is reported at 1,242,387 tons compared to 1,108,678 tons in April, 2015, consisting of 1,229,568 tons of edible oils and 12,819 tons of non-edible oils i.e. up by 12%.
�The overall import of vegetable oils during first six months of the current oil year 2015-16, Nov.'15 – Apr.'16 is reported at 7,557,169 tons compared to 6,466,902 tons i.e. up by 17%.
�The import of RBD Palmolein during the first six months of the current oil year i.e. from November 2015 to April 2016 jumped to 13.23 lakh tons from 4.92 lakh tons (168%) replacing import of CPO and expected to increase further in the coming months.
�Presently tax on export of CPO from Indonesia/Malaysia is higher by 5% in comparison to Refined Palm Oil/Olein. This differential will keep increasing with increase in prices of Palm Oil in the origin countries. Therefore duty differential in India has to be made variable to be in line with the differential duty prevailing in Malaysia/Indonesia and justify to increase in duty difference between crude and refined vegetable oils from 7.5% to 15%.
�Current stock of edible oils as on 1st May, 2016 at various ports is estimated at 940,000 tons (CPO 260,000 tons, RBD Palmolein 220,000 tons, Degummed Soybean Oil 330,000 tons, Crude
Crush Margin
Source: NCDEX

5
®
Sunflower Oil 90,000 tons and 40,000 tons of Rapeseed (Canola) Oil) and about 1,500,000 tons in pipelines. Total stock at ports and in pipelines increased to 2,440,000 tons from 2,310,000 tons in April 2016. India's monthly requirement is about 16.5 lakh tons and operates at 30 days stock against which currently holding stock over 24.40 lakh tons equal to 44 days requirements.
�The overall stock as on 1st May, 2016 has increased by 340,000 tons compared to 1st May, 2015.
Parity calculator
Source: NCDEX
Edible oil complex (International market fundamentals)
�CPO futures (Aug) may remain below 2720 levels & the uptrend may see a pause due to dwindling exports.
�Currently, Malaysian palm oil is trading near to its highest in almost three weeks with prices rising for four out of six sessions on strong demand and a rally in soybeans.
�Malaysian Palm Oil Board data showed a 4.5 percent decline in local stockpiles in April as output growth was less than expected. Production rose 6.7 percent from March to 1.30 million tonnes, compared with a 13.2 percent jump to 1.69 million tonnes in April last year. Exports also declined 12.8 percent to 1.16 million tonnes in April.

6
Forward Curves
Forward Curve of U.S Soybean futures (Cents per bushel)
Forward Curve of Soybean Futures (NCDEX) (Rs./Qtl.)
Forward Curve of Refined Soy oil futures (NCDEX) (Rs. 10/Kgs)
Forward Curve of Mustard futures (NCDEX) Rs./Qtl
Forward curve of U.S Soybean Oil Futures (Cents per pound)
Forward curve of CPO futures (MCX)
Source: barchart.com
Source: barchart.com
Source: NCDEX
Source: NCDEX
Source: MCXSource: NCDEX
As per closing on 13 May 2016
As per closing on 13 May 2016
As per closing on 13 May 2016
As per closing on 13 May 2016
As per closing on 13 May 2016
As per closing on 13 May 2016
®
32.50
32.61
32.72
32.83
33.09
32.20
32.30
32.40
32.50
32.60
32.70
32.80
32.90
33.00
33.10
33.20
July Aug Sept Oct Dec
1065.00
1067.00
1059.40
1054.40
1,048.00
1,050.00
1,052.00
1,054.00
1,056.00
1,058.00
1,060.00
1,062.00
1,064.00
1,066.00
1,068.00
July August September November
3987.00
4046.00
3728.00 3713.00
3760.00
3200.00
3300.00
3400.00
3500.00
3600.00
3700.00
3800.00
3900.00
4000.00
4100.00
Jun Jul Oct Nov Dec
655.50
658.95
659.85
652.25
645.80
659.20
672.60
645.00
650.00
655.00
660.00
665.00
670.00
675.00
Jun Jul Aug Sep Oct Nov Dec
4,425.00
4,495.00
4,545.00
4,614.00
4,300.00
4,350.00
4,400.00
4,450.00
4,500.00
4,550.00
4,600.00
4,650.00
Jun Jul Aug Sep
554.00
550.60
545.10 544.10
560.00
530.00
535.00
540.00
545.00
550.00
555.00
560.00
565.00
Apr May Jun Jul Aug

®
SMC Global Securities Limited is proposing, subject to receipt of requisite approvals, market conditions and other considerations, a further public offering of its equity shares and has filed the Draft Red Herring Prospectus with the Securities and Exchange Board of India (“SEBI”) and the Stock Exchanges. The Draft Red Herring Prospectus is available on the website of SEBI at www.sebi.gov.in and on the websites of the Book Running Lead Manager i.e., ICICI Securities Limited at www.icicisecurities.com and the Co- Book Running Lead Manager i.e., Elara Capital (India) Private Limited at www.elaracapital.com . Investors should note that investment in equity shares involves a high degree of risk and for details relating to the same, please see the section titled “Risk Factors” of the aforementioned offer document.
Disclaimer:
This report is for the personal information of the authorized recipient and doesn’t construe to be any investment, legal or taxation advice to you. It is only for private circulation and use .The report is based upon information that we consider reliable, but we do not represent that it is accurate or complete, and it should not be relied upon as such. No action is solicited on the basis of the contents of the report. The report should not be reproduced or redistributed to any other person(s)in any form without prior written permission of the SMC. The contents of this material are general and are neither comprehensive nor inclusive. Neither SMC nor any of its affiliates, associates, representatives, directors or employees shall be responsible for any loss or damage that may arise to any person due to any action taken on the basis of this report. It does not constitute personal recommendations or take into account the particular investment objectives, financial situations or needs of an individual client or a corporate/s or any entity/s. All investments involve risk and past performance doesn’t guarantee future results. The value of, and income from investments may vary because of the changes in the macro and micro factors given at a certain period of time. The person should use his/her own judgment while taking investment decisions. Please note that we and our affiliates, officers, directors, and employees, including persons involved in the preparation or issuance if this material;(a) from time to time, may have long or short positions in, and buy or sell the commodities thereof, mentioned here in or (b) be engaged in any other transaction involving such commodities and earn brokerage or other compensation or act as a market maker in the commodities discussed herein (c) may have any other potential conflict of interest with respect to any recommendation and related information and opinions. All disputes shall be subject to the exclusive jurisdiction of Delhi High court.
For further any queries, please contact
Subhranil Dey Sr. Research Analyst [email protected]
Ph.: 011-30111000
Extn.: 674