Embed Size (px)
Citation preview
May 16, 2014
Analytics Short Discussion
ECAR Analytics Maturity Index
Source: ECAR Analytics Maturity Index, 2012. http://www.educause.edu/ecar/research-publications/ecar-analytics-maturity-index-higher-education
The Maturity Index is freely available for you to take to learn your own maturity levels.
5 – Transforming4 – Implementing3 – Launching2 – Visioning1 – Starting
BI Maturity – Challenges/Opportunities
3
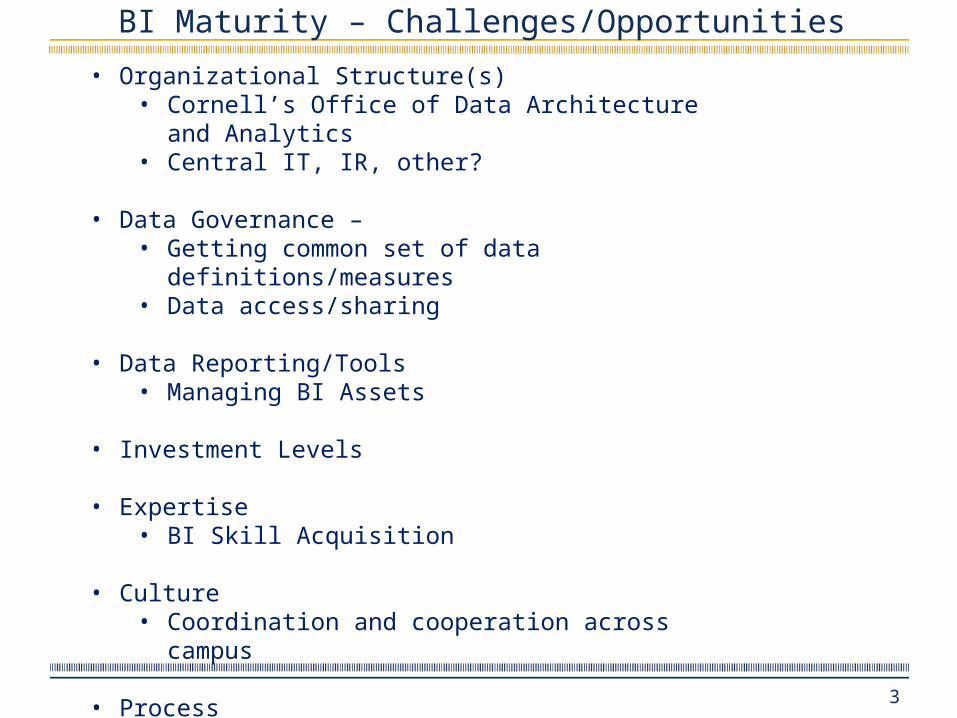
• Organizational Structure(s)• Cornell’s Office of Data Architecture and Analytics• Central IT, IR, other?
• Data Governance – • Getting common set of data definitions/measures• Data access/sharing
• Data Reporting/Tools• Managing BI Assets
• Investment Levels
• Expertise• BI Skill Acquisition
• Culture• Coordination and cooperation across campus
• ProcessWorking with customers
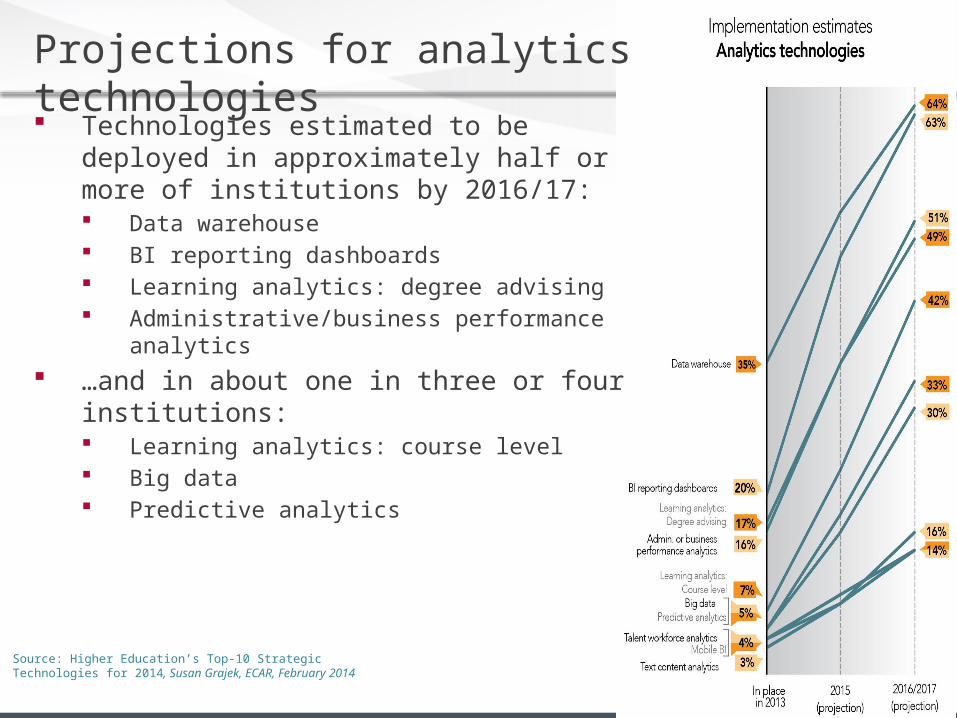
Source: Higher Education’s Top-10 Strategic Technologies for 2014, Susan Grajek, ECAR, February 2014
Technologies estimated to be deployed in approximately half or more of institutions by 2016/17: Data warehouse BI reporting dashboards Learning analytics: degree advising Administrative/business performance analytics
…and in about one in three or four institutions: Learning analytics: course level Big data Predictive analytics
Projections for analytics technologies
5
Appendix
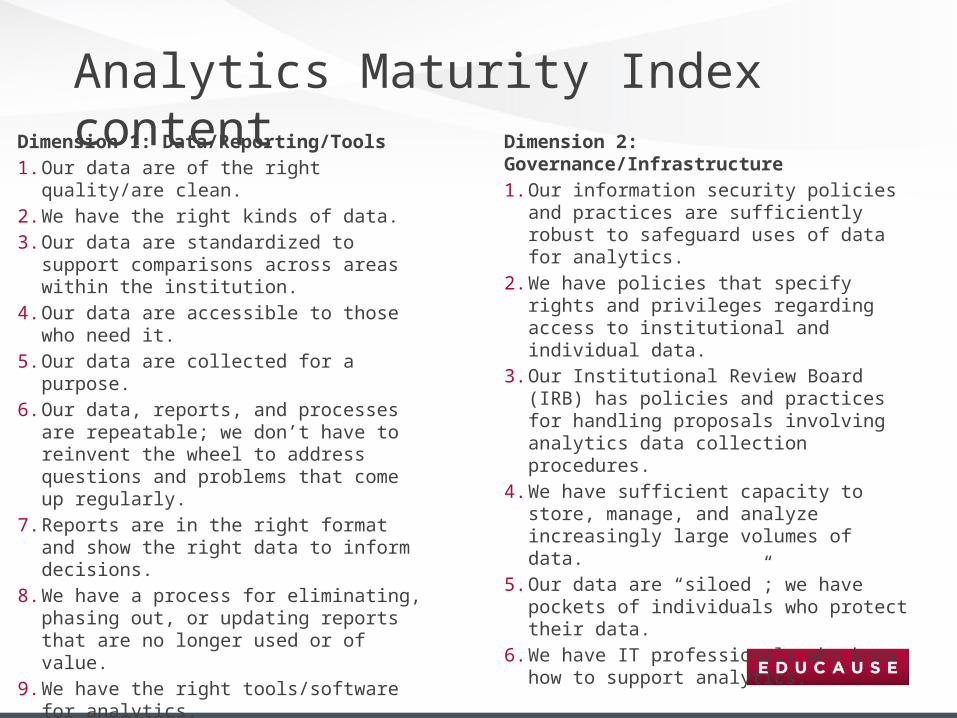
Analytics Maturity Index contentDimension 1: Data/Reporting/Tools1. Our data are of the right quality/are clean.2. We have the right kinds of data.3. Our data are standardized to support comparisons
across areas within the institution.4. Our data are accessible to those who need it.5. Our data are collected for a purpose.6. Our data, reports, and processes are repeatable;
we don’t have to reinvent the wheel to address questions and problems that come up regularly.
7. Reports are in the right format and show the right data to inform decisions.
8. We have a process for eliminating, phasing out, or updating reports that are no longer used or of value.
9. We have the right tools/software for analytics.
Dimension 2: Governance/Infrastructure1. Our information security policies and practices are
sufficiently robust to safeguard uses of data for analytics.
2. We have policies that specify rights and privileges regarding access to institutional and individual data.
3. Our Institutional Review Board (IRB) has policies and practices for handling proposals involving analytics data collection procedures.
4. We have sufficient capacity to store, manage, and analyze increasingly large volumes of data.
5. Our data are “siloed”; we have pockets of individuals who protect their data.
6. We have IT professionals who know how to support analytics.
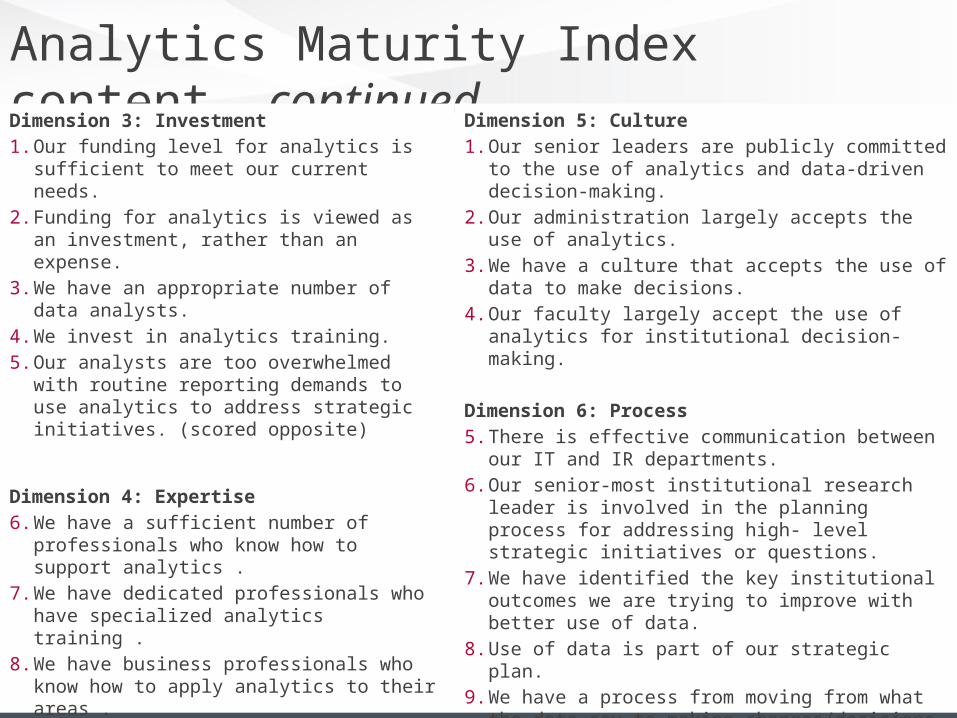
Analytics Maturity Index content, continuedDimension 3: Investment1. Our funding level for analytics is sufficient to meet our
current needs.2. Funding for analytics is viewed as an investment,
rather than an expense.3. We have an appropriate number of data analysts.4. We invest in analytics training.5. Our analysts are too overwhelmed with routine
reporting demands to use analytics to address strategic initiatives. (scored opposite)
Dimension 4: Expertise6. We have a sufficient number of professionals who
know how to support analytics .7. We have dedicated professionals who have specialized
analytics training .8. We have business professionals who know how to
apply analytics to their areas .9. Our analysts know how to present processes and
findings to stakeholders and to the broader institutional community in a way that is visually intuitive and understandable .
Dimension 5: Culture1. Our senior leaders are publicly committed to the use of
analytics and data-driven decision-making.2. Our administration largely accepts the use of analytics.3. We have a culture that accepts the use of data to make
decisions.4. Our faculty largely accept the use of analytics for
institutional decision-making.
Dimension 6: Process5. There is effective communication between our IT and IR
departments.6. Our senior-most institutional research leader is involved in
the planning process for addressing high- level strategic initiatives or questions.
7. We have identified the key institutional outcomes we are trying to improve with better use of data.
8. Use of data is part of our strategic plan.9. We have a process from moving from what the data say to
making changes/decisions.10.We have demonstrated with at least one high-profile “win”
that analytics can lead to improved decision-making, planning, or outcomes.

BI Business Drivers – Weighted Scores
8
Have data that is consistent/reliable across the organi-
zation
Make better data-informed deci-
sions
Make it easier to access data
Provide ability to share data across the organization
Analytics tools that are easier to
use
Reduce time it takes to get
needed informa-tion, spend more
time analyzing data
Provide data in a timelier fashion
Provide more ways to
visualize/interact with data
Determine opera-tional effective-ness of my orga-
nization
0
10
20
30
40
50
60
70
For you, what are the most important business drivers behind BI? (by weighted score)
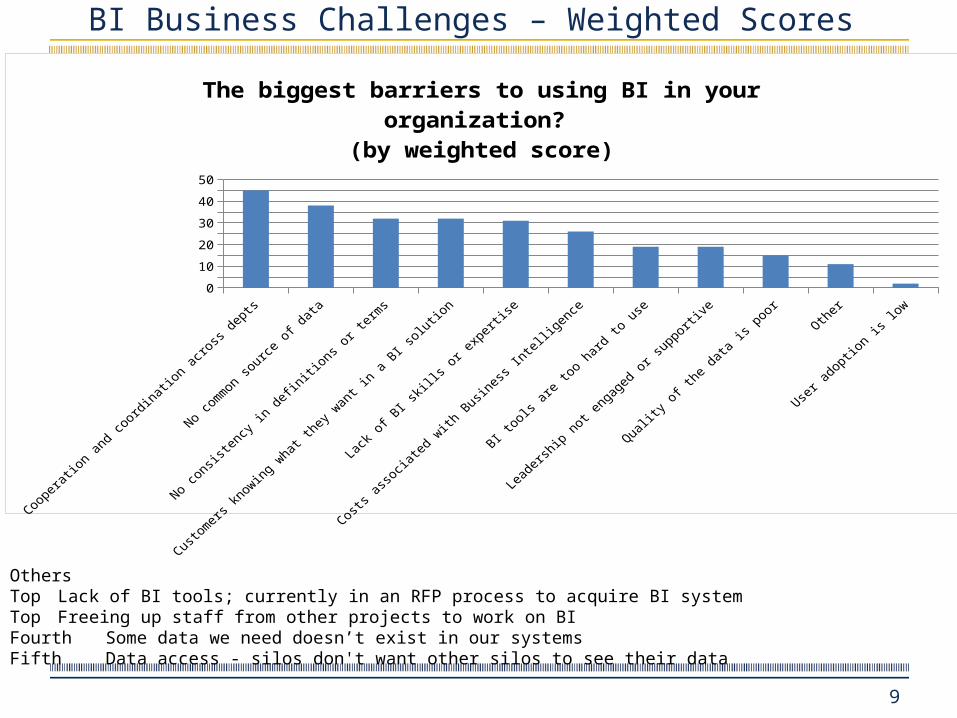
BI Business Challenges – Weighted Scores
9
OthersTop Lack of BI tools; currently in an RFP process to acquire BI systemTop Freeing up staff from other projects to work on BIFourth Some data we need doesn’t exist in our systemsFifth Data access - silos don't want other silos to see their data
Cooperation an
d coord
ination ac
ross
depts
No common so
urce of d
ata
No consis
tency
in definitions o
r term
s
Customers
knowing w
hat they
wan
t in a
BI solution
Lack o
f BI sk
ills or e
xperti
se
Costs as
socia
ted w
ith Busin
ess In
tellig
ence
BI tools a
re too hard
to use
Leaders
hip not enga
ged or s
upportive
Quality
of the d
ata is
poorOther
User ad
option is low
05
101520253035404550
The biggest barriers to using BI in your organization? (by weighted score)