Embed Size (px)
Citation preview

May 15, 2008 Conference in Seoul, Korea
Sustainable Water Projects: The Task for
Economic Institutions and Supporting Institutions
byK. William Easter
Professor of Applied Economics
University of Minnesota

2

3A drip irrigation system farm May 16, 2007

4
I. Introduction
1. Key for sustainable water systems – adequate
finances
2. Historical cost recovery has been low (Table 1)
3. Resulting in poor and declining service
4. Poor operation and maintenance (O&M)
5. Growing salinity problems and declining productivity
6. Institutional arrangements are key to cost recovery
7. Show this with successful projects

5
Country/Region Collection Rate Cost Recovery Rate
Argentina 1997 70% 12% of O&M
Bangladesh 1998 3-10% low
Brazil Jaiba Project 1995 66% 52% of total costs
Columbia 1996 76% 52% of the O&M
India Maharashtra 1984 58-67% NA
Italy 1997 NA 60% of total costs
Jordan 1999 NA 50% of O&M
Macedonia 2000 42% NA
Nepal 1984 20% NA
Pakistan 2001 30-35% NA
Philippine 1995 58% 46% of O&M
Sri Lanka 1984 8% NA
Table 1: Low Costs Recovery or Collection Rates

6
II. Institutions for Water
A. Definitions:
1. Institutions are the “rules of the game” while the players are the organizations, firms, or individuals” (North)
2. Institutional arrangements for water
a. Defines who has access to waterb. Establishes the range of options for water
usersc. Determines who can claim income and
who pays for water use (Livingston)d. These may be formal or informal rules
3. Where do institutional arrangements fit into water management? (Figure 1)

7
Figure 1. Irrigation management system with inputs and outputs

8
III. Outline of Lecture
A. Framework for analyzing institutions
B. Problem of designing effective institutions
C. Why low cost recovery?
D. What costs to recover from farmers?
E. Cost allocation among users
F. Alternative charges for cost recovery
G. Key institutions for effective cost recovery
H. How reforms occur: Institutions and public policy
I. Conclusions

9
IV. Analytical Framework (Williamson, 2000)
Level One – informal institutions such as norms, customs, mores, and religion. Beliefs regardingwater as “basic right or an economic good” (Fig. 2).
Level Two – rules for making rules, property right laws, and policies.
Level Three – governance structures. For water, it ranges from spot market for water, to water contracts and allocations by water agencies (hierarchical).
Level Four – actual exchange of water.
10
Figure 2. Levels of Institutional Analysis (developed from Williamson, 2000)

11
V. Designing Institutions – What Effects Change?
A. Problem of path dependency: old institutions and organization block change. (first level)
B. Institution affected by physical environment especially the level of water scarcity.
C. Lack of second-level institutions resulting in weak third-level institutions

12
V. Designing Institutions – What Effects Change? (continued)
D. Change in government and economic policy preceded changes in Chile’s and China’s water institutions.
E. Design of water institutions is complex and each policy and governance structure will usually have some drawbacks as well as strengths.
F. If institutional change doesn’t offer positive net returns, then it may be better to wait until conditions are better-suited for change.

13
VI. Why Has Cost Recovery Been Low?
1. No linkage between fees collected and project O&M
2. Lack of user participation3. Poor communication and lack of transparency4. No penalties for management or staff for
providing poor service and water delivery5. No penalties for defaulting on payments 6. Inappropriate infrastructure design7. Corruption among irrigation officials8. Low priority given to fee collection, efficient
water use, and system O&M

14
VII. What Costs to Recovery?
A. Direct project costs
• Costs of capturing and delivering water• Fixed costs and variable costs in operations• Capital costs• Most projects focus on operation and
maintenance costs

15
VII. What Costs to Recovery? (continued)
B. Environmental costs
• Soil erosion, damage to ecosystem, salinity, etc.
C. Marginal user costs: The present value of future sacrifices caused by current resources use
• Important in use of groundwater stocks• Also important if storing surface water for long
period – offset by evaporation rate

16
VIII. Costs Allocation: Multipurpose Projects
Three common alternatives:
1. Use of facilities (UOF) (Table 2)
2. Alternative justifiable (specific) expenditure (AJE)
3. Separate costs, remaining benefits

17
Table 2. Cost Allocation for Three Consumptive Uses Based on Water Delivery
Three Indian water projects
Domestic supply
Industrial supply
Irrigation
Nagarjursagar 2% 0% 98%
Tungabhadra 1% 4% 95%
Sriram Sagar 2% 3% 95%
Source: World Bank, 2003.

18
IX. Cost Allocation: Indirect Beneficiaries
A. Sana’s Basin Water Management Project, Yemen
● Objective to reduce groundwater use with subsidies for new technology
● Has been effective in reducing water use by allocating some of cost to public
● A way to incorporate marginal user cost of groundwater

19
IX. Cost Allocation: Indirect Beneficiaries (continued)
B. Irrigation in India was to help reduce food prices and food shortages
● Should consumers be allocated some of the costs (tax payers)? (Table 3)
● What share should farmers pay?
● If indirect benefits included, maybe only 75-80%?

20
Three Indian Water Projects
Purpose or useSriram Sagar
(percent)Nagarjursagar
(percent)Tungabhadra
(percent)
Irrigation 88.1 94.3 91.3
Hydropower 3.0 4.0 4.2
Domestic 3.0 1.6 2.1
Industry 4.3 0.1 2.3
Fisheries 1.6 0.1 0.1
Table 3. Cost Allocation Among Three Projects Based on Direct Benefits
Source: World Bank, 2003.

21
X. Alternative Mechanisms for Collecting Costs
A. Area-based charges
● Varied by hectare (ha.)
● Varied by hectare and crop
● Varied by hectare and season
● Varied by hectare and technology

22
X. Alternative Mechanisms for Collecting Costs -- continued
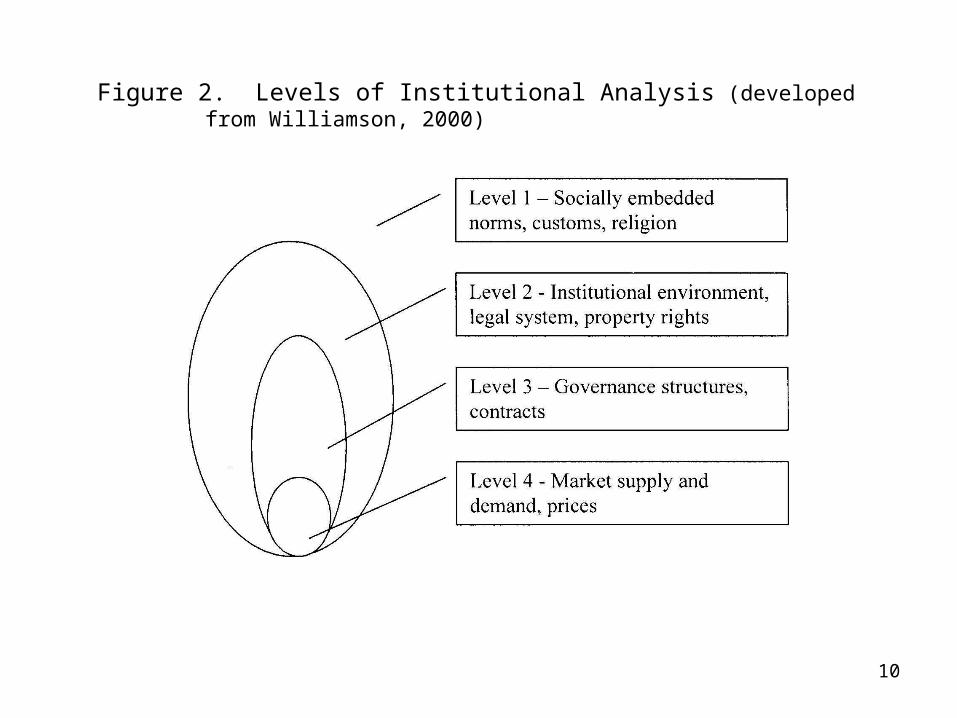
B. Volumetric charges
● Block charges: can vary charges and quantity at
which charge will increase (Figure 3)
● Two-part charge is a fixed charge plus volumetric
charge: resolves conflict between full cost recovery
and efficient pricing
C. Water markets – sale or lease
● Improves water allocation
● May increase farmers’ ability to pay fees
23

24
XI. Key Institutional Arrangements for Cost Recovery
A. Financial autonomy of projects
1. Needed to assure that funds collected are used to operate and improve the project
2. Managers have strong incentives to provide improved service and collect fees
3. Incentives to improve infrastructure: more water to sell
● Yangtze Basin Water Resource Project

25
XI. Key Institutional Arrangements for Cost Recovery – continued
B. Improve incentives (to pay and to collect)
1. Haryana, India: defaulters can lose their land
2. Awati, China: awards and penalties to encourage staff to achieve high
collection rates
3. Bayi Irrigation District, China: awards and fines to encourage staff to collect and turn in fees by deadline (Tables 4 & 5)

26
Table 4. Factors Influencing Fee Collection Rate
N.A = Not available; 1 mu = 0.067 hectare.
CasesFinancial
AutonomyIncentivesto collect
Incentives to pay
User Participation
Systemtransparency Education
Collectionrate
(percent)
Penalty fornon
payment
Improved irrigation service
Awati, China Yes Yes N.A. N.A. Yes N.A. Yes 98
Bayi ID, China Yes Yes Yes Yes Yes Yes N.A. 100
Nanyao IDChina
Yes Yes N.A. N.A. Yes N.A. N.A. 95
ShangdongChina
N.A. N.A. Yes Yes N.A. Yes N.A. 100
Yangtze Basin, China
Yes N.A. N.A. Yes Yes N.A. Yes N.A.
Gujarat, India Yes Yes Yes Yes Yes N.A. N.A. 100
Haryana, India
Partly N.A. Yes N.A. Yes N.A. N.A. 85–95
Mexico Yes N.A. Yes Yes Yes N.A. Yes 90
Alto Rio Lerma,Mexico
Yes Yes N.A. Yes Yes Yes N.A 100
Senegal N.A. N.A. N.A. Yes Yes Yes Yes Covers 100 O&M

27
Cases
Switch to volumetric metering
Pricingstructure
Water-savingtechnology availability
Assuranceof water delivery
Education
Annual saving
Public awareness
Technicalassistance
Awati, China YesIncreasing
block N.A. N.A. Yes N.A. 50m3 /mu
Shangdong,China Yes Volumetric N.A. Yes N.A. N.A. 5 Bm3
Yangtze Basin,China Yes Volumetric N.A. Yes Yes N.A.
1.18 M m3 in WUA
Katepurna, India Yes Volumetric Yes Yes Yes Yes 7.71 M m3
TunisiaAlready
used Volumetric Yes N.A. Yes N.A. N.A.
Mula area, Spain N.A. N.A. Yes Yes N.A. Yes 101 Mm3
Table 5. Factors Influencing Water Use Efficiency
28
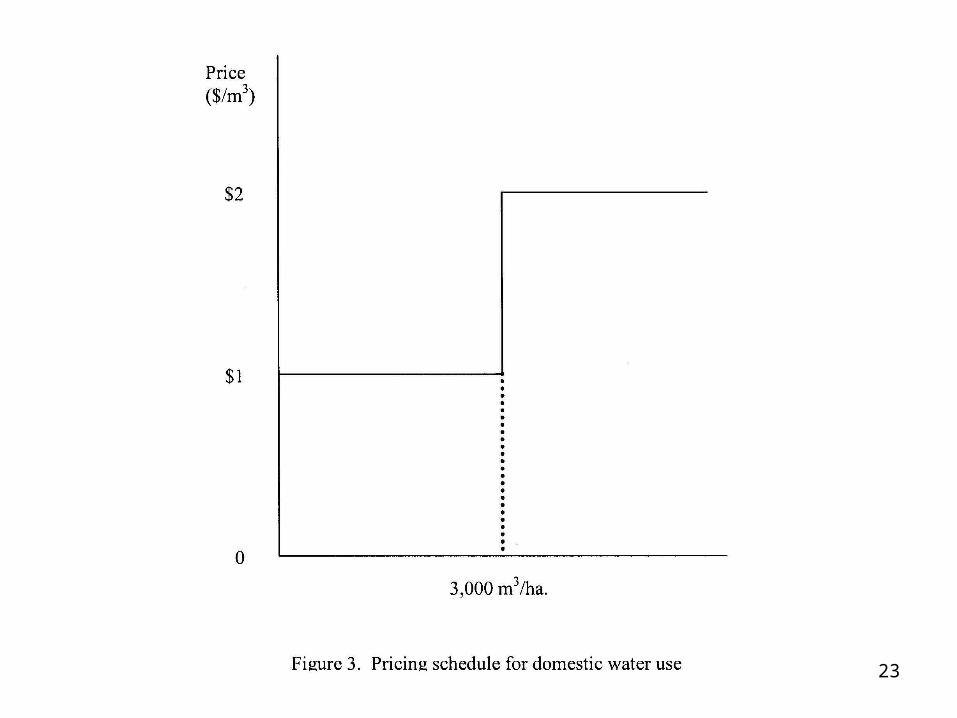
XI. Key Institutional Arrangements for Cost Recovery -- continued
C. Increase user participation and transparency
1. Laur Projects, Philippines: rehabilitation and system turn over to water user associations (WUA)
● Farmer involved in design of rehabilitation and decisions on expenditures
● Cut costs 60%● Collection jumped from 45 to 74%
2. Indonesia and Senegal: WUAs improved project design and cost recovery
3. WUAs in Mexico combined with water rights and payment required before receiving water increased cost recovery
4. Survey of benefits of WUAs in Maharashtra, India
● 75% of farmers in WUAs willing to pay 25% higher fees

29
XI. Key Institutional Arrangements for Costs Recovery – continued
D. Improved service and communication
1. System transparency
● Shangdong, China: IC machines
2. Assurance of water delivery
● Katepurna, India: service contracts
3. Public education
● Katepurna, India and in Mexico

30
XII. Reasons Reform Occurs: Institutions and Public Policies
A. Changes in economic policy and local organizations
• China and Chile (Table 6)
B. Poor infrastructure and water scarcity
• Mula, Spain and Katepurna, India
C. Legal/Institutional arrangement
• Mexico and Chile

31
Good practice Country conditions and policies
Pricing structure and/or technology that
encourages water savings
Assurance and transparency
in water delivery
Public education/technical
assistance Water market
Management transfer
Financial autonomy User participation
Physical conditions
Water scarcity
and droughtcommon
Awati, China; Katepurna,
India; Tunisia
Shangdong, China
Tunisia n.a. Gujarat, IndiaMexico
Gujarat, India
Infrastruc-ture in poor
condition
Mula, Spain Katepurna, India;
Mula, Spain
Katepurna, IndiaMula, Spain
n.a. Mexico Katepurna, India
Economic/political conditions and policies
Economic liberal-ization
Yangtze, China Yangtze,China
n.a. Elqui, Limari and Maipo
rivers in Chile
Awati, Bayi, Nanyao, Yangtze,
China; Mexico
Indonesia; Mexico
Decentral-ization
Shangdong, China
Shangdong,China
Yangtze, China, Alto Rio Lerma,
Mexico
Murray and Darling rivers in Australia
Awati, China; Gujarat, Indai;
Mexico; Sri Lanka
Bayi, Nanyao, Yangtze, China;
Mexico; Sri Lanka; Indonesia
Serious financial
constraints
n.a. n.a. n.a. n.a. Bayi, Nanyao, Awati, China;
Mexico
Bayi, Nanyao, Awati, China;
Mexico
Legal/institutional arrangements
Definition of water rights
n.a. Haryana, India n.a. Siurana-Riu decanyes,
Spain; Cariri, Brazil
Mexico Haryana, India
Effective local
system for enforcing water use
rules
n.a. Bayi, Nanyao, China;
Haryana, India
n.a. Siurana-Riu decanyes,
Spain
n.a. Alto Rio Lerma ID,Mexico
Rights to establish
WUAs
Awati, China Bayi, Nanyao, China;
Bayi, Nanyao, Awati, China
Northern Colorado, USA
Mexico n.a.
Table 6. Country Conditions and Irrigation Practices

32
XI. Conclusions
● There is no one means to improve cost recovery
● Successful strategies vary with different conditions in different countries
● Transparency, financial autonomy, user participation, good service, and better incentives are keys to increasing cost recovery and sustaining water services.

33

34
For irrigation the farm uses drip tape, which is a great way of reducing evaporation by getting the water to the soil surface one drip at a time. The result is a penetrating soak that uses much less water than overhead irrigation and gives a deeper watering. Usually this irrigation method is used with mulch for maximum benefit.

35
URL to access paper and presentation.
http://www.apec.umn.edu/faculty/weaster/