Embed Size (px)
Citation preview

Brandywine Global • ClearBridge Investments • Martin Currie • Permal • QS Investors • Royce & Associates • Western Asset
May 1, 2015
Joseph A. SullivanChairman and CEO
Peter H. NachtweyChief Financial Officer
Fourth Quarter & Fiscal Year 2015 Review
If the wind will not serve, take to the oars.-Latin proverb

Page 1
Important Disclosures
Forward-Looking StatementsThis presentation may contain forward-looking statements within the meaningof the Private Securities Litigation Reform Act of 1995.
These forward-looking statements are not statements of facts or guaranteesof future performance, and are subject to risks, uncertainties and other factors that may cause actual results to differ materially from those discussed in the statements.
For a discussion of these risks and uncertainties, please see “Risk Factors” and “Management’s Discussion and Analysis of Financial Condition and Results of Operations” in the Company’s Annual Report on Form 10-K for the fiscal year ended March 31, 2014 and in the Company’s quarterly reports on Form 10-Q.
Non-GAAP Financial MeasuresThis presentation includes certain non-GAAP financial measures. These non-GAAP measures are in addition to, not a substitute for or superior to, measures of financial performance determined in accordance with GAAP. The company undertakes no obligation to update the information contained in this presentation to reflect subsequently occurring events or circumstances.

Page 2
Company Highlights
Fiscal Fourth Quarter
Net Income $83.0M or $0.73 per diluted share
Assets Under Management $703B
Long-term net inflows $6.2B- 4th consecutive quarter of positive long-term inflows
Global Distribution quarterly gross and net sales of $22.1B and $5.3B, respectively
Repurchased 1.6M shares
Announced 25% increase in quarterly dividend

Assets Under Management ($ billions)
Affiliate1 Mar 15 Dec 14 % Change Mar 14
$445.9 $455.5 (2%) $467.1
110.5 108.1 2% 95.9
29.6 32.1 (8%) 38.6
66.4 63.3 5% 52.2
19.2 20.0 (4%) 19.7
13.9 13.6 2% 11.3
12.4 11.8 5% 2.2
3
Page 3
1 Primary affiliates ordered by contribution to fiscal year 2015 pre-tax earnings2 Includes Legg Mason Capital Management. Mar 14 has been restated3 Mar 14 consists of Batterymarch and Legg Mason Global Asset Allocation, which are being integrated into QS Investors over time4 Mar 15 and Dec 14 include $3.6B and $3.0 of AUM from Legg Mason Australian Equities, respectively, which was integrated into Martin
Currie. Mar 14 represents Legg Mason Australian Equities only
54%
28%
18%
Fixed Inco me Equity Liq uidity
Total AUM $703B
64%
36%
US Non-US
74%
26%
Institutional Retail
By Asset Class
By Client Type
By Client Domicile
2
4

Page 4
Fiscal Fourth Quarter Affiliate Overview
• $3.3B total inflows− $3.0B fixed income− $0.3B equity
• $1.5B unfunded wins
• $0.9B outflows• $0.1B unfunded wins
• $1.5B inflows• 9th consecutive quarter
of inflows• $0.7B unfunded wins
• Breakeven flows• $1.5B unfunded wins
• $2.7B outflows
• $4.9B long-term inflows • $15.3B liquidity outflows• $3.4B unfunded wins
• $0.3B inflows• $0.5B unfunded wins

Page 5Page 5
Acknowledgements and Awards in FY 2015 • Morningstar’s 2014 U.S. Fixed-Income Fund Manager of the Year award1
• Institutional Investor award - Core Fixed Income• 2015 Lipper Fund Award – consistent, strong risk-adjusted returns against peers• Two Benchmark Magazine2 2014 Fund of the Year Awards - Best-in-class, Multi-Alternative
Strategy and Global High Yield• Asia Investor magazine 2014 Marquee Award - Best Institutional Product Strategy for
Macro Opportunities• Pension & Investments - Best Places to Work in Money Management
1 Morningstar, Inc. named the team of Ken Leech, Carl Eichstaedt, and Mark Lindbloom, for the Western Asset Core Bond (WACSX) and Western Asset Core Plus Bond (WAPSX) Funds as the winner of the Morningstar 2014 U.S. Fixed-Income Fund Manager of the Year award2 Benchmark Magazine is an Asian trade publication
• Barron’s “Best Mutual Fund Families of 2014” – Top 10 ranking• Insured Retirement Institute’s 2015 Marketing Innovation Award - "Aging and Its Financial
Implications: Planning for Housing"
• Institutional Investor award - Large Cap Value Equity• Two Asia Asset Management awards - Global Bond, 3-year and 10-year performance
• Money magazine "Money 50" list - Royce Opportunity Fund (two years running)
• 2015 Lipper Fund Award – consistent, strong risk-adjusted returns • Two Benchmark Magazine2 2014 Fund of the Year Awards - Outstanding Achiever, US Equity
and US Mid-Cap Equity• Pension & Investments - Best Places to Work in Money Management

Page 6
Momentum Continues in Global Distribution
1 For LMGD, Assets Under Advisement is included in long-term assets, gross sales and net sales. Net sales equals gross sales less redemptions. As of March 31, 2015 long-term assets include $8.2B of AUA. Quarterly AUA gross and net sales for F4Q15 are $1.2B and $0.9B, respectively, and for F3Q15 are $1.2B and $0.7B, respectively
Total Long-Term Assets1: $278B($ Billions) F4Q15 F3Q15 FY15 FY14Gross Sales1:
US $14.3 $17.9 $54.8 $41.4Int’l 7.8 6.5 27.7 23.8Total $22.1 $24.4 $82.5 $65.2
Net Sales1:US $ 2.2 $ 6.5 $11.6 ($1.5)Int’l 3.1 0.4 7.7 1.4Total $ 5.3 $ 6.9 $19.3 ($0.1)
• Gross sales of $22.1B, net sales of $5.3B • Sixth consecutive quarter of positive net sales
– Both US and International positive• Quarterly global redemption rate at 25%
– US redemption rate 21%• Annual record gross and net sales• Positive net sales across all regions for quarter
and fiscal year
Distribution Highlights
Top Funds Driving Gross Sales FY15Western Asset Core Plus Bond FundClearBridge Aggressive Growth FundLegg Mason ClearBridge US Aggressive Growth FundLM WA Macro Opportunities Bond FundWestern Asset Core Bond FundLegg Mason Brandywine Global Opportunities Bond FundLM BW Global Fixed Income Absolute Return FundClearBridge Small Cap Growth FundWestern Asset Short Duration Municipal Income FundLM BW Alternative Credit Fund
44.050.6 49.0
56.665.2
82.5
(4.3) (0.6)(2.4) 2.2 (0.1)
19.3
(20.0)
0.0
20.0
40.0
60.0
80.0
100.0
FY10 FY11 FY12 FY13 FY14 FY15
Gross Sales Net Sales
Annual Gross and Net Sales Trends ($B)

12.6
17.8
23.526.3
$0
$10
$20
$30
F1Q13 F1Q14 F1Q15 F4Q15
Page 7
Expanding Investment Capabilities and Products
+ LM Capability +/‒ LM Capability, but Sub-Scale ‒ LM No Capability
Please see Appendix for a definition of Next Generation Active
Next Generation Active AUM ($B)
• Expanded multi-asset class solutions capabilities through QS Investors acquisition• Expanded international active equity capabilities with Martin Currie acquisition• Added new team to develop ETF vehicles• Launched 23 new products, 19 of which are Next Generation Active strategies
Closing Product Gaps Growing Next Generation Active Products
F1Q13 - F4Q1531% CAGR

Page 8
Investment Performance
% of Long-Term U.S. Fund Assets beating Lipper Category Average2
1 See appendix for details regarding strategy performance2 Includes open-end, closed-end, and variable annuity funds. Source: Lipper Inc.
Past performance is no guarantee of future results. The information shown above does not reflect the performance of any specific fund. Individual fund performance will differ.
% of Strategy AUM beating Benchmark1
55%
65%
63%
70%
62%
63%
60%
71%
44%
63%
56%
68%
0% 10% 20% 30% 40% 50% 60% 70% 80% 90% 100%
1 Yr
3 Yr
5 Yr
10 Yr
Mar 14 Dec 14 Mar 15
67%
84%
86%
88%
75%
85%
86%
91%
75%
87%
84%
92%
0% 10% 20% 30% 40% 50% 60% 70% 80% 90% 100%
1 Yr
3 Yr
5 Yr
10 Yr
Mar 14 Dec 14 Mar 15

Page 9
Financial Highlights Fourth Quarter FY 2015
• Net Income of $83.0M, or $0.73 per diluted share• Adjusted income1 of $117.9M, or $1.03 per diluted share
• Average AUM of $707.1B, down $3.8B– Long-term average AUM increased $5.7B or 1% compared to prior quarter
• Operating revenues $702.3M, down $16.6M or 2% from the prior quarter– Driven by two less days in the quarter and lower performance fees
• Operating expenses $573.4M, down $26.2M or 4% from the prior quarter– Lower compensation on lower operating revenues
– Last quarter included final QS Integration costs and transaction costs related to sale of LMIC
• Operating income $128.9M, operating margin 18.4%
• Operating income, as adjusted1 $132.9M, operating margin, as adjusted1 23.8%
• Repurchased 1.6M shares
1 See appendix for GAAP reconciliation

Page 10
Operating Results Fourth Quarter FY 2015
Mar 15Qtr
Dec 14Qtr
Mar 14Qtr FY 15 FY 14
Operating Revenues $702.3 $719.0 $681.4 $2,819.1 $2,741.8
Operating Expenses 573.4 599.6 562.1 2,320.9 2,310.9
Operating Income 128.9 119.4 119.3 498.2 430.9
Net Income 83.0 77.0 68.9 237.1 284.8
Diluted EPS 0.73 0.67 0.58 2.04 2.33
Adjusted Income1 117.9 113.1 103.5 378.8 417.8
Adjusted Income per diluted share1 1.03 0.98 0.86 3.26 3.41
Operating Margin, as adjusted1 23.8% 21.4% 23.3% 23.0% 22.0%
Effective Tax Rate GAAP2 33.8% 32.2% 41.9% 34.0% 32.8%
($ millions, exceptper share amounts)
1 See Appendix for GAAP reconciliation2 Includes the impact of Consolidated Investment Vehicles (CIVs) of (0.2%), (0.8%), and 1.5% in Mar 15, Dec 14, and Mar 14, respectively and (0.5%) and 0.2% for FY15 and FY14

Page 11
Assets Under Management by Asset Class
• AUM decreased $6.4B from prior quarter− Liquidity outflows of $15.3B− Long-term inflows of $6.2B− Market appreciation/other of $2.7B (includes $6.3B of negative FX impact)
1 Mar 14 includes $12.6B in fixed income AUM related to the low fee global sovereign mandate that has been reclassified as AUA
$150 $141 $154 $143 $127
$365 $367 $360 $367 $376
$187 $196 $194 $199 $200
$702 $704 $708 $709 $703
0
200
400
600
800
1,000
Mar 14 Jun 14 Sep 14 Dec 14 Mar 15Liquidity Fixed Income Equity
($ billions)
21% 20% 18%
52% 54%52%
27% 28%28%
% MixMar 14
% MixDec 14
% MixMar 15
1

(0.8)
2.5
(0.9)
9.9
7.6
-4-202468
10
Mar 14 Jun 14 Sep 14 Dec 14 Mar 15
($ B
illio
ns)
Fixed Income
Page 12
Net Flows - Quarterly
• Fixed Income inflows driven by Global Opportunistic $2.8B, Global Sovereign $2.0B, and Limited Duration $1.3B
• Equity outflows driven by Small Cap of $2.6B, partially offset by Large Cap and Equity Income inflows of $1.1B and $0.5B, respectively
1 Low fee global sovereign mandate outflows for Jun 14 ($1.0B), Sep 14 ($0.9B), Dec 14 ($0.8), and Mar 15 ($0.5B) are excluded from the table. Mar 14 includes outflows of ($1.4B)
0.5
(1.8)
1.6
(1.1) (1.4)-4-202468
10
Mar 14 Jun14 Sep 14 Dec 14 Mar 15
($ B
illio
ns)
Equity
(0.3)
0.7 0.7
8.8
6.2
-4
-2
0
2
4
6
8
10
Mar 14 Jun 14 Sep 14 Dec 14 Mar 15
($ B
illion
s)
Total Long-Term
8.6
(8.9)
12.7
(10.6)(15.3)-20
-15
-10
-5
0
5
10
15
Mar 14 Jun 14 Sep 14 Dec 14 Mar 15
($ B
illio
ns)
Liquidity
8.3
(8.2)
13.4
(1.8)
(9.1)
-20
-15
-10
-5
0
5
10
15
Mar 14 Jun 14 Sep 14 Dec 14 Mar 15
($ B
illio
ns)
Total Flows
1
30.0
32.5
35.0
37.5
40.0
$-
$200
$400
$600
$800
Mar 13 Jun 13 Sep 13 Dec 13 Mar 14 Jun 14 Sep 14 Dec 14 Mar 15
Advi
sory
Fee
Yie
ld (b
ps)
Aver
age
AUM
($B
)
Liquidity Fixed Income Equity Advisory Fee Yie ld
Page 13
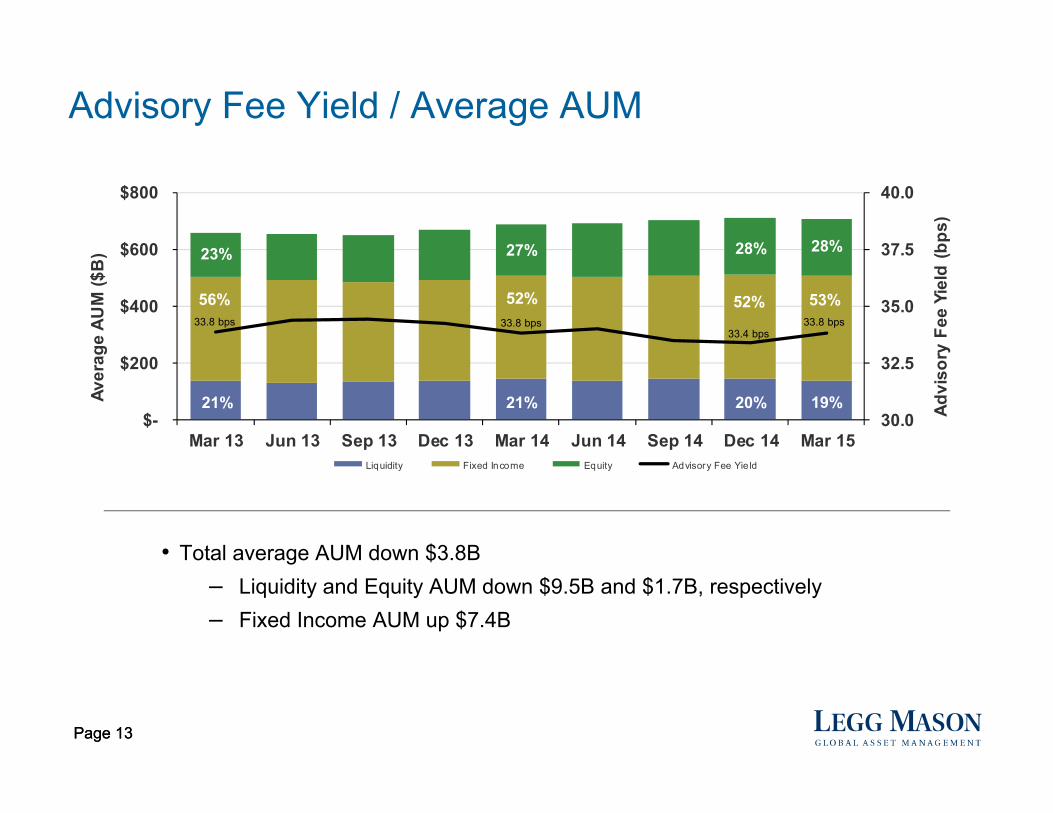
Advisory Fee Yield / Average AUM
Page 13
23%
56%
21%
27%
52%
21%
53%
19%
28%
• Total average AUM down $3.8B– Liquidity and Equity AUM down $9.5B and $1.7B, respectively– Fixed Income AUM up $7.4B
52%
20%
28%
33.8 bps 33.8 bps33.4 bps
33.8 bps

$600
$573
($16) ($4) ($7) $2 ($2)
$500
$525
$550
$575
$600
$625
Dec Qtr Comp &Benefits
D&S Expense Occupancy Comm & Tech Other Mar Qtr
Operating Expenses
Page 14
$ in
Mill
ions
• D&S expenses decreased primarily due to two less days in the quarter• Decrease in occupancy expenses largely driven by a $6.8M lease charge related to QS
integration in the prior quarter

Compensation and Benefits
• Salary and incentives decrease driven by lower performance fees and two less days of revenue in the quarter
• Benefits and payroll taxes increased due to higher seasonal benefit costs, of which approximately half offset in salary and incentives
• Prior quarter transition costs and severance included accelerated deferred compensation related to the sale of LMIC and QS Investors integration costs
Page 151 Net revenue is equal to operating revenues, as adjusted
($ millions)% of % of $
Mar Qtr Net Rev. 1 Dec Qtr Net Rev. 1 ChangeSalary and incentives 243.8$ 44% 260.4$ 46% (16.6)$ Benefits and payroll taxes 56.2 10% 48.1 8% 8.1 Subtotal Compensation and benefits 300.0 54% 308.5 54% (8.5) Transition costs and severance 0.5 0% 9.0 2% (8.5) MTM deferred comp. and seed investments 3.1 0% 2.2 0% 0.9 Total Compensation and benefits 303.6$ 54% 319.7$ 56% (16.1)$

Page 16
Operating Margin, as Adjusted
10.4%
17.9%
22.3%24.1% 23.3% 22.9%
23.8%
21.4%
23.8%
5%
10%
15%
20%
25%
$400
$500
$600
$700
$800
Mar 13 Jun 13 Sep 13 Dec 13 Mar 14 Jun 14 Sep 14 Dec 14 Mar 15
Op M
argi
n, a
s Ad
j
Aver
age
AUM
($B)
Avg AUM Operating Margin, as adjusted
Note: See Appendix for GAAP reconciliation
• Impact of QS Investors integration and costs related to the acquisition of Martin Currie and sale of LMIC approximately 3.3% on prior quarter

Page 17
$0.67 $0.73 $0.06 ($0.05) $0.02 $0.03
$- $0.10 $0.20 $0.30 $0.40 $0.50 $0.60 $0.70 $0.80 $0.90
Dec Qtr EPS Q3 Items Lower Op Inc / net ofBuyback
Chg in MTM Discrete Tax Items Mar Qtr EPS
EPS
1
• Lower operating income driven by two less days in the quarter, lower performance fees and higher seasonal costs, partially offset by increased revenue on higher average long-term AUM
• Q3 items include QS Investors integration, costs related to purchase of Martin Currie and sale of LMIC, partially offset by a reduction in tax reserves and gain on LMIC
1 Includes QS integration costs $12.8M, costs related to purchase of Martin Currie and sale of LMIC $5.7M, partially offset by iia reduction in tax reserves $3.5M and gain on LMIC $1.9M2 Includes changes in state tax apportionments and prior year provision to return adjustments
Fourth Quarter Earnings Per Share Rollforward
2

Consistent and Balanced Approach to Capital Allocation
Page 18
163
150140
125117 111
75
100
125
150
175
Mar 10 Mar 11 Mar 12 Mar 13 Mar 14 Mar 15
Shares Outstanding (M)
$0.12 $0.24
$0.32 $0.44
$0.52 $0.64
$0.80
$0.00$0.10$0.20$0.30$0.40$0.50$0.60$0.70$0.80
Mar 10 Mar 11 Mar 12 Mar 13 Mar 14 Mar 15 Jun 15
858
529659 665 670
$0
$300
$600
$900
$1,200
Mar 14 Jun 14 Sep 14 Dec 14 Mar 15
Quarterly Cash Position ($M) Seed Investments of $391M 2
1
1 Excludes $750M of cash held on June 30, 2014 but used to repay debt on July 23, 2014 2 Market value as of March 31, 2015
32% reduction since March 2010
39%
27%
34%
Equity Fixed Income Alternative
Annualized Quarterly Dividend Declared (Per Share)

Page 19
Key Takeaways
• Return to growth
• Well diversified business model
• High performing distribution platform
• Focused on long-term profitability
• Strategic capital deployment

Appendix

• F4Q15 tax rate reflects adjustments in apportionment factors in calculation of state deferred tax assets
• Lower cash tax rate due to higher anticipated use of tax shield in FY16
• FY16 tax rate does not reflect impact of NYC law change related to deferred tax assets
Page 21
Appendix – Significant Tax Benefit$3.0B of Future Income Sheltered
$1.2$0.5
$1.8
$0.7
$0
$1
$2
$3
$4
$5
Tax Shield Tax Benefit
$ in
Bill
ions
NOL/FTC Purchased Goodwill
34%36%
6% 5%
0%
15%
30%
45%
F4Q15 FY16 Projected
Tax
Rat
e
Data as of March 31, 2015* Excludes the impact of CIVs
• Future income of $3.0B is sheltered from state and federal income tax, based on usage of NOL, FTC carryforwards and amortization of tax deductible goodwill
$3.0B
$1.2B
Tax Expense* Cash Tax Expense

Page 22
Appendix – GAAP ReconciliationAdjusted Income1
($ millions, except per share amounts) Mar 15 Dec 14 Mar 14 Mar 15 Mar 14Net Income Attributable to Legg Mason, Inc. 83.0$ 77.0$ 68.9$ 237.1$ 284.8$ Plus (less):
Amortization of intangible assets 0.6 0.7 0.9 2.6 12.3 Contingent consideration fair value adjustment - - - - 5.0 Deferred income taxes on intangible assets:
Tax amortization benefit 34.3 35.4 33.7 139.1 134.9 U.K. tax rate adjustment - - - - (19.2)
Adjusted Income 117.9$ 113.1$ 103.5$ 378.8$ 417.8$
Net Income per Diluted Share Attributableto Legg Mason, Inc. 0.73$ 0.67$ 0.58$ 2.04$ 2.33$ Plus (less): Amortization of intangible assets - 0.01 - 0.02 0.10
Contingent consideration fair value adjustment - - - - 0.04 Deferred income taxes on intangible assets:
Tax amortization benefit 0.30 0.30 0.28 1.20 1.10 U.K. tax rate adjustment - - - - (0.16)
Adjusted Income per Diluted Share 1.03$ 0.98$ 0.86$ 3.26$ 3.41$
1 See explanations for Use of Supplemental Non-GAAP Financial Information in earnings release.
Years EndedQuarters Ended
RECONCILIATION OF NET INCOME ATTRIBUTABLE TO LEGG MASON, INC.TO ADJUSTED INCOME1

Page 23
Appendix – GAAP ReconciliationOperating Margin, as adjusted1
($ millions) Mar 13 Jun 13 Sep 13 Dec 13 Mar 14 Jun 14 Sep 14 Dec 14 Mar 15 Mar 14 Mar 15Operating Revenues, GAAP basis 667.8$ 670.4$ 669.9$ 720.1$ 681.4$ 693.9$ 703.9$ 719.0$ 702.3$ 2,741.8$ 2,819.1$ Plus (less): - - Operating revenues eliminated upon - - consolidation of investment vehicles 0.6 0.6 0.5 0.5 0.3 0.2 0.2 0.2 0.2 1.9 0.7 Distribution and servicing expense excluding - - consolidated investment vehicles (142.3) (170.1) (155.1) (148.8) (144.9) (148.7) (155.1) (147.5) (143.5) (619.0) (594.7) Operating Revenues, as Adjusted 526.1$ 500.9$ 515.3$ 571.8$ 536.8$ 545.4$ 549.0$ 571.7$ 559.0$ 2,124.7$ 2,225.1$
Operating Income (Loss), GAAP basis 43.0$ 83.5$ 106.4$ 121.7$ 119.3$ 119.5$ 130.4$ 119.4$ 128.9$ 430.9$ 498.1$ Plus (less): Gains on deferred compensation and seed investments 7.2 1.9 4.2 6.5 4.4 4.5 (0.4) 2.1 3.1 17.0 9.4
Amortization of intangible assets 3.5 3.6 3.6 4.2 0.9 0.9 0.5 0.7 0.6 12.3 2.6 Contingent consideration fair value adjustment - - - 5.0 - - - - - 5.0 - Operating income and expenses of consolidated investment vehicles 0.8 0.7 0.6 0.6 0.5 0.2 0.2 0.2 0.3 2.4 1.0 Operating Income, as Adjusted 54.5$ 89.7$ 114.8$ 138.0$ 125.1$ 125.1$ 130.7$ 122.4$ 132.9$ 467.6$ 511.1$
Operating Margin, GAAP basis 6.4% 12.5% 15.9% 16.9% 17.5% 17.2% 18.5% 16.6% 18.4% 15.7% 17.7%Operating Margin, as Adjusted 10.4% 17.9% 22.3% 24.1% 23.3% 22.9% 23.8% 21.4% 23.8% 22.0% 23.0%
1 See explanations for Use of Supplemental Data as Non-GAAP Financial Information in earnings release. Note: Adjusted results have been changed to remove the impact of Amortization of intangible assets. Prior periods have been restated.
Years EndedQuarters Ended

Page 24
Appendix - Asset & Revenue Diversity
Total AUM $703B
FY 15 Operating Revenues $2.8B
Data as of March 31, 2015
54%
28%
18%
Fixed Income Equity Liquidity
64%
36%
US Non-US
74%
26%
Institutional Retail
By Asset Class
By Client Type
By Client Domicile
38%47%
11%4%
Fixed Income Equity Alternative Liquidity
66%
34%
US Non-US
49% 51%
Institutional Retail
By Asset Class
By Client Type
By Client Domicile
Page 25
March 31, 2015 March 31, 2014
1-Year 3-Year 5-Year 10-Year 1-Year 3-Year 5-Year 10-Year
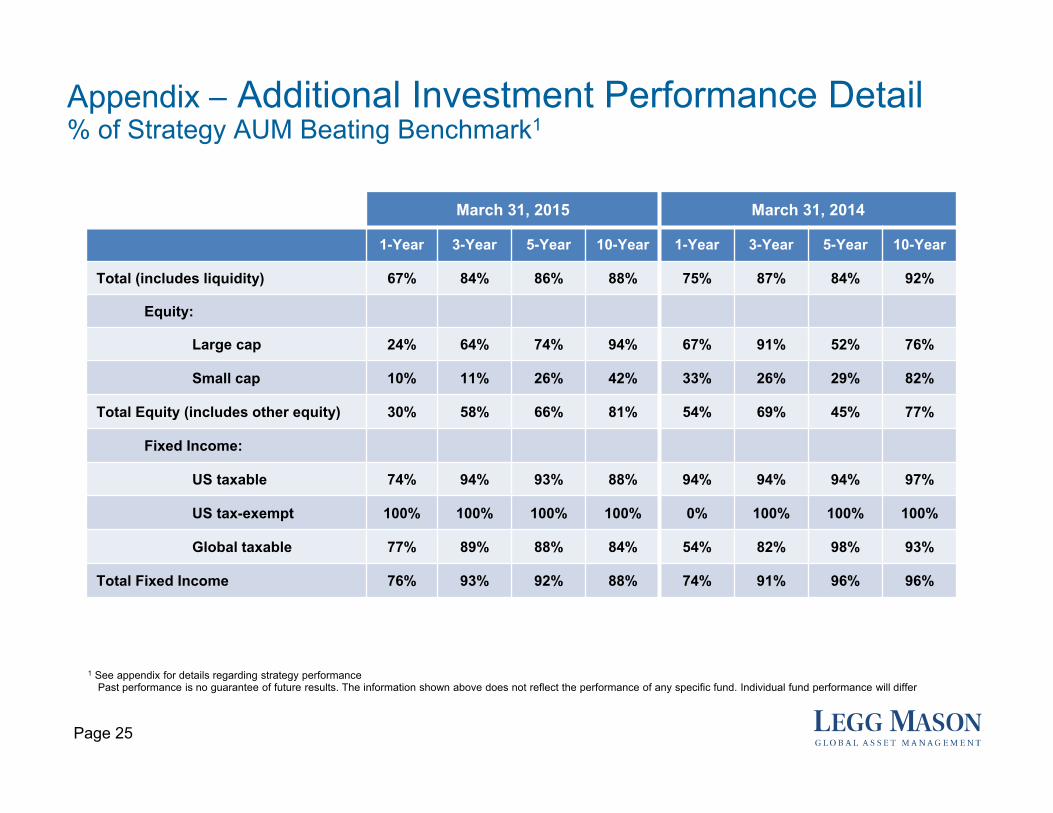
Total (includes liquidity) 67% 84% 86% 88% 75% 87% 84% 92%
Equity:
Large cap 24% 64% 74% 94% 67% 91% 52% 76%
Small cap 10% 11% 26% 42% 33% 26% 29% 82%
Total Equity (includes other equity) 30% 58% 66% 81% 54% 69% 45% 77%
Fixed Income:
US taxable 74% 94% 93% 88% 94% 94% 94% 97%
US tax-exempt 100% 100% 100% 100% 0% 100% 100% 100%
Global taxable 77% 89% 88% 84% 54% 82% 98% 93%
Total Fixed Income 76% 93% 92% 88% 74% 91% 96% 96%
Appendix – Additional Investment Performance Detail% of Strategy AUM Beating Benchmark1
1 See appendix for details regarding strategy performanceIiiiPast performance is no guarantee of future results. The information shown above does not reflect the performance of any specific fund. Individual fund performance will differ

Page 26
March 31, 2015 March 31, 2014
1-Year 3-Year 5-Year 10-Year 1-Year 3-Year 5-Year 10-Year
Total (excludes liquidity) 55% 65% 63% 70% 44% 63% 56% 68%
Equity:
Large cap 46% 82% 73% 69% 49% 86% 55% 54%
Small cap 15% 19% 21% 59% 27% 19% 25% 72%
Total Equity (includes other equity) 38% 57% 53% 63% 39% 55% 42% 60%
Fixed Income:
US taxable 80% 87% 86% 86% 80% 85% 92% 85%
US tax-exempt 83% 57% 60% 88% 27% 61% 68% 86%
Global taxable 79% 86% 81% 55% 27% 86% 84% 86%
Total Fixed Income 80% 78% 77% 84% 54% 78% 83% 86%
Appendix – Additional Investment Performance Detail % of Long-Term U.S. Fund Assets beating Lipper Category Average1
1 Includes open-end, closed-end, and variable annuity funds. Source: Lipper Inc. iiPast performance is no guarantee of future results. The information shown above does not reflect the performance of any specific fund. Individual fund performance will differ

Page 27
Appendix – Strategy PerformanceFor purposes of investment performance comparisons, strategies are an aggregation of discretionary portfolios (separate accounts, investment funds, and other products) into a single group that represents a particular investment objective. In the case of separate accounts, the investment performance of the account is based upon the performance of the strategy to which the account has been assigned. Each of our asset managers has its own specific guidelines for including portfolios in their strategies. For those managers which manage both separate accounts and investment funds in the same strategy, the performance comparison for all of the assets is based upon the performance of the separate account.
Approximately ninety percent of total AUM is included in strategy AUM as of March 31, 2015, although not all strategies have three, five, and ten year histories. Total strategy AUM includes liquidity assets. Certain assets are not included in reportedperformance comparisons. These include: accounts that are not managed in accordance with the guidelines outlined above; accounts in strategies not marketed to potential clients; accounts that have not yet been assigned to a strategy; and certainsmaller products at some of our affiliates.
Past performance is not indicative of future results. For AUM included in institutional and retail separate accounts and investment funds managed in the same strategy as separate accounts, performance comparisons are based on gross-of-fee performance. For investment funds (including fund-of-hedge funds) which are not managed in a separate account format, performance comparisons are based on net-of-fee performance. These performance comparisons do not reflect the actual performance of any specific separate account or investment fund; individual separate account and investment fund performance may differ. The information in this presentation is provided solely for use in connection with this presentation, and is not directed toward existing or potential clients of Legg Mason.

Appendix: Next Generation Active ProductsNext Generation Active products are defined as long-term retail products that focus on, invest in or are managed to:
• The four Casey Quirk New Active strategies:
– Alternatives: Liquid alternative products that invest (a) directly or synthetically in energy, property, infrastructure, commodities or other real assets, or (b) in long-short strategies across all asset classes.
– Global Tactical Asset Allocation/Multi-Asset Class Solutions: Multi-asset class, outcome-oriented and/or hedged strategies
– Unconstrained Fixed Income: benchmark agnostic multi-sector strategies
– Leveraged Loans: Bank Loans and Direct Lending
• Frontier markets, unconstrained benchmark-agnostic equity, regional fixed income domiciled outside that region, or recently commercialized equity or fixed income sub-sectors
• Alternative beta schemes (active management IP embedded into next generation indices)
Page 28