Embed Size (px)
Citation preview
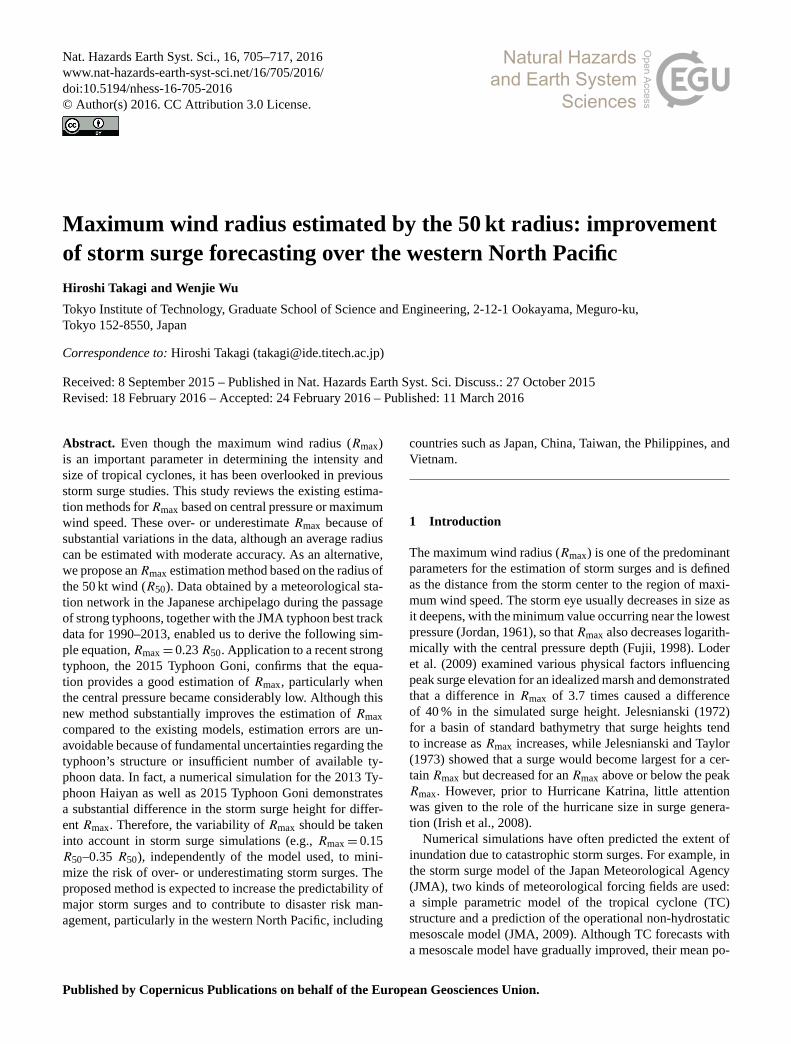
Nat. Hazards Earth Syst. Sci., 16, 705–717, 2016
www.nat-hazards-earth-syst-sci.net/16/705/2016/
doi:10.5194/nhess-16-705-2016
© Author(s) 2016. CC Attribution 3.0 License.
Maximum wind radius estimated by the 50 kt radius: improvement
of storm surge forecasting over the western North Pacific
Hiroshi Takagi and Wenjie Wu
Tokyo Institute of Technology, Graduate School of Science and Engineering, 2-12-1 Ookayama, Meguro-ku,
Tokyo 152-8550, Japan
Correspondence to: Hiroshi Takagi ([email protected])
Received: 8 September 2015 – Published in Nat. Hazards Earth Syst. Sci. Discuss.: 27 October 2015
Revised: 18 February 2016 – Accepted: 24 February 2016 – Published: 11 March 2016
Abstract. Even though the maximum wind radius (Rmax)
is an important parameter in determining the intensity and
size of tropical cyclones, it has been overlooked in previous
storm surge studies. This study reviews the existing estima-
tion methods forRmax based on central pressure or maximum
wind speed. These over- or underestimate Rmax because of
substantial variations in the data, although an average radius
can be estimated with moderate accuracy. As an alternative,
we propose anRmax estimation method based on the radius of
the 50 kt wind (R50). Data obtained by a meteorological sta-
tion network in the Japanese archipelago during the passage
of strong typhoons, together with the JMA typhoon best track
data for 1990–2013, enabled us to derive the following sim-
ple equation, Rmax= 0.23 R50. Application to a recent strong
typhoon, the 2015 Typhoon Goni, confirms that the equa-
tion provides a good estimation of Rmax, particularly when
the central pressure became considerably low. Although this
new method substantially improves the estimation of Rmax
compared to the existing models, estimation errors are un-
avoidable because of fundamental uncertainties regarding the
typhoon’s structure or insufficient number of available ty-
phoon data. In fact, a numerical simulation for the 2013 Ty-
phoon Haiyan as well as 2015 Typhoon Goni demonstrates
a substantial difference in the storm surge height for differ-
ent Rmax. Therefore, the variability of Rmax should be taken
into account in storm surge simulations (e.g., Rmax= 0.15
R50–0.35 R50), independently of the model used, to mini-
mize the risk of over- or underestimating storm surges. The
proposed method is expected to increase the predictability of
major storm surges and to contribute to disaster risk man-
agement, particularly in the western North Pacific, including
countries such as Japan, China, Taiwan, the Philippines, and
Vietnam.
1 Introduction
The maximum wind radius (Rmax) is one of the predominant
parameters for the estimation of storm surges and is defined
as the distance from the storm center to the region of maxi-
mum wind speed. The storm eye usually decreases in size as
it deepens, with the minimum value occurring near the lowest
pressure (Jordan, 1961), so that Rmax also decreases logarith-
mically with the central pressure depth (Fujii, 1998). Loder
et al. (2009) examined various physical factors influencing
peak surge elevation for an idealized marsh and demonstrated
that a difference in Rmax of 3.7 times caused a difference
of 40 % in the simulated surge height. Jelesnianski (1972)
for a basin of standard bathymetry that surge heights tend
to increase as Rmax increases, while Jelesnianski and Taylor
(1973) showed that a surge would become largest for a cer-
tain Rmax but decreased for an Rmax above or below the peak
Rmax. However, prior to Hurricane Katrina, little attention
was given to the role of the hurricane size in surge genera-
tion (Irish et al., 2008).
Numerical simulations have often predicted the extent of
inundation due to catastrophic storm surges. For example, in
the storm surge model of the Japan Meteorological Agency
(JMA), two kinds of meteorological forcing fields are used:
a simple parametric model of the tropical cyclone (TC)
structure and a prediction of the operational non-hydrostatic
mesoscale model (JMA, 2009). Although TC forecasts with
a mesoscale model have gradually improved, their mean po-
Published by Copernicus Publications on behalf of the European Geosciences Union.
706 H. Takagi and W. Wu: Maximum wind radius estimated by the 50 kt radius
sition error remains around 100 km for 24 h forecasts (JMA,
2009). Furthermore, high spatial resolution is needed to re-
solve the pressure gradients near the radius of maximum
winds; thus, forecasted “low-resolution” storms tend to be
weaker than they can be (Persing and Montgomery, 2005).
The relationship between TCs and climate can be subtle,
while differences in the spatial and temporal scales are large
(Elsner and Jagger, 2013). In addition, it was found that the
JMA Global Spectral and Typhoon models (GSMs) under-
estimate the intensity of TCs in their predictions of the cen-
tral pressure and maximum wind speed (Heming and Go-
erss, 2010). Therefore, the JMA still uses the parametric TC
model to account for the errors in the TC track forecasts and
their influence on storm surge prediction (JMA, 2009).
In a parametric model, TCs are defined by a few param-
eters (e.g., wind speed, central pressure, Rmax). Such recon-
structions are frequently used to force storm surge and wave
models or models of wind damage applied to an urban area
and are thus useful from operational forecasting and warn-
ing to climatological risk assessment and engineering design
(Kepert, 2010; Takagi et al., 2011). However, it has been
commonly recognized that the results drawn from individual
storms may not necessarily be representative for the majority
of storms (Shea and Gray, 1973).
For hurricanes with central pressures of 909–993 hPa in
1893–1979, the mean Rmax was 47 km (Hsu and Yan, 1998).
Fujii (1998) investigated typhoons with central pressures
≤ 980 hPa that hit the Japanese main islands and found an
average Rmax of 84–98 km, depending on the track.
However, the Rmax should be selected depending on
the characteristics of each typhoon. Therefore, several es-
timation models for Rmax have been proposed. Kossin et
al. (2007) correlated the Rmax with the TC eye size (km),
when a clear symmetric eye was identifiable, obtaining
Rmax= 2.8068+ 0.8361 Reye, where Reye is the infrared-
measured eye size (km). Although this method demonstrated
good accuracy, it has not yet been employed for the western
North Pacific (WNP).
Quiring et al. (2011) used the maximum wind ve-
locity (Vmax) to estimate Rmax for the entire Atlantic
basin: Rmax= 49.67 − 0.24 Vmax, with Rmax and Vmax
in nautical miles (nmi; 1 nm= 1.85 km) and knots (kts;
1 kt= 0.52 ms−1), respectively. The Vmax is a relatively eas-
ily available parameter typically included in a TC warning.
However, it must be noted that the maximum wind veloci-
ties are differently defined, depending on the oceanic basin
through which the TC transits. For instance, the JMA clas-
sifies the typhoon winds based on the 10 min maximum sus-
tained wind speed, while the United States National Weather
Service (NWS) defines sustained winds using 1 min av-
erages. These differences in classification inevitably intro-
duce differences in the relationship between Rmax and Vmax.
Therefore the Quiring et al. (2011) formula is not immedi-
ately applicable to TCs in other basins, though an empirical
relationship between 1 and 10 min mean wind speeds could
be applied for their conversion (Sampson et al., 1995).
The empirical formula developed by the National Institute
for Land and Infrastructure Management (NILIM) (Kato,
2005) has been often used to estimate the Rmax for storm
surge simulations, particularly among Japanese coastal en-
gineers (e.g., Takagi et al., 2012; Nakajo et al., 2014), pri-
marily because its estimation based on the TC’s central
pressure (Pc), Rmax= 80 − 0.769 (950 − Pc) (Pc < 950),
with Rmax and Pc in km and hPa, respectively, is conve-
nient. The Port and Airport Research Institute (PARI) and
the Japan Weather Association (JWA) have also proposed ex-
ponential formulas of Rmax (km) using the central pressure
(hPa): Rmax= 94.89 exp(Pc−967) / 61.5 (Kawai et al., 2005)
and Rmax= 52.15 exp(Pc−952.7) / 44.09 (Kitano al., 2002), re-
spectively. An alternative Rmax estimation based on the lat-
itude, ψ , in addition to the pressure deficit, 1p, has been
proposed by Vickery and Wadhera (2008) for TCs with a
central pressure below 980 hPa traveling over the Atlantic
and the Gulf of Mexico: ln(Rmax)= 3.015 − 6.291 × 10⁻⁵
1p2+0.0337 ψ , with Rmax, 1p, and ψ in kilometers, hPa,
and degrees, respectively.
The purpose of this paper is to examine the existing mod-
els for Rmax estimation and propose a new formula to mini-
mize the estimation errors that result in an over- or underesti-
mation of the storm surge height. The meteorological data for
the development of a reliable model for typhoon and storm
surge simulation were obtained on 10 stations, from Japan’s
small southern islands. Our new methodology is expected to
improve storm surge prediction particularly for the WNP, in-
cluding Japan, China, Taiwan, the Philippines, and Vietnam.
2 Methodology
In this section, the data for the TC analysis, using only TCs
crossing the Japanese archipelago, are elucidated. A brief de-
scription of the storm surge model is also presented.
2.1 Collection, selection, and processing of TC data
The major problems in obtaining TC maximum wind obser-
vations result from the sparseness of oceanic stations (Akin-
son et al., 1977). However, the good density of meteorolog-
ical stations along the Japanese archipelago has great poten-
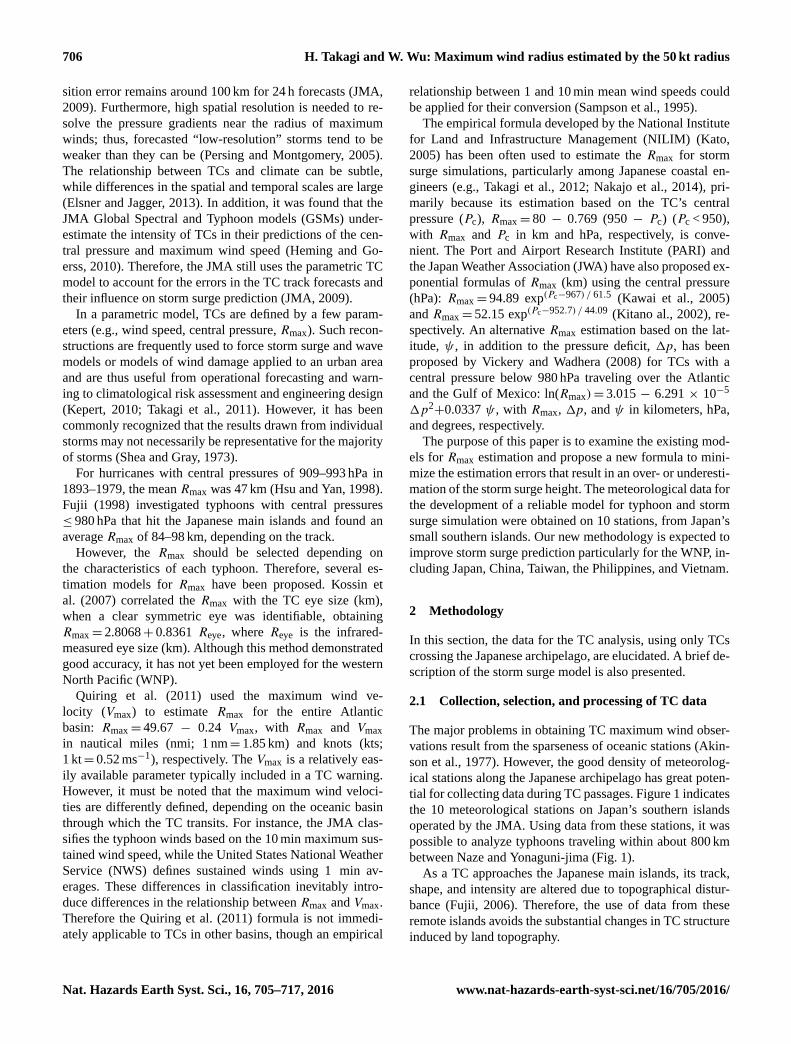
tial for collecting data during TC passages. Figure 1 indicates
the 10 meteorological stations on Japan’s southern islands
operated by the JMA. Using data from these stations, it was
possible to analyze typhoons traveling within about 800 km
between Naze and Yonaguni-jima (Fig. 1).
As a TC approaches the Japanese main islands, its track,
shape, and intensity are altered due to topographical distur-
bance (Fujii, 2006). Therefore, the use of data from these
remote islands avoids the substantial changes in TC structure
induced by land topography.
Nat. Hazards Earth Syst. Sci., 16, 705–717, 2016 www.nat-hazards-earth-syst-sci.net/16/705/2016/
H. Takagi and W. Wu: Maximum wind radius estimated by the 50 kt radius 707
Figure 1. Ten meteorological stations along the Japanese archipelago operated by the Japan Meteorological Agency (JMA): Minamidaitou-
jima (a), Naze (b), Okinoerabu (c), Nago (d), Naha (e), Kume-jima (f), Miyako-jima (g), Ishigaki-jima (h), Iriomote-jima (i), and Yonaguni-
jima (j).
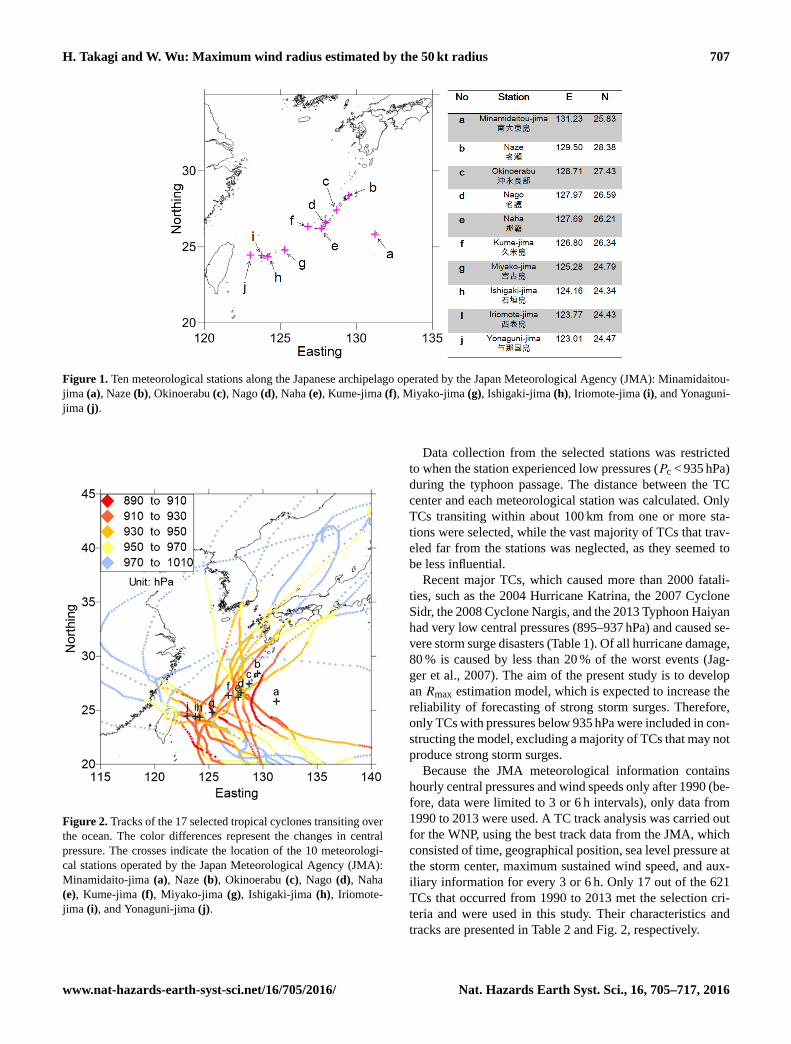
Figure 2. Tracks of the 17 selected tropical cyclones transiting over
the ocean. The color differences represent the changes in central
pressure. The crosses indicate the location of the 10 meteorologi-
cal stations operated by the Japan Meteorological Agency (JMA):
Minamidaito-jima (a), Naze (b), Okinoerabu (c), Nago (d), Naha
(e), Kume-jima (f), Miyako-jima (g), Ishigaki-jima (h), Iriomote-
jima (i), and Yonaguni-jima (j).
Data collection from the selected stations was restricted
to when the station experienced low pressures (Pc < 935 hPa)
during the typhoon passage. The distance between the TC
center and each meteorological station was calculated. Only
TCs transiting within about 100 km from one or more sta-
tions were selected, while the vast majority of TCs that trav-
eled far from the stations was neglected, as they seemed to
be less influential.
Recent major TCs, which caused more than 2000 fatali-
ties, such as the 2004 Hurricane Katrina, the 2007 Cyclone
Sidr, the 2008 Cyclone Nargis, and the 2013 Typhoon Haiyan
had very low central pressures (895–937 hPa) and caused se-
vere storm surge disasters (Table 1). Of all hurricane damage,
80 % is caused by less than 20 % of the worst events (Jag-
ger et al., 2007). The aim of the present study is to develop
an Rmax estimation model, which is expected to increase the
reliability of forecasting of strong storm surges. Therefore,
only TCs with pressures below 935 hPa were included in con-
structing the model, excluding a majority of TCs that may not
produce strong storm surges.
Because the JMA meteorological information contains
hourly central pressures and wind speeds only after 1990 (be-
fore, data were limited to 3 or 6 h intervals), only data from
1990 to 2013 were used. A TC track analysis was carried out
for the WNP, using the best track data from the JMA, which
consisted of time, geographical position, sea level pressure at
the storm center, maximum sustained wind speed, and aux-
iliary information for every 3 or 6 h. Only 17 out of the 621
TCs that occurred from 1990 to 2013 met the selection cri-
teria and were used in this study. Their characteristics and
tracks are presented in Table 2 and Fig. 2, respectively.
www.nat-hazards-earth-syst-sci.net/16/705/2016/ Nat. Hazards Earth Syst. Sci., 16, 705–717, 2016
708 H. Takagi and W. Wu: Maximum wind radius estimated by the 50 kt radius
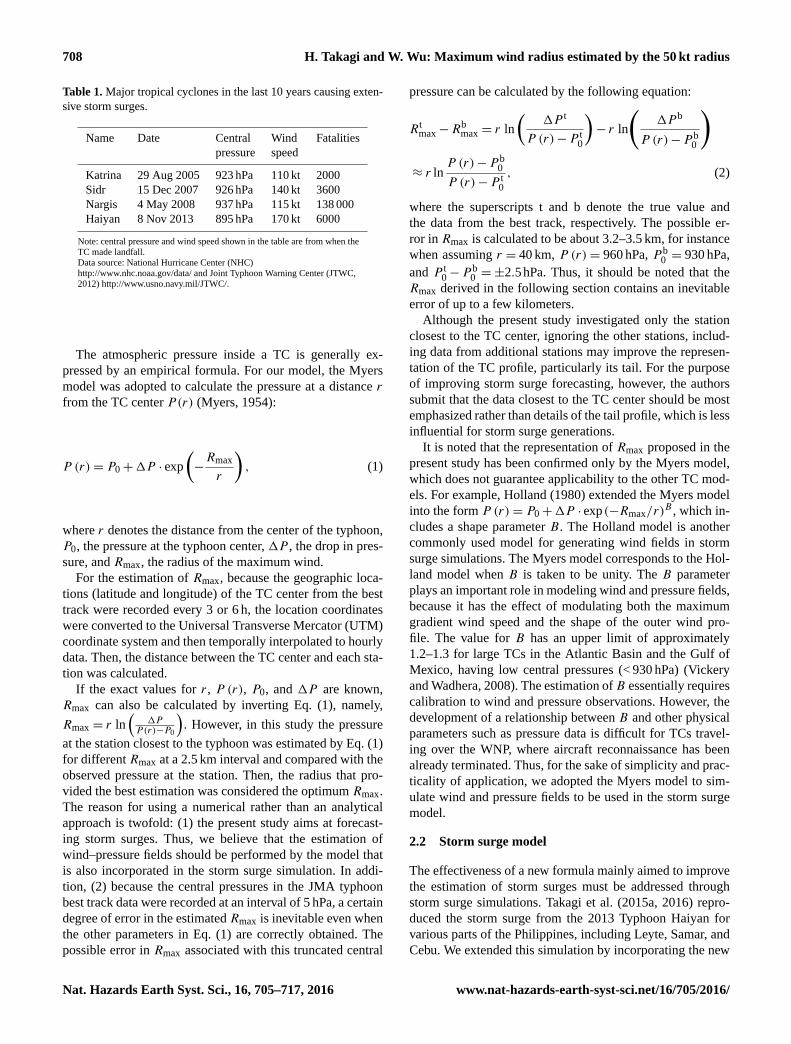
Table 1. Major tropical cyclones in the last 10 years causing exten-
sive storm surges.
Name Date Central Wind Fatalities
pressure speed
Katrina 29 Aug 2005 923 hPa 110 kt 2000
Sidr 15 Dec 2007 926 hPa 140 kt 3600
Nargis 4 May 2008 937 hPa 115 kt 138 000
Haiyan 8 Nov 2013 895 hPa 170 kt 6000
Note: central pressure and wind speed shown in the table are from when the
TC made landfall.
Data source: National Hurricane Center (NHC)
http://www.nhc.noaa.gov/data/ and Joint Typhoon Warning Center (JTWC,
2012) http://www.usno.navy.mil/JTWC/.
The atmospheric pressure inside a TC is generally ex-
pressed by an empirical formula. For our model, the Myers
model was adopted to calculate the pressure at a distance r
from the TC center P(r) (Myers, 1954):
P (r)= P0+1P · exp
(−Rmax
r
), (1)
where r denotes the distance from the center of the typhoon,
P0, the pressure at the typhoon center, 1P , the drop in pres-
sure, and Rmax, the radius of the maximum wind.
For the estimation of Rmax, because the geographic loca-
tions (latitude and longitude) of the TC center from the best
track were recorded every 3 or 6 h, the location coordinates
were converted to the Universal Transverse Mercator (UTM)
coordinate system and then temporally interpolated to hourly
data. Then, the distance between the TC center and each sta-
tion was calculated.
If the exact values for r , P (r), P0, and 1P are known,
Rmax can also be calculated by inverting Eq. (1), namely,
Rmax = r ln(
1PP(r)−P0
). However, in this study the pressure
at the station closest to the typhoon was estimated by Eq. (1)
for different Rmax at a 2.5 km interval and compared with the
observed pressure at the station. Then, the radius that pro-
vided the best estimation was considered the optimum Rmax.
The reason for using a numerical rather than an analytical
approach is twofold: (1) the present study aims at forecast-
ing storm surges. Thus, we believe that the estimation of
wind–pressure fields should be performed by the model that
is also incorporated in the storm surge simulation. In addi-
tion, (2) because the central pressures in the JMA typhoon
best track data were recorded at an interval of 5 hPa, a certain
degree of error in the estimated Rmax is inevitable even when
the other parameters in Eq. (1) are correctly obtained. The
possible error in Rmax associated with this truncated central
pressure can be calculated by the following equation:
Rtmax−R
bmax = r ln
(1P t
P (r)−P t0
)− r ln
(1P b
P (r)−P b0
)
≈ r lnP (r)−P b
0
P (r)−P t0
, (2)
where the superscripts t and b denote the true value and
the data from the best track, respectively. The possible er-
ror in Rmax is calculated to be about 3.2–3.5 km, for instance
when assuming r = 40 km, P (r)= 960 hPa, P b0 = 930 hPa,
and P t0−P
b0 =±2.5hPa. Thus, it should be noted that the
Rmax derived in the following section contains an inevitable
error of up to a few kilometers.
Although the present study investigated only the station
closest to the TC center, ignoring the other stations, includ-
ing data from additional stations may improve the represen-
tation of the TC profile, particularly its tail. For the purpose
of improving storm surge forecasting, however, the authors
submit that the data closest to the TC center should be most
emphasized rather than details of the tail profile, which is less
influential for storm surge generations.
It is noted that the representation of Rmax proposed in the
present study has been confirmed only by the Myers model,
which does not guarantee applicability to the other TC mod-
els. For example, Holland (1980) extended the Myers model
into the form P (r)= P0+1P · exp(−Rmax/r)B , which in-
cludes a shape parameter B. The Holland model is another
commonly used model for generating wind fields in storm
surge simulations. The Myers model corresponds to the Hol-
land model when B is taken to be unity. The B parameter
plays an important role in modeling wind and pressure fields,
because it has the effect of modulating both the maximum
gradient wind speed and the shape of the outer wind pro-
file. The value for B has an upper limit of approximately
1.2–1.3 for large TCs in the Atlantic Basin and the Gulf of
Mexico, having low central pressures (< 930 hPa) (Vickery
and Wadhera, 2008). The estimation of B essentially requires
calibration to wind and pressure observations. However, the
development of a relationship between B and other physical
parameters such as pressure data is difficult for TCs travel-
ing over the WNP, where aircraft reconnaissance has been
already terminated. Thus, for the sake of simplicity and prac-
ticality of application, we adopted the Myers model to sim-
ulate wind and pressure fields to be used in the storm surge
model.
2.2 Storm surge model
The effectiveness of a new formula mainly aimed to improve
the estimation of storm surges must be addressed through
storm surge simulations. Takagi et al. (2015a, 2016) repro-
duced the storm surge from the 2013 Typhoon Haiyan for
various parts of the Philippines, including Leyte, Samar, and
Cebu. We extended this simulation by incorporating the new
Nat. Hazards Earth Syst. Sci., 16, 705–717, 2016 www.nat-hazards-earth-syst-sci.net/16/705/2016/
H. Takagi and W. Wu: Maximum wind radius estimated by the 50 kt radius 709
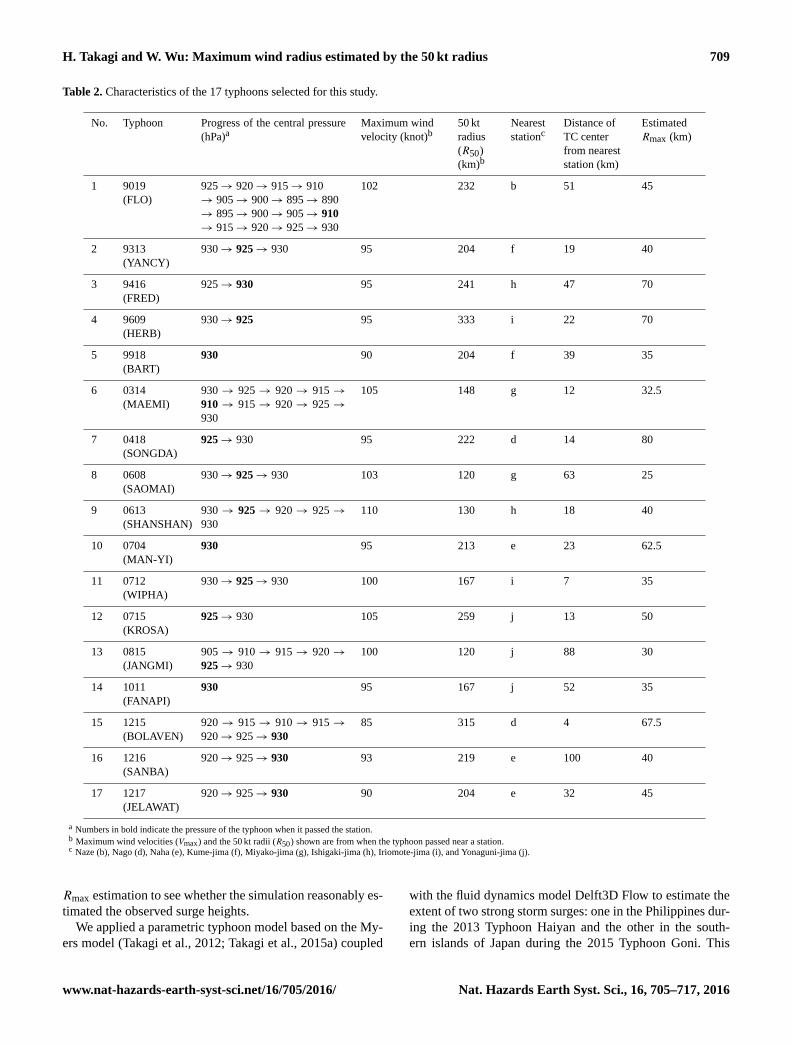
Table 2. Characteristics of the 17 typhoons selected for this study.
No. Typhoon Progress of the central pressure
(hPa)aMaximum wind
velocity (knot)b50 kt
radius
(R50)
(km)b
Nearest
stationcDistance of
TC center
from nearest
station (km)
Estimated
Rmax (km)
1 9019
(FLO)
925→ 920→ 915→ 910
→ 905→ 900→ 895→ 890
→ 895→ 900→ 905→ 910
→ 915→ 920→ 925→ 930
102 232 b 51 45
2 9313
(YANCY)
930→ 925→ 930 95 204 f 19 40
3 9416
(FRED)
925→ 930 95 241 h 47 70
4 9609
(HERB)
930→ 925 95 333 i 22 70
5 9918
(BART)
930 90 204 f 39 35
6 0314
(MAEMI)
930 → 925 → 920 → 915 →
910 → 915 → 920 → 925 →
930
105 148 g 12 32.5
7 0418
(SONGDA)
925→ 930 95 222 d 14 80
8 0608
(SAOMAI)
930→ 925→ 930 103 120 g 63 25
9 0613
(SHANSHAN)
930 → 925 → 920 → 925 →
930
110 130 h 18 40
10 0704
(MAN-YI)
930 95 213 e 23 62.5
11 0712
(WIPHA)
930→ 925→ 930 100 167 i 7 35
12 0715
(KROSA)
925→ 930 105 259 j 13 50
13 0815
(JANGMI)
905 → 910 → 915 → 920 →
925→ 930
100 120 j 88 30
14 1011
(FANAPI)
930 95 167 j 52 35
15 1215
(BOLAVEN)
920 → 915 → 910 → 915 →
920→ 925→ 930
85 315 d 4 67.5
16 1216
(SANBA)
920→ 925→ 930 93 219 e 100 40
17 1217
(JELAWAT)
920→ 925→ 930 90 204 e 32 45
a Numbers in bold indicate the pressure of the typhoon when it passed the station.b Maximum wind velocities (Vmax) and the 50 kt radii (R50) shown are from when the typhoon passed near a station.c Naze (b), Nago (d), Naha (e), Kume-jima (f), Miyako-jima (g), Ishigaki-jima (h), Iriomote-jima (i), and Yonaguni-jima (j).
Rmax estimation to see whether the simulation reasonably es-
timated the observed surge heights.
We applied a parametric typhoon model based on the My-
ers model (Takagi et al., 2012; Takagi et al., 2015a) coupled
with the fluid dynamics model Delft3D Flow to estimate the
extent of two strong storm surges: one in the Philippines dur-
ing the 2013 Typhoon Haiyan and the other in the south-
ern islands of Japan during the 2015 Typhoon Goni. This
www.nat-hazards-earth-syst-sci.net/16/705/2016/ Nat. Hazards Earth Syst. Sci., 16, 705–717, 2016
710 H. Takagi and W. Wu: Maximum wind radius estimated by the 50 kt radius
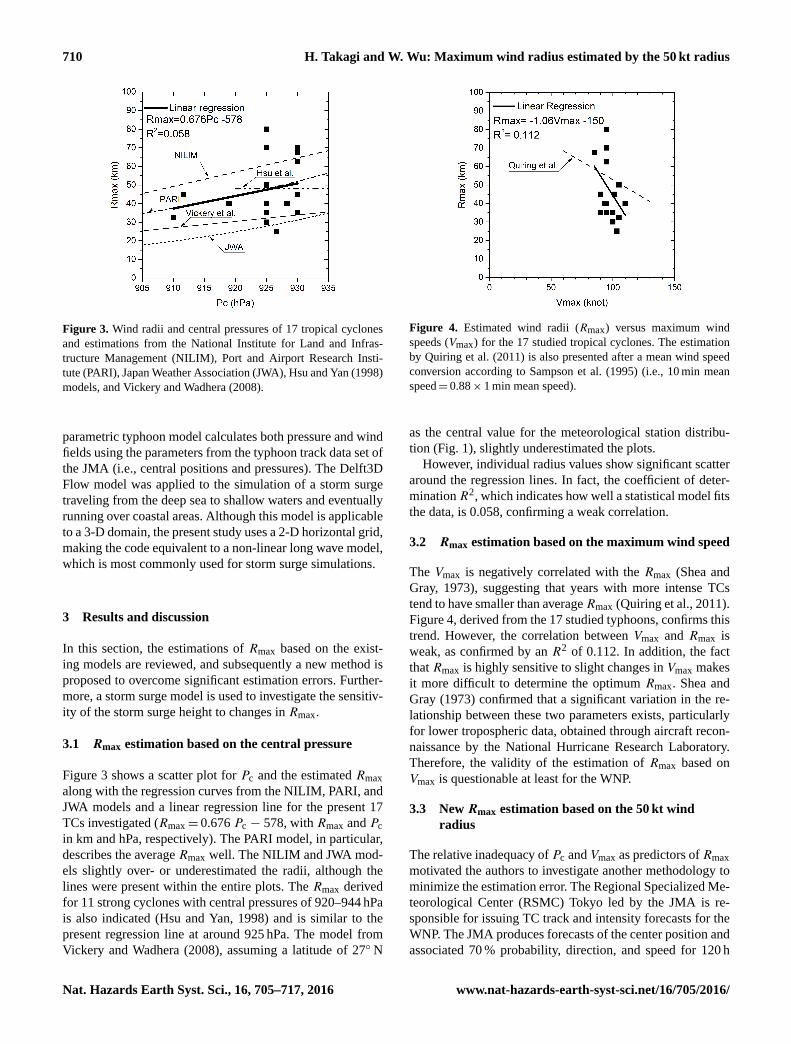
Figure 3. Wind radii and central pressures of 17 tropical cyclones
and estimations from the National Institute for Land and Infras-
tructure Management (NILIM), Port and Airport Research Insti-
tute (PARI), Japan Weather Association (JWA), Hsu and Yan (1998)
models, and Vickery and Wadhera (2008).
parametric typhoon model calculates both pressure and wind
fields using the parameters from the typhoon track data set of
the JMA (i.e., central positions and pressures). The Delft3D
Flow model was applied to the simulation of a storm surge
traveling from the deep sea to shallow waters and eventually
running over coastal areas. Although this model is applicable
to a 3-D domain, the present study uses a 2-D horizontal grid,
making the code equivalent to a non-linear long wave model,
which is most commonly used for storm surge simulations.
3 Results and discussion
In this section, the estimations of Rmax based on the exist-
ing models are reviewed, and subsequently a new method is
proposed to overcome significant estimation errors. Further-
more, a storm surge model is used to investigate the sensitiv-
ity of the storm surge height to changes in Rmax.
3.1 Rmax estimation based on the central pressure
Figure 3 shows a scatter plot for Pc and the estimated Rmax
along with the regression curves from the NILIM, PARI, and
JWA models and a linear regression line for the present 17
TCs investigated (Rmax= 0.676 Pc − 578, with Rmax and Pc
in km and hPa, respectively). The PARI model, in particular,
describes the average Rmax well. The NILIM and JWA mod-
els slightly over- or underestimated the radii, although the
lines were present within the entire plots. The Rmax derived
for 11 strong cyclones with central pressures of 920–944 hPa
is also indicated (Hsu and Yan, 1998) and is similar to the
present regression line at around 925 hPa. The model from
Vickery and Wadhera (2008), assuming a latitude of 27◦ N
Figure 4. Estimated wind radii (Rmax) versus maximum wind
speeds (Vmax) for the 17 studied tropical cyclones. The estimation
by Quiring et al. (2011) is also presented after a mean wind speed
conversion according to Sampson et al. (1995) (i.e., 10 min mean
speed= 0.88× 1 min mean speed).
as the central value for the meteorological station distribu-
tion (Fig. 1), slightly underestimated the plots.
However, individual radius values show significant scatter
around the regression lines. In fact, the coefficient of deter-
minationR2, which indicates how well a statistical model fits
the data, is 0.058, confirming a weak correlation.
3.2 Rmax estimation based on the maximum wind speed
The Vmax is negatively correlated with the Rmax (Shea and
Gray, 1973), suggesting that years with more intense TCs
tend to have smaller than averageRmax (Quiring et al., 2011).
Figure 4, derived from the 17 studied typhoons, confirms this
trend. However, the correlation between Vmax and Rmax is
weak, as confirmed by an R2 of 0.112. In addition, the fact
that Rmax is highly sensitive to slight changes in Vmax makes
it more difficult to determine the optimum Rmax. Shea and
Gray (1973) confirmed that a significant variation in the re-
lationship between these two parameters exists, particularly
for lower tropospheric data, obtained through aircraft recon-
naissance by the National Hurricane Research Laboratory.
Therefore, the validity of the estimation of Rmax based on
Vmax is questionable at least for the WNP.
3.3 New Rmax estimation based on the 50 kt wind
radius
The relative inadequacy of Pc and Vmax as predictors of Rmax
motivated the authors to investigate another methodology to
minimize the estimation error. The Regional Specialized Me-
teorological Center (RSMC) Tokyo led by the JMA is re-
sponsible for issuing TC track and intensity forecasts for the
WNP. The JMA produces forecasts of the center position and
associated 70 % probability, direction, and speed for 120 h
Nat. Hazards Earth Syst. Sci., 16, 705–717, 2016 www.nat-hazards-earth-syst-sci.net/16/705/2016/
H. Takagi and W. Wu: Maximum wind radius estimated by the 50 kt radius 711
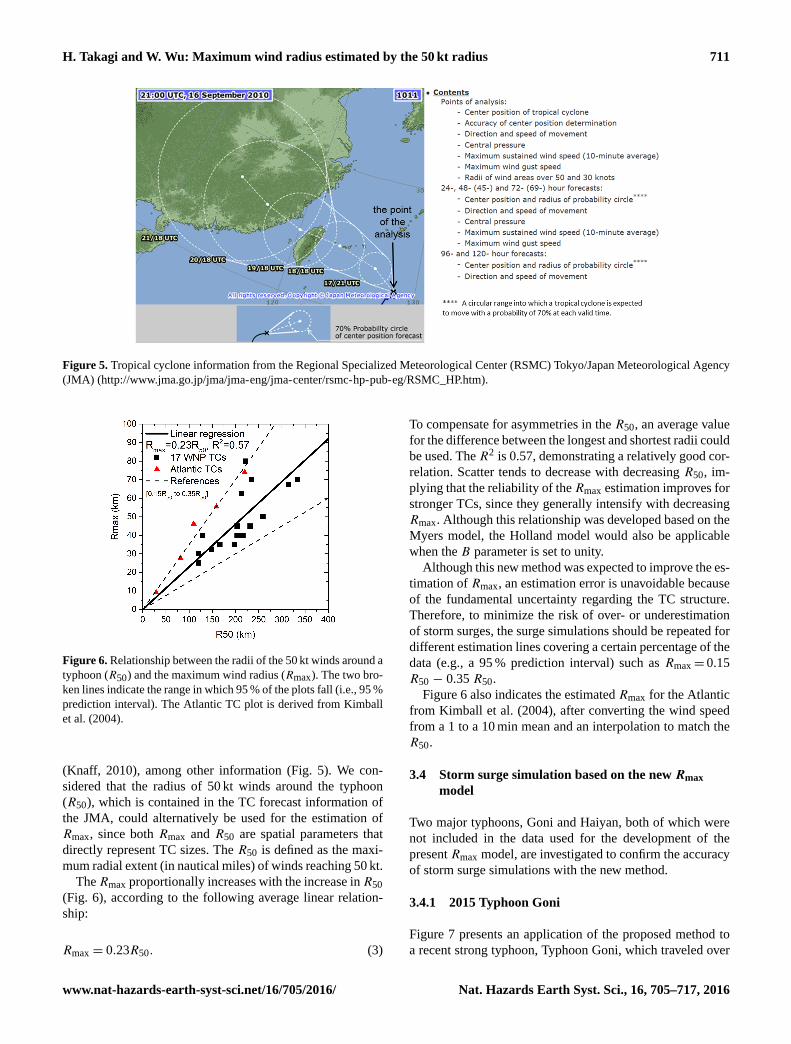
Figure 5. Tropical cyclone information from the Regional Specialized Meteorological Center (RSMC) Tokyo/Japan Meteorological Agency
(JMA) (http://www.jma.go.jp/jma/jma-eng/jma-center/rsmc-hp-pub-eg/RSMC_HP.htm).
Figure 6. Relationship between the radii of the 50 kt winds around a
typhoon (R50) and the maximum wind radius (Rmax). The two bro-
ken lines indicate the range in which 95 % of the plots fall (i.e., 95 %
prediction interval). The Atlantic TC plot is derived from Kimball
et al. (2004).
(Knaff, 2010), among other information (Fig. 5). We con-
sidered that the radius of 50 kt winds around the typhoon
(R50), which is contained in the TC forecast information of
the JMA, could alternatively be used for the estimation of
Rmax, since both Rmax and R50 are spatial parameters that
directly represent TC sizes. The R50 is defined as the maxi-
mum radial extent (in nautical miles) of winds reaching 50 kt.
TheRmax proportionally increases with the increase inR50
(Fig. 6), according to the following average linear relation-
ship:
Rmax = 0.23R50. (3)
To compensate for asymmetries in the R50, an average value
for the difference between the longest and shortest radii could
be used. The R2 is 0.57, demonstrating a relatively good cor-
relation. Scatter tends to decrease with decreasing R50, im-
plying that the reliability of theRmax estimation improves for
stronger TCs, since they generally intensify with decreasing
Rmax. Although this relationship was developed based on the
Myers model, the Holland model would also be applicable
when the B parameter is set to unity.
Although this new method was expected to improve the es-
timation of Rmax, an estimation error is unavoidable because
of the fundamental uncertainty regarding the TC structure.
Therefore, to minimize the risk of over- or underestimation
of storm surges, the surge simulations should be repeated for
different estimation lines covering a certain percentage of the
data (e.g., a 95 % prediction interval) such as Rmax= 0.15
R50 − 0.35 R50.
Figure 6 also indicates the estimated Rmax for the Atlantic
from Kimball et al. (2004), after converting the wind speed
from a 1 to a 10 min mean and an interpolation to match the
R50.
3.4 Storm surge simulation based on the new Rmax
model
Two major typhoons, Goni and Haiyan, both of which were
not included in the data used for the development of the
present Rmax model, are investigated to confirm the accuracy
of storm surge simulations with the new method.
3.4.1 2015 Typhoon Goni
Figure 7 presents an application of the proposed method to
a recent strong typhoon, Typhoon Goni, which traveled over
www.nat-hazards-earth-syst-sci.net/16/705/2016/ Nat. Hazards Earth Syst. Sci., 16, 705–717, 2016
712 H. Takagi and W. Wu: Maximum wind radius estimated by the 50 kt radius
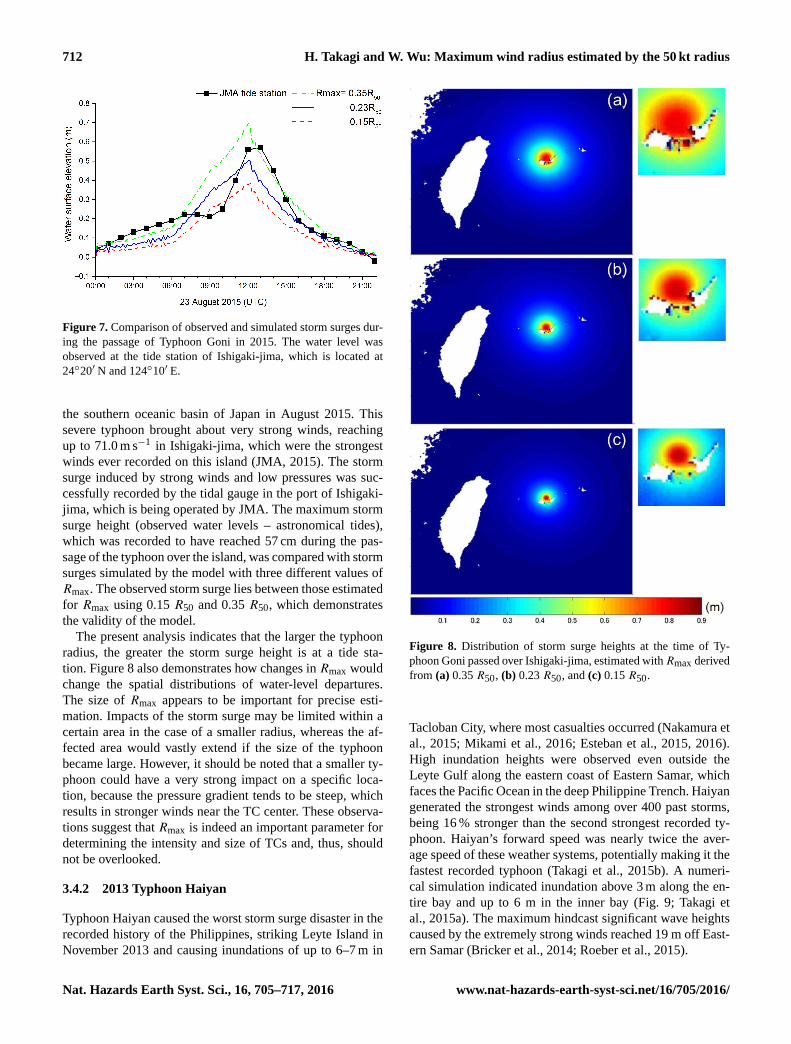
Figure 7. Comparison of observed and simulated storm surges dur-
ing the passage of Typhoon Goni in 2015. The water level was
observed at the tide station of Ishigaki-jima, which is located at
24◦20′ N and 124◦10′ E.
the southern oceanic basin of Japan in August 2015. This
severe typhoon brought about very strong winds, reaching
up to 71.0 m s−1 in Ishigaki-jima, which were the strongest
winds ever recorded on this island (JMA, 2015). The storm
surge induced by strong winds and low pressures was suc-
cessfully recorded by the tidal gauge in the port of Ishigaki-
jima, which is being operated by JMA. The maximum storm
surge height (observed water levels – astronomical tides),
which was recorded to have reached 57 cm during the pas-
sage of the typhoon over the island, was compared with storm
surges simulated by the model with three different values of
Rmax. The observed storm surge lies between those estimated
for Rmax using 0.15 R50 and 0.35 R50, which demonstrates
the validity of the model.
The present analysis indicates that the larger the typhoon
radius, the greater the storm surge height is at a tide sta-
tion. Figure 8 also demonstrates how changes in Rmax would
change the spatial distributions of water-level departures.
The size of Rmax appears to be important for precise esti-
mation. Impacts of the storm surge may be limited within a
certain area in the case of a smaller radius, whereas the af-
fected area would vastly extend if the size of the typhoon
became large. However, it should be noted that a smaller ty-
phoon could have a very strong impact on a specific loca-
tion, because the pressure gradient tends to be steep, which
results in stronger winds near the TC center. These observa-
tions suggest that Rmax is indeed an important parameter for
determining the intensity and size of TCs and, thus, should
not be overlooked.
3.4.2 2013 Typhoon Haiyan
Typhoon Haiyan caused the worst storm surge disaster in the
recorded history of the Philippines, striking Leyte Island in
November 2013 and causing inundations of up to 6–7 m in
Figure 8. Distribution of storm surge heights at the time of Ty-
phoon Goni passed over Ishigaki-jima, estimated withRmax derived
from (a) 0.35 R50, (b) 0.23 R50, and (c) 0.15 R50.
Tacloban City, where most casualties occurred (Nakamura et
al., 2015; Mikami et al., 2016; Esteban et al., 2015, 2016).
High inundation heights were observed even outside the
Leyte Gulf along the eastern coast of Eastern Samar, which
faces the Pacific Ocean in the deep Philippine Trench. Haiyan
generated the strongest winds among over 400 past storms,
being 16 % stronger than the second strongest recorded ty-
phoon. Haiyan’s forward speed was nearly twice the aver-
age speed of these weather systems, potentially making it the
fastest recorded typhoon (Takagi et al., 2015b). A numeri-
cal simulation indicated inundation above 3 m along the en-
tire bay and up to 6 m in the inner bay (Fig. 9; Takagi et
al., 2015a). The maximum hindcast significant wave heights
caused by the extremely strong winds reached 19 m off East-
ern Samar (Bricker et al., 2014; Roeber et al., 2015).
Nat. Hazards Earth Syst. Sci., 16, 705–717, 2016 www.nat-hazards-earth-syst-sci.net/16/705/2016/
H. Takagi and W. Wu: Maximum wind radius estimated by the 50 kt radius 713
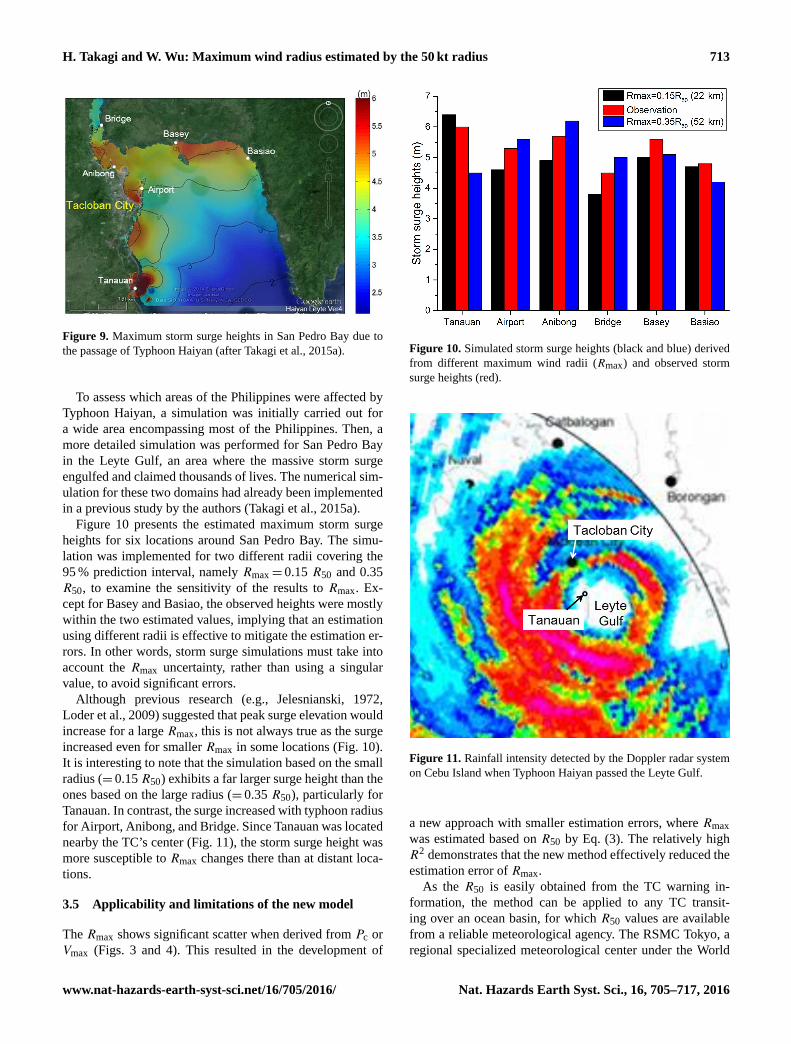
Figure 9. Maximum storm surge heights in San Pedro Bay due to
the passage of Typhoon Haiyan (after Takagi et al., 2015a).
To assess which areas of the Philippines were affected by
Typhoon Haiyan, a simulation was initially carried out for
a wide area encompassing most of the Philippines. Then, a
more detailed simulation was performed for San Pedro Bay
in the Leyte Gulf, an area where the massive storm surge
engulfed and claimed thousands of lives. The numerical sim-
ulation for these two domains had already been implemented
in a previous study by the authors (Takagi et al., 2015a).
Figure 10 presents the estimated maximum storm surge
heights for six locations around San Pedro Bay. The simu-
lation was implemented for two different radii covering the
95 % prediction interval, namely Rmax= 0.15 R50 and 0.35
R50, to examine the sensitivity of the results to Rmax. Ex-
cept for Basey and Basiao, the observed heights were mostly
within the two estimated values, implying that an estimation
using different radii is effective to mitigate the estimation er-
rors. In other words, storm surge simulations must take into
account the Rmax uncertainty, rather than using a singular
value, to avoid significant errors.
Although previous research (e.g., Jelesnianski, 1972,
Loder et al., 2009) suggested that peak surge elevation would
increase for a large Rmax, this is not always true as the surge
increased even for smaller Rmax in some locations (Fig. 10).
It is interesting to note that the simulation based on the small
radius (= 0.15 R50) exhibits a far larger surge height than the
ones based on the large radius (= 0.35 R50), particularly for
Tanauan. In contrast, the surge increased with typhoon radius
for Airport, Anibong, and Bridge. Since Tanauan was located
nearby the TC’s center (Fig. 11), the storm surge height was
more susceptible to Rmax changes there than at distant loca-
tions.
3.5 Applicability and limitations of the new model
The Rmax shows significant scatter when derived from Pc or
Vmax (Figs. 3 and 4). This resulted in the development of
Figure 10. Simulated storm surge heights (black and blue) derived
from different maximum wind radii (Rmax) and observed storm
surge heights (red).
Figure 11. Rainfall intensity detected by the Doppler radar system
on Cebu Island when Typhoon Haiyan passed the Leyte Gulf.
a new approach with smaller estimation errors, where Rmax
was estimated based on R50 by Eq. (3). The relatively high
R2 demonstrates that the new method effectively reduced the
estimation error of Rmax.
As the R50 is easily obtained from the TC warning in-
formation, the method can be applied to any TC transit-
ing over an ocean basin, for which R50 values are available
from a reliable meteorological agency. The RSMC Tokyo, a
regional specialized meteorological center under the World
www.nat-hazards-earth-syst-sci.net/16/705/2016/ Nat. Hazards Earth Syst. Sci., 16, 705–717, 2016
714 H. Takagi and W. Wu: Maximum wind radius estimated by the 50 kt radius
Meteorological Organization (WMO), covers a vast area of
the WNP including Japan, China, Taiwan, the Philippines,
and Vietnam and issues TC information, which includes R50
(Fig. 5) and warnings to the neighboring agencies when a
typhoon arises. To mitigate typhoon-related disasters, the au-
thorities must instantaneously predict the storm surge using
a simple parametric typhoon model, incorporating the R50
or other parameters estimated by a precise model from a
neighboring meteorological agency. Our method should par-
ticularly facilitate a prompt early warning by local authori-
ties who cannot operate complex non-hydrostatic mesoscale
models but have sufficiently precise local data (e.g., topog-
raphy, bathymetry, infrastructure conditions, and household
information) to greatly improve the prediction of the local
amplification of the storm surge.
However, some estimation errors (Fig. 6) were unavoid-
able because of fundamental uncertainties in the TC structure
and insufficient number of available TCs to derive the rela-
tionship from Eq. (3). For example, a challenge for the Rmax
estimation is associated with the occurrence of “flat” tangen-
tial wind profiles, i.e., when the wind decays very slowly
with increasing radius (Kossin et al., 2007). These errors re-
sult in over- or underestimations of the TCs and their subse-
quent storm surges, whose heights substantially varied with
Rmax changes (Fig. 10). Figure 6 also shows a noticeable dis-
crepancy in the Rmax estimated by the present method for
the WNP and the Atlantic, indicating that our method may
over- or underestimate the Rmax in other basins. This gap
may be associated with differences in TC sizes between dif-
ferent basins. In fact, Kimball et al. (2004) suggested that TC
eyes are relatively smaller in the WNP than in the Atlantic,
potentially resulting in a smaller Rmax in the former.
Some TC parameters such as center positions, Pc, Vmax,
and R50 are determined with full use of available obser-
vational data such as radar, surface synoptic observations
(SYNOP), ship, buoy, and advanced scatterometer (ASCAT)
(RSMC Tokyo, 2015), in addition to Dvorak techniques
(Dvorak, 1982, 1984). Moreover, the JMA uniquely uses a
table, often referred to as the Koba table, for conversion of
the Dvorak CI number to Pc or Vmax values as proposed by
Koba et al. (1991). Possible errors in R50 are of vital interest
when the relationship Rmax = 0.23R50 is applied to a real-
time forecast. The R50 is estimated according to the statisti-
cal relationship between Pc and R50 in the absence of neces-
sary observations (RSMC Tokyo, 2015).
Therefore, the estimation of R50 appears to be highly cor-
related with the reliability of Pc. Although JMA has adopted
the Koba table to improve the estimation of TC intensities in
the WNP, there exists a certain degree of estimation error in
the conversion process of the Dvorak method. Nevertheless,
a series of Dvorak methods using satellite images have been
commonly used over the last couple of decades and are con-
sidered to be the most reliable estimation of TC intensities in
the WNP, where aircraft reconnaissance had been terminated
in 1987 (JMA, 2014).
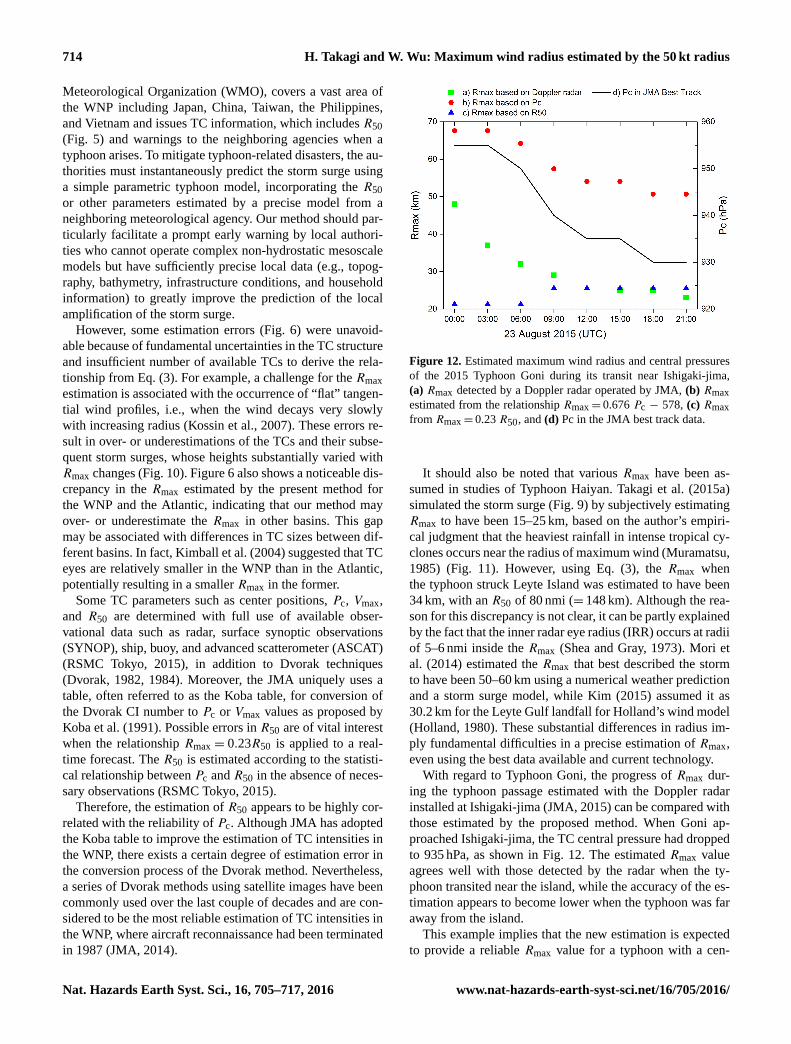
Figure 12. Estimated maximum wind radius and central pressures
of the 2015 Typhoon Goni during its transit near Ishigaki-jima,
(a) Rmax detected by a Doppler radar operated by JMA, (b) Rmax
estimated from the relationship Rmax= 0.676 Pc − 578, (c) Rmax
from Rmax= 0.23 R50, and (d) Pc in the JMA best track data.
It should also be noted that various Rmax have been as-
sumed in studies of Typhoon Haiyan. Takagi et al. (2015a)
simulated the storm surge (Fig. 9) by subjectively estimating
Rmax to have been 15–25 km, based on the author’s empiri-
cal judgment that the heaviest rainfall in intense tropical cy-
clones occurs near the radius of maximum wind (Muramatsu,
1985) (Fig. 11). However, using Eq. (3), the Rmax when
the typhoon struck Leyte Island was estimated to have been
34 km, with an R50 of 80 nmi (= 148 km). Although the rea-
son for this discrepancy is not clear, it can be partly explained
by the fact that the inner radar eye radius (IRR) occurs at radii
of 5–6 nmi inside the Rmax (Shea and Gray, 1973). Mori et
al. (2014) estimated the Rmax that best described the storm
to have been 50–60 km using a numerical weather prediction
and a storm surge model, while Kim (2015) assumed it as
30.2 km for the Leyte Gulf landfall for Holland’s wind model
(Holland, 1980). These substantial differences in radius im-
ply fundamental difficulties in a precise estimation of Rmax,
even using the best data available and current technology.
With regard to Typhoon Goni, the progress of Rmax dur-
ing the typhoon passage estimated with the Doppler radar
installed at Ishigaki-jima (JMA, 2015) can be compared with
those estimated by the proposed method. When Goni ap-
proached Ishigaki-jima, the TC central pressure had dropped
to 935 hPa, as shown in Fig. 12. The estimated Rmax value
agrees well with those detected by the radar when the ty-
phoon transited near the island, while the accuracy of the es-
timation appears to become lower when the typhoon was far
away from the island.
This example implies that the new estimation is expected
to provide a reliable Rmax value for a typhoon with a cen-
Nat. Hazards Earth Syst. Sci., 16, 705–717, 2016 www.nat-hazards-earth-syst-sci.net/16/705/2016/
H. Takagi and W. Wu: Maximum wind radius estimated by the 50 kt radius 715
tral pressure that is substantially low, while the method may
not provide a good estimation in the case of a less violent
typhoon. It is also recognized that the estimation from Pc ap-
pears to overestimateRmax throughout the time period shown
in Fig. 12.
The consideration of these uncertainties in storm surge
simulation is also relevant with regard to the uncertainty in
the TC information issued by the agencies. An examination
of our 17 selected TCs indicates that temporal changes in
Rmax averaged 0.75 % h−1 and reached up to 8.3 % h−1. For
the RSMC Tokyo, the wind radii estimates are part of the 3 h
advisories and warnings issued by the JMA. Therefore, Rmax
may change by up to 24.9 % by the time new information is
available. These temporal changes inRmax are another source
of error that must be considered.
Therefore, the variability of Rmax should be taken into ac-
count in storm surge simulations, regardless of the model
used, to minimize estimation errors that may compromise an
early evacuation of the affected population.
4 Conclusions
Using observations from a number of Japanese islands and
best track data, 17 typhoons with central pressures below
935 hPa that passed near meteorological stations were se-
lected to examine existing methods and a new method is
presented to calculate Rmax. Values for Rmax produced by
the existing methods, based on central pressure or maxi-
mum wind speed, show substantial scattering around the re-
gression lines. Alternatively, we propose an Rmax estimation
based on the radius of the 50 kt wind (R50):Rmax= 0.23 R50.
Although this equation is expected to substantially improve
the estimation of Rmax, estimation errors are unavoidable
and result in an over- or underestimation of storm surges.
In fact, simulations of the storm surges from the 2013 Ty-
phoon Haiyan and the 2015 Typhoon Goni demonstrated
that the estimated storm surge heights substantially vary with
changes in Rmax, highlighting a fundamental difficulty in
estimating storm surge heights based on only one predeter-
mined radius. Therefore, to minimize the risk of storm surge
over- or underestimation, the variability of Rmax should be
taken into account in the simulations, such as Rmax= 0.15
R50–0.35 R50. The proposed Rmax estimation method is ex-
pected to increase the reliability of storm surge predictions
and contribute to disaster risk management of tropical cy-
clones and storm surges.
Acknowledgements. The present research was funded by the JSPS
KAKENHI grant number 26702009 and the Environment Re-
search and Technology Development Fund (S-14) of the Ministry
of the Environment, Japan. The JMA typhoon best track data
are available at http://www.jma.go.jp/jma/jma-eng/jma-center/
rsmc-hp-pub-eg/besttrack.html, while the JMA meteorological
station network data for the Japanese archipelago can be found at
http://www.data.jma.go.jp/obd/stats/etrn/index.php.
Edited by: S. Tinti
Reviewed by: two anonymous referees
References
Akinson, G. D. and Holliday C. R.: Tropical cyclone minimum
sea level pressure/maximum sustained wind relationship for the
Western North Pacific, Mon. Weather Rev., 105, 421–427, 1977.
Bricker, J. D., Takagi, H., Mas, E., Kure, S., Adriano, B., Yi, C., and
Roeber, V.: Spatial Variation of Damage due to Storm Surge and
Waves during Typhoon Haiyan in the Philippines, J. Jpn. Soc.
Civil Eng., 70, 231–235, 2014.
Dvorak, V. F.: Tropical cyclone intensity analysis and forecast-
ing from satellite visible or enhanced infrared imagery, NOAA
NESS, Applications Laboratory Training Notes, 42 pp., 1982.
Dvorak, V. F.: Tropical cyclone intensity analysis using satellite
data, NOAA Tech. Rep. 11, 45 pp., 1984.
Elsner, J. B. and Jagger, T. H.: Hurricane Climatology: a modern
statistical guide using R, Oxford University Press, New York,
373 pp., 2013.
Esteban, M., Takagi, H., and Shibayama, T.: Handbook of Coastal
Disaster Mitigation for Engineers and Planners, 1st Edition, El-
sevier, ISBN: 9780128010600, 2015.
Esteban, M., Valenzuela, V. P., Matsumaru, R., Mikami, T.,
Shibayama, T., Takagi, H., Nguyen, D. T., and de Leon, M.:
Storm surge awareness in the Philippines prior to typhoon
Haiyan: a comparative analysis with tsunami awareness in recent
times, Coast. Eng. J., 2016.
Fujii, T.: Statistical analysis of the characteristics of severe ty-
phoon hitting the Japanese main islands, Mon. Weather Rev.,
126, 1901–1907, 1998.
Fujii, T.: On a pressure distribution of typhoons having made land-
fall on the Japanese main islands in 2004, J. Nat. Disaster Sc.,
25, 317–328, 2006.
Jagger, T. H., Elsner, J. B., and Saunders, M. A.: Forecasting
U.S. insured hurricane losses, in: Climate Extremes and Society,
edited by: Murnane R. J., Madigan D., Diaz H. F., Cambridge
University Press, Cambridge, UK, chapt. 10, 2007.
JMA (Japan Meteorological Agency): Outline of the Storm Surge
Prediction Model at the Japan Meteorological Agency, Technical
Review No. 11, available at: http://www.jma.go.jp/jma/jma-eng/
jma-center/rsmc-hp-pub-eg/techrev/abs11.htm#11-3 (last ac-
cess: 15 February 2015), 2009.
JMA (Japan Meteorological Agency): Typhoon intensity estima-
tion, Meteorological Research Institute, available at: http://www.
mri-jma.go.jp/Dep/ty/ty2/tyest/tyest2.html (last access: 24 De-
cember 2015), 2014.
JMA (Japan Meteorological Agency): JMA Press Release on
29 September 2015, available at: http://www.mri-jma.go.jp/
Topics/H27/270929/Press20150929.pdf (last access: 24 Decem-
ber 2015), 2015.
Jelesnianski, C. P.: SPLASH (special program to list amplitudes
of surges from hurricanes) I. Landfall storms. NOAA technical
memorandum NWS TDL-46. National Weather Service Systems
Development Office, Silver Spring, Maryland, 56 pp., 1972.
www.nat-hazards-earth-syst-sci.net/16/705/2016/ Nat. Hazards Earth Syst. Sci., 16, 705–717, 2016
716 H. Takagi and W. Wu: Maximum wind radius estimated by the 50 kt radius
Jelesnianski, C. P. and Taylor, A. D.: A preliminary view of storm
surges before and after storm modifications, NOAA Technical
Memorandum ERL WMPO-3, 33 pp., 1973.
Joint Typhoon Warning Center: Northern Indian Ocean Best Track
Data, avalable at: http://www.usno.navy.mil/NOOC/nmfc-ph/
RSS/jtwc/best_tracks/ (last access: 8 February 2015), 2012.
Jordan, C. L.: Marked changes in the characteristics of the eye of in-
tense typhoons between the deepening and filling stages, J. Me-
teorol., 18, 779–789, 1961.
Heming, J. and Goerss, J.: Track and structure forecasts of tropical
cyclones, in: Global Perspectives on Tropical Cyclones, edited
by: Johnny, C. L. C. and Jeffrey, D. K., World Scientific, 287–
323, 2010.
Holland, G.: An analytic model of the wind and pressure profiles in
hurricanes, Mon. Weather Rev., 108, 1212–1218, 1980.
Hsu, S. A. and Yan, Z.: A Note on the Radius of Maximum Wind for
Hurricanes, J. Coast. Res., 14, 667–668, doi:10.2307/4298820,
1998.
Irish, J. L., Resio, D. T., and Ratcliff, J. J.: The Influence of Storm
Size on Hurricane Surge. J. Phys. Oceanogr., 38, 2003–2013,
doi:10.1175/2008JPO3727.1, 2008.
Irish, J. L., Resio, D. T., and Ratcliff, J. J.: The influence of storm
size on hurricane surge, J. Phys. Oceanogr., 38, 2003–2013,
doi:10.1175/2008JPO3727.1, 2008.
Kato, F.: Study on risk assessment of storm surge flood, Technical
note of National Institute for Land and Infrastructure Manage-
ment of Japan, No. 275, 2005.
Kawai, H., Honda, K., Tomita, T., and Kakinuma, T.: Characteristic
of Typhoons in 2004 and Forecasting and Hindcasting of Their
Storm Surges, Technical Note of the Port and Airport Research
Institute, No. 1103, 34 pp., 2005.
Kepert, J. D.: Tropical Cyclone Structure and Dynamics, in: Global
Perspectives on Tropical Cyclones, edited by: Johnny, C. L. C.
and Jeffrey, D. K., World Scientific, 3–54, 2010.
Kim, K. O.: Typhoon storm surge simulation for Typhoon Haiyan,
Journal of International Development and Cooperation, Hi-
roshima University, 21, 17–25, 2015.
Kimball, S. K. and Mulekar, M.: A 15-Year Climatology of North
Atlantic Tropical Cyclones. Part I: Size Parameters, J. Climate,
17, 3555–3575, 2004.
Kitano, M., Arimitsu, T., and Takayama, T.: Generation of Swell
and Its simplified Prediction Method for Coastal Disaster Pre-
vention, P. Coast. Eng., 49, 1431–1435, 2002.
Knaff, J. A.: Tropical cyclone surface wind structure and wind pres-
sure relationships, Seventh International Workshop on Tropical
Cyclones, WMO, France, 35 pp., 2010.
Koba, H., Hagiwara, T., Osano, S., and Akashi, S.: Relationships be-
tween CI Number and Minimum Sea Level Pressure/Maximum
Wind Speed of Tropical Cyclones, Geophys. Mag., 44, 15–25,
1991.
Kossin, J. P., Knaff, J. A., Berger, H. I., Herndon,D. C., Cram, T.
A., Velden, C. S., Murnane, R. J., and Hawkins, J. D.: Estimat-
ing hurricane wind structure in the absence of aircraft reconnais-
sance, Weather Forecast., 22, 89–101, doi:10.1175/WAF985.1,
2007.
Loder, N. M., Cialone, M. A., Irish, J. L., and Wamsley, T. V.: Ide-
alized marsh simulations: Sensitivity of storm surge elevation to
seabed elevation, Coastal and Hydraulics Engineering Technical
Note ERDC/CHL CHETN-I-78. Vicksburg, MS, U.S. Army En-
gineer Research and Development Center, 2009.
Mikami, T., Shibayama, T., Takagi, H., Matsumaru, R., Esteban,
M. Nguyen, D. T., de Leon, M., Valenzuela, V. P., Oyama, T.,
Nakamura, R., Kumagai, K., and Li, S.: Storm Surge Heights and
Damage Caused by the 2013 Typhoon Haiyan along the Leyte
Gulf Coast, Coast. Eng. J., doi:10.1142/S0578563416400052,
2016.
Muramatsu, T.: The Study on the Changes of the Three-dimensional
Structure and the Movement Speed of the Typhoon through its
Life Time, Tech. Rep., Meteorol. Res. Inst. Japan, no. 14. 117
pp., 1985.
Myers, V. A.: Characteristics of United States hurricanes pertinent
to levee design for lake Okeechobee, Florida, Hydrometeorolog-
ical Report, US Weather Bureau, No. 32, 106 pp., 1954.
Muramatsu, T.: The Study on the Changes of the Three-dimensional
Structure and the Movement Speed of the Typhoon through its
Life Time, Tech. Rep., Meteorol. Res. Inst. Japan, Number 14,
117 pp., 1985.
Nakajo, S., Mori, N., Kim, S. Y., Yasauda, T., Yamada, F., and Mase,
H.: Basic study on estimation method of return period and varia-
tion range of severe storm surge event, Proceedings of 34th Con-
ference on Coastal Engineering, 11 pp., 2014.
Nakamura, R., Oyama, T., Shibayama, T., Esteban, M., and Takagi,
H.: Evaluation of storm surge caused by Typhoon Yolanda (2013)
and using weather-storm surge-wave-tide model. 8th Interna-
tional Conference on Asian and Pacific Coasts (APAC2015),
Madras, India, doi:10.1016/j.proeng.2015.08.306, 2015.
Persing, J. and Montgomery, M. T.: Is Environmental CAPE Impor-
tant in the Determination of Maximum Possible Hurricane Inten-
sity?, J. Atmos. Sci., 62, 542–550, 2005.
Quiring, S., Schumacher, A., Labosier, C., and Zhu, L.: Variations
in mean annual tropical cyclone size in the Atlantic, J. Geophys.
Res., 116, D09114, doi:10.1029/2010JD015011, 2011.
Roeber, V. and Bricker, J. D.: Destructive tsunami-like wave gener-
ated by surf beat over a coral reef during Typhoon Haiyan, Nature
Commun., 6, 7854, doi:10.1038/ncomms8854, 2015.
RSMC Tokyo: Activities of RSMC Tokyo and its Contribu-
tion to SWFDP in Southeast Asia, DPFS/RAII/SeA-SWFDP-
RSMT/Doc. 5.2.2, World Meteorological Organization, 13 pp.,
2015.
Sampson, C. R., Jeffries, L. R., Chu, J. H., and Neumann, C. J.:
Tropical Cyclone Forecasters Reference Guide 6. Tropical Cy-
clone Intensity, Naval Research Laboratory, NRL/PU/7541-95-
0012, 1995.
Shea, D. J. and Gray, W. M.: The hurricane’s inner core region. I.
Symmetric and asymmetric structure, J. Atmos Sci., 30, 1544–
1564, 1973.
Takagi, H., Kashihara, H., Esteban, M., and Shibayama, T.:
Assessment of future stability of breakwaters under climate
change, Coast. Eng. J., World Scientific Ltd., 53, 21–39,
doi:10.1142/S0578563411002264, 2011.
Takagi, H., Nguyen, D. T., Esteban, M., Tam, T. T., Knaepen, H.
L., and Mikami, T.: Vulnerability of coastal areas in Southern
Vietnam against tropical cyclones and storm surges , The 4th In-
ternational Conference on Estuaries and Coasts (ICEC2012), 8
pp., 2012.
Takagi, H., Esteban, M., Shibayama, T., Mikami, T., Matsumaru, R.,
Nguyen, D. T., Oyama, T., and Nakamura, R.: Track Analysis,
Nat. Hazards Earth Syst. Sci., 16, 705–717, 2016 www.nat-hazards-earth-syst-sci.net/16/705/2016/
H. Takagi and W. Wu: Maximum wind radius estimated by the 50 kt radius 717
Simulation and Field Survey of the 2013 Typhoon Haiyan Storm
Surge, J. Flood Risk Manage., in press, doi:10.1111/jfr3.12136,
2015a.
Takagi, H. and Esteban, M.: Statistics of Tropical Cyclone Land-
falls in The Philippines, Unusual Characteristics of 2013 Ty-
phoon Haiyan, Nat. Hazards, 80, 211–222, doi:10.1007/s11069-
015-1965-6, 2015b.
Takagi, H., Li, S., de Leon, M., Esteban, M., Mikami, T., Mat-
sumaru, R., Shibayama, T., and Nakamura, R.: Storm surge and
evacuation in urban areas during the peak of a storm, Coast. Eng.,
108, 1–9, doi:10.1016/j.coastaleng.2015.11.002, 2016.
Vickery, P. and Wadhera, D.: Statistical models of Holland pressure
profile parameter and radius to maximum winds of hurricanes
from flight-level pressure and H∗Wind data, J. Appl. Meteorol.
Climatol., 47, 2497–2517, 2008.
www.nat-hazards-earth-syst-sci.net/16/705/2016/ Nat. Hazards Earth Syst. Sci., 16, 705–717, 2016