Embed Size (px)
Citation preview
Maximum Willingness to Pay and Minimum
Compensation Demand for Natural Forest
Protection in Dinh Hoa District, Northern Vietnam
Dissertation
with the aim of achieving
a doctoral degree
at the Faculty of Mathematics, Informatics and Natural Sciences
Department of Biology
of Universität Hamburg
submitted by
Thi Thanh Ha Nguyen
Hamburg, 2015

Day of oral defense: 06.4.2016
The following evaluators recommended the admission of the dissertation:
Supervisor: Prof. Dr. Michael Köhl
Co-supervisor: Prof. Dr. Udo Mantau

Declaration
I hereby declare, on oath, that I have written the present dissertation by my own and have
not used other than the acknowledged resources and aids.
Hamburg, 03 December 2015
Thi Thanh Ha Nguyen
English review testimonial
I certify that the English of the dissertation
Maximum Willingness to Pay and Minimum Compensation Demand for Natural
Forest Protection in Dinh Hoa District, Northern Vietnam
written by Thi Thanh Ha Nguyen was reviewed and is correct.
The dissertation was reviewed by Susan J. Ortloff (US citizen), freelance translator and
editor.
Susan J. Ortloff
November 16, 2015

Acknowledgement
I would like to take this opportunity to express my deep gratitude to my supervisor, Prof.
Dr. Michael Köhl, for his valuable guidance, comments, encouragement, and hours of
discussion. My sincere gratitude goes to my co-supervisor, Prof. Dr. Udo Mantau, for his
support, guidance, and motivation. Without their incredible support and encouragement,
this work would never have been possible.
I am indebted to Dr. Joachim Krug for making my participation in this project possible and I
would like to thank for his kindly support for the field trip to Vietnam. I also thank Dr. Jobst-
Michael Schröder and Dr. Benhard Kenter for supporting me in my academic courses, Dr.
Georg Becher for his statistic support, and Jutta Lax and Dr. Prem Neupane for their helpful
discussion and comments on my dissertation. Special thanks go to Mrs. Doris Wöbb and
Mrs. Sybille Wöbb for their unlimited help in administrative issues and their caring
assistance during my stay in Germany.
I would like to thank Assoc. Prof. Dr. Mau Dung Nguyen, Dr. Dang Thuy Truong, and Assoc.
Prof. Dr. Anh Tai Do for their discussion and technical support. I want to thank the leaders
of the communes and wards, the leaders of the villages, and the foresters who supported
me in conducting the study surveys in Vietnam. My thanks go to the interviewer team from
Thai Nguyen University of Agriculture and Forestry and Thai Nguyen University for
Economics and Business. I am very grateful for all my colleagues at the University of
Hamburg, Institute for World Forestry and the Industrial Economics Faculty at Thai Nguyen
University of Technology for their support. I want to thank Vietnam Ministry of Education
and Training (MOET), the German Academic Exchange Service (DAAD), and the Institute for
World Forestry, University of Hamburg for financial support.
Special thanks go to Susan J. Ortloff for the final English review.
Last but not least, my loving thanks go to my husband Van Tu Phan and my daughter Ha My
Phan for their patience, understanding, encouragement, and support during my study
abroad. My respect goes to my parents and parents-in-law for their support to my small
family in Vietnam.
I
Summary
Forests, like many other natural resources, provide a variety of ecosystem services such as
watershed, habitats for plants and animals, carbon sequestration, landscape beauty, which
are considered public goods. There is no cost to the public for these valuable ecosystem
services. Ecosystem services users are free to enjoy their benefits and ecosystem services
providers have no incentive to protect and maintain the continuous provision of ecosystem
services. The market fails to value natural resources properly, and thus affects the
sustainability of natural resources, particularly scarce resources. Contingent valuation
method uses willingness to pay and willingness to accept as economic tools to address the
market failures by providing financial incentives to sustain the provision of ecosystem
services.
Direct payments to households and individuals, which are contracted natural forests for
protection, have been implemented in Vietnam since 1998. However, the payment of VND
100,000 (US$ 4.8) per hectare per year is insufficient to fully compensate opportunity costs
of forest protection and management, and thus does not motivate the participation of the
local households. On the other hand, the Vietnamese government is limited in its payments
for natural forest protection by other competing priorities. Now is the time to involve the
voice and options of not only the individuals who depend on the forest for their livelihoods,
but also the general public in the forest management. A clear understanding of public
awareness and perception regarding natural forest protection and the diversification of
financial resources to support these protection programs are necessary to ensure the
sustainability of natural forest resources.
This study uses the contingent valuation method to evaluate the cost of natural forest
protection, assess livelihoods of forest dependent households, and identify public
perception regarding sustainable forest management in Vietnam. The study aims to
determine the level of willingness to accept compensation by the local rural households
that are contracted natural forests for protection, the willingness of local residents to pay
for the protected forests, and the factors that influence the willingness to protect forests in
a case study in Dinh Hoa district, Thai Nguyen province, northern Vietnam.
II
The results showed that rural households in Dinh Hoa district are poor and mainly rely on
agricultural activities for self-consumption, i.e., most agricultural and forest products are
used for subsistence purposes. Forest products such as fuelwood, timber, bamboo, and
palm tree products are important to local household; their contribution to the total
household income (21%) is significant. The acceptance of compensation level varies
between the households contracted different types of forest. On average, willingness to
accept is estimated to be VND 398,000 (US$ 19) per hectare per year, yielding a five-year
natural forest protection in Dinh Hoa project costs of VND 18.7 billion (US$ 891,162). The
estimated amount of compensation is nearly four times higher than the current payment
level of the government for forest protection. The area of forest land that households hold,
demographic characteristics (ethnic group), distance from homestead to the forest
boundary, and types of forest products collected are the major influencing factors to
willingness to accept.
The local residents are well aware of the importance of forests to their communities and
perceive that the protection of natural forests is an efficient way to improve the quality of
the environment. They are willing to pay VND 43,000 (US$ 2.1) per household as a one-
time payment, which would raise a total fund of about VND 12.5 billion (US$ 593,810) for
natural forests protection at a district scale. The willingness to pay is influenced by the level
of payment, the public awareness of benefits provided by forests to communities, previous
visits to the forest, and household income.
The study proved that willingness to pay and willingness to accept can be used as a proxy
to identify economic incentives for local farmers to restore forest land and understand the
underlying factors that influence the willingness to protect forest. The payment level
estimated by this study is an empirical suggestion to amend the current payment policy to
meet the local households’ expectations and to encourage the involvement of the locals in
the forest management in the local context in the tropics. The findings of this study support
an increase in payment level for the provincial Forest Protection and Development Fund,
Payments for Forest Environmental Services, and the United Nations Program on Reducing
Emissions from Deforestation and Forest Degradation pilot projects which are currently
being conducted in Vietnam.
III
Table of contents
Summary ..................................................................................................................................... I
Table of contents ...................................................................................................................... III
List of tables ............................................................................................................................. VII
List of figures ............................................................................................................................. IX
List of appendices ...................................................................................................................... X
List of abbreviations .................................................................................................................. XI
CHAPTER 1: INTRODUCTION ................................................................................................ 1
1.1. Statement of problem ......................................................................................................... 1
1.2. Objectives ........................................................................................................................... 4
1.3. Method ............................................................................................................................... 5
1.4. Dissertation structure ......................................................................................................... 5
CHAPTER 2: FOREST AND FOREST MANAGEMENT IN VIETNAM ............................................. 7
2.1. Country profile .................................................................................................................... 7
2.2. Forest resources .................................................................................................................. 8
2.2.1. Forest cover ............................................................................................................... 8
2.2.2. Forest ecosystem ..................................................................................................... 10
2.2.3. Forest biodiversity.................................................................................................... 10
2.2.4. Timber and NTFPs harvesting, processing, and trade.............................................. 11
2.3. Forest management .......................................................................................................... 12
2.3.1. State management of forest resources ................................................................... 12
2.3.2. Forest policy reform ................................................................................................. 13
2.3.2.1. Rehabilitation programs ................................................................................. 14
2.3.2.2. Sustainable management ............................................................................... 16
2.3.2.3. Forest land allocation ..................................................................................... 17
2.3.2.4. Benefit sharing policy ..................................................................................... 19
CHAPTER 3: LITERATURE REVIEW ........................................................................................ 21
3.1. Payments for ecosystem services ..................................................................................... 21
3.1.1. The logic of payments for ecosystem services ......................................................... 21
IV
3.1.2. PES definition ........................................................................................................... 22
3.1.3. PES in the tropics...................................................................................................... 23
3.1.4. PES in Vietnam ......................................................................................................... 24
3.2. Economic valuation of forest ecosystem .......................................................................... 29
3.2.1. Reasons for valuation ............................................................................................... 29
3.2.2. The nature of economic valuation ........................................................................... 29
3.3. Total economic value ........................................................................................................ 30
3.4. Economic valuation techniques ........................................................................................ 32
3.4.1. Market valuation ...................................................................................................... 33
3.4.1.1. Market price method ..................................................................................... 33
3.4.1.2. Production function method .......................................................................... 34
3.4.2. Non-market valuation .............................................................................................. 34
3.4.2.1. Revealed preference method ......................................................................... 34
3.4.2.2. Stated preference method ............................................................................. 36
3.5. Contingent valuation method ........................................................................................... 38
3.5.1. Introduction ............................................................................................................. 38
3.5.2. Definition of contingent valuation method ............................................................. 39
3.5.3. Theoretical background of the contingent valuation method ................................. 39
3.5.3.1. Demand curve and willingness to pay ............................................................ 39
3.5.3.2. Hicksian welfare measures ............................................................................. 41
3.5.3.3. Willingness to pay or willingness to accept .................................................... 44
3.5.4. Contingent valuation surveys in developing countries ............................................ 45
CHAPTER 4: DATA AND METHODS ..................................................................................... 48
4.1. Study site ........................................................................................................................... 48
4.1.1. Thai Nguyen province .............................................................................................. 48
4.1.2. Dinh Hoa district ...................................................................................................... 49
4.2. Sample size ........................................................................................................................ 51
4.2.1. WTP survey .............................................................................................................. 52
4.2.2. WTA survey .............................................................................................................. 54
4.3. Data collection .................................................................................................................. 55
4.3.1. Survey methods ....................................................................................................... 55
4.3.2. Secondary data collection ........................................................................................ 57
4.3.3. Focus group discussion ............................................................................................ 57
V
4.3.3.1. WTP survey ..................................................................................................... 57
4.3.3.2. WTA survey ..................................................................................................... 58
4.3.4. Pre-test ..................................................................................................................... 59
4.4. Questionnaire design ........................................................................................................ 60
4.4.1. Double-bounded dichotomous choice approach .................................................... 60
4.4.2. Questionnaire structure ........................................................................................... 64
4.4.2.1. WTP survey ..................................................................................................... 64
4.4.2.2. WTA survey ..................................................................................................... 66
4.5. Method ............................................................................................................................. 67
4.5.1. WTP model ............................................................................................................... 67
4.5.1.1. Double-bounded logit model ......................................................................... 67
4.5.1.2. Model specification ........................................................................................ 69
4.5.1.3. Variables definition......................................................................................... 69
4.5.1.4. Mean and median WTP .................................................................................. 72
4.5.1.5. WTP aggregation ............................................................................................ 73
4.5.2. WTA model ............................................................................................................... 73
4.5.2.1. Double-bounded logit model ......................................................................... 73
4.5.2.2. Model specification ........................................................................................ 75
4.5.2.3. Variables definition......................................................................................... 75
4.5.2.4. Mean and median WTA .................................................................................. 78
4.5.2.5. WTA aggregation ............................................................................................ 79
4.5.3. Goodness of fit ......................................................................................................... 79
CHAPTER 5: RESULTS .......................................................................................................... 81
5.1. WTP survey ....................................................................................................................... 81
5.1.1. Response rate, protest and zero responses ............................................................. 81
5.1.2. Socio-economic characteristics of respondents ...................................................... 82
5.1.3. Attitudes and preferences towards forest protection ............................................. 86
5.1.4. Certainty of responses ............................................................................................. 91
5.1.5. Results of regression analysis .................................................................................. 92
5.1.6. WTP curves ............................................................................................................... 96
5.1.7. Mean and median WTP ............................................................................................ 97
5.1.8. Total WTP for natural forest protection in Dinh Hoa ............................................... 98
5.2. WTA survey ....................................................................................................................... 99
VI
5.2.1. Response rate and protest responses ...................................................................... 99
5.2.2. Demographic and socio-economic characteristics .................................................. 99
5.2.3. Forest situation and households´ perception towards forest protection ............. 104
5.2.4. Certainty of responses ........................................................................................... 107
5.2.5. Results of regression analysis ................................................................................ 107
5.2.6. WTA curves ............................................................................................................ 112
5.2.7. Mean and median WTA ......................................................................................... 114
5.2.8. Costs of natural forest protection in Dinh Hoa ...................................................... 115
CHAPTER 6: DISCUSSION .................................................................................................. 116
6.1. Perception and attitudes of local residents towards natural forest protection ............. 116
6.2. WTP and factors influence WTP ..................................................................................... 117
6.3. Livelihoods of forest dependent households ................................................................. 118
6.4. WTA and factors influence WTA ..................................................................................... 119
6.5. Costs of natural forest protection ................................................................................... 120
6.6. Payment for forest protection and PFES ........................................................................ 121
6.7. Payment for forest protection and REDD+ ..................................................................... 122
6.8. Payment for forest protection and poverty alleviation .................................................. 123
6.9. Payment for forest protection and equity ...................................................................... 124
6.10. Payment for forest protection and local involvement in decision making ................... 124
6.11. Conditional payment for forest protection .................................................................. 125
6.12. Payment for forest protection and capacity building and technical support ............... 126
CHAPTER 7: CONCLUSION ................................................................................................ 127
References ............................................................................................................................. 130
Appendix ................................................................................................................................ 141
Publication ............................................................................................................................. 167
VII
List of tables
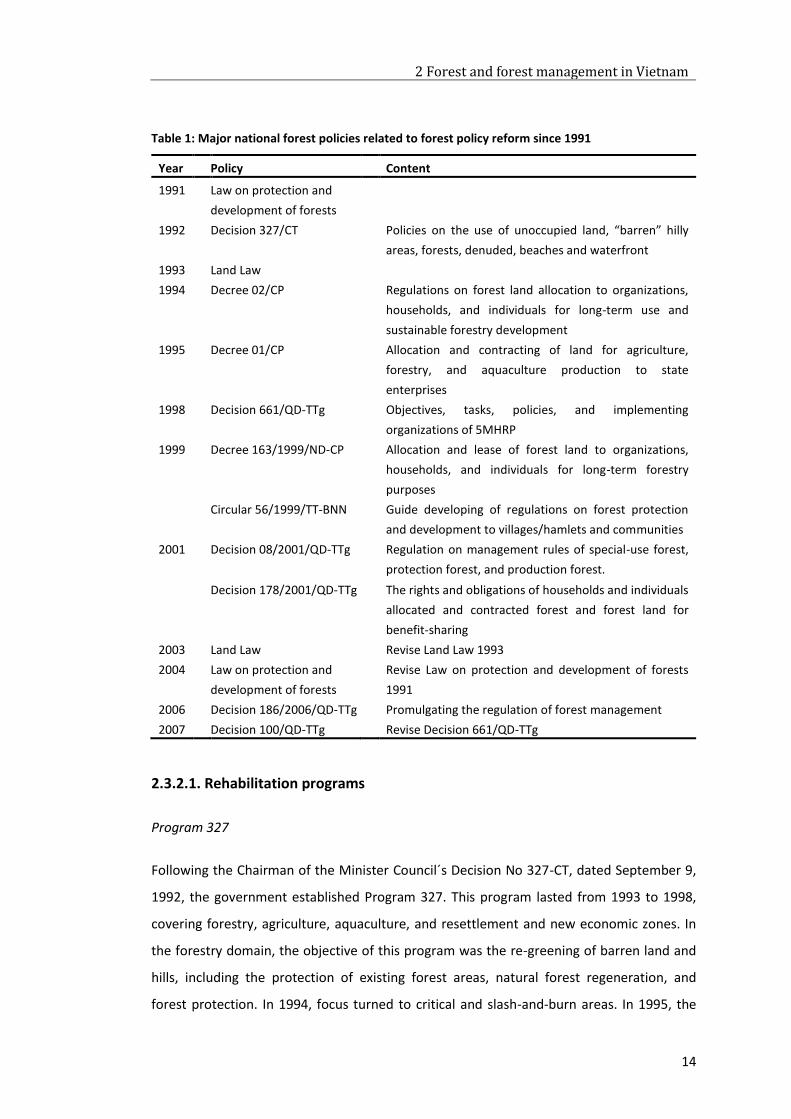
Table 1: Major national forest policies related to forest policy reform since 1991 .............. 14
Table 2: Forest land allocation, from VFPD (2012) ................................................................ 19
Table 3: Payment level for PFES, from Pham et al. (2013) and Vietnam Government (2010)
............................................................................................................................................... 26
Table 4: Welfare measures for an environmental gain and loss ........................................... 43
Table 5: Forest area in Dinh Hoa district, from FIPI (2010) ................................................... 51
Table 6: Distribution of sample in WTP survey ...................................................................... 53
Table 7: Distribution of sample in WTA survey ..................................................................... 55
Table 8: Bid design – WTP survey .......................................................................................... 63
Table 9: Bid design – WTA survey .......................................................................................... 64
Table 10: Definition of the variables influencing WTP .......................................................... 70
Table 11: Definition of the variables influencing WTA .......................................................... 76
Table 12: Reasons for zero responses ................................................................................... 82
Table 13: Demographic and socio-economic characteristics of respondents ....................... 83
Table 14: Average household income and expenditure ........................................................ 85
Table 15: Awareness of respondents towards Dinh Hoa forest situation ............................. 90
Table 16: Respondents´ perspective on Dinh Hoa forest protection (%) .............................. 91
Table 17: Reasons for accepting to bids offered – WTP survey ............................................ 92
Table 18: Parameter estimate – Phu Binh and Dinh Hoa districts (Model 1) ........................ 93
Table 19: Parameter estimate – Thai Nguyen city (Model 2) ................................................ 94
Table 20: Parameter estimate – Total sample (Model 3) ...................................................... 95
Table 21: Proportion of acceptance to the first and the second bid offered (WTP) ............. 96
Table 22: Mean and median WTP .......................................................................................... 98
Table 23: Demographic and socio-economic characteristics of forest contracted households
............................................................................................................................................. 100
Table 24: Forest products collected..................................................................................... 101
Table 25: Main cultivated crops........................................................................................... 102
Table 26: Number of domestic livestock ............................................................................. 102
Table 27: Household incomes, separated by forest types ................................................... 103
Table 28: Appraisal of changes of forest related issues (%) ................................................ 106
Table 29: Forest contracted households´perspective on Dinh Hoa forest protection (%) .. 107
VIII
Table 30: Reasons for accepting the bids offered – WTA survey ........................................ 107
Table 31: Parameter estimates – Special-use forest (Model 4)........................................... 108
Table 32: Parameter estimates – Protection forest (Model 5) ............................................ 109
Table 33: Parameter estimates – Production forest (Model 6) ........................................... 110
Table 34: Parameter estimates – Total sample WTA (Model 7) .......................................... 111
Table 35: Proportion of acceptance to the first and second bid offered (WTA) ................. 112
Table 36: Mean and median WTA ....................................................................................... 114
IX
List of figures
Figure 1: Map of Vietnam, adapted from FAO (2010) ............................................................. 7
Figure 2: Forest cover, adapted from FAO (2010) ................................................................... 9
Figure 3: Land cover map, from Qeiroz et al. (2013) ............................................................. 10
Figure 4: The logic of PES; adapted from Engel et al. (2008) and Pagiola and Platais (2007) 22
Figure 5: Total Economic Value framework, adapted from Mourato (2014) and Pagiola et al.
(2004) ..................................................................................................................................... 31
Figure 6: Economic valuation methods, adapted from Atkinson et al. (2012) and Garrod and
Willis (1999) ........................................................................................................................... 33
Figure 7: Demand and willingness to pay, adapted from Bateman (2004) ........................... 40
Figure 8: Indifference curves and the budget constraint, from Sloman (2009) .................... 41
Figure 9: Measure of change in human welfare, adapted from Bateman et al. (2002) ........ 42
Figure 10: Map of forest types in Dinh Hoa district, adapted from FIPI (2010) .................... 50
Figure 11: Sample site of WTP survey .................................................................................... 53
Figure 12: Sample site of WTA survey ................................................................................... 54
Figure 13: Double-bounded dichotomous format - WTP ...................................................... 62
Figure 14: Double-bounded dichotomous format - WTA ...................................................... 63
Figure 15: Distribution of household income and expenditure by selected income class .... 84
Figure 16: Ranking of general issues ...................................................................................... 87
Figure 17: Ranking of important environmental issues ......................................................... 88
Figure 18: Ranking of forest functions ................................................................................... 89
Figure 19: Probability of WTP the bids offered ..................................................................... 97
Figure 20: Distribution of household incomes ..................................................................... 103
Figure 21: Three most important roles of forests to the communities in Dinh Hoa ........... 105
Figure 22: Probability of WTA the bids offered ................................................................... 113
Figure 23: Total value WTA and WTP .................................................................................. 121
X
List of appendices
Appendix 1: Important products and economic value of several priority species, from
Luoma-aho (2004) ................................................................................................................ 141
Appendix 2: Dinh Hoa forest allocation, from ATKFMB (2013) ........................................... 142
Appendix 3: Structure of WTP focus group discussion ........................................................ 143
Appendix 4: Structure of WTA focus group discussion ........................................................ 144
Appendix 5: Questionnaire – WTP survey ........................................................................... 145
Appendix 6: Questionnaire – WTA survey ........................................................................... 153
Appendix 7: Percentage of saying “Yes/Yes”, “Yes/No”, “No/Yes”, “No/No” - WTP survey
............................................................................................................................................. 166
Appendix 8: Percentage of saying “Yes/Yes”, “Yes/No”, “No/Yes”, “No/No” - WTA survey
............................................................................................................................................. 166
XI
List of abbreviations
5MHRP 5 Million Hectares Reforestation Program
AB Averting Behavior
ASEAN Association of Southeast Asian Nations
ATKFMB ATK Dinh Hoa Forest Management Board
CAC Command-and-Control
CBA Cost-Benefit Analysis
CBFM Community Based Forest Management
CEPF Critical Ecosystem Partnership Fund
CF Community Forestry
CIA Central Intelligence Agency
CIFOR Center for International Forestry Research
CM Choice Modeling
CONAFOR National Forestry Commission
CV Compensation Variation
CVM Contingent Valuation Method
DBDC Double-Bounded Dichotomous Choice
DC Dichotomous Choice
EEPSEA Economy and Environment Program for Southeast Asia
ES Ecosystem Services
EV Equivalent Variation
FAO Food and Agriculture Organization of the United Nations
FCPF Forest Carbon Partnership Facility
FIPI Forest Inventory and Planning Institute
FLA Forest Land Allocation
FMB Forest Management Board
FONAFIFO National Forest Financing Fund
FPDF Provincial Forest Protection and Development Fund
GDP Gross Domestic Product
GIZ German Agency for International Cooperation
GSO General Statistics Office of Vietnam
ha Hectare
XII
HP Hedonic Pricing
ICO International Coffee Organization
IPC International Pepper Community
ITC International Trade Center
IUCN International Union for Conservation of Nature
kg Kilogram
km Kilometer
MARD Ministry of Agriculture and Rural Development
MA Millennium Ecosystem Assessment
MOF Ministry of Finance
MONRE Ministry of Natural Resources and Environment
MP Market Price
NGO Non-Governmental Organization
NOAA National Oceanic and Atmospheric Administration (US)
NTFPs Non-Timber Forest Products
PES Payments for Ecosystem Services
PF Production Function
PFES Payments for Forest Environmental Services
PPP Purchasing Power Parity
Ramsar The Ramsar Convention on Wetlands
REDD Reducing Emissions from Deforestation and Forest Degradation
REDD+ Reducing Emissions from Deforestation and Forest Degradation and the role
of conservation, sustainable management of forests and enhancement of
forest carbon stocks in developing countries
RP Revealed Preference
R-PIN Readiness Plan Idea Note
SBDC Single-Bounded Dichotomous Choice
SFEs State Forest Enterprises
SP Stated Preference
TC Travel Cost
TEV Total Economic Value
TSO Thai Nguyen Statistics Office
UN United Nations
XIII
UNEP United Nations Environmental Program
UNESCO United Nations Educational, Scientific and Cultural Organization
UNFCCC United Nations Framework Convention on Climate Change
UNFPA United Nations Population Fund
UN-REDD United Nations Program on Reducing Emissions from Deforestation and
Forest Degradation
US$ United States Dollar
VFPD Vietnam Forest Protection Department
VND Vietnam Dong
VNFF Vietnam Forest Protection and Development Fund
WB World Bank
WTA Willingness To Accept
WTP Willingness To Pay
1 Introduction
1
CHAPTER 1: INTRODUCTION
1.1. Statement of problem
Forests, like many other natural resources, provide a variety of ecosystem services (ES) such
as watershed, habitats for plants and animals, carbon sequestration, landscape beauty,
which are considered public goods. There is no cost to the public for these valuable ES. ES
users are free to enjoy their benefits and ES providers have no incentive to protect and
maintain the continuous provision of ES. The market fails to value natural resources
properly, and thus affects the sustainability of natural resources, particularly scarce
resources.
Although the rate of deforestation slightly decreased in the 2000s compared to the 1990s,
it is still alarming in many countries, especially in tropical regions where the loss of forest is
the highest (Barbier, 2007; FAO, 2010). Urbanization, agricultural activities, logging, mining,
and fires are judged the direct causes of deforestation (UNCCC, 2007). Subsistence and
commercial agriculture are estimated to be the proximate drivers for approximately 80% of
deforestation worldwide (Kissinger et al., 2012). Effects of tropical deforestation on climate
change, biodiversity conservation, and environment have been a serious global concern
since the early 1990s. It is widely accepted that decreasing tropical deforestation is the key
and most cost effective way to fight against global warming.
Setting up protected areas such as national parks and reserves has been widely practiced in
order to combat tropical deforestation and biodiversity loss since the 1990s. The area of
forest where biodiversity conservation is designated as its primary function has increased
by more than 95 million hectares (ha) since 1990 to 2010 (FAO, 2010). The increasing trend
of the expansion of protected areas and ever growing demands for scarce land for
subsistence agriculture to meet the requirements of food commodities and forest products
for escalating populations and for commercial agriculture resulted in major conflicts in
several parts of the world. In many areas, the livelihoods of the local and indigenous
communities in the vicinity of the protected areas have been seriously affected (MA, 2005).
1 Introduction
2
In order to balance individual well-being and habitat preservation and encourage the
involvement of local people in protecting natural resources, Ferraro (2001) suggested direct
payment as an effective way to compensate the cost of resource maintenance. The
protection of natural forests will be effective if the compensated amount exceeds the costs
of the natural forest protection incurred by the individuals or individual households (Engel
et al., 2008; Pagiola et al., 2003). In other words, the payment, at minimum, should equal
the opportunity costs of natural forest management. Payments for ecosystem services (also
known as payments for environmental services or PES) are emerging as economic tools to
provide income for landowners or farmers for management, conservation, protection, and
restoration of natural resources (UNEP, 2008). These schemes provide incentives to
improve environmental management and the livelihoods of landowners by rewarding
people´s efforts of remaining and providing ES.
The dependency of the local and indigenous communities on forest resources for their
livelihoods in developing countries has motivated policy makers to decentralize forest
management to participating local communities (Pokharel et al., 2015). Community Based
Forest Management (CBFM) systems are becoming popular in developing countries
(Maraseni et al., 2014), however, the modalities of the CBFM differ from country to
country. At least 22% of the total forest area is legally managed by the communities
throughout the world (Nurse and Malla, 2005) and ownership and management of forests
by communities, individuals, and private companies is on the rise (FAO, 2010). Community
Forestry (CF), Forest Land Allocation (FLA) for reforestation purpose, and (natural) forest
contracting to individuals and households for protection purpose are the major modalities
of the CBFM widely practiced in Vietnam. In recent decades, the forest and forest land
management schemes have been considerably successful and have been efficient in
ensuring active involvement of forest user groups, individuals, and individual households
from decision making to implementation of the schemes.
Located in Southeastern Asia, in 1943 Vietnam had a forest area of over 14 million ha, with
a forest cover of 43% (Collins et al., 1991). Due to the excessive reliance on slash-and-burn
agriculture, agriculture land expansion, logging whether legal or illegal, and non-timber
forest products (NTFPs) collection for subsistence needs, forest area declined from 55% in
the 1960s to 17% in the late 1980s. The massive deforestation in Vietnam was even judged
to be the most rapid among Southeast Asian countries (Collins et al., 1991; Koninck, 1999).
In an attempt to restore forest cover, reforestation programs such as “Program 327” and
1 Introduction
3
“Five Million Hectares Reforestation Program” (5MHRP, also known as Program 661) were
launched in the 1990s to improve environmental services, promote the role of the forest
sector in overall economic growth, and secure the livelihoods of the most vulnerable
groups (Sikor, 1998). In Vietnam, forest land belongs to the state. Since the 1990s, the right
to use barren land and planted forests was transferred to rural households and individuals
to manage and protect, while the natural forest was under the management of State Forest
Enterprises (SFEs) and Forest Management Boards (FMBs). The surrounding villages and
households were also allocated natural forests for protection in terms of contract and
regularly paid by the government (Sikor, 1998). The use-rights and obligations of
households vary depending which forest type they are contracted1.
During the period from 1998 to 2006, the payment for natural forest protection was VND
50,000/ha/year (US$ 2.4)2. Although since 2007 the amount of payment increased to VND
100,000/ha/year (US$ 4.8), it is too low in terms of labor cost, and did not adequately
compensate forgone alternative uses. The payment is equal to 1-2% of rural household
incomes (Wunder, 2005a) and not attractive enough for the people to participate in the
protection program in the long term.
The weak management system and the non-corporation of the local stakeholders are the
main causes of deforestation and forest depletion in Vietnam. There is little evidence of
administrative penalties or ownership withdraws for non-compliance with the forest
protection contract (Wunder, 2005a). The lack of adequate and justifiable payment and
unclear use rights might discourage the individuals and individual households to follow the
contract for the long term. Meanwhile, conversion of the natural forests into monoculture
plantations and to agricultural crop cultivation has been noticed in several places of
northern Vietnam.
On the other hand, the Vietnamese government is limited in its payments for natural forest
protection by other competing priorities. A clear understanding of public awareness and
perception regarding natural forest protection and the diversification of financial resources
1 Law on forest protection and development 2004 classified forest into three types: production,
protection, and special-use (Vietnam National Assembly, 2004)
2 US$ 1 VND 21,000

1 Introduction
4
to support these protection programs are necessary to ensure the sustainability of natural
forest resources.
The major questions are: how much the government should pay for forest protection to
meet the local households’ expectations; are individuals who benefit from the forest aware
of the important role of forest´s ES and are they willing to pay for forest protection? Now is
the time to involve the voice and options of not only the individuals who depend on the
forest for their livelihoods, but also the general public in the forest management.
1.2. Objectives
The dissertation aims to evaluate the cost of natural forest protection in a case study
carried out in Dinh Hoa district, northern Vietnam to provide possible suggestions for
developing appropriate payment policy to encourage people to protect the natural forest in
a local context.
The dissertation has the following objectives:
1) To assess the awareness and perception of residents in Thai Nguyen province
towards natural forest protection;
2) To estimate the maximum willingness to pay (WTP) of residents in Thai Nguyen
province for natural forest protection in Dinh Hoa district;
3) To identify the differences of payment levels between urban and rural residents;
4) To assess the livelihoods of rural households which are contracted and allocated
natural forests for protection;
5) To estimate the minimum willingness to accept (WTA) compensation of rural
households which are contracted and allocated natural forests for protection;
6) To identify the differences of payment levels expected by the households which
are contracted and allocated different types of forests (special-use, protection and
production forests);
7) To determine the factors that influence of the WTA and WTP for forest protection;
and
8) To evaluate the cost needed for protecting Dinh Hoa forest.
1 Introduction
5
1.3. Method
The contingent valuation method (CVM) has become the main tool used in cost-benefit
appraisals and environmental impact assessments in environmental economics (Bateman et
al., 2002; Mitchell and Carson, 1989; Pearce et al., 2006) in both developed (Pearce et al.,
2006) and developing countries (Pearce et al., 2002). Established as a preference technique,
contingent valuation is a survey or questionnaire–based approach to obtain the monetary
valuation assignment on non-market goods and services under hypothetical markets
described in the survey scenario. In developing countries, CVM is commonly applied in
areas such as water supply and sanitation, recreation, tourism, national park management,
and biodiversity conservation (Whittington, 1998). Whittington (2010) reports hundreds of
stated preference studies successfully conducted in developing countries over the past two
decades.
In this study, we performed two contingent valuation surveys: WTP and WTA survey, using
a double-bounded dichotomous format, to debrief the local WTP and WTA the
compensation for natural forest protection. A logit model was used to estimate the
parameters of explanatory variables.
1.4. Dissertation structure
This dissertation consists of seven chapters.
Chapter 1 describes the statement of problem, the aims, and the structure of dissertation.
Chapter 2 introduces the local context of the study. The chapter summarizes the socio-
economic characteristics of Vietnam and describes forest resources and forest
management. In this chapter, the forest policy reform is mentioned, including the context
of policy reform, forest rehabilitation programs, sustainable forest management, process of
FLA, and the benefit sharing policy.
Chapter 3 provides the literature review of economic evaluation of forest ecosystem and
application of CVM in environmental economics. This chapter analyses the rationale of
payments for forest environmental services, explains the reasons for economic valuation,
and provides economic valuation techniques including market and non-market valuation.
The chapter then describes the CVM and its application in the environmental researches in
1 Introduction
6
developing countries. The limitation of applying CVM in developing countries is carefully
discussed.
Chapter 4 expresses the study design, data collection, and the methods. First, the chapter
describes the characteristic and the rationale of choosing study sites. Second, the chapter
interprets the steps and methods of collecting data. The survey methods and questionnaire
design are thoroughly discussed. Third, the chapter explains the double-bounded logit
models and defines the explanatory variables. Finally, the chapter interprets the parameter
estimation of the mean and median values of WTP and WTA, and the method of
aggregation of WTP and WTA.
Chapter 5 reports the results of the study. This chapter is divided into two parts: part one
describes the results of WTP survey and part two reports on the WTA survey. Both parts
provide the socio-economic characteristics of respondents, the attitudes and preferences
towards forest protection, and the regression results. In the section covering regression
results, the impacts of explanatory variables and the fit of models are described. The
chapter presents the estimated mean and median values and the aggregation of WTP and
WTA.
Chapter 6 discusses the findings of the study. This chapter discusses perception and
attitudes of the local residents towards natural forest protection, the levels of WTP, and the
factors influencing their WTP. The livelihoods of rural households which are contracted the
allocated natural forest land for protection, their WTA compensation for natural forest
protection, and the factors influencing their WTA are explained. The chapter discusses the
findings in supporting the payment policy related to Payments for Forest Environmental
Services (PFES), Reducing Emissions from Deforestation and Forest Degradation (REDD),
poverty alleviation, equity, local involvement in decision-making, conditional payment,
capacity building, and technical support.
Chapter 7 concludes the empirical findings of the study and possible implication of
contingent valuation approach as an economic tool to provide incentives to the willingness
to protect forests.
2 Forest and forest management in Vietnam
7
CHAPTER 2: FOREST AND FOREST MANAGEMENT IN
VIETNAM
2.1. Country profile
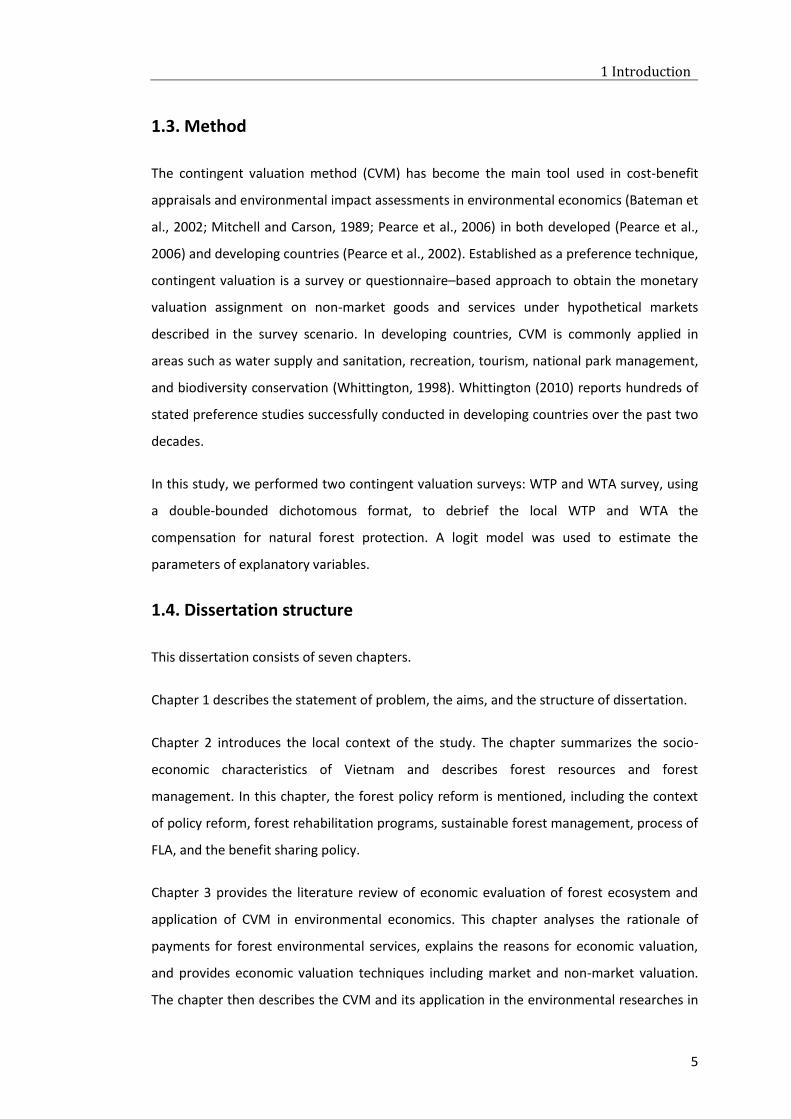
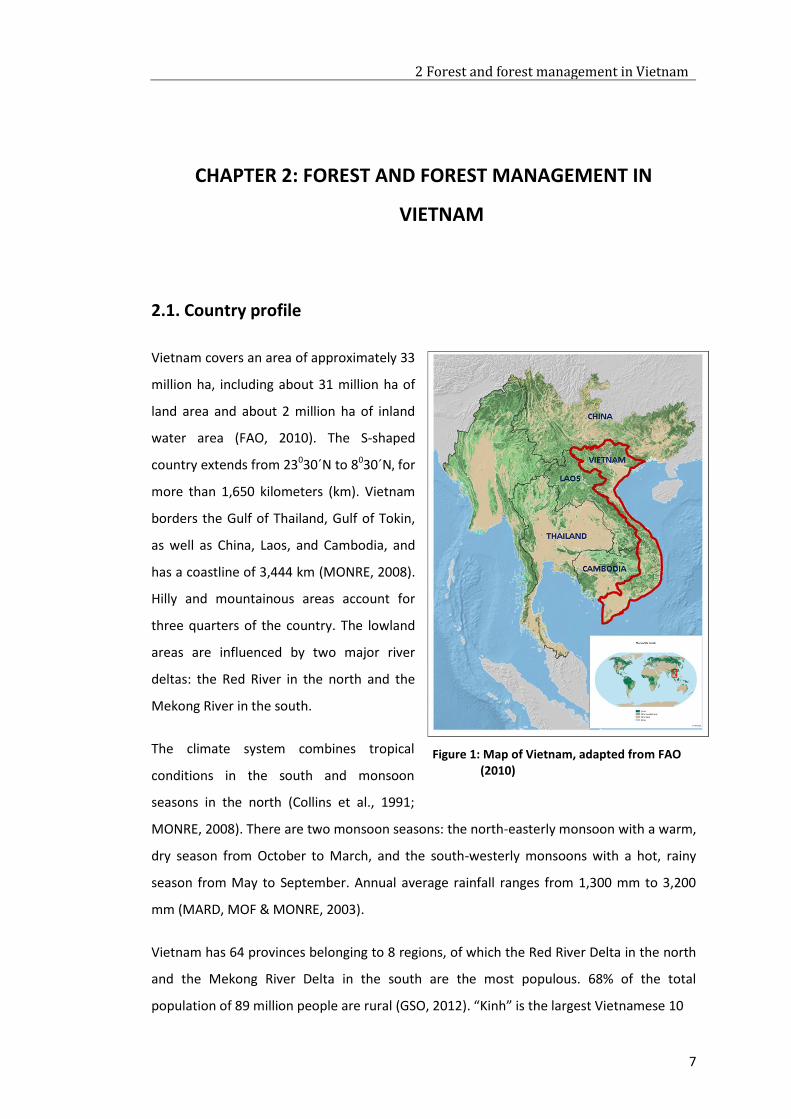
Vietnam covers an area of approximately 33
million ha, including about 31 million ha of
land area and about 2 million ha of inland
water area (FAO, 2010). The S-shaped
country extends from 23030´N to 8030´N, for
more than 1,650 kilometers (km). Vietnam
borders the Gulf of Thailand, Gulf of Tokin,
as well as China, Laos, and Cambodia, and
has a coastline of 3,444 km (MONRE, 2008).
Hilly and mountainous areas account for
three quarters of the country. The lowland
areas are influenced by two major river
deltas: the Red River in the north and the
Mekong River in the south.
The climate system combines tropical
conditions in the south and monsoon
seasons in the north (Collins et al., 1991;
MONRE, 2008). There are two monsoon seasons: the north-easterly monsoon with a warm,
dry season from October to March, and the south-westerly monsoons with a hot, rainy
season from May to September. Annual average rainfall ranges from 1,300 mm to 3,200
mm (MARD, MOF & MONRE, 2003).
Vietnam has 64 provinces belonging to 8 regions, of which the Red River Delta in the north
and the Mekong River Delta in the south are the most populous. 68% of the total
population of 89 million people are rural (GSO, 2012). “Kinh” is the largest Vietnamese 10
Figure 1: Map of Vietnam, adapted from FAO (2010)
2 Forest and forest management in Vietnam
8
ethnic group (86%) living mainly in cities, towns, and lowland centers, whereas the
remaining 53 minority ethnic groups are dispersed across the remote mountainous regions
and depend considerably on natural resources for livelihood (Qeiroz et al., 2013; UNFPA,
2011).
With a GDP of US$ 186 billion at current price, Vietnam is ranked the 55th economy in the
world (WB, 2014). From 2000 to 2013, Vietnam showed a rapidly expanding growth with
the annual GDP growth rate of approximately 7.5% (WB, 2014). In 2012, the GDP per
capital was around US$ 1,700, up 25% compared to 2011 (WB, 2012b). Vietnam belongs to
the lower-middle income group. In 2008, about 17% of the population lived on less than
US$ 1.25 per day and approximately 43% on less than US$ 2 per day (WB, 2012b). As half of
the poor are minority ethnic groups who live in rural, remote, and mountainous areas, the
progress of poverty alleviation has slowed.
The agricultural sector, including agriculture, forestry, and fishing, accounted for 18% of
GDP in 2012 (WB, 2012a), down from 40% in the early 1990s. Agriculture employed
approximately 60% of the labor force and accounted for 30% of export values in 2005 (WB,
2012b). In recent years, Vietnamese agricultural products such as rice, coffee, black
pepper, cashew, and tea have been among the top ten exporters in the world (FAO, 2013,
2015c; ICO, 2013; IPC, 2014; ITC, 2011). According to FAO (2014), Vietnam is the world´s
9th largest marine fisheries producer country, the world´s 15th largest inland fisheries
producer country, and the world´s 4th largest exporter of fish and fishery products.
2.2. Forest resources
2.2.1. Forest cover
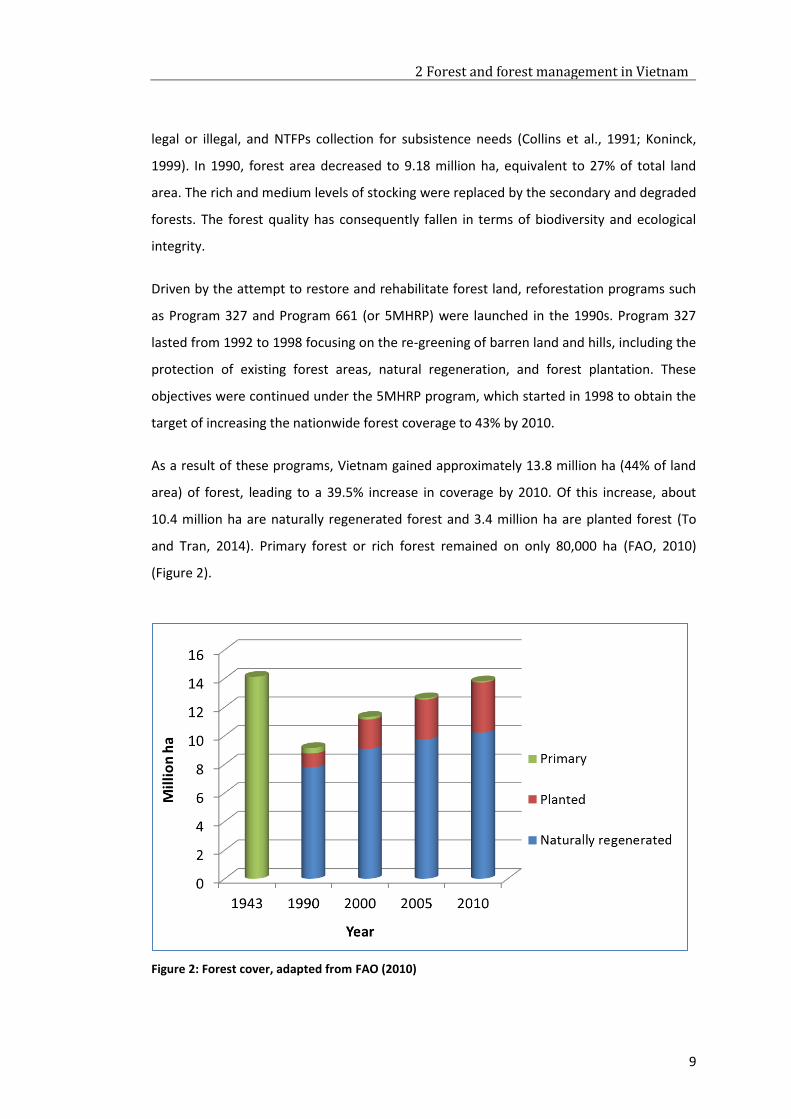
In 1943, the natural forest covered 14.12 million ha, or 43% of national land area. Forests
were allocated mainly in mountainous and hilly areas. During the war period (1945-1975), 4
million ha of forests were damaged by bombardment and application of pesticides (Agent
Orange) (Collins et al., 1991). After war period, Vietnam lost 300,000 ha/year between
1973 and 1985 (Sikor, 1998) and 100,000 ha/year between 1980 and 1990 (FAO, 2009). The
massive deforestation in Vietnam was even the most rapid among Southeast Asian
countries (Koninck, 1999). Forest loss after war period was mainly caused by the excessive
reliance on slash-and-burn agriculture, the expansion of agricultural land, logging whether
2 Forest and forest management in Vietnam
9
legal or illegal, and NTFPs collection for subsistence needs (Collins et al., 1991; Koninck,
1999). In 1990, forest area decreased to 9.18 million ha, equivalent to 27% of total land
area. The rich and medium levels of stocking were replaced by the secondary and degraded
forests. The forest quality has consequently fallen in terms of biodiversity and ecological
integrity.
Driven by the attempt to restore and rehabilitate forest land, reforestation programs such
as Program 327 and Program 661 (or 5MHRP) were launched in the 1990s. Program 327
lasted from 1992 to 1998 focusing on the re-greening of barren land and hills, including the
protection of existing forest areas, natural regeneration, and forest plantation. These
objectives were continued under the 5MHRP program, which started in 1998 to obtain the
target of increasing the nationwide forest coverage to 43% by 2010.
As a result of these programs, Vietnam gained approximately 13.8 million ha (44% of land
area) of forest, leading to a 39.5% increase in coverage by 2010. Of this increase, about
10.4 million ha are naturally regenerated forest and 3.4 million ha are planted forest (To
and Tran, 2014). Primary forest or rich forest remained on only 80,000 ha (FAO, 2010)
(Figure 2).
Figure 2: Forest cover, adapted from FAO (2010)
2 Forest and forest management in Vietnam
10
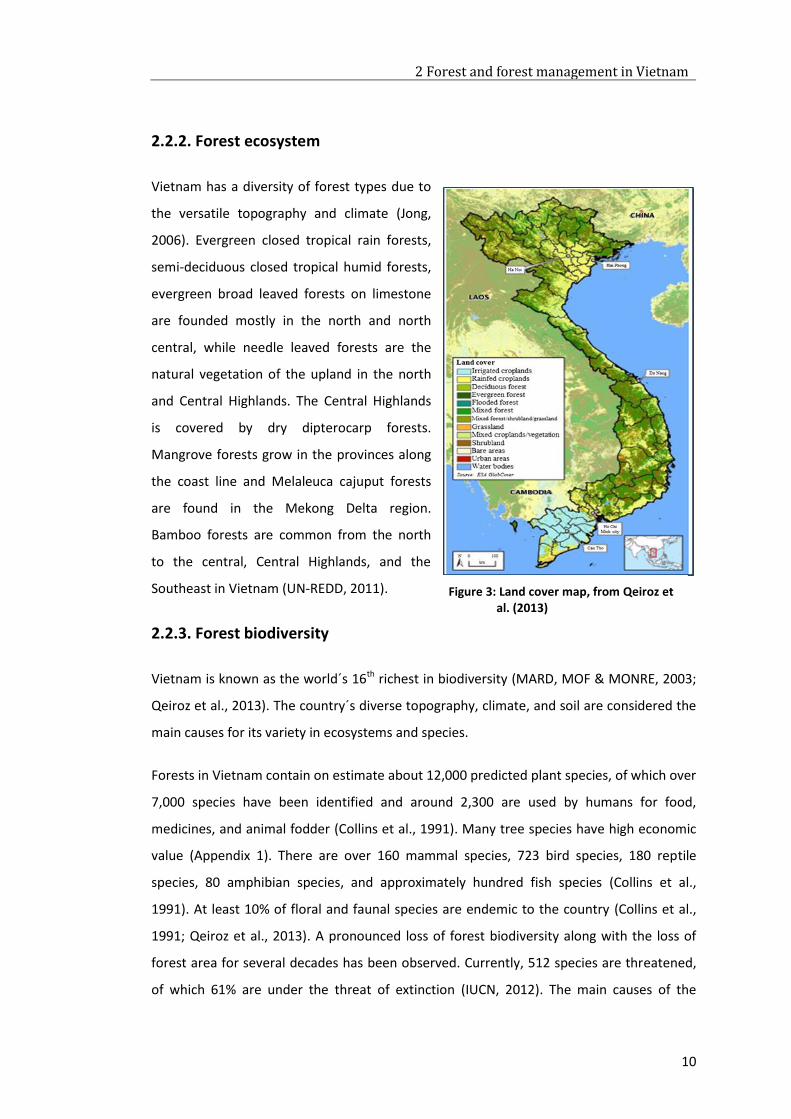
2.2.2. Forest ecosystem
Vietnam has a diversity of forest types due to
the versatile topography and climate (Jong,
2006). Evergreen closed tropical rain forests,
semi-deciduous closed tropical humid forests,
evergreen broad leaved forests on limestone
are founded mostly in the north and north
central, while needle leaved forests are the
natural vegetation of the upland in the north
and Central Highlands. The Central Highlands
is covered by dry dipterocarp forests.
Mangrove forests grow in the provinces along
the coast line and Melaleuca cajuput forests
are found in the Mekong Delta region.
Bamboo forests are common from the north
to the central, Central Highlands, and the
Southeast in Vietnam (UN-REDD, 2011).
2.2.3. Forest biodiversity
Vietnam is known as the world´s 16th richest in biodiversity (MARD, MOF & MONRE, 2003;
Qeiroz et al., 2013). The country´s diverse topography, climate, and soil are considered the
main causes for its variety in ecosystems and species.
Forests in Vietnam contain on estimate about 12,000 predicted plant species, of which over
7,000 species have been identified and around 2,300 are used by humans for food,
medicines, and animal fodder (Collins et al., 1991). Many tree species have high economic
value (Appendix 1). There are over 160 mammal species, 723 bird species, 180 reptile
species, 80 amphibian species, and approximately hundred fish species (Collins et al.,
1991). At least 10% of floral and faunal species are endemic to the country (Collins et al.,
1991; Qeiroz et al., 2013). A pronounced loss of forest biodiversity along with the loss of
forest area for several decades has been observed. Currently, 512 species are threatened,
of which 61% are under the threat of extinction (IUCN, 2012). The main causes of the
Figure 3: Land cover map, from Qeiroz et al. (2013)
2 Forest and forest management in Vietnam
11
biodiversity loss are hunting and trade in wildlife, habitat loss, degradation and
fragmentation, climate change, logging, and unsustainable exploitation (CEPF, 2012).
In order to prevent biodiversity degradation, a system of 173 national protected areas has
been established, covering around 2.5 million ha. The system includes 30 national parks, 58
national reserves, 11 species habitat conservation areas, 45 landscape protection areas, 20
experimental and scientific research areas, and 9 marine protected areas. In addition, there
are three UNESCO Natural World Heritage Sites, eight UNESCO Biosphere Reserves, five
Ramsar Wetlands, four ASEAN Heritage Parks, and 65 Important Bird Areas internationally
recognized (Qeiroz et al., 2013).
The increase of forest cover in recent years is also seen as a promising step towards halting
degradation and improving forest biodiversity. However, the promotion of planted forests
and naturally regenerated forests for economic incentives is widely considered more
attractive than biodiversity regeneration. Primary forest land continues to decrease and is
subject to degradation. Poor management, unsystematic and inconsistent legislations, and
limited community participation are also considered to contribute to the degradation of
biodiversity in Vietnam (MONRE, 2008).
2.2.4. Timber and NTFPs harvesting, processing, and trade
The domestic and export demands for timber and NTFPs are rapidly increasing together
with the rapid growth of Vietnam´s economy. By 2005, round wood harvested for pulp
production, woodchips, composite boards, and other wood products for export and
domestic use amounted to approximately 2.7 million m3 with about 300,000 m3 originating
from natural forests (FAO, 2009). In 2014, plantation harvest volume was about 10.3
million m3; no natural timber harvesting quota was provided (MARD, 2015)3. Timber
products export turnover was US$ 6.3 billion by 2014, including about 4.5 million tons of
furniture and about 6 million tons wood chip (MARD, 2015). Since 2010, Vietnam has
become the main furniture exporter in Southeast Asia. Vietnam wood products have been
3 Vietnamese government issued a logging ban in 1993 to halt the exploitation of natural forests
throughout the country (To and Sikor, 2006) and issued annual quota for harvesting such as 620,000 m
3 in 1996, 522,700 m
3 in 1997, 300,000 m
3 in 1998, 160,000 m
3 in 1999, and 300,000 m
3 since 2000
(Durst et al., 2001).
2 Forest and forest management in Vietnam
12
exported to 120 international markets, of which the United States, Japan, China, EU, and
South Korea are major export markets. In 2014, Vietnam spent US$ 2.5 billion on importing
timber and timber products, mainly from Laos, the United States, Cambodia, China, and
Malaysia (MARD, 2015). The annual domestic timber and timber products sales have been
estimated around US$ 1 billion in recent years (To and Canby, 2011). Fuelwood harvest for
rural areas has maintained at a level of 25-26 million m3/year. The annual value of NTFPs
exports was around US$ 200 million in the period of 2004-2005, including major products
such as bamboo, rattan and rattan products, bee honey, cinnamon, attar, herb, medicine,
resin, and natural chemicals (FAO, 2009).
In total, the forest sector in Vietnam contributes over 1% to the country´s GDP, excluding
significant contributions of forest product processing industry, exports, and environmental
values (FAO, 2009). According to official records, the wood processing industry supplies
more than 300,000 jobs (To and Canby, 2011). Forest sector serves the subsistence needs
of around 26 million people and contributes 10-15% of total incomes of forest households
(FAO, 2009).
2.3. Forest management
2.3.1. State management of forest resources
Before the 1990s, forest land and forest products were considered national assets and
were owned by the state. The state controlled forest resources under the management of
SFEs, from managing, exploiting, processing, and distributing. These SFEs exploited forest
resources as much as possible to meet the external forest products´ demand. The annual
increment was far lower than the annual cut. According to Sikor (1998), the annual
decrease of forest was about 300,000 ha. In addition, the lack of financial investments and
the poor management structure restrained the forest management capacity. State forestry
failed to manage forest resources in a sustainable manner and the SFEs, hence, were one of
the major contributors to the serious forest decline in Vietnam (Jong, 2006).
The failure of the state-centralized control system further raised conflicts between local
and state management. In this period of time, the concept of forest management implied
the protection of forests from local dwellers (Nguyen, 2001). Only 1 of the 22 million
people living in the mountainous regions adjacent to forests were employed by SFEs (Sikor,
2 Forest and forest management in Vietnam
13
1998). The remaining local population had to rely on other resources for their livelihoods
and subsistence needs. Since forest policies were not seen to benefit their interests, it was
impossible to get the local population to cooperate. Forests belonged to the state but were
free for utilization by the locals. Timber and NTFPs became free commodities and forest
clearing for cultivation went uncontrolled. Regardless of government attempts to regulate
law enforcement and administrative punishment, forests were continuously depleted and
degraded.
2.3.2. Forest policy reform
To diminish deforestation and rehabilitate forest resources, two national programs,
Program 327 and Program 661, were launched. At the same time, a number of official
regulations were issued (National Assembly laws, government decrees and decisions by the
Prime Minister and official circulations). The major national forest policies are summarized
in Table 1.
These policies concentrated on the following points:
Forest rehabilitation;
Sustainable management and utilization of forests;
Development of social forestry with the participant of multi sectorial economics;
Improvement in the rural livelihoods by benefit sharing mechanism.
2 Forest and forest management in Vietnam
14
Table 1: Major national forest policies related to forest policy reform since 1991
Year Policy Content
1991 Law on protection and
development of forests
1992 Decision 327/CT Policies on the use of unoccupied land, “barren” hilly
areas, forests, denuded, beaches and waterfront
1993 Land Law
1994 Decree 02/CP Regulations on forest land allocation to organizations,
households, and individuals for long-term use and
sustainable forestry development
1995 Decree 01/CP Allocation and contracting of land for agriculture,
forestry, and aquaculture production to state
enterprises
1998 Decision 661/QD-TTg Objectives, tasks, policies, and implementing
organizations of 5MHRP
1999 Decree 163/1999/ND-CP Allocation and lease of forest land to organizations,
households, and individuals for long-term forestry
purposes
Circular 56/1999/TT-BNN Guide developing of regulations on forest protection
and development to villages/hamlets and communities
2001 Decision 08/2001/QD-TTg Regulation on management rules of special-use forest,
protection forest, and production forest.
Decision 178/2001/QD-TTg The rights and obligations of households and individuals
allocated and contracted forest and forest land for
benefit-sharing
2003 Land Law Revise Land Law 1993
2004 Law on protection and
development of forests
Revise Law on protection and development of forests
1991
2006 Decision 186/2006/QD-TTg Promulgating the regulation of forest management
2007 Decision 100/QD-TTg Revise Decision 661/QD-TTg
2.3.2.1. Rehabilitation programs
Program 327
Following the Chairman of the Minister Council´s Decision No 327-CT, dated September 9,
1992, the government established Program 327. This program lasted from 1993 to 1998,
covering forestry, agriculture, aquaculture, and resettlement and new economic zones. In
the forestry domain, the objective of this program was the re-greening of barren land and
hills, including the protection of existing forest areas, natural forest regeneration, and
forest protection. In 1994, focus turned to critical and slash-and-burn areas. In 1995, the
2 Forest and forest management in Vietnam
15
program concentrated on protecting forests and special-use forests from slash-and-burn
practices. In the period from 1996 to 1998, the program paid attention solely to
maintaining and expanding forest protection activity. In general, Program 327 had a strong
focus on forest protection.
The program was successful in regenerating 299,000 ha and replanting 397,000 ha of
forest. 1.6 million ha were contracted to 466,000 households for protection. In total,
6,791,700 ha of forests were protected (Jong, 2006). Forest cover increased from 27% to
33%. However, there were critical issues associated with this program. The program was
too top-down driven with poorly planned and unpractically implemented practices (MARD,
2001). District authorities and SFEs used 50% of forest protection funds made available by
Program 327 for inefficient and counterproductive measures (Sikor, 1998). New tree
planting relied on a few fast-growing exotic species such as Eucalyptus, Caribbean pine, and
Acacia instead of a slower process of assisted natural regeneration. It is widely accepted
that in Vietnam, achieving a quick increase in forest cover through economic incentives was
considered much more attractive than natural forest regeneration.
Program 661
Program 661, or 5MHRP, was approved by parliament in 1997 and by the Prime Minister
under Decision No. 661/QD-TTg, dated July 29, 1998. The program was a continuation of
Program 327 and lasted from 1998 to 2010. The objectives of 5MHRP were specified as
follows:
Establish five million ha of new forest (two million ha of special-use forest and
protection forest and three million ha of production forest) along with the
protection of existing forests, in order to increase forest cover to 43%; protect the
environment; alleviate natural disasters; increase water availability; preserve gene
resources; and protect biodiversity.
Provide material for construction as well as raw material for the producing of
paper, wood-based panels, NTFPs, and fuelwood, both for local consumption and
export; develop the forest product processing industry; and make forestry an
important economic sector, contributing to the improvement of the socio-
economic situation in mountainous areas.

2 Forest and forest management in Vietnam
16
Use open land and bare hills efficiently; create employment opportunities;
contribute to alleviation of hunger and poverty reduction; support sedentary
cultivation; create stable social conditions; and strengthen national defense and
security.
After 12 years, 4.6 million ha of forest were planted. Forest cover increased to nearly 40%
(MARD, 2010). The lack of funds, no interest of farmers in the rate of loan, and the
insufficient land allocation were major obstacles of the program (Jong, 2006).
2.3.2.2. Sustainable management
The forest exploitation system was gradually replaced by a sustainable management
system. The great concern for the protection of natural forest and reforestation was
addressed in Program 327 and Program 661. Wood harvested from natural forests was
limited to 300,000 m3 per year instead of 1 million m3 as before.
The Law on Forest Protection and Development issued in 1991, revised in 2004, classified
forests in Vietnam into three categories addressing the major modes of utilization:
protection forests, production forests, and special-use forests. The purpose of this
classification was to strengthen the forest functions of production, protection of
environment, and conservation of biodiversity (Do and Le, 2003).
Protection forests are designated for the protection of soil and water, including
headwater protection forests, wind and sand shielding protection forests,
protection forests for tide shielding and sea encroachment prevention protection,
and protection forests for environmental protection.
Special-use forests are designated for the conservation of biological diversity,
scientific research, historical and cultural relics, landscape, and services of
recreation and tourism. National parks, nature conservation zones, landscape
protection areas, and scientific research and experimental forests are included.
Production forests are designated for the production of timber and NTFPs,
including natural production forests, planted production forests, and seeding
forests.
2 Forest and forest management in Vietnam
17
By 2010, the country´s forest resources consisted of 6.52 million ha of production forest,
5.1 million ha of protection forest, and 2.1 million ha of special-use forest (FAO, 2010).
The management of these three types of forests was established in the Regulation of the
Management of Special-use, Protection and Production forest, pursuant to the Prime
Minister’s Decision 08/2001/QD-TTg. The benefit sharing policy (Decision No.
178/2001/QD-TTg, 2001) clarified the rights and obligations of allocated and contracted
forest households along with each type of forest. These economic incentives ensured
promoting the participation of the local population in sustainable forest management.
2.3.2.3. Forest land allocation
Households and individuals
To reduce deforestation and improve local livelihoods, the forest use rights were
transferred from the state to local users, guided by Land Law in 1993. Households and
individuals were identified as the basic management entities of forest and forest land
(Sikor, 1998). Land belongs to the state, but the long term rights to use forests and forest
land can be assigned to the locals. In the beginning, only barren land and planted forests
were allocated to households and individuals for protection and management. SFEs
remained the owners of natural forest and contracted the responsibility for forest
management and protection to the farmers living adjacent to the forests (MOF, 1993).
When Program 327 was implemented, the patches of forest land allocated and contracted
to households and individuals were very small. Each household or individual received on
average five ha of forest land (Wunder, 2005a). The local people claimed that they were
not clear about the boundaries of forest allocated and contracted; and they did not
understand most of the policies (Haimo, 2010; Wunder, 2005a). Furthermore, Program 327
paid most attention to forest protection and ignored the benefit sharing mechanisms. The
FLA process was slow and not very productive.
By 1999, FLA was expanded by Decision No. 187/1999/QD-TTg. SFEs handed forest land
back to the districts which further allocated to households and individuals. Since 1999,
households and individuals could get so-called Red Book Certificates (based on the red
cover of the certificates) for the forests allocated to them. These certificates were valid for
2 Forest and forest management in Vietnam
18
50 years and were intended for renewal without land use change. The households and
individuals holding a Red Book Certificate have the right to transfer, exchange, rent, inherit,
mortgage, and contribute their land as capital for joint ventures with both domestic and
foreign organizations. Recently, natural forests have also been allocated to households and
individuals. Compared to households and individuals who are allocated barren land or
planted forests, households and individuals who are allocated natural forests have fewer
rights. They are not allowed to transfer, exchange, rent, inherit, mortgage, and contribute
their land as capital. The right of harvesting forest resources is likewise limited, depending
on the quality and protective function of the forests.
The maximum of forest land allocated to a household or an individual for a period of 50
years is 30 ha. On expiry of time-of-use, beneficiaries are allowed to extent the lease if they
wish to continue to use the forest land, given that the forest was used properly. The state
also contracts forest land to the households and individuals for long term development and
protection. The period of contracts depends on the type of forests (specified in the
contract).
State Forest Enterprises
According to Decree 200/2004/ND-CP, SFEs were restructured into two types:
SFEs do their own business by self-finance and operate through market
mechanisms became Forest Corporations;
SFEs managing national parks and watersheds were converted to FMBs,
financed by the state. These units can be run as profit making public services.
Depending on the type of forest, forest land was assigned to FMBs or households,
individuals, and organizations.
Special-use forests smaller than 1,000 ha were allocated to households,
individuals, and organizations; forests equal or larger than 1,000 ha to FMBs.
Protection forests smaller than 5,000 ha were allocated to households,
individuals, organization; equal or larger than 5,000 ha to FMBs. A Forest
2 Forest and forest management in Vietnam
19
Protection unit would be set up in case protection forests are equal or larger
than 20,000 ha.
Production forest were allocated or leased to households, individuals, and
organizations
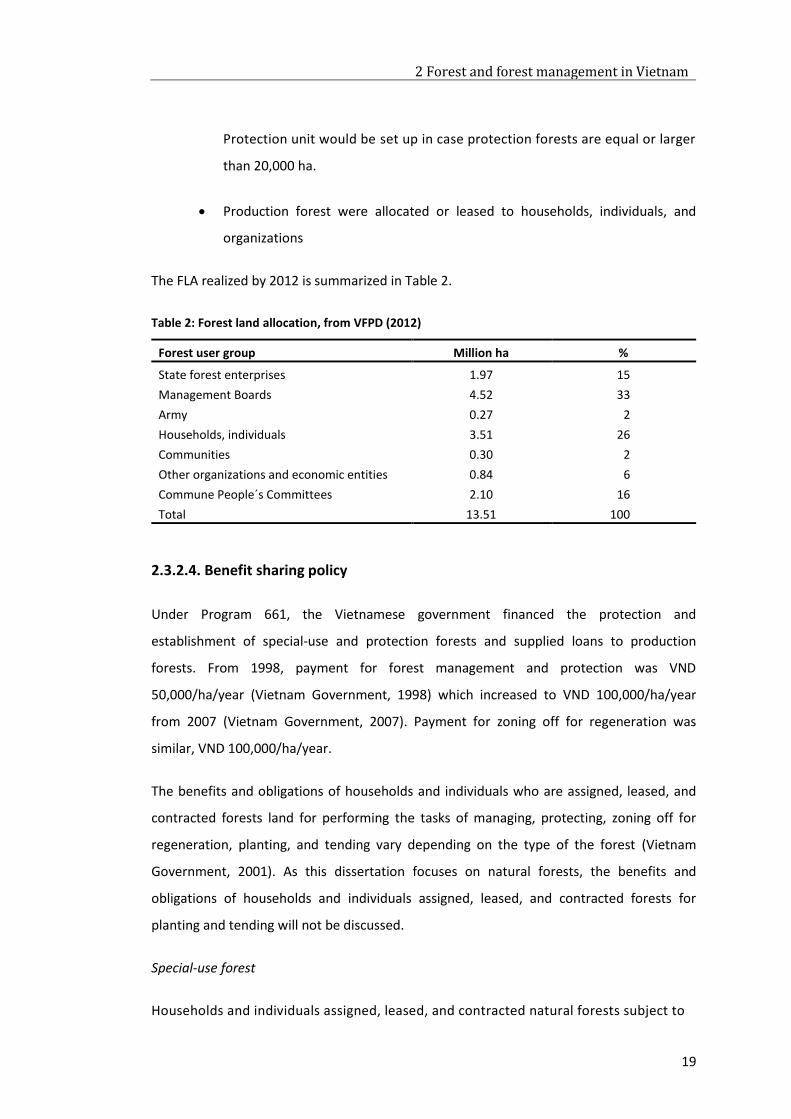
The FLA realized by 2012 is summarized in Table 2.
Table 2: Forest land allocation, from VFPD (2012)
Forest user group Million ha %
State forest enterprises 1.97 15
Management Boards 4.52 33
Army 0.27 2
Households, individuals 3.51 26
Communities 0.30 2
Other organizations and economic entities 0.84 6
Commune People´s Committees 2.10 16
Total 13.51 100
2.3.2.4. Benefit sharing policy
Under Program 661, the Vietnamese government financed the protection and
establishment of special-use and protection forests and supplied loans to production
forests. From 1998, payment for forest management and protection was VND
50,000/ha/year (Vietnam Government, 1998) which increased to VND 100,000/ha/year
from 2007 (Vietnam Government, 2007). Payment for zoning off for regeneration was
similar, VND 100,000/ha/year.
The benefits and obligations of households and individuals who are assigned, leased, and
contracted forests land for performing the tasks of managing, protecting, zoning off for
regeneration, planting, and tending vary depending on the type of the forest (Vietnam
Government, 2001). As this dissertation focuses on natural forests, the benefits and
obligations of households and individuals assigned, leased, and contracted forests for
planting and tending will not be discussed.
Special-use forest
Households and individuals assigned, leased, and contracted natural forests subject to
2 Forest and forest management in Vietnam
20
special-use forest planning are funded by the state for management, protection, and
zoning off for regeneration. They are allowed to conduct scientific researches and cultural,
social, and ecotourism activities.
Protection forest
Households and individuals assigned, leased, and contracted natural forests subject to
protection forest planning are funded by the state for management, protection, and zoning
off for regeneration. They are allowed to exploit NTFPs and dry, dead, and diseased trees.
They can exploit 30% of total volume of bamboo when forest coverage reaches 80% of
assigned land and 20% of timber volume by selective cutting when the forests are allowed
for exploitation.
Production forest
Households and individuals assigned or leased natural forests subject to production forest
planning are allowed to undertake agroforestry practice. They can inter-plant agricultural
and pharmaceutical plants, graze cattle under the forest canopy, collect dead trees, and
harvest forest products to meet their own consumption. They can exploit 10 m3 of timber
to build a new house. When forests are exploitable, they are allowed to enjoy 100% of
timber removals if forests are depleted secondary forests, 70 to 80% if restored forests
after milpa farming, and 2% each year if rich forest of more than 100 m3/ha. With respect
of bamboo forests, they can exploit 95% of forest products.
Households and individuals who are contracted natural production forests for protection
are allowed to exploit secondary forest products, inter-plant agricultural plants, and graze
cattle under the forest canopy. When forests are exploitable, they can use 1.5 to 2% of
timber exploited for each contractual year.
Households and individuals who are contracted natural production forests for zoning off for
regeneration are funded by the state. They have the similar benefits from forests as those
who are contracted natural production forests for protection. If they make self-investment
in zoning off for regeneration, they can use 2.5 to 3% of timber exploited for each
contractual year.
3 Literature review
21
CHAPTER 3: LITERATURE REVIEW
3.1. Payments for ecosystem services
3.1.1. The logic of payments for ecosystem services
PES has been used recently as an instrument to convert non-market values into economic
incentives for local providers for the adoption of land use and management that support ES
(Engel et al., 2008; Tacconi et al., 2010). Many ES benefits are not perceived by ecosystem
managers, causing ecosystem mismanagement. The scope of PES implementation is to
identify and correct this problem (Engel et al., 2007).
According to the MA (2005), ecosystems such as forests provide societies with a number of
valuable ES. These are supporting services (providing habitats for wildlife), regulating
services (storing carbon, regulating water quality, and preventing soil erosion), provisioning
services (timber and NTFPs), and cultural services (forest recreation, education, and
landscape). These services benefit people directly and indirectly. Many ES are public goods:
they are non-excludable and non-rival in production. Non-excludable goods imply that the
supplier cannot prevent people from consumption without payment and non-rival goods
infer goods which can be consumed by more than one person at the same time (Bateman
et al., 2002; Mitchell and Carson, 1989).
Under the pressure of fast growing populations, more and more forest land is being
converted to other land use purposes (Wunder, 2005b). While some land users might get
additional benefits from other alternative land uses, others might face adverse events. For
example, for downstream populations, deforestation could induce the loss of ES such as
water filtration and impose additional costs for them. The beneficiaries might want to
compensate land users to secure the continuous provision of services, and land users can
get income for their additional protection efforts. Engel et al. (2008) and Pagiola et al.
(2003) argue that the payment for land users should exceed the benefit loss for alternative
land use choice; otherwise they would not be willing to change their behavior. Conversely,
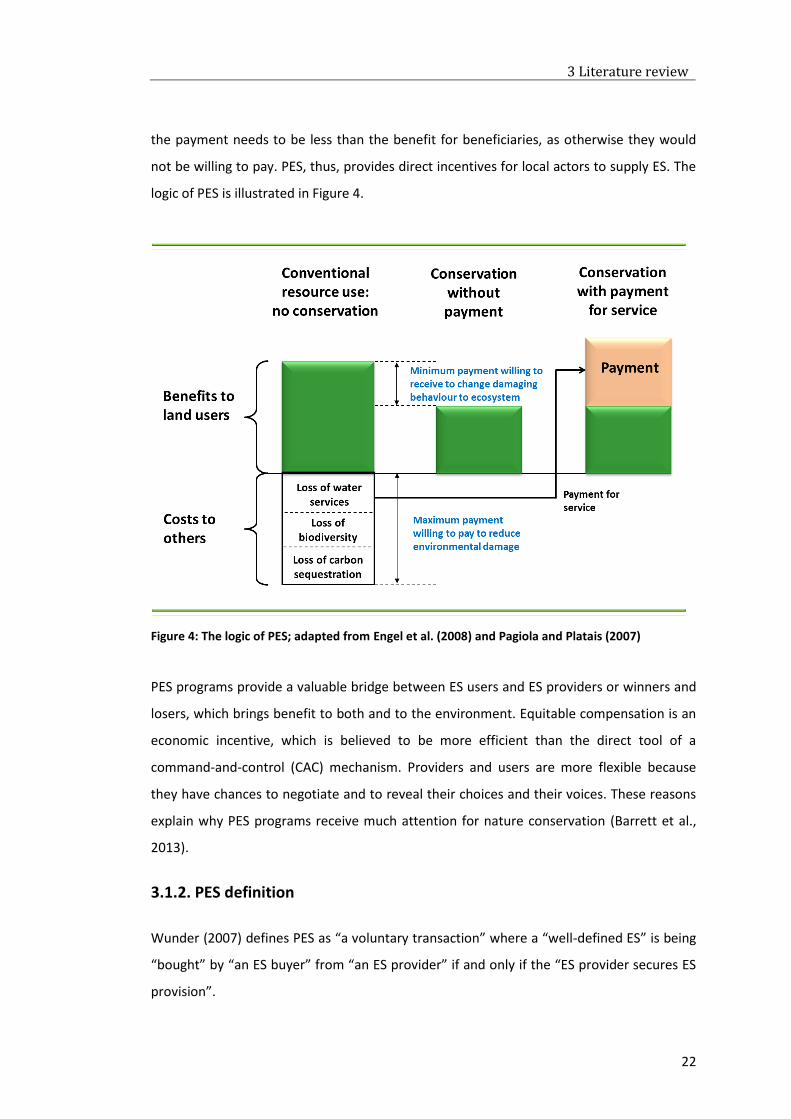
3 Literature review
22
the payment needs to be less than the benefit for beneficiaries, as otherwise they would
not be willing to pay. PES, thus, provides direct incentives for local actors to supply ES. The
logic of PES is illustrated in Figure 4.
Figure 4: The logic of PES; adapted from Engel et al. (2008) and Pagiola and Platais (2007)
PES programs provide a valuable bridge between ES users and ES providers or winners and
losers, which brings benefit to both and to the environment. Equitable compensation is an
economic incentive, which is believed to be more efficient than the direct tool of a
command-and-control (CAC) mechanism. Providers and users are more flexible because
they have chances to negotiate and to reveal their choices and their voices. These reasons
explain why PES programs receive much attention for nature conservation (Barrett et al.,
2013).
3.1.2. PES definition
Wunder (2007) defines PES as “a voluntary transaction” where a “well-defined ES” is being
“bought” by “an ES buyer” from “an ES provider” if and only if the “ES provider secures ES
provision”.
3 Literature review
23
PES is a voluntary agreement, not a forced transaction between providers and buyers.
Buyers are the actual users of ES who are clearly informed about the value of ES and obtain
direct incentives to ensure the appropriate performance of the respective PES scheme. In
many cases, buyers are the third parties such as governments, non-governmental
organizations (NGO), or international agencies who represent service users. The crucial
difference between direct users (user-financed) and indirect users (government-financed)
is who has the decision power in negotiations of the payment (Engel et al., 2008). Sellers
might be private land holders, local communities, and governments who have property
rights or management rights for the land. Both providers and buyers reach consensus on
the ES to be traded. For instance, downstream water users might want to pay upstream
farmers for ordinary clean water. Carbon sequestration, landscape beauty, biodiversity,
and watershed protection are the most typical environmental services being traded. A core
principle is that the negotiations are conducted in a way that all parties involved will
benefit. To ensure reliable and continuous payments, contract compliance is required.
3.1.3. PES in the tropics
PES has gained interest throughout the world, especially in Latin America (Pagiola et al.,
2005). PES has been implemented in Latin America since the mid-1990s. The main ES that
PES programs applied in these countries are water services, followed by biodiversity
conservation, carbon sequestration, and landscape beauty conservation.
Costa Rica is a pioneer country in elaborating and implementing PES nationwide and one of
the successful conservation stories in developing countries (Pagiola, 2007). PES was first
introduced in 1996 under Forestry Law 7575 (Pagiola, 2007; Porras et al., 2013). All
established forests were not allowed to be converted to other land uses; and any law
incompliance would be punished by prison sentences. In addition, it offered the possibility
to provide payment for new plantations, sustainable logging and natural forests
conservation. Between 1997 to 2012, the PES scheme has protected 860,000 ha of forests,
reforested an area of 60,000 ha, and supported the sustainable forest management of
30,000 ha of forests (Porras et al., 2013). Thanks to this program, forest cover increased
from 21% in 1983 to 51% by 2010 (Porras et al., 2013). Other countries in South America
developed PES focusing on conservation forests for water services in both nationwide and
small scale cases, such as Mexico, Colombia, and El Salvador (Pagiola et al., 2005).
3 Literature review
24
In Southeast Asia, PES has been implemented in Indonesia, Cambodia, and Vietnam at both
regional and national level (Nguyen and Pham, 2014). Since 1990s, local water companies
in Indonesia have paid farmers for protecting environmental services for the Cidanau
rivers´ watershed. In Cambodia, the Seima Biodiversitz Conservation Area project has paid
the locals to conserve bird´s nest of endangered species since 2002. In the Philippines,
payment for watershed rehabilitation has been made since 1995 to support local farmers
to reforest and apply sustainable agroforestry farming techniques. In Vietnam, a PES
experimental study supported by the Economy and Environment Program for Southeast
Asia (EEPSEA) was first adopted in the upland central region since 2003. Volunteer local
farmers were paid for implementation of proposed forest management approach. From
2008 to 2010, PFES was introduced as a national scheme and was piloted in Lam Dong
province in the Central Highlands and Son La province in the north.
Several challenges are obstacles that developing countries have to face when implementing
PES. Wunder (2005a) presented several difficulties. Firstly, in some countries, land owned
by the state, land held commonly, and without legal titles make negotiations and
contracting more difficult and complicated. Secondly, cash is used as an incentive tool
instead of tax relief due to the lack of effective taxation mechanism in developing
countries, especially in remote mountainous areas. Thirdly, periodical payments are used
rather than long term payments due to the weaknesses of law enforcement and monitoring
systems. Last but not least, PES is minor and does not fully compensate costs of services
management. The minor contribution of PES to total family´s income does not motivate the
locals to take part in the protection program (Pagiola et al., 2005).
3.1.4. PES in Vietnam
Program 327 and Program 661 were two national programs for forest rehabilitation in
Vietnam having aspects relating to the concept of PES. Under these programs, cash was
used as an economic incentive for reforestation and forest protection. Households,
individuals, villages and communities living adjacent to forests were paid directly through
rehabilitation or protection contracts. Pham et al. (2013) and Wunder (2005a) argued that
PES in Vietnam was in the strict sense because of the lack of a real land use choice, seldom
fulfilled conditionality, and too little money involved. According to Sikor (1998), only barren
land and non-forest land were allocated to households for reforestation. In other words,
3 Literature review
25
these forest lands were critical for providing ES. Fast-growing species such as Acacia and
Eucalyptus were commonly planted for rapid achievements of the government´s forest
cover target and for timber production purpose. Hence, economic incentives might be
more attractive than ES motives that limit the land use choices. Households and individuals
living adjacent to natural forests were contracted to protect existing forests and received
regular payments by the government. The levels of payments to individuals were low and
used as a CAC instrument rather than economic incentives to compensate the opportunity
costs of alternative land use choices. Wunder (2005a) also indicated that there were
seldom punishments or land use right withdrawal in case of non-compliance with contracts.
In 2003, a project relating to PES concept was carried out in two years in Thua Thien Hue,
central Vietnam. In this project, farmers, who manage production forests, were paid for
afforestation and reforestation in a sustainable way to eliminate soil erosion, biodiversity
conservation, and increase carbon sequestration. The payment levels were based on
farmers’ wishes, so-called willing-ness-to-accept prices. In total, 134 ha of production forest
under 85 contracts were involved (Nguyen and Pham, 2014). There are several constraints
that remained in this project. Firstly, production forests allocated to households,
individuals, and village communities are possible to apply the PES concept while special-use
and protection forests owned by the state are more complicated to implement PES
because of the property rights. Secondly, production forests are managed for economic
purposes rather than ES motives. Therefore, policy makers seem to pay less attention to ES
and might be not interested in PES. Thirdly, as the average forest land per household is very
small, and forest areas spatially scattered, practical implementation and monitoring are
difficult.
The foundation of a nationwide PES program was firstly included in the revised Law of
Forest Protection and Development in 2004. In 2008, a pilot program for PFES was carried
out pursuant to Decree 380/QD-TTg, following by five documents that provided legal
guidance on the establishment, organization, and management of Vietnam Forest
Protection and Development Fund (VNFF) at national level and provincial Forest Protection
and Development Fund (FPDF) at province level. Further general guidance on implementing
was provided by 11 additional documents (Pham et al., 2013). Lam Dong province in the
Central Highlands and Son La province in the Northwest were involved in a pilot phase. In
2010, Decree 99/201/ND-CP provided the legal framework for provinces to implementation
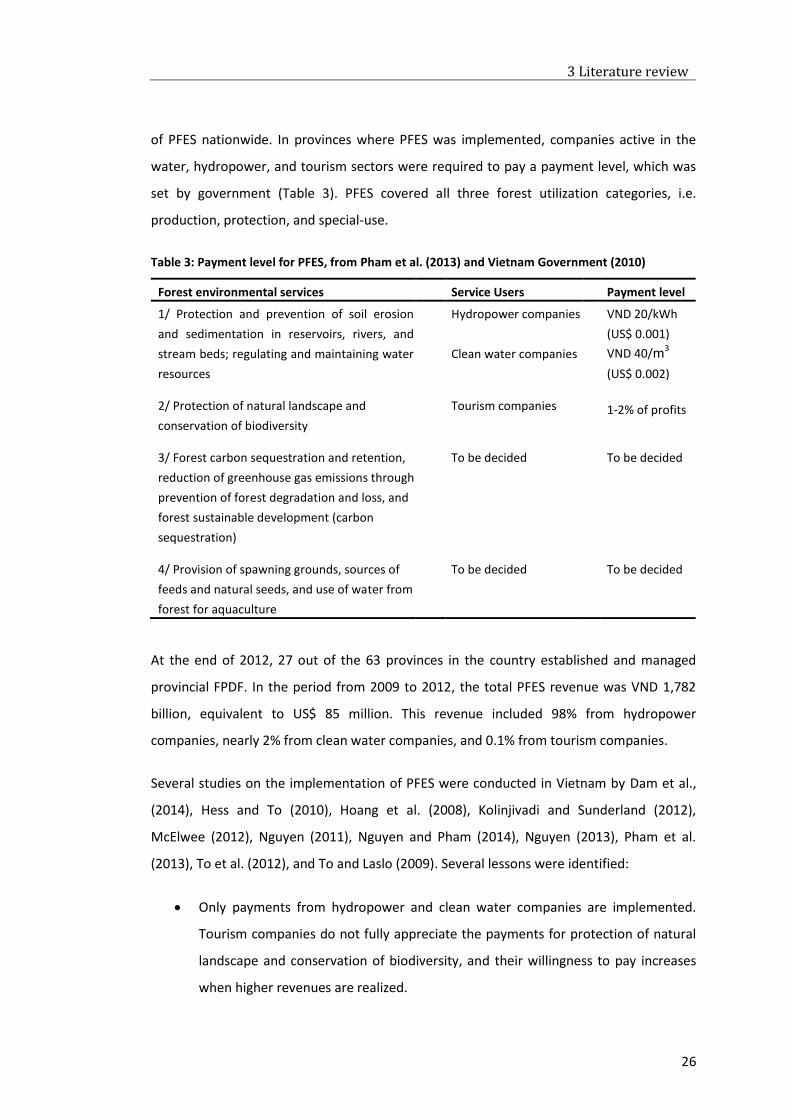
3 Literature review
26
of PFES nationwide. In provinces where PFES was implemented, companies active in the
water, hydropower, and tourism sectors were required to pay a payment level, which was
set by government (Table 3). PFES covered all three forest utilization categories, i.e.
production, protection, and special-use.
Table 3: Payment level for PFES, from Pham et al. (2013) and Vietnam Government (2010)
Forest environmental services Service Users Payment level
1/ Protection and prevention of soil erosion
and sedimentation in reservoirs, rivers, and
stream beds; regulating and maintaining water
resources
Hydropower companies
Clean water companies
VND 20/kWh
(US$ 0.001)
VND 40/m3
(US$ 0.002)
2/ Protection of natural landscape and
conservation of biodiversity
Tourism companies
1-2% of profits
3/ Forest carbon sequestration and retention,
reduction of greenhouse gas emissions through
prevention of forest degradation and loss, and
forest sustainable development (carbon
sequestration)
To be decided
To be decided
4/ Provision of spawning grounds, sources of
feeds and natural seeds, and use of water from
forest for aquaculture
To be decided
To be decided
At the end of 2012, 27 out of the 63 provinces in the country established and managed
provincial FPDF. In the period from 2009 to 2012, the total PFES revenue was VND 1,782
billion, equivalent to US$ 85 million. This revenue included 98% from hydropower
companies, nearly 2% from clean water companies, and 0.1% from tourism companies.
Several studies on the implementation of PFES were conducted in Vietnam by Dam et al.,
(2014), Hess and To (2010), Hoang et al. (2008), Kolinjivadi and Sunderland (2012),
McElwee (2012), Nguyen (2011), Nguyen and Pham (2014), Nguyen (2013), Pham et al.
(2013), To et al. (2012), and To and Laslo (2009). Several lessons were identified:
Only payments from hydropower and clean water companies are implemented.
Tourism companies do not fully appreciate the payments for protection of natural
landscape and conservation of biodiversity, and their willingness to pay increases
when higher revenues are realized.
3 Literature review
27
Clear guidance for forest carbon sequestration, spawning and aquaculture services
is lacking. With the support of the United Nations Program on Reducing Emissions
from Deforestation and Forest Degradation (UN-REDD), Vietnam completed the
first phase of REDD+ and moved to the second phase (2013-2016). An appropriate
payment scheme for carbon sequestration will be tested in order to develop a
payment framework for this service. Policies for payment for spawning and
aquaculture services have being evaluated under the support of the German
Agency for International Cooperation (GIZ), the International Union for
Conservation of Nature (IUCN) and the Center for International Forestry Research
(CIFOR).
The level of payments to forest protectors is low and insufficient for compensating
the opportunity costs of foregone benefits, such as forests conversion to crop
fields. Hence, the local population is not much interested in this program.
Transaction costs are high due to the complicated administration system from
nation, provinces, districts, communes to villages and the large number of forest
owners (scattered and small forest area per owner). The low disbursement due to
slow processes of FLA, weak technical and financial capacity at both central and
local levels, and weak coordination among agencies also contribute to high
transaction costs.
PFES in Vietnam differs from the classic concept of PES because the level of
payment is fixed by the government rather than the result of a voluntary
transaction between providers and buyers. In addition, buyers and suppliers are
not well defined. In Decree 99, buyers are hydropower and clean water companies.
They receive benefits from forest protection but instead of paying for these
benefits as a cost of their business activities, they simply pass PFES to their
customers, who are not aware of the source of the additional costs. Tourism
companies and tourism organizations show the same behavior: they act as brokers
rather than buyers and derive benefits from selling tourism services but keep 10%
of PFES for management costs when they contract to households, individuals, and
village communities for forest protection.

3 Literature review
28
For the reason that the state owns natural forests, contracted households and
village communities do not participate in the decisions of PFES agreement and
thus, are not encouraged in forest protection.
Guidelines on monitoring and evaluation of contract compliance are not well
prepared. Lack of baseline data and quantity records, the monitoring system
cannot provide proper evidences of environmental services supply.
The discussion whether PFES in Vietnam is truly PES or not is not the main conversation of
policy options. The advantage of PEFS program in Vietnam is the establishment of legal
frameworks and institutions at national and provincial levels, which support for PFES and
REDD+ scheme. Enhancing and strengthening governance as well as the effectiveness,
efficiency, and the possibilities for the implementation of PFES schemes in Vietnam is an
iterative process that needs to include the local level. In the period 2013-2016, the
“National Forest Inventory Program period 2013-2016” is being implemented to support
PFES payments.
In addition, Vietnam was one among a limited number of countries identified for country
programming under the UN-REDD Program and was the first country approved for a
Readiness Project Identification Note (R-PIN) under the WB´s Forest Carbon Partnership
Facility (FCPF). These programs received the consensus of Vietnam government, the UN-
REDD National Program, and the WB. Since 2009, many activities have been implemented
in Vietnam to support the country to get ready for the future REDD+ mechanism (UN-REDD,
2009). One of three components of the UN-REDD program in Vietnam was to improve
capacity to manage REDD and provide other PES at district level through sustainable
development planning and implementation. Therefore, the REDD+ fund payment for
carbon sequestration was established as a sub-fund of FPDF and provided by other
countries, organizations, and individuals. In order to prepare decisions on the management
of the REDD+ Fund as well as the acquisition and allocation of payments for carbon
sequestration, numerous of policies will be pilot implemented in the next few years.
3 Literature review
29
3.2. Economic valuation of forest ecosystem
3.2.1. Reasons for valuation
Economic valuation of forest ecosystems focuses on the understanding of their
contribution to economy and society. For example, Bateman et al. (2011) calculates the
contribution of outdoor recreational visits to be about £10 billion in the United Kingdom.
Gallai et al. (2009) estimates the global contribution of insect pollination of crops to
amount to US$ 190 billion in 2005. Economic valuation of forest ecosystem studies quantify
the benefits and costs of changing ecosystem management (conservation investment,
development project, and incentive), provide insight in the economic feasibility and
financial sustainable of related benefits induced by a change in ecosystem, and support
decisions on the optimization of conservation activities (Pagiola et al., 2004). Broadly,
results of environmental valuation can be used to support sustainable management of
natural resources (Barbier et al., 1997; Brander et al., 2007; Sterner, 2003).
3.2.2. The nature of economic valuation
Environmental changes obviously cause changes in human well-being. While natural
scientists try to assess environment changes in physical units, economists are concerned
about the level of human well-being in society changes (Mourato, 2014). In environmental
economics, these changes are measured through cost-benefit analysis (CBA), comparing
benefits of environmental changes to costs and other social impacts (Nyborg, 2014).
Anything that increases human well-being is defined as benefit and anything decreases
human well-being, conversely, is identified as cost.
In economic theory, the measurement of benefits and costs is explained by individuals´
preferences or individuals‘ choices on decision making (Bateman et al., 2002). The notion of
trade-off is the basic concept of economic valuation (Swanson, 2002). Individuals gain
benefits equivalent to something else they give up to get it. Therefore, to evaluate how
large a benefit they receive, we measure how much they are willing to forgo to get it. On
the contrary, individuals give up something if they receive compensation for the cost
incurred. Hence, to measure the cost incurred, we evaluate how much they are willing to
accept.

3 Literature review
30
The benefit and cost measurement are emphasized by the concepts of economic efficiency
or Pareto efficiency. An economic situation has Pareto efficiency when the circumstances
of one individual cannot be improved without making the situation worse for another. In a
competitive economy, resources are allocated in such a way that no further gain of
economic efficiencies is possible. Any change in resources allocation would increase
economic efficiency when the sum of benefits of the gainers is larger than the sum of costs
of the losers. The Pareto efficiency improvement is expressed as
∑(Bi − Ci
n
i=1
) > 0
where Bi is benefit and Ci is cost of change in resources allocation.
Pareto efficiency is the final optimum solution beyond which any change would directly
lead to a loss in resources allocation. Evidence shows that some people are always worse
off after economic transactions because of lacking compensation payment (Sloman and
Wride, 2009). As any policy and project includes losers and gainers (Lienhoop, 2004), the
effect of actions on society and other people when an individual maximizes his benefits has
to be taken into consideration (Bateman et al., 2002).
Economic evaluation of benefits and costs is commonly measured and expressed in terms
of monetary units. When evaluating forest resources, economists use the Total Economic
Value (TEV) approach as a framework.
3.3. Total economic value
Economists classify economic values of forests according to the way they are used. TEV
framework includes two main components: use values and non-use values (Figure 5).
Use values are related to direct, indirect, or future uses of forest resources.
Direct use values refer to goods and services directly consumed, such as timber,
fuelwood, NTFPs, medicines, decorative plants, recreation, hunting, or grazing.
Indirect use values related to benefits from ES such as nutrient cycling, soil
conservation, carbon sequestration, watershed protection, and flood prevention.
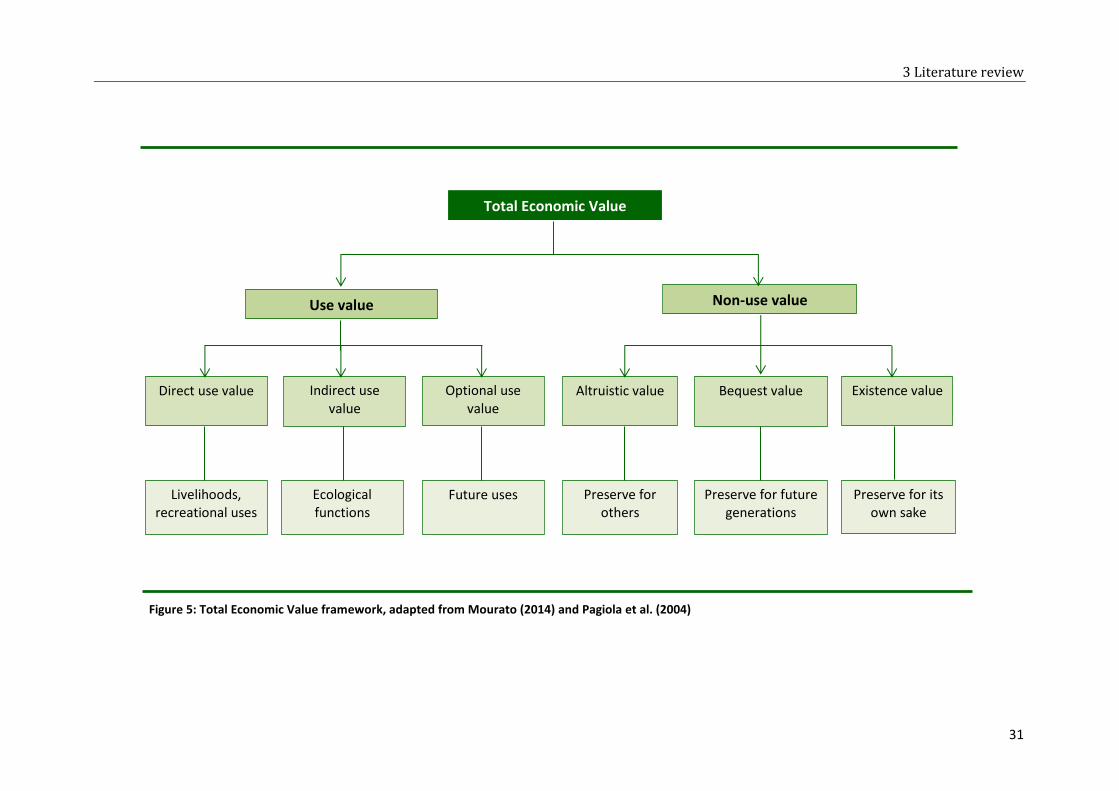
3 Literature review
31
Figure 5: Total Economic Value framework, adapted from Mourato (2014) and Pagiola et al. (2004)
Total Economic Value
Use value
Direct use value
Non-use value
Optional use value
Indirect use value
Altruistic value Bequest value Existence value
Livelihoods, recreational uses
Ecological functions
Future uses Preserve for others
Preserve for future generations
Preserve for its own sake
3 Literature review
32
Option value is generated from maintaining options for either direct or indirect
consumption of commodities in the future even though it may currently not be
used. For example, an individual is willing to pay for preserving a natural area for
his visiting in the future.
Non-use or “passive use” values are values of forest resources that are currently not being
used or consumed. Non-use values include altruistic values, bequest values, and existence
values
Altruistic value is the value an individual assigns to others for using or enjoying ES
without relation to his own benefit.
Bequest value is generated from the conservation of consumption opportunities
for future generations. Hence, there is the WTP for the conservation of the
environment for future generations.
Existence value is generated from preserving the existence of biological resources
for their own sake, even though individuals may never use it. Biodiversity,
landscape, environmental condition affecting species habitats, and carbon storage
are examples of existence values.
Measuring direct values is usually easier than indirect values because the quantity of goods
can be measured and a market price is available (Pagiola et al., 2004). Indirect use values
are more difficult to be assessed than direct use values as they involve complicated and
complex assessments, such as the amount of carbon stored in biomass. Non-use values are
significant to human well-being, as they relate directly to people´s behavior to contribute
to the ecosystem conservation. But the “market” and “market price” for these
environmental goods and services are not always available, and thus, the valuation of non-
use values is difficult and complicated and renders non-market valuation methods
necessary.
3.4. Economic valuation techniques
There are several studies thoroughly review economic valuation methods (Champ et al.,
2003; Champ, 2003; Freeman et al., 2014; Hanley and Barbier, 2009; Pearce et al., 2006) as
well as the application of those methods to ES (Bateman et al., 2011; Kareiva et al., 2011;
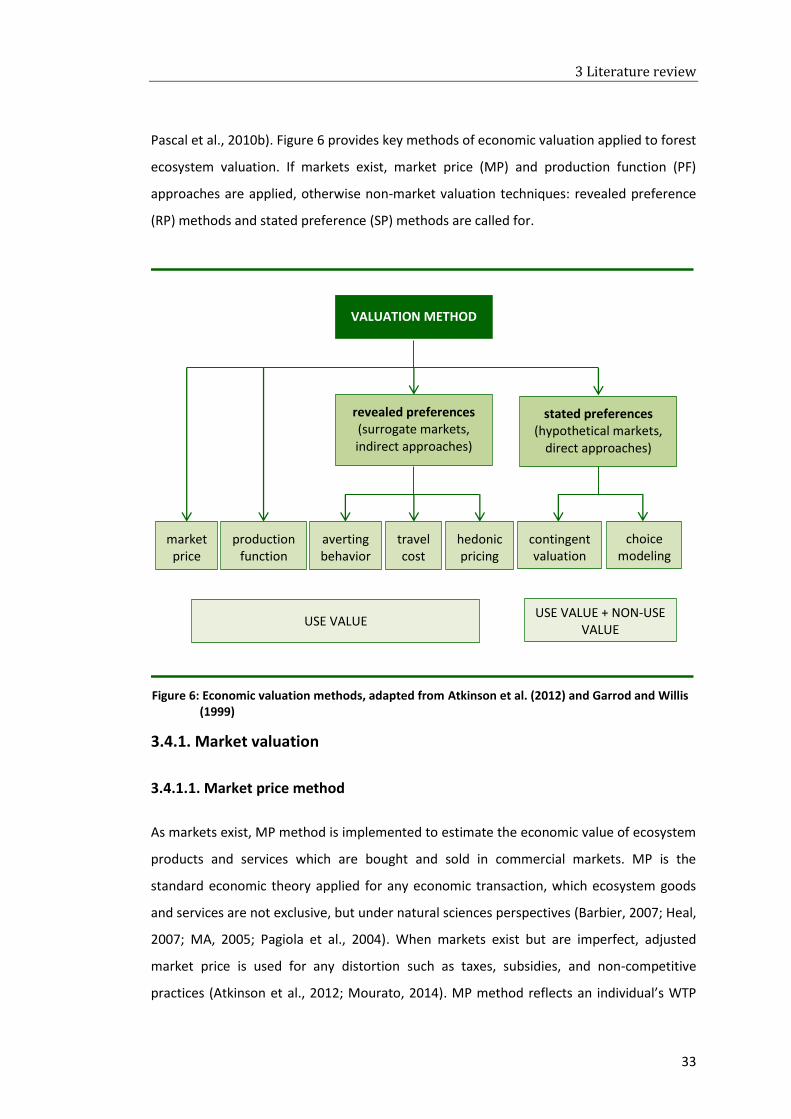
3 Literature review
33
Pascal et al., 2010b). Figure 6 provides key methods of economic valuation applied to forest
ecosystem valuation. If markets exist, market price (MP) and production function (PF)
approaches are applied, otherwise non-market valuation techniques: revealed preference
(RP) methods and stated preference (SP) methods are called for.
3.4.1. Market valuation
3.4.1.1. Market price method
As markets exist, MP method is implemented to estimate the economic value of ecosystem
products and services which are bought and sold in commercial markets. MP is the
standard economic theory applied for any economic transaction, which ecosystem goods
and services are not exclusive, but under natural sciences perspectives (Barbier, 2007; Heal,
2007; MA, 2005; Pagiola et al., 2004). When markets exist but are imperfect, adjusted
market price is used for any distortion such as taxes, subsidies, and non-competitive
practices (Atkinson et al., 2012; Mourato, 2014). MP method reflects an individual’s WTP
VALUATION METHOD
market price
contingent valuation
choice modeling
production function
hedonic pricing
revealed preferences (surrogate markets, indirect approaches)
stated preferences (hypothetical markets,
direct approaches)
USE VALUE USE VALUE + NON-USE
VALUE
averting behavior
travel cost
Figure 6: Economic valuation methods, adapted from Atkinson et al. (2012) and Garrod and Willis (1999)
3 Literature review
34
for costs and benefits of goods and services that are bought and sold in the markets such as
timber and NTFPs. MP method requires data to estimate consumer surplus and producer
surplus. Consumer surplus estimation requires time series data on the quantity at different
prices that might be affected by income and demographic and producer surplus estimation
needs data reflects costs and revenues of goods and services. However, market data might
be available for limited goods and services of natural resources and might not provide
proper value of direct use services. Mostly, this method is applied to direct use values.
3.4.1.2. Production function method
The PF method is applied for any impact of changes in ES (as input) through the effects on
the output of a marketed good (Atkinson et al., 2012; Mourato, 2014). For example, water
quality affects the productivity of irrigated agricultural crops. Thus, increased revenue from
greater agricultural productivity will be valued as result of water quality improvement. One
limitation of PF method is the lack of data on change in services and the consequent
impacts. Even though data are available, it is complicated and difficult to identify (Pagiola
et al., 2004).
3.4.2. Non-market valuation
Non–market valuation methods are commonly categorized into RP methods and SP
methods. RP methods are based on individuals´ actual decisions on which information
related to goods and services can be inferred from the market while SP methods are based
on individuals´ intended behavior in hypothetical or simulated markets (Mourato, 2014). In
other words, RP methods examine actual expenditures and SP methods estimate
expenditures which will be taken place in the future (Atkinson et al., 2012). Travel cost (TC)
method, hedonic price (HP) method, and averting behavior (AB) are commonly used as RP
techniques; and CVM and choice modeling (CM) are widely used as SP techniques.
3.4.2.1. Revealed preference method
RP methods have been applied based on individuals´ actual behavior. These valuations are
appropriated to estimate the consumption of related market priced goods, using
information from markets which goods are associated with (Atkinson et al., 2012). These
methods require large data and complex statistical analysis, thus they are quite expensive
3 Literature review
35
and time consuming (Pascal et al., 2010a).
a. Travel cost method
The TC method estimates how much money individuals spend for benefits from using
ecosystems such as parks, woodland, beaches, lakes, etc., for recreational purposes. These
natural areas commonly do not have market prices for their services, and thus an
alternative price is required to estimate those values. The value of recreational sites is
assumed to manifest individuals´ WTP to visit, which is estimated by number of trips that
individuals make at different travel costs. It is possible to derive a demand curve at
different actual travel costs for a recreational site, and estimate the amount of consumers’
surplus and the net value of the recreational site.
To estimate the TC, actual survey would be carried out in a recreational site to collect
information about number of trips individuals take to the particular recreation site per year
and costs of travelling to the site which include actual costs and opportunity costs of time
spend for travel instead of other alternative uses.
TC method assumes to use models for a single trip or to visit a specific recreational site. In
case the trip is multiple destinations, the value of the site is difficult to evaluate and might
be overestimated (Pagiola et al., 2004). Besides, how to calculate opportunity cost of time,
person´s wage rate or some fractions of the wage rate is still controversial (Mourato, 2014).
Additional, the changing of site quality, which is difficult to observe, and substitute sites
also affect the value of the site. TC method is solely used to evaluate use values.
b. Hedonic pricing method
The HP method estimates the value of environmental amenities that affect prices of
marketed goods. It is mostly applied to evaluate the attribution of environmental
conditions to house and property values. For example, the price of a house might depend
on a bundle of factors: structure of the house, location, neighborhood, and environmental
conditions such as scenic beauty, air quality, cultural benefits, etc. Hence, the change in
biodiversity or ecosystem might affect the change in value of the property. HP identifies
how much a property differs from others due to environmental conditions and how much
people are willing to pay for an improvement in environmental quality (Garrod and Willis,
1999).
3 Literature review
36
Data requirements for the HP method are all factors determine property price. Thus, large
amounts of data must be gathered and manipulated (Mourato, 2014). A limitation of the
HP method is that it is very sensitive to specification (Pagiola et al., 2004), i.e., the value of
environmental amenities might not be reflected in property´s price if individuals are not
aware of the benefits of those environmental attributes and their contributions to the
property.
c. Averting behavior method
The AB method is applied when marketed goods are substitutes. Individuals might change
their behavior in costly manner to avoid negative impacts on their well-being by ecosystem
goods and services. The cost of providing market substitute goods might provide an
estimate for the value of ecosystem goods and services. For example, flood protection
service of a wetland can be estimated by calculating the cost of building a wall or levee.
3.4.2.2. Stated preference method
When information on goods and services is not relevant or not generated by markets, SP
methods are necessary (Bateman et al., 2002). SP methods estimate WTP directly by asking
respondents to address their preferences among alternative choices. These techniques use
questionnaires to simulate individuals´ behavior in the market place. In case of public
goods, information related to costs and benefits of public goods is impossible to infer from
markets. For example, we might evaluate a recreational site by studying the cost people
are willing to pay to visit. Even if they are not visiting at the moment, they might want to
keep it available to visit in the future. Some people might pay even if they have no
intention to visit or want to preserve the site itself. We call them option users or non-users.
In case the proxy market is available, the market information might not reflect appropriate
cost and benefit. For example, the cost of entering a park is US$ 10. If an individual decides
to pay the entrance fee, it is inferred that the benefit of the trip is equal to US$ 10. If he
does not pay, it is inferred that the benefit of the trip is less than US$ 10. Therefore, it is
useful to have a cross-section data of a sufficient range of prices so that similar individuals
might reveal their preferences in order to infer actual value of goods and services. SP
techniques provide substantial original data for those evaluations.
3 Literature review
37
a. Choice modeling method
The CM method has been increasingly used in environmental valuations in recent years
(Atkinson et al., 2012; Pearce et al., 2006). CM is a survey-based method for modeling
individuals´ preferences for goods. It is assumed that the value of a good is a function of its
attributes. Respondents are asked to choose their preferred alternative among scenarios.
Each scenario has various attributes, and each attribute varies at different levels, including
a hypothetical price. Respondents are asked to rank, rate, and choose between different
levels of environmental goods at different price levels to reveal their WTP.
The advantage of CM is that any environmental service can apply this technique (Pagiola et
al., 2004). In fact, it is most useful to apply CM to evaluate a complex environmental good
which is multidimensional (Mourato, 2014; Pearce et al., 2006). CM evaluates both
individual attributes and the whole scenario, and thus can be useful to design optimal
policies or projects with numerous combinations of multiple dimensions. Respondents,
however, face the multiple complex choices or ranking among a bundle of attributes and
levels, which might affect the meaningfulness and precision of their decisions (Pearce et al.,
2006). The experimental design and data analysis are quite complex (Adamowicz et al.,
1998).
b. Contingent valuation method
CVM is a simple, flexible method which can be used to estimate economic values for all
kinds of ecosystem and environmental services (Atkinson et al., 2012; Pagiola et al., 2004).
CVM can be applied for both use and non-use values and is the most widely used method
for estimating non-use values (Alberini and Kahn, 2006).
Forest ecosystems generate a wide variety of important use values, option values, and non-
use values. While use values can be estimated by RP methods, non-use values or passive
values can be only measured by SP methods. CVM is an important tool for forest
economists and is useful for evaluating particle attributes of forests. Forests provide a
bundle of goods and services which cannot be easy to evaluate particularly. For example,
forests with higher level of biodiversity might have better quality of wildlife habitat, higher
watershed services, and aesthetic values. Hence, CVM is an appropriate tool to evaluate
3 Literature review
38
complex values of forest ecosystem as a whole rather than focusing on individual
component of forest values.
In addition, one aim of this study is to examine paying for forest protection to gain non-use
values, including existence value, option value, and bequest value. The second aim is to
estimate the compensation for local loss in term of labor cost for forest protection and
management. To evaluate welfare change for both gainers and losers, WTA and WTP
measures fit the context.
3.5. Contingent valuation method
3.5.1. Introduction
Based on a monetary (Hicksian) measure of welfare, CVM estimates the maximum WTP for
improving the quantity and quality of environmental goods and minimum compensation an
individual is willing to accept for a decrease in environmental quantity and quality.
Contingent valuation surveys distinguish from other surveys because of their particular
description of the public goods of interest and more intensive elicitation. CVM is widely
used in environmental economics, health economics, transportation safety, cultural
economics, CBA, environmental impact assessment, water and air quality issues, outdoor
recreation, biodiversity conservation, species preservation, forest protection, waste
management, natural resource damage, and environmental risk reduction (Carson and
Hanemann, 2005).
Bowen (1943) and Ciriacy-Wantrup (1947) proposed an original CVM when they used
survey methods to elicit an individual´s WTP for social goods such as beautification of the
landscape and some extra market benefits for the prevention of soil erosion. Davis (1963)
was the first researcher to use CVM to estimate the benefits of goose hunting through a
survey among goose hunters. CVM gained popularity in the 1960s for option and existence
values which were recognized as important parts of the total economic value in
environmental economics (Krutilla, 1967; Venkatachalam, 2004). Since then, CVM has been
widely applied to non-market goods and services.
Earliest contingent valuation studies were mostly from developed countries such as the
United State, United Kingdom, and European countries. By the 1990s, 2,135 studies from
3 Literature review
39
40 countries implemented CVM (Carson et al., 1995). In developing countries, water supply,
sanitation, recreation, tourism, and national parks were primarily areas applying CVM
(Whittington, 1989, 1990; Whittington et al., 1993; Whittington, 1998). Recently, CVM has
been applied to studies on surface water quality, health, and biodiversity conservation
(Whittington, 1998). Carson (2011) noted over 7,000 papers and studies from 130 countries
(30 developed and over 100 developing countries) over 50 years.
3.5.2. Definition of contingent valuation method
Mitchell and Carson (1989) defines CVM as a method using surveys to find out the amount
customers would be willing to pay in cash for specific environmental services. In some
cases, individuals are asked for the amount of compensation they would be willing to
accept to give up specific environmental services. The method is “contingent” valuation
because respondents state their WTP, contingent on a specific hypothetical scenario
description of the goods and services.
According to Carson and Hanemann (2005), a contingent valuation interview consists of
five parts:
1) An introductory section to identify the topic;
2) A section asking prior knowledge about the good and attitudes towards it;
3) Description of scenario: This part describes in detail the good and hypothetical
circumstance including baseline provision level, the structure under which
good is to be provided, the range of available substitute, method of payment,
and what will happen to current status if the project is not implemented;
4) Questions elicit respondents´ WTP or WTA for goods;
5) Questions about respondents´ demographic characteristics.
3.5.3. Theoretical background of the contingent valuation method
3.5.3.1. Demand curve and willingness to pay
The environmental changes obviously cause the human welfare changes, and economists
try to measure how much the level of human welfare in society changes (Mourato, 2014).
The change of human welfare reflects the change of individual satisfaction or utility for the
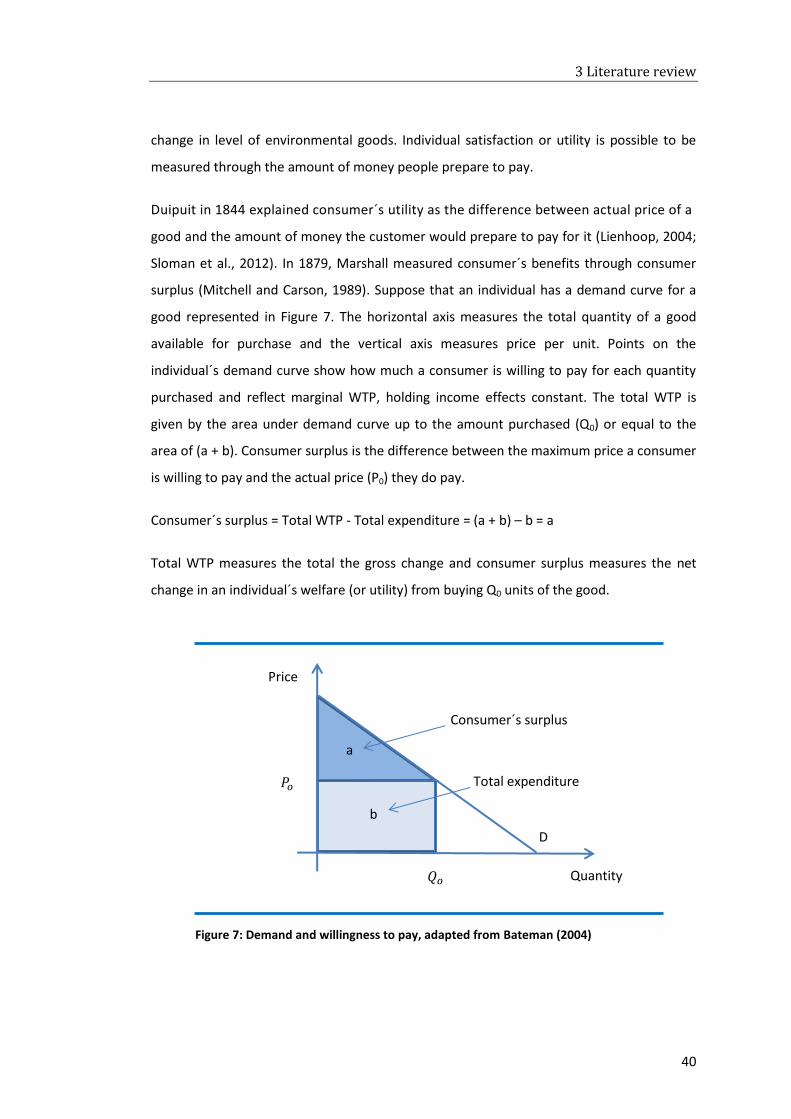
3 Literature review
40
change in level of environmental goods. Individual satisfaction or utility is possible to be
measured through the amount of money people prepare to pay.
Duipuit in 1844 explained consumer´s utility as the difference between actual price of a
good and the amount of money the customer would prepare to pay for it (Lienhoop, 2004;
Sloman et al., 2012). In 1879, Marshall measured consumer´s benefits through consumer
surplus (Mitchell and Carson, 1989). Suppose that an individual has a demand curve for a
good represented in Figure 7. The horizontal axis measures the total quantity of a good
available for purchase and the vertical axis measures price per unit. Points on the
individual´s demand curve show how much a consumer is willing to pay for each quantity
purchased and reflect marginal WTP, holding income effects constant. The total WTP is
given by the area under demand curve up to the amount purchased (Q0) or equal to the
area of (a + b). Consumer surplus is the difference between the maximum price a consumer
is willing to pay and the actual price (P0) they do pay.
Consumer´s surplus = Total WTP - Total expenditure = (a + b) – b = a
Total WTP measures the total the gross change and consumer surplus measures the net
change in an individual´s welfare (or utility) from buying Q0 units of the good.
D
Price
Quantity
𝑃𝑜
𝑄𝑜
a
b
Consumer´s surplus
Total expenditure
Figure 7: Demand and willingness to pay, adapted from Bateman (2004)
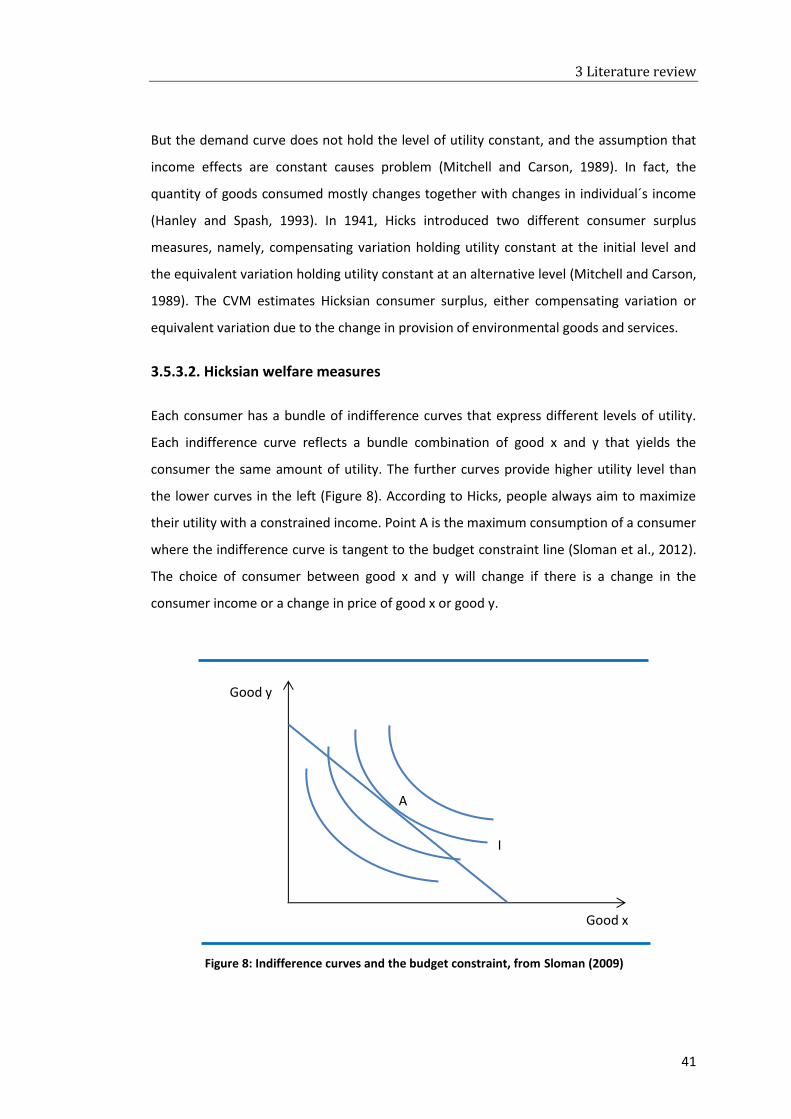
3 Literature review
41
But the demand curve does not hold the level of utility constant, and the assumption that
income effects are constant causes problem (Mitchell and Carson, 1989). In fact, the
quantity of goods consumed mostly changes together with changes in individual´s income
(Hanley and Spash, 1993). In 1941, Hicks introduced two different consumer surplus
measures, namely, compensating variation holding utility constant at the initial level and
the equivalent variation holding utility constant at an alternative level (Mitchell and Carson,
1989). The CVM estimates Hicksian consumer surplus, either compensating variation or
equivalent variation due to the change in provision of environmental goods and services.
3.5.3.2. Hicksian welfare measures
Each consumer has a bundle of indifference curves that express different levels of utility.
Each indifference curve reflects a bundle combination of good x and y that yields the
consumer the same amount of utility. The further curves provide higher utility level than
the lower curves in the left (Figure 8). According to Hicks, people always aim to maximize
their utility with a constrained income. Point A is the maximum consumption of a consumer
where the indifference curve is tangent to the budget constraint line (Sloman et al., 2012).
The choice of consumer between good x and y will change if there is a change in the
consumer income or a change in price of good x or good y.
Figure 8: Indifference curves and the budget constraint, from Sloman (2009)
I
Good x
Good y
A
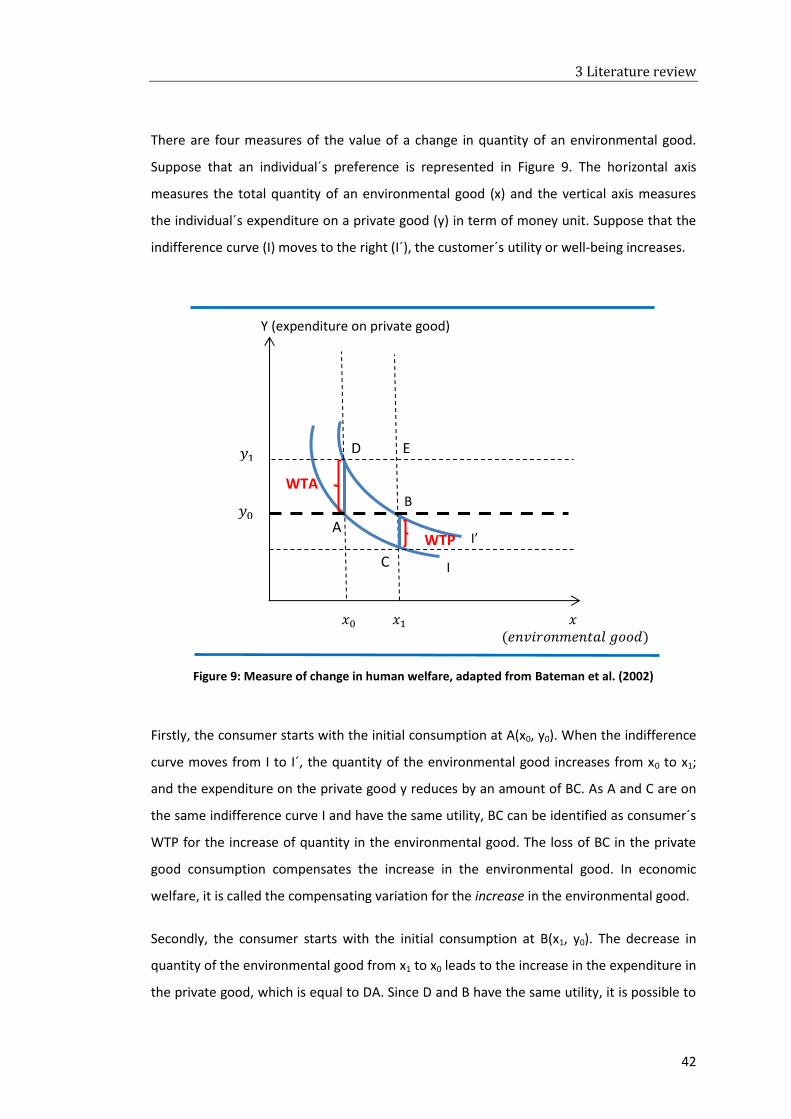
3 Literature review
42
There are four measures of the value of a change in quantity of an environmental good.
Suppose that an individual´s preference is represented in Figure 9. The horizontal axis
measures the total quantity of an environmental good (x) and the vertical axis measures
the individual´s expenditure on a private good (y) in term of money unit. Suppose that the
indifference curve (I) moves to the right (I´), the customer´s utility or well-being increases.
Figure 9: Measure of change in human welfare, adapted from Bateman et al. (2002)
Firstly, the consumer starts with the initial consumption at A(x0, y0). When the indifference
curve moves from I to I´, the quantity of the environmental good increases from x0 to x1;
and the expenditure on the private good y reduces by an amount of BC. As A and C are on
the same indifference curve I and have the same utility, BC can be identified as consumer´s
WTP for the increase of quantity in the environmental good. The loss of BC in the private
good consumption compensates the increase in the environmental good. In economic
welfare, it is called the compensating variation for the increase in the environmental good.
Secondly, the consumer starts with the initial consumption at B(x1, y0). The decrease in
quantity of the environmental good from x1 to x0 leads to the increase in the expenditure in
the private good, which is equal to DA. Since D and B have the same utility, it is possible to
DD
A
CD
B
I’
I
𝑥 (𝑒𝑛𝑣𝑖𝑟𝑜𝑛𝑚𝑒𝑛𝑡𝑎𝑙 𝑔𝑜𝑜𝑑)
𝑥1 𝑥0
𝑦0
𝑦1 E
Y (expenditure on private good)
WTP
WTA
3 Literature review
43
infer that DA is the consumer´s WTA for the decrease in the environmental good. It is called
the compensating variation for the reduction in the environmental good.
Thirdly, we may ask what additional amount of private consumption would be as
preferable as an increase in the environmental good from x0 to x1. This is called equivalent
gain measure of the value of the change in the environmental good. The consumer starts
the consumption at A(x0, y0). The environmental good increases from x0 to x1. As B and D
have the same utility, equivalent gain is equal to DA. DA, in welfare economic, is the
equivalent variation for the increase in the environmental good.
Fourthly, the consumer starts with the initial consumption at B(x1, y0) and we may ask what
private consumption loss would be as preferable as a decrease in the environmental good
from x1 to x0. Since B and C have the same utility, equivalent loss is equal to BC. BC, in
welfare economic, is the equivalent variation for the decrease in the environmental good.
In summary, for a welfare gain, the compensating variation measure refers the amount of
money that the customer is willing to give up to gain an increase in environmental quantity
or quality, i.e., WTP measure; whereas the equivalent variation measure refers the
compensation that the consumer demands of utility improvement in case the increase in
provision of environmental goods and services does not happen, i.e., WTA measure. For a
welfare loss, the compensating variation measure refers the amount of money that the
customer requires to compensate his welfare loss, i.e., WTA measure; while equivalent
variation measure refers the amount of money that the customer forgoes to prevent the
loss in the future, i.e., WTP measure (Bateman and Turner, 1993). The compensating
variation and equivalent variation measurements for welfare changes are presented in
Table 4.
Table 4: Welfare measures for an environmental gain and loss
Increase in environmental
quantity/quality
(U > 0)
Decrease in environmental
quantity/quality
(U < 0)
Compensating variation WTP WTA
Equivalent variation WTA WTP
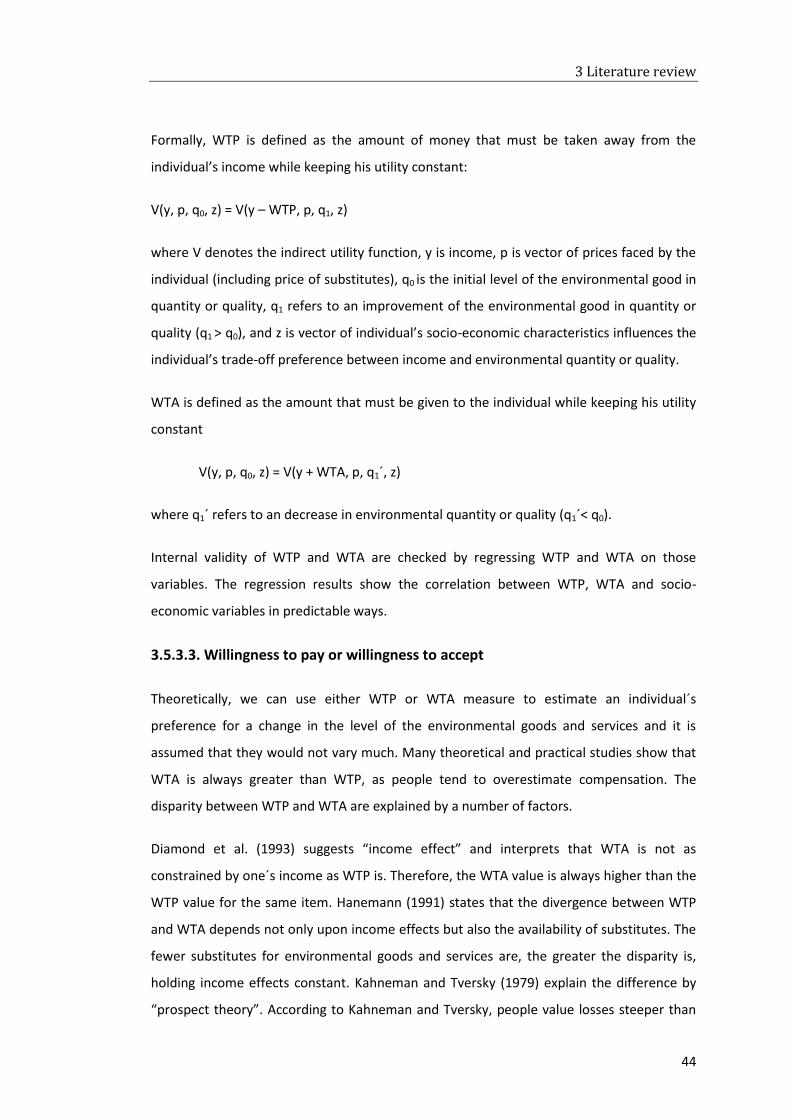
3 Literature review
44
Formally, WTP is defined as the amount of money that must be taken away from the
individual’s income while keeping his utility constant:
V(y, p, q0, z) = V(y – WTP, p, q1, z)
where V denotes the indirect utility function, y is income, p is vector of prices faced by the
individual (including price of substitutes), q0 is the initial level of the environmental good in
quantity or quality, q1 refers to an improvement of the environmental good in quantity or
quality (q1 > q0), and z is vector of individual’s socio-economic characteristics influences the
individual’s trade-off preference between income and environmental quantity or quality.
WTA is defined as the amount that must be given to the individual while keeping his utility
constant
V(y, p, q0, z) = V(y + WTA, p, q1´, z)
where q1´ refers to an decrease in environmental quantity or quality (q1´< q0).
Internal validity of WTP and WTA are checked by regressing WTP and WTA on those
variables. The regression results show the correlation between WTP, WTA and socio-
economic variables in predictable ways.
3.5.3.3. Willingness to pay or willingness to accept
Theoretically, we can use either WTP or WTA measure to estimate an individual´s
preference for a change in the level of the environmental goods and services and it is
assumed that they would not vary much. Many theoretical and practical studies show that
WTA is always greater than WTP, as people tend to overestimate compensation. The
disparity between WTP and WTA are explained by a number of factors.
Diamond et al. (1993) suggests “income effect” and interprets that WTA is not as
constrained by one´s income as WTP is. Therefore, the WTA value is always higher than the
WTP value for the same item. Hanemann (1991) states that the divergence between WTP
and WTA depends not only upon income effects but also the availability of substitutes. The
fewer substitutes for environmental goods and services are, the greater the disparity is,
holding income effects constant. Kahneman and Tversky (1979) explain the difference by
“prospect theory”. According to Kahneman and Tversky, people value losses steeper than
3 Literature review
45
gains, thus they give greater weight to losses than to gains. Mitchell and Carson (1989)
mention the property rights as the reason of the difference. Individuals with property rights
to the goods can refuse to sell or may want an extraordinarily large compensation for
agreeing to this, and thus WTA elicits a large protest response. Zhao and Kling (2001) give
another explanation based on the presence of uncertainty. The respondent is unsure about
the value of goods in question and prefers to gather information before offering or
accepting a payment level. Hence, to be on the safe side, WTA is higher and WTP is lower.
It is clear that there are many factors influencing the disparity between WTP and WTA. The
question is: which measure formats, WTP or WTA, should be used in contingent valuation
survey to evaluate the changes in provision of environmental goods and services? The
choice between WTP and WTA is a question of property rights. If the individual has the
right to sell the good, then WTA will be the relevant measure. On the contrary, if the
individual has to buy the good to enjoy it, WTP will be appropriate. The problem is, in many
cases, the property rights to environmental goods and services or public goods are not
clear (Ninan, 2009), and it is more effective to link to the rights to the status quo (Pearce et
al., 2006). The WTP format is appropriate for an improvement to the status quo, and WTA
is relevant for a loss to the status quo. Since large policies mainly focus on gains rather than
losses in environment, WTP is the correct measure and widely used in contingent valuation
surveys (Pearce et al., 2006).
NOAA (1993) also suggests that WTP is a suitable value measure compared to WTA, and
therefore should be used in contingent valuation studies. In the context of developing
countries where the impacts of environmental policies tend to be negative in terms of
damage costs to the poor population, WTA is considered an appropriate measure rather
than WTP format (Venkatachalam, 2004).
3.5.4. Contingent valuation surveys in developing countries
To carefully design and conduct contingent valuation surveys in developing countries,
economists need to understand the obstacles to such surveys. This helps researchers
minimize difficulties, overcome misunderstandings, and conduct reliable studies.
Whittington (1998 & 2010) discusses administering CVM in developing countries. He
summarizes several important lessons after 20 years studying how contingent valuation
surveys are conducted in developing countries. Conducting the CVM in developing
3 Literature review
46
countries is believed easier and straightforward compared to developed countries. The
response rates are relatively high and people tend to cooperate by listening and
considering the questions. The in-person survey costs in developing countries are obviously
lower than in developed countries, and thus allow a larger sample size and more
experiments. There are also numerous issues that researchers and policy analysts should
consider when administering a contingent valuation survey in developing countries.
Firstly, most contingent valuation studies rely on in-person interviews because it is
difficult to conduct mail and telephone surveys, particularly in rural areas. Even
when mail or telephone surveys are possible to access, the low literacy and
education level in many developing countries are obstacles for them to perceive
the aim and the content of the survey.
Secondly, the lack of resident lists prevents researchers from designing random and
stratified samples. For example, some researchers have to use income level as
criterion for choosing a fixed number of high-, medium-, and low-income
respondents to take part in the interview. Interviewers, in some cases, have to
randomly ask any household in a certain district. The absence of official statistics is
another difficulty and prevents researchers from being able to compare the socio-
economic characteristics of the sample with population in the same area. For this
reason, the samples are often designed for relatively small areas.
Thirdly, the cooperation of local officials and authorities is very important.
Sometimes, they place pressure on respondents and try to influence the survey
outcomes. The aim and the content of the survey must be clearly explained to
officials, authorities, and respondents to minimize this obstacle.
Fourthly, the notion of maximum WTP and minimum WTA is not easy to explain to
rural people who have low literacy or education levels and are unfamiliar with
environmental values. They might misunderstand and provide incorrect answers to
difficult and abstract questions. Some of respondents say “Yes” to all questions in
questionnaires, regardless the level of monthly fee or tariff offered to them. In
some cases, respondents say “Yes” to anything just to satisfy the interviewers. To
minimize these obstacles, a careful questionnaire with follow-up questions is
required.
3 Literature review
47
Fifthly, the most appropriate WTP and WTA elicitation format used in developing
countries is a referendum, or so-called take-it-or-leave-it or dichotomous choice.
This allows for an avoid strategy bias and is suitable for remote rural people who
are unfamiliar with environmental valuation. The problem is, some studies design
price ranges that are too limited, i.e., the highest referendum price is too low and
the lowest referendum price is too high. The too low or too high prices also do not
secure the credibility of the contingent valuation scenario.
After 20 years of research in developing countries, Whittington (2010) concludes that
WTP is typically low in terms of payment level and as a percentage of income. Poor
households in developing countries spend most of their income on food, energy, etc.,
for subsistence purposes. When the income increases, payment for environmental
goods and services are expected to be higher.
4 Data and methods
48
CHAPTER 4: DATA AND METHODS
4.1. Study site
4.1.1. Thai Nguyen province
Thai Nguyen is a mountainous, midland province in the Northeast region of Vietnam and
borders six provinces of which one is Hanoi capital to the south. The province covers an
area of 353,000 ha and comprises of one city, one town, and seven districts. Thai Nguyen
has a total population of 1.1 million people with 25% living in Thai Nguyen city, the capital
of the province (TSO, 2012). Thai Nguyen is a multiethnic province with 46 ethnic groups,
and each ethnic has its own language, lifestyle, and cultural heritage. “Kinh” ethnic is the
largest group representing of 73% of the total population, and populates mainly in the city,
the towns, and the district centers (GSO, 2010). Thai Nguyen is famous for its rich mineral
resources and tea products and is recognized as an education center in the mountainous
regions in the north of Vietnam.
In 2011, Thai Nguyen´s GDP, at current prices, was VND 25,000 billion, generating GDP per
capital of VND 17 million/year (TSO, 2012). Although 65.5% of the employed labor force is
engaged in the agriculture, forestry, and fishing sectors, the contributions of these
economic categories account for 21.3% of the province´s GDP (TSO, 2012). 28% of total
households of the province are classified as poor and pro-poor households4 (TSO, 2012).
4 According to poverty line in Vietnam applied for the 2010-2015 period:
The poor households in rural areas are households with average income under VND 400,000 (US$ 19) per capita per month or VND 4,800,000 per capita per year.
The poor households in urban areas are households with average income under VND 500,000 (US$ 24) per capita per month or VND 6,000,000 per capita per year.
The pro-poor households in rural areas are households with average income from VND 401,000 (US$ 19) to VND 520,000 (US$ 25) per capita per month.
The pro-poor households in urban areas are households with average income from VND 501,000 (US$ 24) to VND 650,000 (US$ 31) per capita per month.
4 Data and methods
49
Thai Nguyen has many mountain ranges running from the north to the south. Three main
surrounding mountain ranges Tam Dao, Ngan Son, and Bac Son prevent the province from
heavy winter monsoons and regulate the flow of water to the plain area in the center and
the south. 82% of the province area is mountainous and hilly land and 12% is field land,
which are generated by the terrain slopping from the high mountains to the low zones and
the midlands. Thai Nguyen has two seasons: the rainy season from May to October and the
dry season from November to April. The average temperature is about 230c; the average
sunny hours is around 1,600; and the average rainfall ranges between 1,400 to 2,000 mm
annually. The characteristics of topography and the climate of the province favorably affect
the development of agriculture and forestry (FIPI, 2010). In 2010, the total forest area was
approximately 155,000 ha, of which 60% were natural forests. Production, protection, and
special-use forests make up about 84,000 ha, 41,000 ha, and 30,000 ha, respectively (FIPI,
2010).
4.1.2. Dinh Hoa district
Dinh Hoa district is located in the north west of Thai Nguyen province and covers 51,000 ha
of land area (Figure 10). The district consists of one town and 23 communes with a
population of 87,000 people (TSO, 2012). As forestry and agriculture land accounts for 73%
of the total area, forestry and agricultural sectors dominate the district economy. Dinh Hoa
district is characterized by its rich social and cultural diversity as well as its important role in
the region´s economic development. Dinh Hoa forest is an especially important part of Dinh
Hoa Safety Zone, a national historical site including 109 relics from revolutionary era (Prime
Minister, 2008).
The forest area is about 30,000 ha representing 58% of the total land. Half of forest area is
covered with natural forests which are degraded and fragmented (ATKFMB, 2013). Table 5
presents the three types of forests in the area. Dinh Hoa forest has 316 plant species
including 76 rare species, 31 mammal species, 80 bird species, 38 reptile species, and
80 amphibian species (ATKFMB, 2013; Thai Nguyen Province Committee, 2007). The
district, like those in other mountainous regions in northern Vietnam, suffers from serious
environmental problems such as deforestation, soil degradation, and biodiversity loss. As a
result, the number of flora and fauna species has decreased dramatically over the years
(Thai Nguyen Province Committee, 2007).
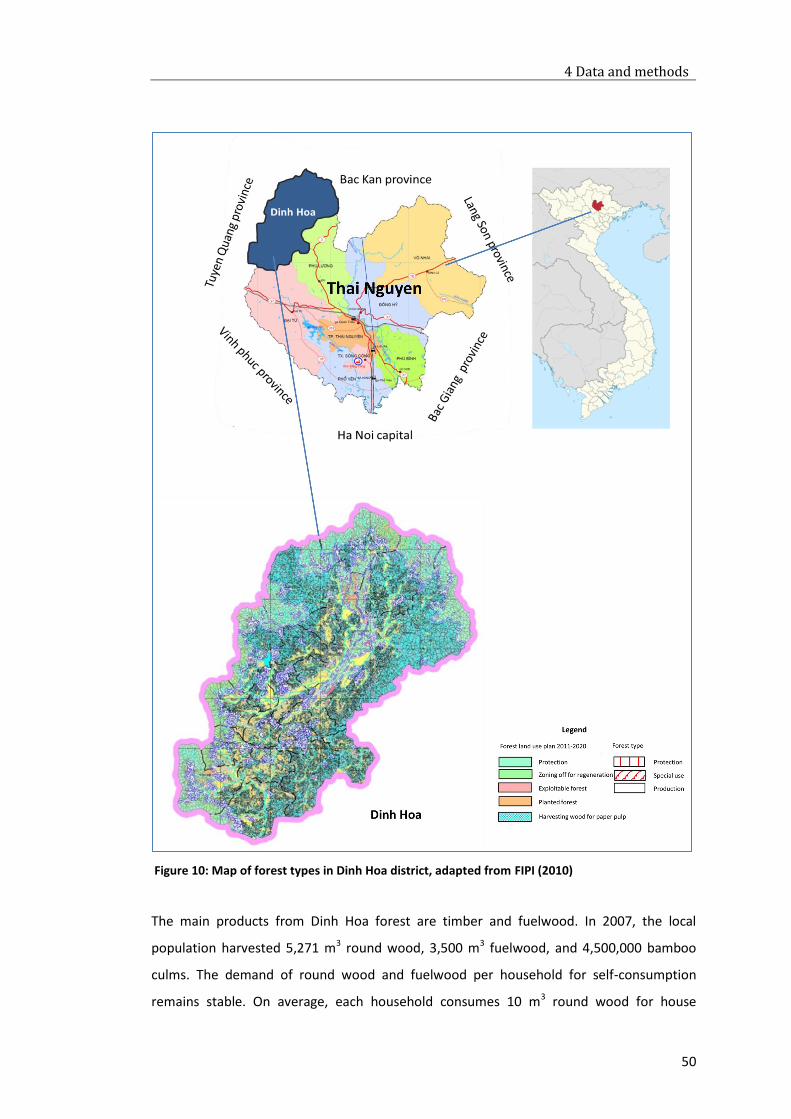
4 Data and methods
50
Figure 10: Map of forest types in Dinh Hoa district, adapted from FIPI (2010)
The main products from Dinh Hoa forest are timber and fuelwood. In 2007, the local
population harvested 5,271 m3 round wood, 3,500 m3 fuelwood, and 4,500,000 bamboo
culms. The demand of round wood and fuelwood per household for self-consumption
remains stable. On average, each household consumes 10 m3 round wood for house
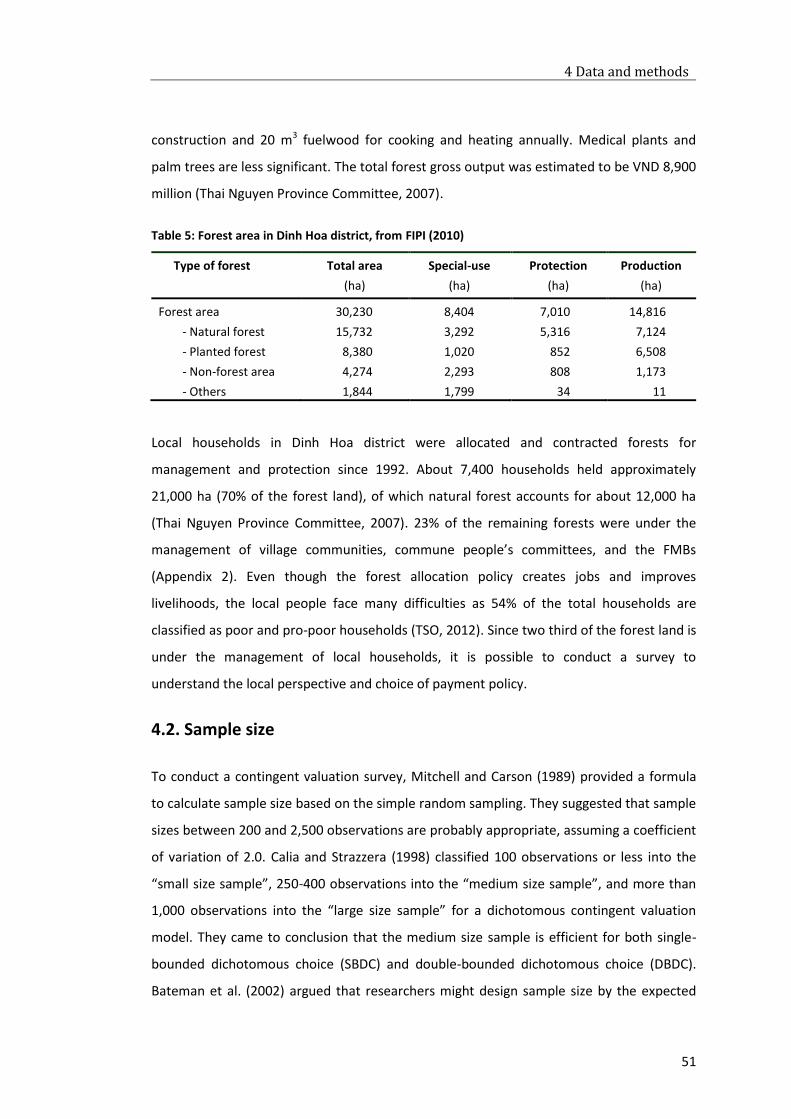
4 Data and methods
51
construction and 20 m3 fuelwood for cooking and heating annually. Medical plants and
palm trees are less significant. The total forest gross output was estimated to be VND 8,900
million (Thai Nguyen Province Committee, 2007).
Table 5: Forest area in Dinh Hoa district, from FIPI (2010)
Type of forest Total area
(ha)
Special-use
(ha)
Protection
(ha)
Production
(ha)
Forest area 30,230 8,404 7,010 14,816
- Natural forest 15,732 3,292 5,316 7,124
- Planted forest 8,380 1,020 852 6,508
- Non-forest area 4,274 2,293 808 1,173
- Others 1,844 1,799 34 11
Local households in Dinh Hoa district were allocated and contracted forests for
management and protection since 1992. About 7,400 households held approximately
21,000 ha (70% of the forest land), of which natural forest accounts for about 12,000 ha
(Thai Nguyen Province Committee, 2007). 23% of the remaining forests were under the
management of village communities, commune people’s committees, and the FMBs
(Appendix 2). Even though the forest allocation policy creates jobs and improves
livelihoods, the local people face many difficulties as 54% of the total households are
classified as poor and pro-poor households (TSO, 2012). Since two third of the forest land is
under the management of local households, it is possible to conduct a survey to
understand the local perspective and choice of payment policy.
4.2. Sample size
To conduct a contingent valuation survey, Mitchell and Carson (1989) provided a formula
to calculate sample size based on the simple random sampling. They suggested that sample
sizes between 200 and 2,500 observations are probably appropriate, assuming a coefficient
of variation of 2.0. Calia and Strazzera (1998) classified 100 observations or less into the
“small size sample”, 250-400 observations into the “medium size sample”, and more than
1,000 observations into the “large size sample” for a dichotomous contingent valuation
model. They came to conclusion that the medium size sample is efficient for both single-
bounded dichotomous choice (SBDC) and double-bounded dichotomous choice (DBDC).
Bateman et al. (2002) argued that researchers might design sample size by the expected
4 Data and methods
52
number of non-respondents and protest responses, and hence, an open-end contingent
valuation survey needs about 250-500 observations and a closed-ended contingent
valuation survey requires about 500-1,000 observations. Many economists accept the
sample size of 100-1,000 observations in a cost-benefit analysis.
Data collection costs and a project´s time frame also decide the sample size (Bateman et
al., 2002). Contingent valuation survey costs depend on survey modes: mail surveys,
telephone interviews, web-based surveys, or in-person interviews. In-person interviews are
the most effective for complex questions, the most time consuming, and the most
expensive type of surveys.
Given the limited time and budget constraints, 600 respondents were chosen to conduct
the surveys in this study, 300 for WTA survey and 300 for WTP survey.
4.2.1. WTP survey
The in-person WTP survey was conducted from June to July 2012 and included 300
randomly chosen residents (households without forests) from two districts and one city in
Thai Nguyen province. The first reason for choosing these districts and city were the
distance to forest in Dinh Hoa: Dinh Hoa district (0-10 km), Thai Nguyen city (50 km), and
Phu Binh District (80 km) (Figure 11). Secondly, the research tended to compare the
differences in attitudes towards forest protection of the residents between urban and rural
areas. In this case, Thai Nguyen city represented urban residents, while Dinh Hoa and Phu
Binh districts represented rural residents.
The WTP survey was conducted in four communes and one ward: two communes in Dinh
Hoa district, two communes in Phu Binh district, and one ward in Thai Nguyen city. The
total number of households of the four communes and one ward was 12,367. The
distribution of total sample was determined equivalent to the proportion of the size of
households in each commune or ward. For example, given that Diem Thuy commune
represents 16.3% of the population, then 16.3% of total sample of 300 would be 49
households (Table 6).

4 Data and methods
53
Figure 11: Sample site of WTP survey
Table 6: Distribution of sample in WTP survey
District/city Ward/
commune
Total
households
Ratio
(%)
No. of
households in
the survey
Phu Binh district
Diem Thuy 2,022 16.3 49
Huong Son town 2,200 17.8 53
Dinh Hoa district Cho Chu 1,798 14.5 44
Binh Yen 891 7.2 22
Thai Nguyen city Phan Dinh Phung 5,456 44.1 132
Total 12,367 100 300

4 Data and methods
54
4.2.2. WTA survey
The in-person WTA survey was carried out from May to June 2012 in Dinh Hoa district. The
sample included 300 natural forest contracted households randomly chosen from five
communes where forests were contracted for protection. The criteria for selecting these
five communes were the representation of three types of forests and the geographical
distribution. The communes were: Linh Thong located in the north, representing protection
forests; Bao Cuong and Phu Tien located in the middle, representing production forests;
and Thanh Dinh and Diem Mac located in the south, representing special-use forests
(Figure 12). Lam Vy commune, representing protection forests, was involved in group
discussion and pre-test.
Figure 12: Sample site of WTA survey
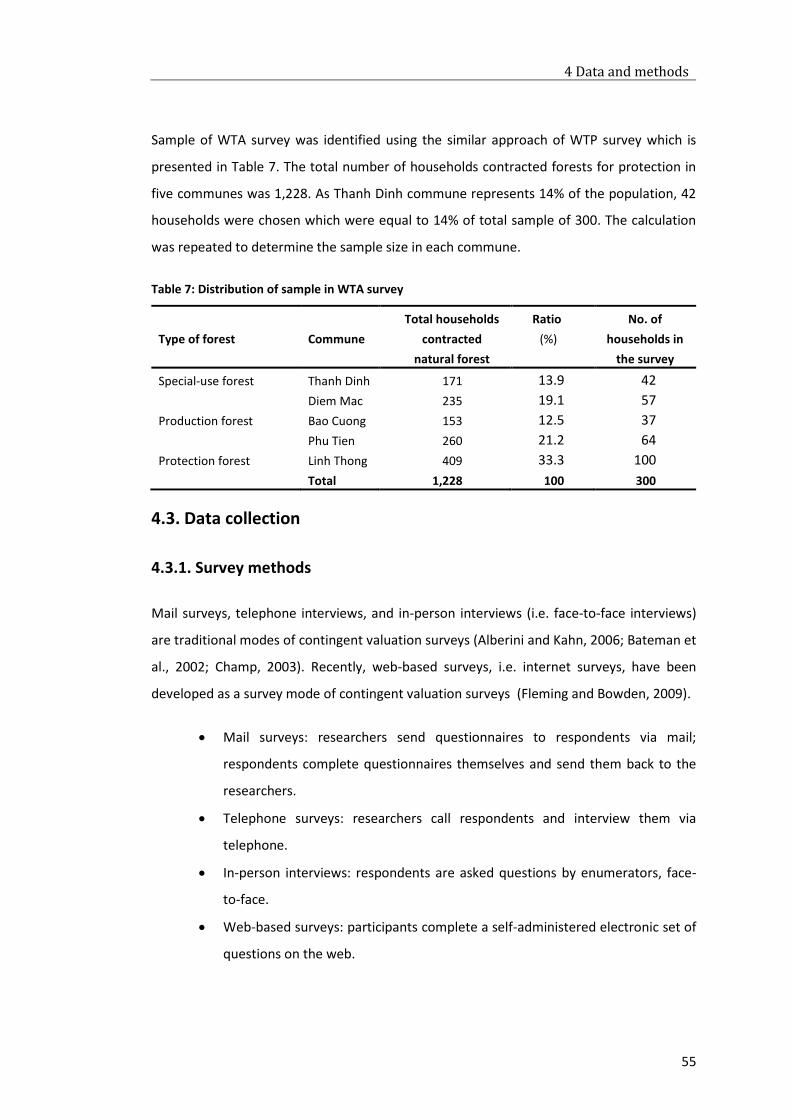
4 Data and methods
55
Sample of WTA survey was identified using the similar approach of WTP survey which is
presented in Table 7. The total number of households contracted forests for protection in
five communes was 1,228. As Thanh Dinh commune represents 14% of the population, 42
households were chosen which were equal to 14% of total sample of 300. The calculation
was repeated to determine the sample size in each commune.
Table 7: Distribution of sample in WTA survey
Type of forest
Commune
Total households
contracted
natural forest
Ratio
(%)
No. of
households in
the survey
Special-use forest Thanh Dinh 171 13.9 42
Diem Mac 235 19.1 57
Production forest Bao Cuong 153 12.5 37
Phu Tien 260 21.2 64
Protection forest Linh Thong 409 33.3 100
Total 1,228 100 300
4.3. Data collection
4.3.1. Survey methods
Mail surveys, telephone interviews, and in-person interviews (i.e. face-to-face interviews)
are traditional modes of contingent valuation surveys (Alberini and Kahn, 2006; Bateman et
al., 2002; Champ, 2003). Recently, web-based surveys, i.e. internet surveys, have been
developed as a survey mode of contingent valuation surveys (Fleming and Bowden, 2009).
Mail surveys: researchers send questionnaires to respondents via mail;
respondents complete questionnaires themselves and send them back to the
researchers.
Telephone surveys: researchers call respondents and interview them via
telephone.
In-person interviews: respondents are asked questions by enumerators, face-
to-face.
Web-based surveys: participants complete a self-administered electronic set of
questions on the web.
4 Data and methods
56
Depending on the method used, survey costs, time consumption, responses rates, the
quality and quantity of data, the complexity of questionnaires, and sample control are
different (Bateman et al., 2002). Each survey method has advantages and disadvantages
and decides the design of questionnaire. The advantages and disadvantages of data
collection methods were discussed by Alberini and Kahn (2006), Bateman et al. (2002),
Maguire (2009), and Mitchell and Carson (1989).
In-person interview is the most popular approach among contingent valuation survey
methods and is recommended by Mitchell and Carson (1989) and the US National Oceanic
and Atmosphere Administration panel (NOAA) (Arrow et al., 1993) rather than telephone
and mail surveys. The NOAA panel argued that in-person surveys are better for the
assessment for complex questions and questionnaire structures, which allow visual and
demonstration aids such as photos and maps. The interviewers can assist respondents in
understanding the context and elicitation scenarios correctly. In-person interview method
permits larger quantity of data collection; and a quality face-to-face survey may achieve
high response rate (70% or higher) (Bateman et al., 2002; Marta-Pedroso et al., 2007).
The disadvantages of in-person surveys are that they are more expensive and more time
consuming than mail, telephone, and web-based surveys because of travel requirements
and the logistic administration. In-person surveys may raise interview bias; especially in
developing countries where the respondents prefer agreement to please the interviewers,
i.e., yea-saying tendency (Whittington, 1998). Additionally, in face-to-face surveys,
respondents have little time to think about valuation questions and have to answer
immediately. A variety of methods were developed to reduce yea-saying tendency, such as
cheap-talk script (Champ et al., 2009; Cummings and Taylor, 1999; Murphy et al., 2005;
Silva et al., 2011), ballot boxes (Krosnick et al., 2001), time-to-think (Whittington et al.,
1992), and drop-off protocols (Subade, 2007). The time-to-think and the drop-off method
were successfully applied in developing countries (Whittington, 2010).
To reduce interview bias, a thorough training of interviewers is mandatory before the start
of the surveys. The researchers should attend in the interviewer training and monitor the
pre-test surveys to assure the surveys are conducted in line of their purposes.
In the evaluation of Dinh Hoa forest, mail surveys, telephone interviews, and web-based
surveys are difficult to apply. Thai Nguyen province is a mountainous province in
4 Data and methods
57
northeastern Vietnam where the rate of poor households is relatively high. Many people
have no access to the internet and thus, web-based surveys are impossible. Telephone
surveys and mail surveys tend to be more popular in large cities like Hanoi and Ho Chi Minh
City than a mountainous province like Thai Nguyen. Moreover, low levels of education in
remote districts as Dinh Hoa or Phu Binh restraints the understanding of environmental
scenarios, which are complex and unfamiliar to rural people in developing countries. For
those reasons, in-person surveys are the most appropriate method.
4.3.2. Secondary data collection
Secondary data collection was carried out in province, district, and commune levels to
provide an overview of natural, socio-economic, and institutional characteristics. In the
WTA survey, six interviews with six forest wardens in six communes were conducted to
gather general information about forest situation. Then, two lists of participants of the
surveys were made: one for the WTA survey and one for the WTP survey. Households
participated in the WTA survey were randomly chosen from the list of households who
were contracted and allocated natural forests for protection and management in each
commune. Households participated in WTP survey were randomly picked from the list of
households which was available in administrative department of each commune and ward.
The logistic conditions were pre-organized for the following steps.
4.3.3. Focus group discussion
This step aims to preliminarily assess the attitudes of local people towards forest
protection and identify the compensation levels that forest contracted households wish to
be compensated (WTA survey) and payment levels that residents in Thai Nguyen province
would be willing to pay (WTP survey).
4.3.3.1. WTP survey
In order to identify the perception and attitudes of residents in Thai Nguyen province
towards forest protection, three group discussions were made in April 2012 in Thai Nguyen
city, Phu Binh district, and Dinh Hoa district. Each group included five to seven participants.
People were asked about their preferences towards environmental problems and forest

4 Data and methods
58
protection (see Appendix 3). Maps, pictures, and description of forests in Dinh Hoa were
introduced to provide comprehensive background information.
Overall, people worried most about air and water quality, which directly affects their daily
life. Although they were aware of deforestation, which was mentioned frequently on
broadcast media, they found forest to be less important among environmental issues.
More than half the participants visited Dinh Hoa Safety Zone, a historical tourism attraction
in Dinh Hoa forest. They agreed that forests in Dinh Hoa should be protected and they
would pay if the state provides a transparent mechanism of distribution of the money. The
payments suggested by participants ranged from VND 5,000 to VND 120,000 per
household. Five initial bids were set up: VND 10,000, VND 20,000, VND 35,000, VND
50,000, and VND 80,000. People preferred a payment as a contribution rather than an
increasing in income tax, electricity bill, or water bill. Eventually, cash was the optimum
choice for payment.
4.3.3.2. WTA survey
Three focus group discussions were performed in March 2012 in Lam Vy commune
(protection forest), Phu Tien commune (production forest), and Diem Mac commune
(special-use forest). Each group represented one type of forest and consisted of five to 11
participants. Participants were selected from forest contracted households. The group
discussions lasted between 90 and 120 minutes. The similar maps, pictures, and description
of forests in Dinh Hoa used in WTP group discussion were also involved. The content of
discussions (see Appendix 4) was to assess local´s attitudes towards the forest situation in
Dinh Hoa and their satisfaction with the current payment levels of government.
Participants revealed that the payment levels were low and not sufficient to compensate
alternative land uses and even working time losses. Participants in Lam Vy commune stated
that they received VND 50,000/ha/year instead of VND 100,000/ha/year. In 2010 and 2011,
they did not receive any payment from government for natural forest protection.
In focus group discussions, the proposal of average payment per household per year was
rejected because the forest area contracted and allocated to each household and individual
was different: several households hold large forest area (more than 20 ha), while many
others hold half to one ha. The payment per ha per year was more reasonable. The value
4 Data and methods
59
range of payment suggested by those households in focus group discussions extended from
VND 50,000 to VND 1,000,000 per ha per year. Households contracted production forests
demanded the highest payment: VND 800,000 to VND 1,000,000 per household per year
while households contracted special-use forests required the lowest price: VND 100,000 to
VND 200,000 per ha per year. Some households contracted special-use forests even
accepted VND 50,000 per ha per year. Households contracted protection forests asked for
a moderate price: VND 400,000 to VND 500,000. After focus group discussions, five initial
bids were set up: VND 100,000, VND 250,000, VND 400,000, VND 600,000, and VND
800,000. Rice was suggested as alternative compensation but they all refused because they
could fulfill their demand themselves, and thus cash was preferred as compensation
vehicle.
Information relating to forest products collected, forestry, cultivation, and domestic
livestock was also discussed. The questionnaire was adjusted and shortened due to the
actual products from forest, crops, and farm animals that participants mentioned.
After group discussions, the draft questionnaires were discussed with economic experts
from several universities in Vietnam and revised where necessary5. Several unnecessary
questions were eliminated, the order of several questions were changed. The sentences
were shortened and clarified as far as possible.
4.3.4. Pre-test
Before doing the pre-test, ten interviewers were trained within three days. Those
interviewers were fourth-year students at Thai Nguyen University of Agriculture and
Forestry who studied agriculture and forestry. On the first day, they were introduced to the
purposes of the surveys and were explained the content of questionnaires. On the second
day, they were trained interview skills: how to read the questions, how to fill in the
questionnaires, how to interact with the local people, how to control the interview time,
and how to keep the interview consistently without providing other information which was
not mentioned in the questionnaires. On the third day, the interviewers practiced
5 Universities involved in the discussions: Thai Nguyen University of Agriculture and Forestry, Hanoi
University of Agriculture, Vietnam Forestry University, University of Economics Ho Chi Minh City.
4 Data and methods
60
interviews independently by themselves, and then received the comments from
supervisors. At the final stage, ten households were invited to take part in real interviews.
Finally, five interviewers, who performed best, were chosen to conduct the main surveys.
20 forest contracted households in Dinh Hoa were chosen for conducting the WTA pre-test
and 20 households in Thai Nguyen city and Phu Binh district were selected for the WTP pre-
test. Feedbacks from pre-test were used to adjust both the questionnaire items and
enumerators’ way of asking to ensure the correct understanding of questionnaire, fit the
local context and language, control time consuming, and improve the interview skills.
In general, respondents felt comfortable with the pre-test surveys. Pictures of Dinh Hoa
forests were helpful to the WTP survey as people were far away from forests and were not
informed of forests situation. On the contrary, pictures were not necessary in case of the
WTA survey because forest contracted households were clearly aware of the forest
condition in Dinh Hoa. We decided to eliminate supporting pictures in the WTA survey in
order to save interviewing time and control the concentration of respondents.
4.4. Questionnaire design
4.4.1. Double-bounded dichotomous choice approach
In order to estimate maximum WTP and minimum WTA, four major elicitation techniques
are used: the open-ended, bidding game, payment cards, and dichotomous choice (DC)
approach.
Open-ended: respondents are asked for their maximum WTP or minimum WTA,
e.g. “How much are you willing to pay VND X for good A?” This elicitation method is
simple, straightforward, easy to apply, and avoids an “anchoring“-effect
(respondents influenced by a suggested starting value). This elicitation format
becomes difficult if respondents are unfamiliar with the commodity in question.
This might explain why this approach has high rates of non-responses, protest
answers, and zero answers (Bateman et al., 2002). Strategic bias such as free riding
and overbidding might happen with open-ended format (Garrod and Willis, 1999;
Mitchell and Carson, 1989).
4 Data and methods
61
Bidding game: interviewers deal with respondents until the final price is identified.
Respondents reply to the question “Are you willing to pay VND X for good A?” by a
“Yes” or a “No” answer. If respondents say “Yes”, interviewers will increase the
value until respondents say “No”, and otherwise. This method allows respondents
to consider their preferences thoroughly. The disadvantage of the bidding game
method is that the respondent might be influenced by the starting value, and thus,
a starting point bias or anchoring bias might occur. The bidding game is appropriate
for in-person interviews and cannot be used in mail surveys, telephone interviews,
and web-based surveys.
Payment card: respondents choose a WTP point from a list of values. The payment
card approach is considered an alternative method between open-ended and
bidding game, avoiding starting point bias and strategic bidding. The range bias
might occur if the true WTP or WTA of respondents does not lie in the value range
offered. Range bias might be avoided by extending the value range without
constraining respondents’ preferences.
Dichotomous choice, i.e. referendum format: Respondents reply to the question
“Are you willing to pay VND X for good A?” by a “Yes” or a “No” answer. Compared
to other elicitation formats, the DC is easier for respondents because they do not
provide (as in open-ended format) or chose a specific value (as in payment card
format). Instead, they simply agree or disagree with a given bid by answering “Yes”
or “No” to the question. This approach is more realistic as respondents make
decisions confronted with fixed prices. The use of the DC approach mitigates
strategy bias and free riding (Mitchell and Carson, 1989), and minimizes non-
responses and outliers (Carson and Groves, 2007). Furthermore, addressing each
respondent to each price or bid offer would restrain value, which tends to be
overestimated in WTA study and underestimated in WTP survey. The DC approach
is further divided into two types: single-bounded dichotomous choice (SBDC) or
take-it-or-leave-it and double-bounded dichotomous choice (DBDC) or take-it-or-
leave-it with follow-up.
NOAA recommended DC method for a contingent valuation study, especially in developing
countries (Arrow et al., 1993). In the early 1990s, experimental study results carried out by
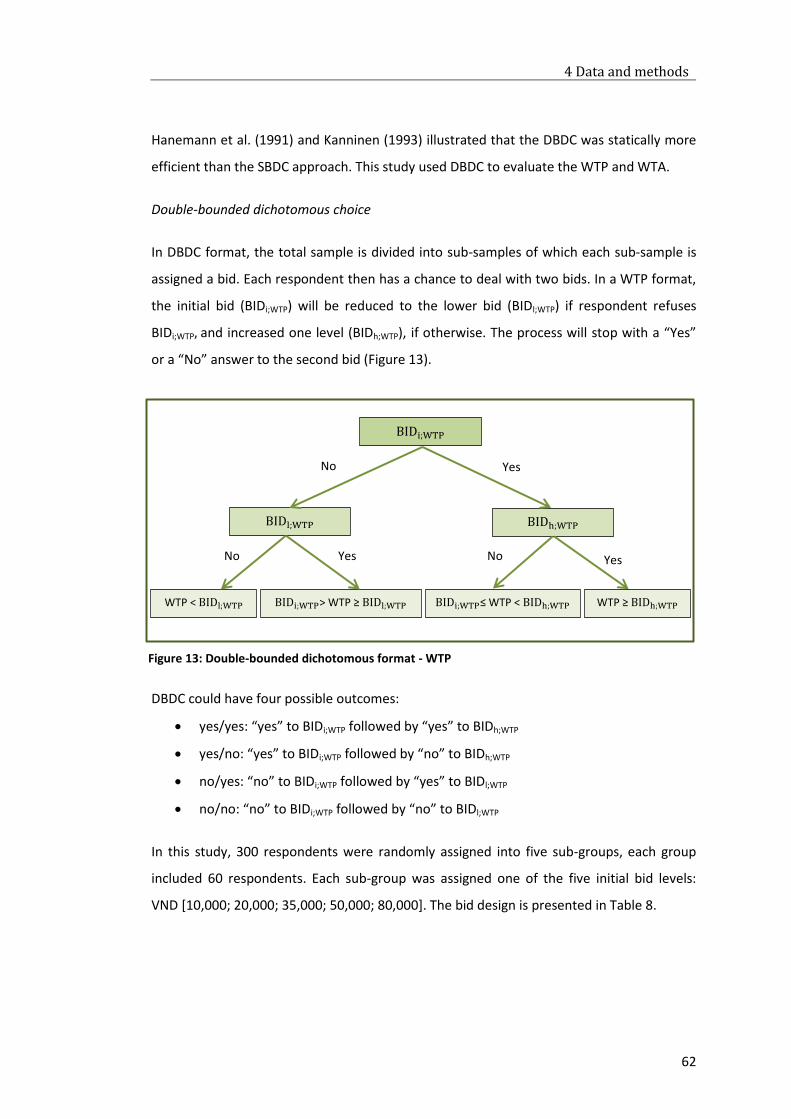
4 Data and methods
62
Hanemann et al. (1991) and Kanninen (1993) illustrated that the DBDC was statically more
efficient than the SBDC approach. This study used DBDC to evaluate the WTP and WTA.
Double-bounded dichotomous choice
In DBDC format, the total sample is divided into sub-samples of which each sub-sample is
assigned a bid. Each respondent then has a chance to deal with two bids. In a WTP format,
the initial bid (BIDi;WTP) will be reduced to the lower bid (BIDl;WTP) if respondent refuses
BIDi;WTP, and increased one level (BIDh;WTP), if otherwise. The process will stop with a “Yes”
or a “No” answer to the second bid (Figure 13).
DBDC could have four possible outcomes:
yes/yes: “yes” to BIDi;WTP followed by “yes” to BIDh;WTP
yes/no: “yes” to BIDi;WTP followed by “no” to BIDh;WTP
no/yes: “no” to BIDi;WTP followed by “yes” to BIDl;WTP
no/no: “no” to BIDi;WTP followed by “no” to BIDl;WTP
In this study, 300 respondents were randomly assigned into five sub-groups, each group
included 60 respondents. Each sub-group was assigned one of the five initial bid levels:
VND [10,000; 20,000; 35,000; 50,000; 80,000]. The bid design is presented in Table 8.
Figure 13: Double-bounded dichotomous format - WTP
Yes
Yes No Yes No
No
BIDHWTA
WTP < BIDl;WTP BIDi;WTP> WTP ≥ BIDl;WTP
BIDi;WTP≤ WTP < BIDh;WTP
BIDl;WTP BIDh;WTP
BIDi;WTP
BIDHWTA
WTP ≥ BIDh;WTP
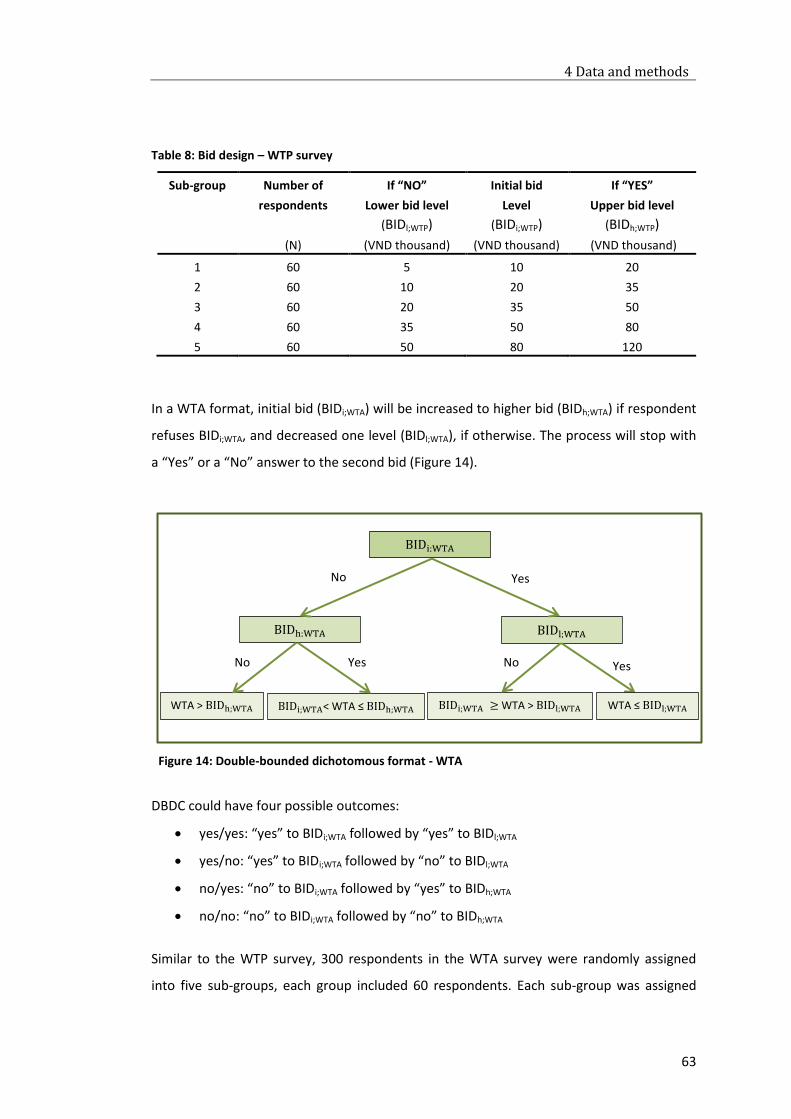
4 Data and methods
63
Table 8: Bid design – WTP survey
Sub-group Number of
respondents
(N)
If “NO”
Lower bid level
(BIDl;WTP)
(VND thousand)
Initial bid
Level
(BIDi;WTP)
(VND thousand)
If “YES”
Upper bid level
(BIDh;WTP)
(VND thousand)
1 60 5 10 20
2 60 10 20 35
3 60 20 35 50
4 60 35 50 80
5 60 50 80 120
In a WTA format, initial bid (BIDi;WTA) will be increased to higher bid (BIDh;WTA) if respondent
refuses BIDi;WTA, and decreased one level (BIDl;WTA), if otherwise. The process will stop with
a “Yes” or a “No” answer to the second bid (Figure 14).
DBDC could have four possible outcomes:
yes/yes: “yes” to BIDi;WTA followed by “yes” to BIDl;WTA
yes/no: “yes” to BIDi;WTA followed by “no” to BIDl;WTA
no/yes: “no” to BIDi;WTA followed by “yes” to BIDh;WTA
no/no: “no” to BIDi;WTA followed by “no” to BIDh;WTA
Similar to the WTP survey, 300 respondents in the WTA survey were randomly assigned
into five sub-groups, each group included 60 respondents. Each sub-group was assigned
Figure 14: Double-bounded dichotomous format - WTA
Yes
Yes No Yes No
No
BIDHWTA
WTA > BIDh;WTA BIDi;WTA< WTA ≤ BIDh;WTA
BIDi;WTA ≥ WTA > BIDl;WTA
BIDh;WTA BIDl;WTA
BIDi;WTA
BIDHWTA
WTA ≤ BIDl;WTA

4 Data and methods
64
one of the five initial bid levels: [VND 100,000; 250,000; 400,000; 600,000; 800,000]. The
bid design is presented in Table 9.
Table 9: Bid design – WTA survey
Sub-group Number of
respondents
(N)
If “YES”
Lower bid level
(BIDl;WTA)
(VND thousand)
Initial bid
level
(BIDi;WTA)
(VND thousand)
If “NO”
Upper bid level
(BIDh;WTA)
(VND thousand)
1 60 50 100 250
2 60 100 250 400
3 60 250 400 600
4 60 400 600 800
5 60 600 800 1000
4.4.2. Questionnaire structure
4.4.2.1. WTP survey
The questionnaire of the WTP survey included three sections (see Appendix 5). In the first
section, respondents were asked about their attitudes and opinions about general
environmental interests. Then several questions about perceptions, opinions, and
preferences towards forest protection in the Dinh Hoa district were adopted. The second
section debriefed the respondent’s WTP. This section included a contingent valuation
scenario, valuation elicitation questions, and follow-up questions to ensure the certainty of
responses. The final section contained questions of demographic and socio-economic
characteristics of respondents.
The scenario of the survey was formulated as
“Forests provide a range of environmental, social, and economic benefits that improve our
quality of life.
Healthy forests clean and improve our air, store carbon, and moderate the climate.
Forests conserve and purify water, prevent flood and drought, prevent soil erosion,
and preserve the integrity of topsoil.
Forests serve as homes and support wildlife.

4 Data and methods
65
Forests enhance the beauty of landscapes, create and provide recreational and
educational opportunities.
People can enjoy economic benefits such as revenue from the processing and trade
of forest products, reduction of energy costs, and employment opportunities.
Dinh Hoa district is characterized by its rich social and cultural diversity as well as its
important role in the region’s economic development. Dinh Hoa forest is an especially
important part of the Dinh Hoa Safety Zone, a national historical site including 109 relics
from the revolutionary era. The forest covers about 30,000 ha representing 58% of the total
land. Half of forest area is covered with natural forests. The district, like those in other
mountainous regions in Northern Vietnam, suffers from forest loss, forest degradation, and
biodiversity loss. As a result, the number of flora and fauna species has decreased
dramatically over the years.
Forest protection not only benefits the people in Dinh Hoa district by preserving natural
forests, it also increases environmental services, promotes tourism, and ensures historical
preservation. Over the years, the government has made a significant effort to support
afforestation and forest rehabilitation in Dinh Hoa district. Nevertheless, the protection of
Dinh Hoa forest is threatened by limited financial support.
Suppose that a fund for Dinh Hoa forest development and protection was created to
support natural forest management in Dinh Hoa district. The money collected would be
given directly to foresters and farmers involved in managing and protecting forests in Dinh
Hoa. The money would be paid to them twice a year: at the end of the first six months and
at the end of the last six months. Payments would only be made if all terms in the
protection contract were met. The payment would be withdrawn and a fine would be issued
in the case of any forest loss.
Suppose that this program was implemented in the next five years and needed the support
of all households in Thai Nguyen province. We are now going to ask how much your
household would be willing to pay as a one-time contribution to the Dinh Hoa forest
development and protection program. There is no right or wrong answer. Please keep in
mind your household incomes and living expenses.

4 Data and methods
66
Suppose that your household, as well as all other households in Thai Nguyen province, were
asked to contribute to the project as a one-time payment. Would you be willing to pay
VND….. thousand per household as maximum payment?
If Yes, would you be willing to pay VND….thousand per household?
If No, would you be willing to pay VND….thousand per household?”
4.4.2.2. WTA survey
The questionnaire of the WTA survey included four sections (see Appendix 6).
Firstly, the households were asked about the current situation of local forests: General
information about forests which were contracted or allocated to households; how the
forests have changed over five years; how forests´ most significantly impact their daily life
and agriculture activities; and their perspective on the forests´ future. These questions
reminded the households of the forests´ condition and motivated them to think about their
preferences. The second section debriefed the respondent’s WTA. This section included the
valuation scenario, the valuation elicitation questions, and the follow-up questions to
validate the certainty of responses. Economic activities related to forest products collected,
crops cultivated, and raising farm animals were mentioned in section three. The objective
of this section was to calculate the total income and identify farmers´ livelihoods. In the last
section, demographic characteristics of the respondents, such as age, gender, marital
status, number of household members, education, and occupation were gathered.
The contingent valuation question was formulated as
“Suppose that the payment for natural forest protection is adjusted in the next five years.
As a result, you would receive a new contract which clarifies your rights and your
obligations to the forest. All benefit rights to the forest would remain, but any illegal
logging, illegal agriculture cultivation, and uncontrolled grazing in the forest would be
prohibited. The money would be paid out twice a year: at the end of the first six months and
at the end of the last six months. You would only be paid if all terms in the protection
contract were met. The payment would be withdrawn and a fine would be issued in the
case of any forest loss.
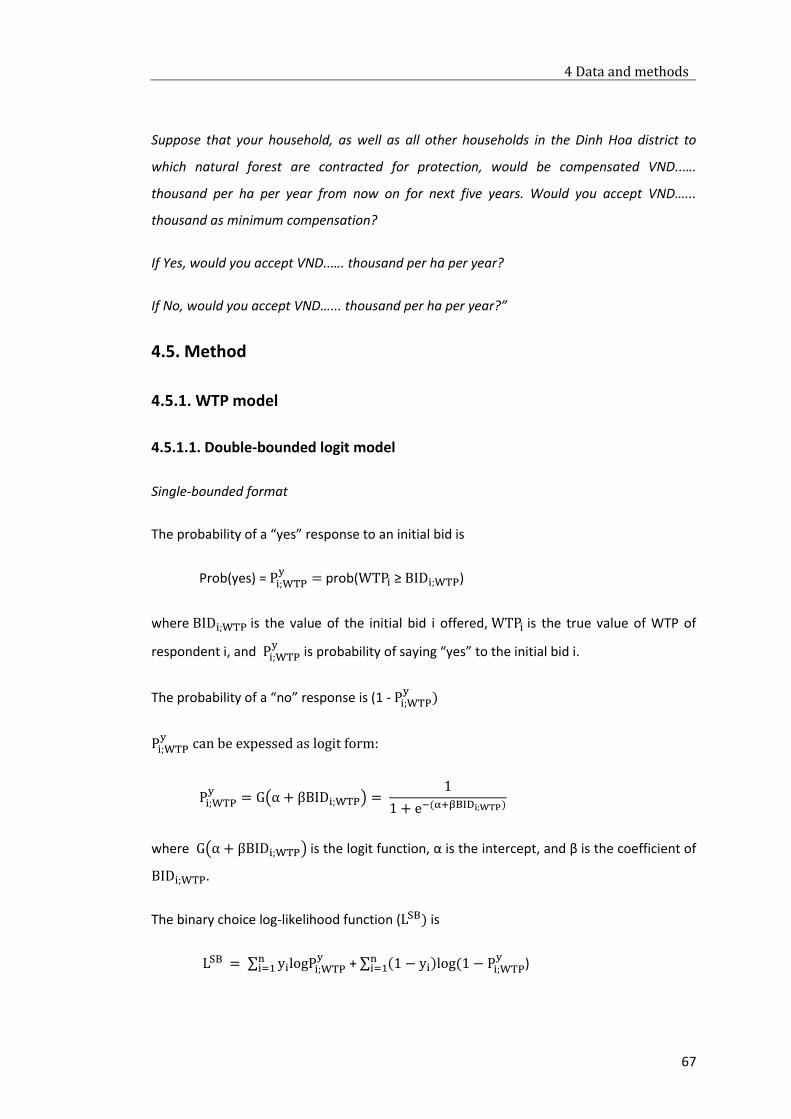
4 Data and methods
67
Suppose that your household, as well as all other households in the Dinh Hoa district to
which natural forest are contracted for protection, would be compensated VND..….
thousand per ha per year from now on for next five years. Would you accept VND…...
thousand as minimum compensation?
If Yes, would you accept VND..…. thousand per ha per year?
If No, would you accept VND…... thousand per ha per year?”
4.5. Method
4.5.1. WTP model
4.5.1.1. Double-bounded logit model
Single-bounded format
The probability of a “yes” response to an initial bid is
Prob(yes) = Pi;WTPy
= prob(WTPi ≥ BIDi;WTP)
where BIDi;WTP is the value of the initial bid i offered, WTPi is the true value of WTP of
respondent i, and Pi;WTPy
is probability of saying “yes” to the initial bid i.
The probability of a “no” response is (1 - Pi;WTPy
)
Pi;WTPy
can be expessed as logit form:
Pi;WTPy
= G(α + βBIDi;WTP) = 1
1 + e−(α+βBIDi;WTP)
where G(α + βBIDi;WTP) is the logit function, α is the intercept, and β is the coefficient of
BIDi;WTP.
The binary choice log-likelihood function (LSB) is
LSB = ∑ yilogPi;WTPyn
i=1 + ∑ (1 − yi)log (1 − Pi;WTPyn
i=1 )
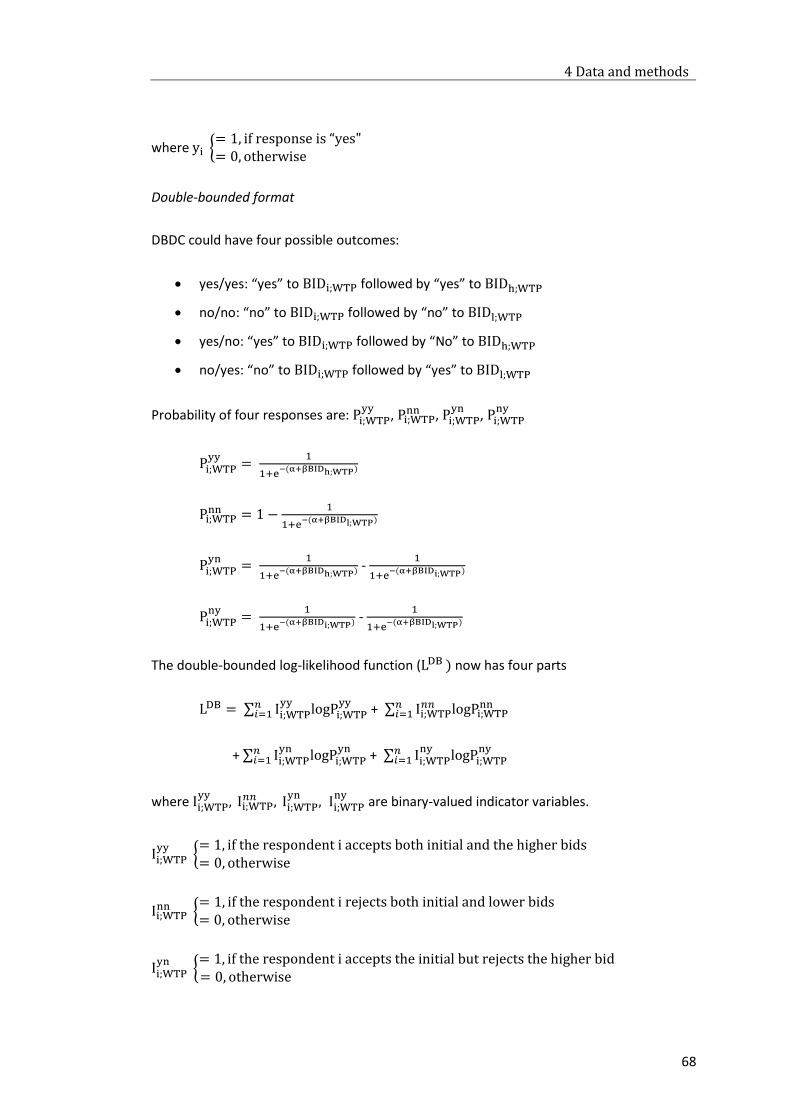
4 Data and methods
68
where yi {= 1, if response is “yes"= 0, otherwise
Double-bounded format
DBDC could have four possible outcomes:
yes/yes: “yes” to BIDi;WTP followed by “yes” to BIDh;WTP
no/no: “no” to BIDi;WTP followed by “no” to BIDl;WTP
yes/no: “yes” to BIDi;WTP followed by “No” to BIDh;WTP
no/yes: “no” to BIDi;WTP followed by “yes” to BIDl;WTP
Probability of four responses are: Pi;WTPyy
, Pi;WTPnn , Pi;WTP
yn, Pi;WTP
ny
Pi;WTPyy
= 1
1+e−(α+βBIDh;WTP)
Pi;WTPnn = 1 −
1
1+e−(α+βBIDl;WTP)
Pi;WTPyn
= 1
1+e−(α+βBIDh;WTP) -
1
1+e−(α+βBIDi;WTP)
Pi;WTPny
= 1
1+e−(α+βBIDi;WTP) -
1
1+e−(α+βBIDl;WTP)
The double-bounded log-likelihood function (LDB ) now has four parts
LDB = ∑ Ii;WTPyy
logPi;WTPyy𝑛
𝑖=1 + ∑ Ii;WTP𝑛𝑛 logPi;WTP
nn𝑛𝑖=1
+ ∑ Ii;WTPyn
logPi;WTPyn𝑛
𝑖=1 + ∑ Ii;WTPny
logPi;WTPny𝑛
𝑖=1
where Ii;WTPyy
, Ii;WTP𝑛𝑛 , Ii;WTP
yn, Ii;WTP
ny are binary-valued indicator variables.
Ii;WTPyy
{= 1, if the respondent i accepts both initial and the higher bids= 0, otherwise
Ii;WTPnn {
= 1, if the respondent i rejects both initial and lower bids = 0, otherwise
Ii;WTPyn
{= 1, if the respondent i accepts the initial but rejects the higher bid = 0, otherwise
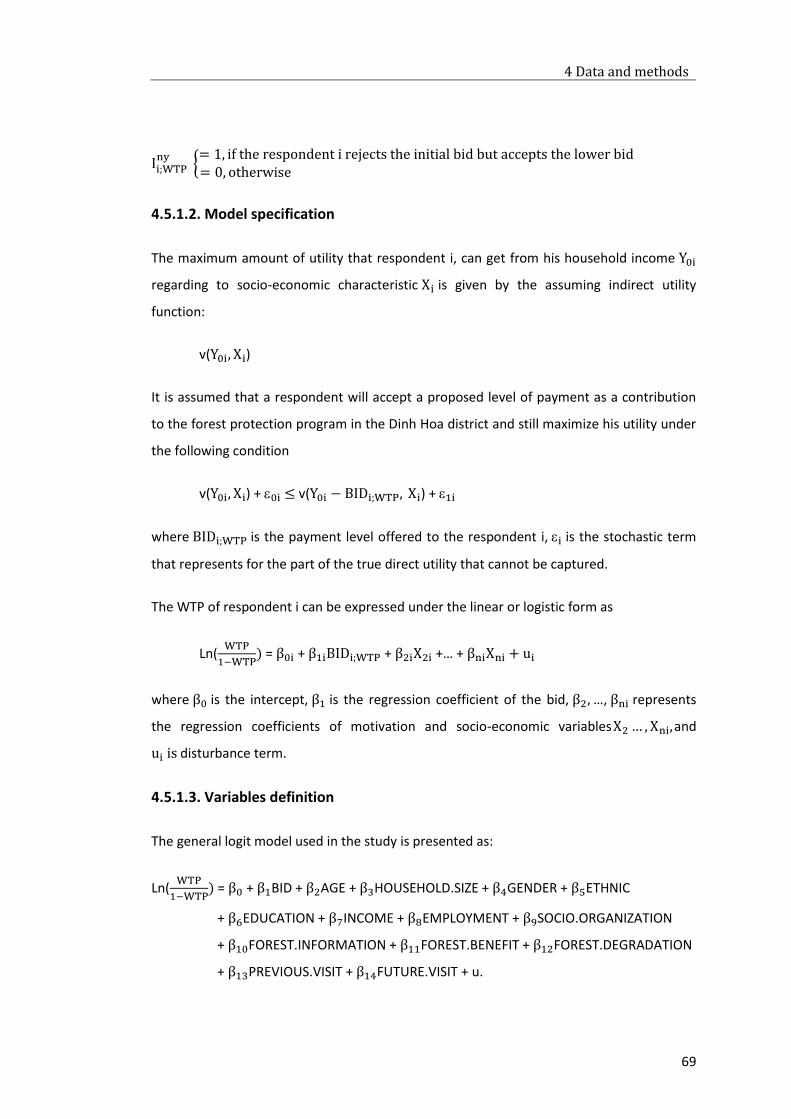
4 Data and methods
69
Ii;WTPny
{= 1, if the respondent i rejects the initial bid but accepts the lower bid= 0, otherwise
4.5.1.2. Model specification
The maximum amount of utility that respondent i, can get from his household income Y0i
regarding to socio-economic characteristic Xi is given by the assuming indirect utility
function:
v(Y0i, Xi)
It is assumed that a respondent will accept a proposed level of payment as a contribution
to the forest protection program in the Dinh Hoa district and still maximize his utility under
the following condition
v(Y0i, Xi) + 0i ≤ v(Y0i − BIDi;WTP, Xi) + 1i
where BIDi;WTP is the payment level offered to the respondent i, i is the stochastic term
that represents for the part of the true direct utility that cannot be captured.
The WTP of respondent i can be expressed under the linear or logistic form as
Ln(WTP
1−WTP) = β0i + β1iBIDi;WTP + β2iX2i +… + βniXni + ui
where β0 is the intercept, β1 is the regression coefficient of the bid, β2, …, βni represents
the regression coefficients of motivation and socio-economic variablesX2 … , Xni,and
ui is disturbance term.
4.5.1.3. Variables definition
The general logit model used in the study is presented as:
Ln(WTP
1−WTP) = β0 + β1BID + β2AGE + β3HOUSEHOLD.SIZE + β4GENDER + β5ETHNIC
+ β6EDUCATION + β7INCOME + β8EMPLOYMENT + β9SOCIO.ORGANIZATION
+ β10FOREST.INFORMATION + β11FOREST.BENEFIT + β12FOREST.DEGRADATION
+ β13PREVIOUS.VISIT + β14FUTURE.VISIT + u.
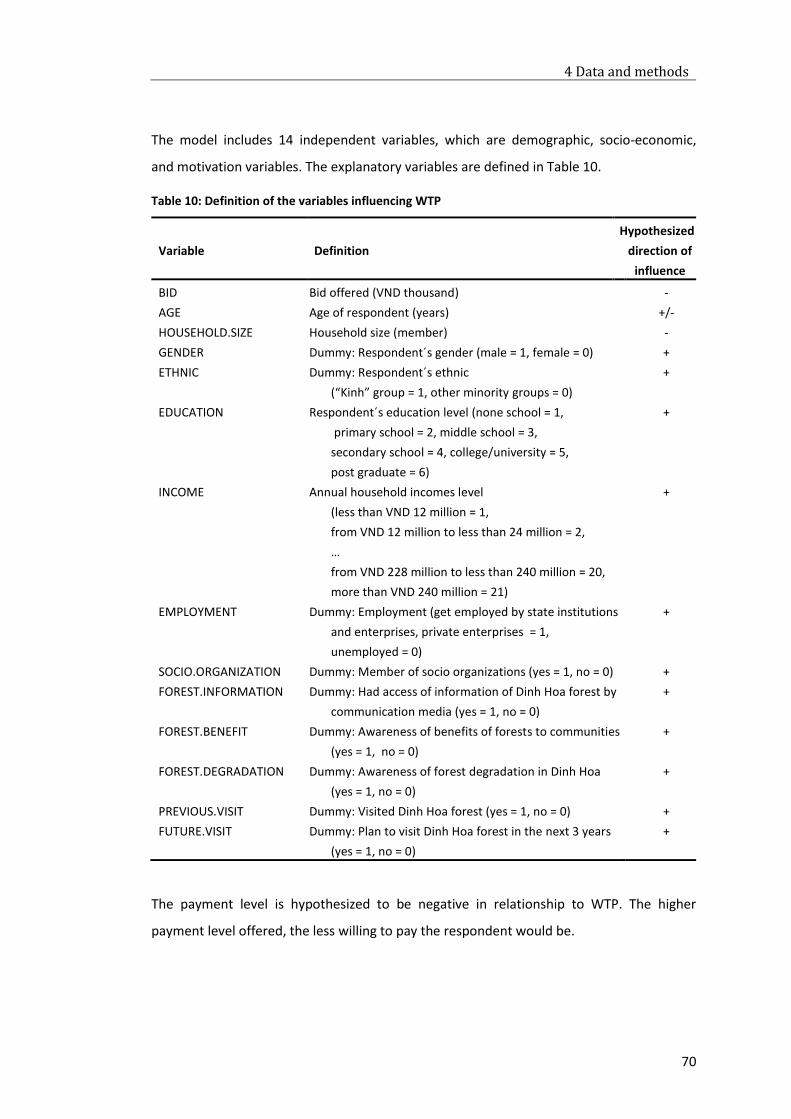
4 Data and methods
70
The model includes 14 independent variables, which are demographic, socio-economic,
and motivation variables. The explanatory variables are defined in Table 10.
Table 10: Definition of the variables influencing WTP
Variable
Definition
Hypothesized
direction of
influence
BID Bid offered (VND thousand) -
AGE Age of respondent (years) +/-
HOUSEHOLD.SIZE Household size (member) -
GENDER Dummy: Respondent´s gender (male = 1, female = 0) +
ETHNIC Dummy: Respondent´s ethnic
(“Kinh” group = 1, other minority groups = 0)
+
EDUCATION Respondent´s education level (none school = 1,
primary school = 2, middle school = 3,
secondary school = 4, college/university = 5,
post graduate = 6)
+
INCOME Annual household incomes level
(less than VND 12 million = 1,
from VND 12 million to less than 24 million = 2,
…
from VND 228 million to less than 240 million = 20,
more than VND 240 million = 21)
+
EMPLOYMENT Dummy: Employment (get employed by state institutions
and enterprises, private enterprises = 1,
unemployed = 0)
+
SOCIO.ORGANIZATION Dummy: Member of socio organizations (yes = 1, no = 0) +
FOREST.INFORMATION Dummy: Had access of information of Dinh Hoa forest by
communication media (yes = 1, no = 0)
+
FOREST.BENEFIT Dummy: Awareness of benefits of forests to communities
(yes = 1, no = 0)
+
FOREST.DEGRADATION Dummy: Awareness of forest degradation in Dinh Hoa
(yes = 1, no = 0)
+
PREVIOUS.VISIT Dummy: Visited Dinh Hoa forest (yes = 1, no = 0) +
FUTURE.VISIT Dummy: Plan to visit Dinh Hoa forest in the next 3 years
(yes = 1, no = 0)
+
The payment level is hypothesized to be negative in relationship to WTP. The higher
payment level offered, the less willing to pay the respondent would be.

4 Data and methods
71
The size of household is hypothesized to negatively influence WTP. The increasing
household size can increase household consumption demand. As a result, the larger
households are assumed to pay less than the smaller households.
Older individuals may pay more attention to environmental issues than younger
generations. However, older individuals have fewer opportunities to earn an income or
gain employment compared to younger generations due to physical limitations. The
influence of age of respondents to WTP, hence, is unpredictable.
The acceptance of payment offered may be different between men and women. As men
typically earn higher incomes than women, men are expected to be more willing to pay
than women. The gender of respondents is hypothesized to be positive in relationship to
WTP.
Individuals of the “Kinh” group, who typically live in cities, towns, and district centers, have
higher education and income levels, a better quality of life, and greater access to
information than minority ethnic groups who live in mountainous areas and depend on
crops cultivation. “Kinh” individuals are assumed to be more WTP than those of other
ethnic groups.
Education level of respondents is hypothesized to be positive in relationship to WTP. Well-
educated respondents are expected to have a higher awareness of and greater
appreciation for natural resources. Higher educated respondents are expected to be more
willing to pay than lower educated respondents.
Household incomes are expected to have positive relationship to WTP. The higher the
incomes they earn, the higher the level payment they are willing to pay.
Respondents who are employed by state institutions, state enterprises, and private
enterprises could be paid more regularly than those who are unemployed. The occupation
of respondents is expected to have a positive relationship to WTP.
Members of social organizations typically join social activities. They interact with each
other and share characteristics. They would be more flexible in behaviors to social and
environmental issues. Respondents who are members of social organizations are
hypothesized to pay higher than those who are not members of any social organization.
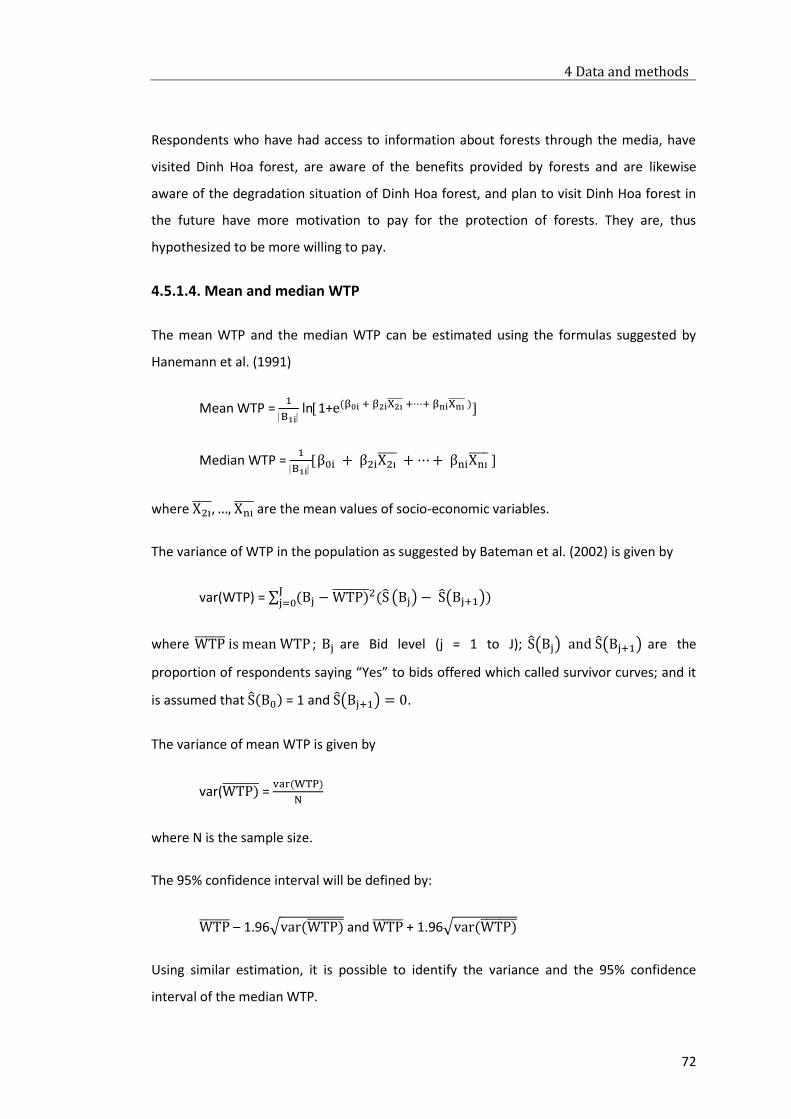
4 Data and methods
72
Respondents who have had access to information about forests through the media, have
visited Dinh Hoa forest, are aware of the benefits provided by forests and are likewise
aware of the degradation situation of Dinh Hoa forest, and plan to visit Dinh Hoa forest in
the future have more motivation to pay for the protection of forests. They are, thus
hypothesized to be more willing to pay.
4.5.1.4. Mean and median WTP
The mean WTP and the median WTP can be estimated using the formulas suggested by
Hanemann et al. (1991)
Mean WTP = 1
B1i ln1+e(β0i + β2iX2i +⋯+ βniXni )
Median WTP = 1
B1i β0i + β2iX2i
+ ⋯ + βniXni
where X2i , …, Xni
are the mean values of socio-economic variables.
The variance of WTP in the population as suggested by Bateman et al. (2002) is given by
var(WTP) = ∑ (Bj − WTP) 2(SJj=0 (Bj) − S(Bj+1))
where WTP is mean WTP ; Bj are Bid level (j = 1 to J); S(Bj) and S(Bj+1) are the
proportion of respondents saying “Yes” to bids offered which called survivor curves; and it
is assumed that S(B0) = 1 and S(Bj+1) = 0.
The variance of mean WTP is given by
var(WTP) = var(WTP)
N
where N is the sample size.
The 95% confidence interval will be defined by:
WTP – 1.96√var(WTP) and WTP + 1.96√var(WTP)
Using similar estimation, it is possible to identify the variance and the 95% confidence
interval of the median WTP.
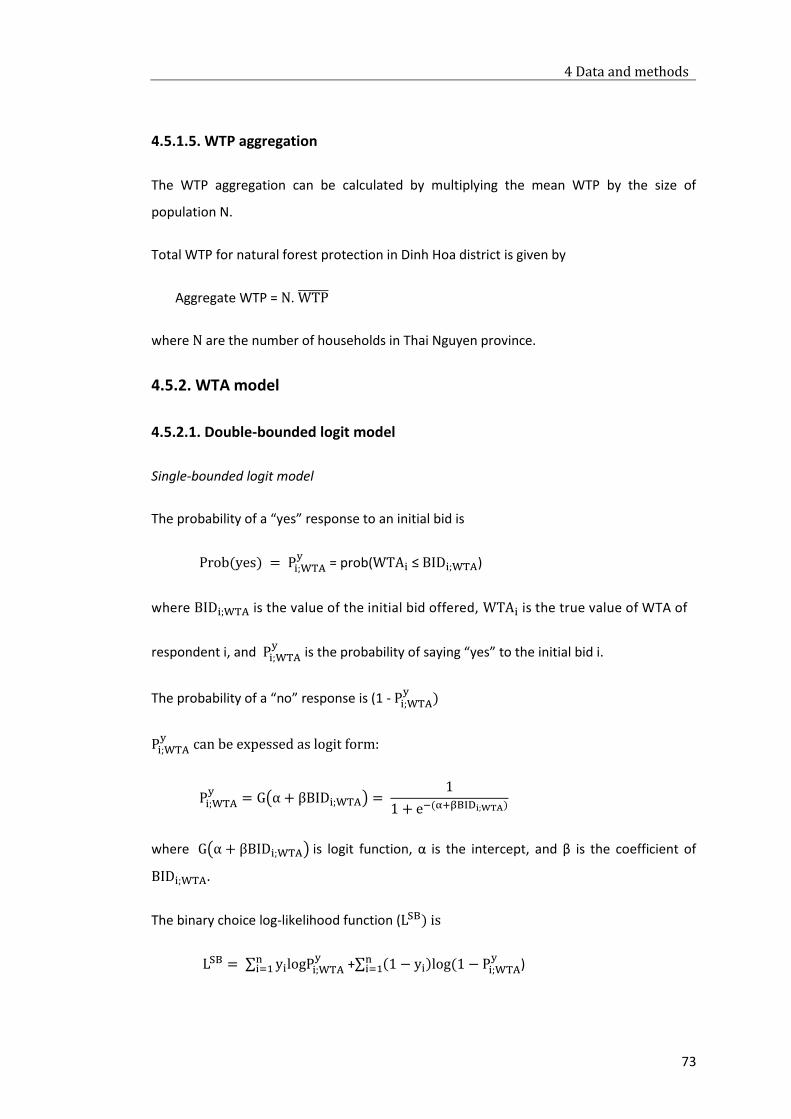
4 Data and methods
73
4.5.1.5. WTP aggregation
The WTP aggregation can be calculated by multiplying the mean WTP by the size of
population N.
Total WTP for natural forest protection in Dinh Hoa district is given by
Aggregate WTP = N. WTP
where N are the number of households in Thai Nguyen province.
4.5.2. WTA model
4.5.2.1. Double-bounded logit model
Single-bounded logit model
The probability of a “yes” response to an initial bid is
Prob(yes) = Pi;WTAy
= prob(WTAi ≤ BIDi;WTA)
where BIDi;WTA is the value of the initial bid offered, WTAi is the true value of WTA of
respondent i, and Pi;WTAy
is the probability of saying “yes” to the initial bid i.
The probability of a “no” response is (1 - Pi;WTAy
)
Pi;WTAy
can be expessed as logit form:
Pi;WTAy
= G(α + βBIDi;WTA) = 1
1 + e−(α+βBIDi;WTA)
where G(α + βBIDi;WTA) is logit function, α is the intercept, and β is the coefficient of
BIDi;WTA.
The binary choice log-likelihood function (LSB) is
LSB = ∑ yilogPi;WTAyn
i=1 +∑ (1 − yi)log (1 − Pi;WTAyn
i=1 )
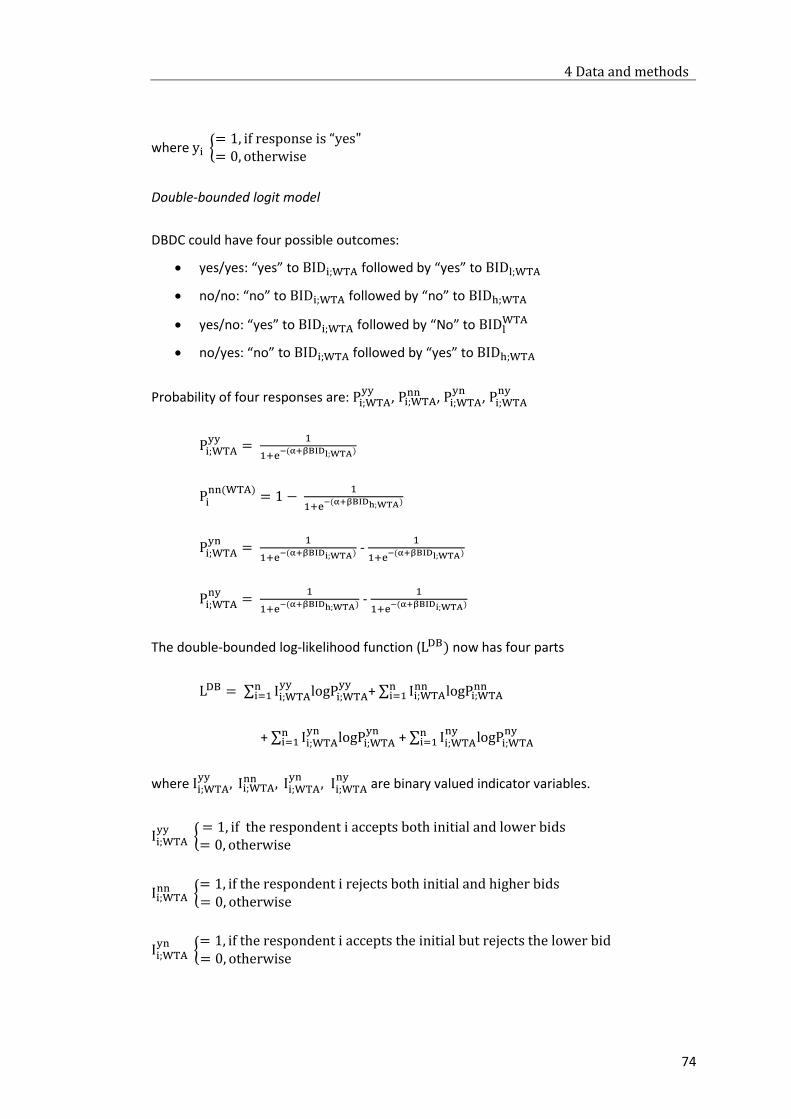
4 Data and methods
74
where yi {= 1, if response is “yes"= 0, otherwise
Double-bounded logit model
DBDC could have four possible outcomes:
yes/yes: “yes” to BIDi;WTA followed by “yes” to BIDl;WTA
no/no: “no” to BIDi;WTA followed by “no” to BIDh;WTA
yes/no: “yes” to BIDi;WTA followed by “No” to BIDlWTA
no/yes: “no” to BIDi;WTA followed by “yes” to BIDh;WTA
Probability of four responses are: Pi;WTAyy
, Pi;WTAnn , Pi;WTA
yn, Pi;WTA
ny
Pi;WTAyy
= 1
1+e−(α+βBIDl;WTA)
Pinn(WTA)
= 1 − 1
1+e−(α+βBIDh;WTA)
Pi;WTAyn
= 1
1+e−(α+βBIDi;WTA) -
1
1+e−(α+βBIDl;WTA)
Pi;WTAny
= 1
1+e−(α+βBIDh;WTA) -
1
1+e−(α+βBIDi;WTA)
The double-bounded log-likelihood function (LDB) now has four parts
LDB = ∑ Ii;WTAyy
logPi;WTAyyn
i=1 + ∑ Ii;WTAnn logPi;WTA
nnni=1
+ ∑ Ii;WTAyn
logPi;WTAynn
i=1 + ∑ Ii;WTAny
logPi;WTAnyn
i=1
where Ii;WTAyy
, Ii;WTAnn , Ii;WTA
yn, Ii;WTA
ny are binary valued indicator variables.
Ii;WTAyy
{= 1, if the respondent i accepts both initial and lower bids = 0, otherwise
Ii;WTAnn {
= 1, if the respondent i rejects both initial and higher bids = 0, otherwise
Ii;WTAyn
{= 1, if the respondent i accepts the initial but rejects the lower bid= 0, otherwise
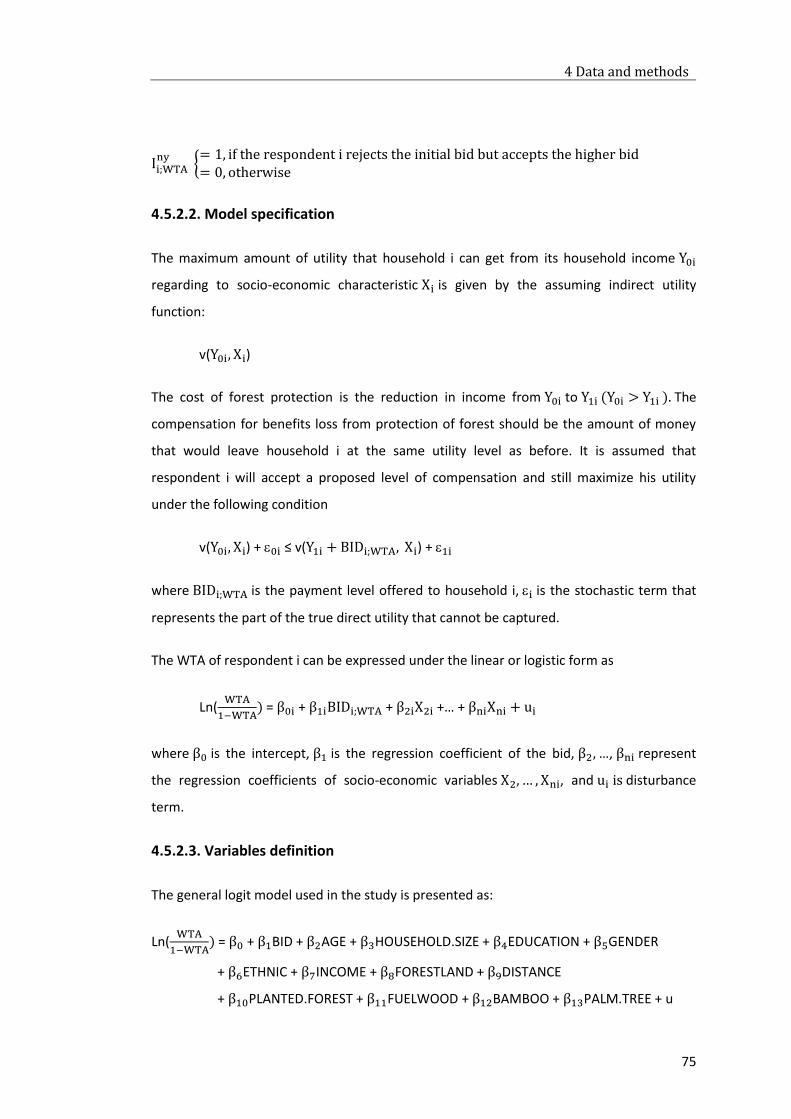
4 Data and methods
75
Ii;WTAny
{= 1, if the respondent i rejects the initial bid but accepts the higher bid= 0, otherwise
4.5.2.2. Model specification
The maximum amount of utility that household i can get from its household income Y0i
regarding to socio-economic characteristic Xi is given by the assuming indirect utility
function:
v(Y0i, Xi)
The cost of forest protection is the reduction in income from Y0i to Y1i (Y0i > Y1i ). The
compensation for benefits loss from protection of forest should be the amount of money
that would leave household i at the same utility level as before. It is assumed that
respondent i will accept a proposed level of compensation and still maximize his utility
under the following condition
v(Y0i, Xi) + 0i ≤ v(Y1i + BIDi;WTA, Xi) + 1i
where BIDi;WTA is the payment level offered to household i, i is the stochastic term that
represents the part of the true direct utility that cannot be captured.
The WTA of respondent i can be expressed under the linear or logistic form as
Ln(WTA
1−WTA) = β0i + β1iBIDi;WTA + β2iX2i +… + βniXni + ui
where β0 is the intercept, β1 is the regression coefficient of the bid, β2, …, βni represent
the regression coefficients of socio-economic variables X2, … , Xni, and ui is disturbance
term.
4.5.2.3. Variables definition
The general logit model used in the study is presented as:
Ln(WTA
1−WTA) = β0 + β1BID + β2AGE + β3HOUSEHOLD.SIZE + β4EDUCATION + β5GENDER
+ β6ETHNIC + β7INCOME + β8FORESTLAND + β9DISTANCE
+ β10PLANTED.FOREST + β11FUELWOOD + β12BAMBOO + β13PALM.TREE + u
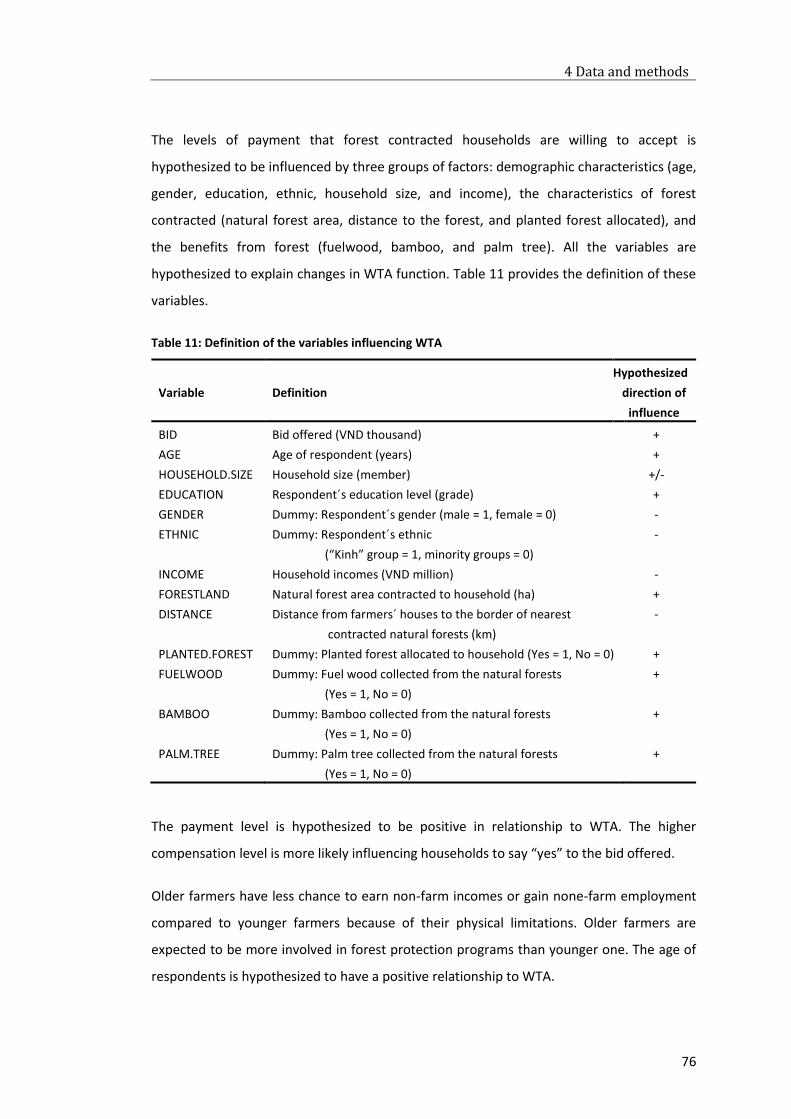
4 Data and methods
76
The levels of payment that forest contracted households are willing to accept is
hypothesized to be influenced by three groups of factors: demographic characteristics (age,
gender, education, ethnic, household size, and income), the characteristics of forest
contracted (natural forest area, distance to the forest, and planted forest allocated), and
the benefits from forest (fuelwood, bamboo, and palm tree). All the variables are
hypothesized to explain changes in WTA function. Table 11 provides the definition of these
variables.
Table 11: Definition of the variables influencing WTA
Variable
Definition
Hypothesized
direction of
influence
BID Bid offered (VND thousand) +
AGE Age of respondent (years) +
HOUSEHOLD.SIZE Household size (member) +/-
EDUCATION Respondent´s education level (grade) +
GENDER Dummy: Respondent´s gender (male = 1, female = 0) -
ETHNIC Dummy: Respondent´s ethnic
(“Kinh” group = 1, minority groups = 0)
-
INCOME Household incomes (VND million) -
FORESTLAND Natural forest area contracted to household (ha) +
DISTANCE Distance from farmers´ houses to the border of nearest
contracted natural forests (km)
-
PLANTED.FOREST Dummy: Planted forest allocated to household (Yes = 1, No = 0) +
FUELWOOD Dummy: Fuel wood collected from the natural forests
(Yes = 1, No = 0)
+
BAMBOO Dummy: Bamboo collected from the natural forests
(Yes = 1, No = 0)
+
PALM.TREE Dummy: Palm tree collected from the natural forests
(Yes = 1, No = 0)
+
The payment level is hypothesized to be positive in relationship to WTA. The higher
compensation level is more likely influencing households to say “yes” to the bid offered.
Older farmers have less chance to earn non-farm incomes or gain none-farm employment
compared to younger farmers because of their physical limitations. Older farmers are
expected to be more involved in forest protection programs than younger one. The age of
respondents is hypothesized to have a positive relationship to WTA.
4 Data and methods
77
Household size can influence WTA by resulting in an increase in potential labor supply that
has an impact on household production and incomes. Respondents with more household
members may earn higher farm and non-farm incomes; they will likely require less
compensation. On the contrary, increasing household size can increase household
consumption demand, hence a higher requirement of payment level for one ha of forest
protection is proposed. The effect of household size on WTA is therefore unpredictable.
Well-educated farmers are expected to have better access to information and to be more
aware of the importance of protecting natural forests. Respondents with higher education
levels are expected to be more willing to accept or require lower payment levels than
respondents with lower education levels. Hence, education level is assumed to have a
positive relationship to WTA.
Gender of respondent is hypothesized to have a negative relationship to WTA. Women are
more likely to accept the compensation than men because of the fact that women have
less opportunity to earn non-farm incomes than men. Besides, men are paid more than
women, i.e. opportunity cost of labor of men is higher than women. The demand by men
for higher compensation levels is predictable.
Individuals from the “Kinh” ethnic group typically live father away from and are less
dependent on forest resources than the other minority groups who live in mountainous
areas and are closer to forests. “Kinh” individuals are assumed to be less WTA or require
higher payment level than other minority ethnic people.
Households with higher incomes are assumed to require higher payment levels because of
the higher opportunity cost of labor. Household income is hypothesized to have a negative
relationship to WTA.
The forest land refers to the total forest land area that households were contracted to
protect. Households contracted larger forest areas have a chance to receive higher
payments than households contracted smaller forest areas, and thus they would be more
willing to accept the compensation levels offered.
The distance from farmers´ houses to the border of forests is an important consideration to
the households. The households, which their houses locate farther away from the forests,
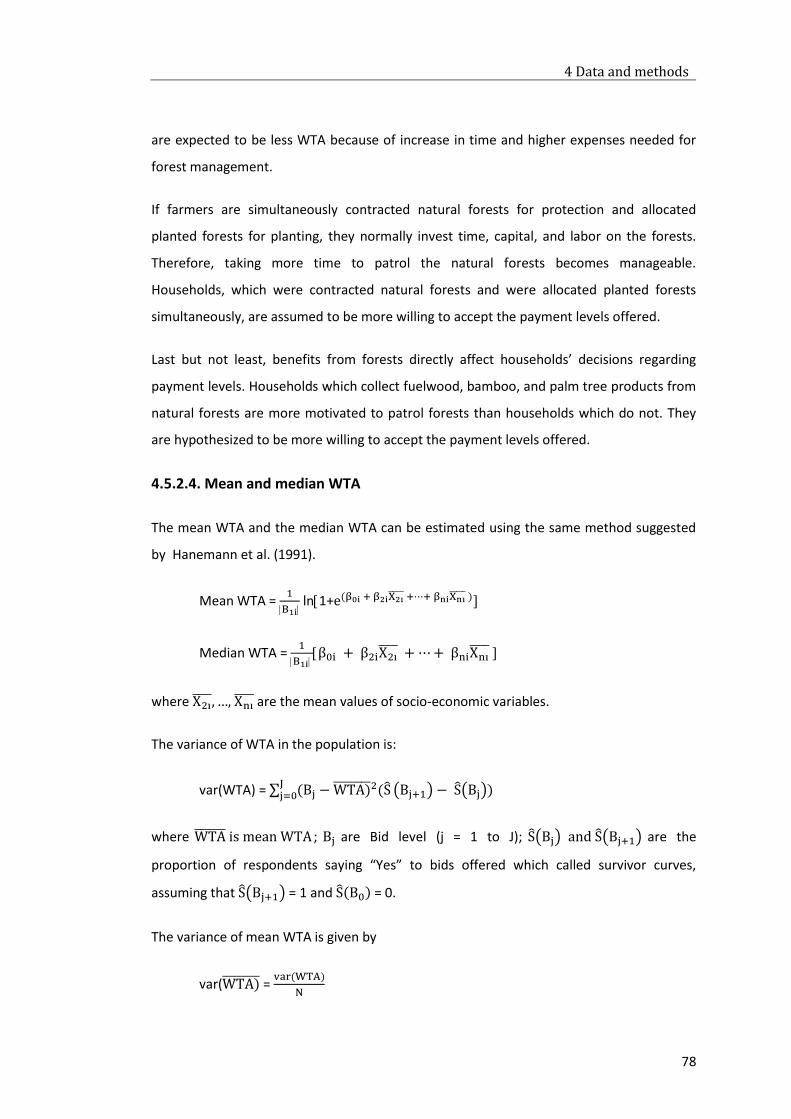
4 Data and methods
78
are expected to be less WTA because of increase in time and higher expenses needed for
forest management.
If farmers are simultaneously contracted natural forests for protection and allocated
planted forests for planting, they normally invest time, capital, and labor on the forests.
Therefore, taking more time to patrol the natural forests becomes manageable.
Households, which were contracted natural forests and were allocated planted forests
simultaneously, are assumed to be more willing to accept the payment levels offered.
Last but not least, benefits from forests directly affect households’ decisions regarding
payment levels. Households which collect fuelwood, bamboo, and palm tree products from
natural forests are more motivated to patrol forests than households which do not. They
are hypothesized to be more willing to accept the payment levels offered.
4.5.2.4. Mean and median WTA
The mean WTA and the median WTA can be estimated using the same method suggested
by Hanemann et al. (1991).
Mean WTA = 1
B1i ln1+e(β0i + β2iX2i +⋯+ βniXni )
Median WTA = 1
B1i β0i + β2iX2i
+ ⋯ + βniXni
where X2i , …, Xni
are the mean values of socio-economic variables.
The variance of WTA in the population is:
var(WTA) = ∑ (Bj − WTA) 2(SJj=0 (Bj+1) − S(Bj))
where WTA is mean WTA ; Bj are Bid level (j = 1 to J); S(Bj) and S(Bj+1) are the
proportion of respondents saying “Yes” to bids offered which called survivor curves,
assuming that S(Bj+1) = 1 and S(B0) = 0.
The variance of mean WTA is given by
var(WTA) = var(WTA)
N
4 Data and methods
79
where N is the sample size.
The 95% confidence interval will be defined by:
WTA – 1.96√var(WTA) and WTA + 1.96√var(WTA)
The variance of the median WTA and its 95% confidence interval are identified using similar
estimation.
4.5.2.5. WTA aggregation
The WTA aggregation can be simply calculated by multiplying mean WTA by the size
population N. Total WTA the compensation for natural forest protection in Dinh Hoa
district is given by
Aggregate WTA =N. WTA
where N are the total ha of natural forest which are contracted to households for
protection in Dinh Hoa district and WTA is the mean value of WTA.
4.5.3. Goodness of fit
To measure the goodness of fit for dichotomous choice model, McFadden’s pseudo R2 is
widely used, which displays how well the variation in the dependent variable can be
explained by the independent variables. R2 can be written as:
R2 = 1- L0
Lmax
where L0 is the log-likelihood in the null case (where all coefficients are assumed equal to
0) and Lmax is the log-likelihood at convergence. Kanninen and Khawaja (1995) proved that
the standard goodness of fit measures for discrete choice models is inappropriate in the
case of the double-bounded logit model. The null hypothesis that all coefficients are equal
to zero implies that the bid value has no impact on the response probability. But, the
conditional nature of the follow-up bid value in the double-bounded format assumes a bid
value effect. To deal with this problem, Herriges (1999) suggested the variant on
McFadden’s pseudo R2

4 Data and methods
80
R2= 1- L0
Lmax
where L0 corresponds to maximum value of L when all slope parameters, except the one
on bid values, are constrained to zero. The restricted likelihood function then is well
defined.
5 Results
81
CHAPTER 5: RESULTS
5.1. WTP survey
5.1.1. Response rate, protest and zero responses
Among 300 responses of the WTP survey, 260 responses (87%) were useable for analysis,
including 92 responses from Thai Nguyen city (urban area) and 168 responses from Phu
Binh district and Dinh Hoa district (rural area). Three protest responses and 37 zero-
responses were eliminated from the sample.
Protest responses
Among respondents of the WTP survey, three respondents protested the program. One
respondent felt that the program was nonsense. The other respondent thought the
program did not relate to him at all. The last respondent revealed that he did not believe
the money would be used for the purpose of forest protection.
Zero responses
Respondents who were in favor of the program but did not agree with any of the two
payment levels were asked for reasons for refusing payments. They were asked if they
would offer any payment by themselves. The follow–up question was: “If you do not agree
with both payment levels offered, what would be the amount that you are willing to pay
for natural forest protection program in Dinh Hoa?”. In cases where respondents offered a
lower payment by themselves, their responses were kept in the final sample. In cases
where respondents refused to provide any amount, their responses were identified as
“zero” payment, and were eliminated from the sample. In the WTP survey, 37 responses
were classified as zero responses. The three most frequent reasons for refusing to pay
were: (1) they cannot afford to pay; (2) they have to pay for many things; and (3) they need
to know the other opinions about the program (Table 12). Several respondents thought
that money alone could not help solve problems and they suspected that their money
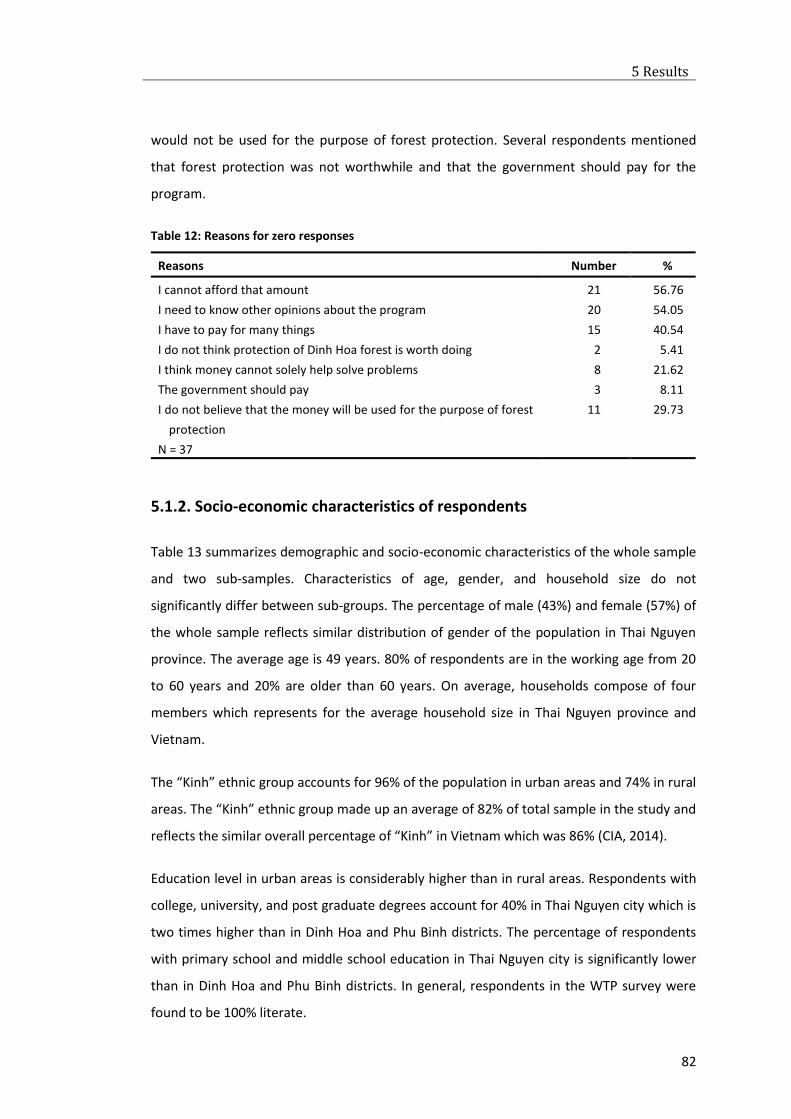
5 Results
82
would not be used for the purpose of forest protection. Several respondents mentioned
that forest protection was not worthwhile and that the government should pay for the
program.
Table 12: Reasons for zero responses
Reasons Number %
I cannot afford that amount 21 56.76
I need to know other opinions about the program 20 54.05
I have to pay for many things 15 40.54
I do not think protection of Dinh Hoa forest is worth doing 2 5.41
I think money cannot solely help solve problems 8 21.62
The government should pay 3 8.11
I do not believe that the money will be used for the purpose of forest
protection
11 29.73
N = 37
5.1.2. Socio-economic characteristics of respondents
Table 13 summarizes demographic and socio-economic characteristics of the whole sample
and two sub-samples. Characteristics of age, gender, and household size do not
significantly differ between sub-groups. The percentage of male (43%) and female (57%) of
the whole sample reflects similar distribution of gender of the population in Thai Nguyen
province. The average age is 49 years. 80% of respondents are in the working age from 20
to 60 years and 20% are older than 60 years. On average, households compose of four
members which represents for the average household size in Thai Nguyen province and
Vietnam.
The “Kinh” ethnic group accounts for 96% of the population in urban areas and 74% in rural
areas. The “Kinh” ethnic group made up an average of 82% of total sample in the study and
reflects the similar overall percentage of “Kinh” in Vietnam which was 86% (CIA, 2014).
Education level in urban areas is considerably higher than in rural areas. Respondents with
college, university, and post graduate degrees account for 40% in Thai Nguyen city which is
two times higher than in Dinh Hoa and Phu Binh districts. The percentage of respondents
with primary school and middle school education in Thai Nguyen city is significantly lower
than in Dinh Hoa and Phu Binh districts. In general, respondents in the WTP survey were
found to be 100% literate.
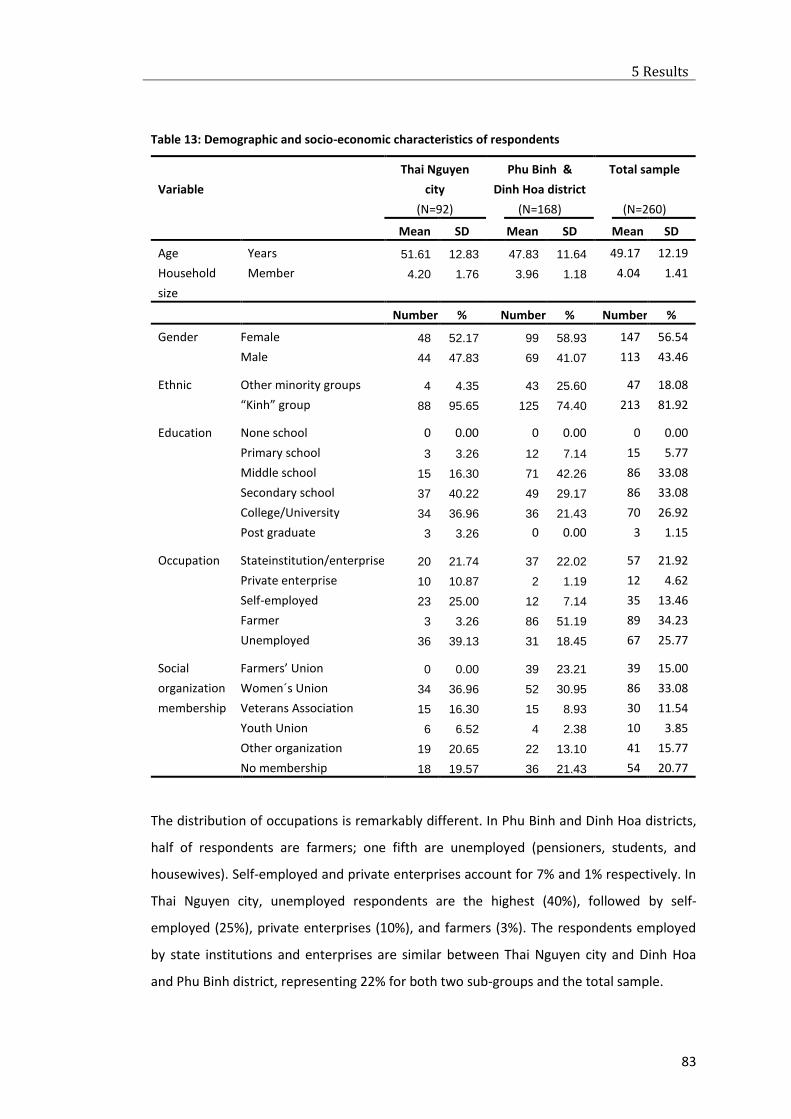
5 Results
83
Table 13: Demographic and socio-economic characteristics of respondents
Variable
Thai Nguyen
city
(N=92)
Phu Binh &
Dinh Hoa district
(N=168)
Total sample
(N=260)
Mean SD Mean SD Mean SD
Age Years 51.61 12.83 47.83 11.64 49.17 12.19
Household
size
Member 4.20
1.76
3.96
1.18
4.04
1.41
Number % Number % Number %
Gender Female 48 52.17 99 58.93 147 56.54
Male 44 47.83 69 41.07 113 43.46
Ethnic Other minority groups 4 4.35 43 25.60 47 18.08
“Kinh” group 88 95.65 125 74.40 213 81.92
Education None school 0 0.00 0 0.00 0 0.00
Primary school 3 3.26 12 7.14 15 5.77
Middle school 15 16.30 71 42.26 86 33.08
Secondary school 37 40.22 49 29.17 86 33.08
College/University 34 36.96 36 21.43 70 26.92
Post graduate 3 3.26 0 0.00 3 1.15
Occupation Stateinstitution/enterprise 20 21.74 37 22.02 57 21.92
Private enterprise 10 10.87 2 1.19 12 4.62
Self-employed 23 25.00 12 7.14 35 13.46
Farmer 3 3.26 86 51.19 89 34.23
Unemployed 36 39.13 31 18.45 67 25.77
Social
organization
membership
Farmers’ Union 0 0.00 39 23.21 39 15.00
Women´s Union 34 36.96 52 30.95 86 33.08
Veterans Association 15 16.30 15 8.93 30 11.54
Youth Union 6 6.52 4 2.38 10 3.85
Other organization 19 20.65 22 13.10 41 15.77
No membership 18 19.57 36 21.43 54 20.77
The distribution of occupations is remarkably different. In Phu Binh and Dinh Hoa districts,
half of respondents are farmers; one fifth are unemployed (pensioners, students, and
housewives). Self-employed and private enterprises account for 7% and 1% respectively. In
Thai Nguyen city, unemployed respondents are the highest (40%), followed by self-
employed (25%), private enterprises (10%), and farmers (3%). The respondents employed
by state institutions and enterprises are similar between Thai Nguyen city and Dinh Hoa
and Phu Binh district, representing 22% for both two sub-groups and the total sample.
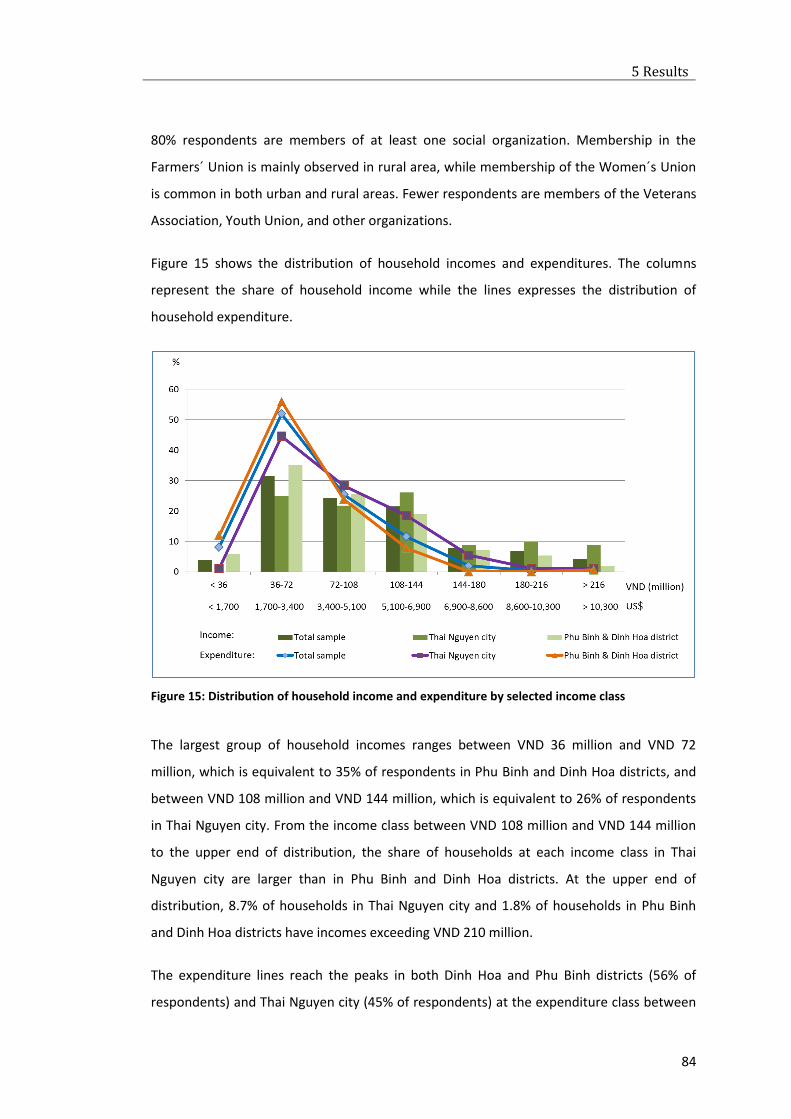
5 Results
84
80% respondents are members of at least one social organization. Membership in the
Farmers´ Union is mainly observed in rural area, while membership of the Women´s Union
is common in both urban and rural areas. Fewer respondents are members of the Veterans
Association, Youth Union, and other organizations.
Figure 15 shows the distribution of household incomes and expenditures. The columns
represent the share of household income while the lines expresses the distribution of
household expenditure.
Figure 15: Distribution of household income and expenditure by selected income class
The largest group of household incomes ranges between VND 36 million and VND 72
million, which is equivalent to 35% of respondents in Phu Binh and Dinh Hoa districts, and
between VND 108 million and VND 144 million, which is equivalent to 26% of respondents
in Thai Nguyen city. From the income class between VND 108 million and VND 144 million
to the upper end of distribution, the share of households at each income class in Thai
Nguyen city are larger than in Phu Binh and Dinh Hoa districts. At the upper end of
distribution, 8.7% of households in Thai Nguyen city and 1.8% of households in Phu Binh
and Dinh Hoa districts have incomes exceeding VND 210 million.
The expenditure lines reach the peaks in both Dinh Hoa and Phu Binh districts (56% of
respondents) and Thai Nguyen city (45% of respondents) at the expenditure class between

5 Results
85
VND 36 million and VND 72 million. After the highest points to the end of expenditure lines,
households in Phu Binh and Dinh Hoa districts have smaller shares than in Thai Nguyen city
at each expenditure class.
The average household income and expenditure is displayed in Table 14. Households in
Thai Nguyen city earn average incomes from VND 120 million to VND 132 million, while
households in Phu Binh and Dinh Hoa districts earn from VND 84 million to VND 96 million.
On average, expenditure ranged from VND 84 million to VND 96 million in Thai Nguyen city,
VND 60 million to VND 72 million in Dinh Hoa and Phu Binh districts, and VND 72 million to
VND 84 million for total sample. These findings are found to be similar to average
household income in Thai Nguyen province which is VND 67 million VND (VND 97 million in
urban areas and VND 56 million in rural areas) (TSO, 2012). This similarity allows a reliable
extrapolation of WTP from the sample to the population of interest.
Table 14: Average household income and expenditure
Unit Phu Binh & Dinh Hoa
district
Thai Nguyen city Total sample
Income: VND (million) 84 - 96 120 - 132 96 - 108
US$ 4,000-4,600 5,700-6,300 4,600-5,100
Expenditure: VND (million) 60 - 72 84 - 96 72 – 84
US$ 2,900-3,400 4,000-4,600 3,400-4,000
Regarding income changes, 59% households noticed that their incomes increased slightly
compared to previous years, 11% indicated a decrease, and the remaining households
experienced no change. 45% of households stated that their household incomes were
sufficient for daily expenses; 20% expressed that it covered expenses for food only; and
11% had a surplus. 49% of the respondents contributed more than 50% of the total
household incomes.
With respect to living facilities, all households have access to electricity, health care
services, schools, and communication media (radio, television). Approximately 50% of the
respondents use clean drinking water; 50% have a refrigerator, a laptop, and a washing
machine; 96% own motorbikes, 87% use gas for cooking; 20% have air conditioning; 97%
have a cellphone; and 7% own an automobile. These numbers suggest that respondents in
the sample have average living standards, and thus are reasonably representative for the
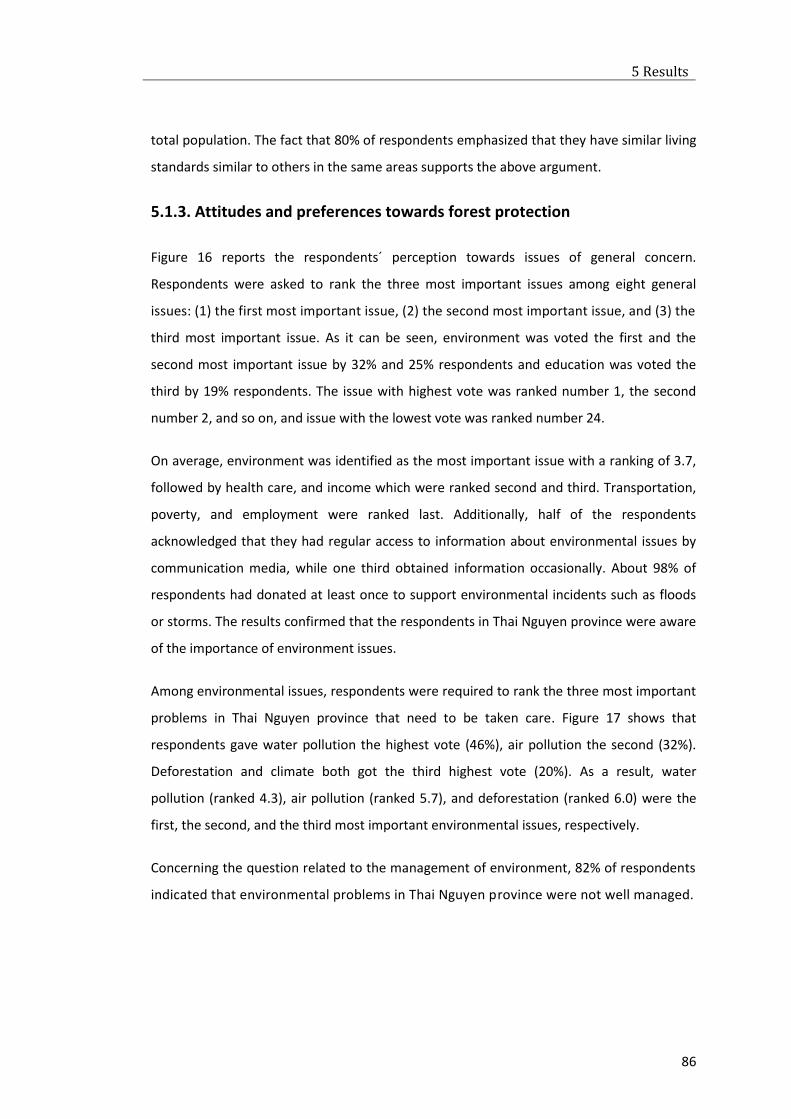
5 Results
86
total population. The fact that 80% of respondents emphasized that they have similar living
standards similar to others in the same areas supports the above argument.
5.1.3. Attitudes and preferences towards forest protection
Figure 16 reports the respondents´ perception towards issues of general concern.
Respondents were asked to rank the three most important issues among eight general
issues: (1) the first most important issue, (2) the second most important issue, and (3) the
third most important issue. As it can be seen, environment was voted the first and the
second most important issue by 32% and 25% respondents and education was voted the
third by 19% respondents. The issue with highest vote was ranked number 1, the second
number 2, and so on, and issue with the lowest vote was ranked number 24.
On average, environment was identified as the most important issue with a ranking of 3.7,
followed by health care, and income which were ranked second and third. Transportation,
poverty, and employment were ranked last. Additionally, half of the respondents
acknowledged that they had regular access to information about environmental issues by
communication media, while one third obtained information occasionally. About 98% of
respondents had donated at least once to support environmental incidents such as floods
or storms. The results confirmed that the respondents in Thai Nguyen province were aware
of the importance of environment issues.
Among environmental issues, respondents were required to rank the three most important
problems in Thai Nguyen province that need to be taken care. Figure 17 shows that
respondents gave water pollution the highest vote (46%), air pollution the second (32%).
Deforestation and climate both got the third highest vote (20%). As a result, water
pollution (ranked 4.3), air pollution (ranked 5.7), and deforestation (ranked 6.0) were the
first, the second, and the third most important environmental issues, respectively.
Concerning the question related to the management of environment, 82% of respondents
indicated that environmental problems in Thai Nguyen province were not well managed.
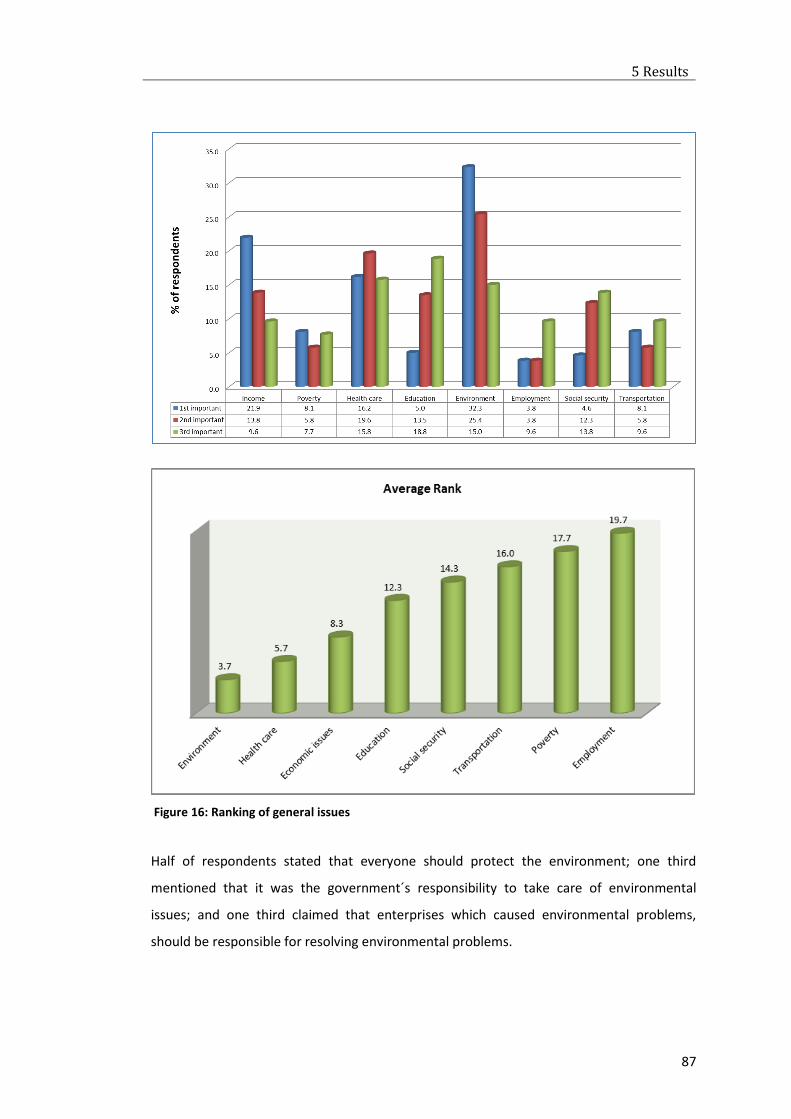
5 Results
87
Figure 16: Ranking of general issues
Half of respondents stated that everyone should protect the environment; one third
mentioned that it was the government´s responsibility to take care of environmental
issues; and one third claimed that enterprises which caused environmental problems,
should be responsible for resolving environmental problems.
5 Results
88
Figure 17: Ranking of important environmental issues
Regarding benefits provided by forests to humans, 41% of respondents voted hydrological
services the first, 26% voted hydrological services and carbon sequestration the second,
and 27% voted carbon sequestration the third most important functions. On average,
carbon sequestration (ranked 4.3), hydrological services (ranked 5.0), and drought and
flood prevention (ranked 6.3) were the first, second, and third most important functions
(Figure 18).
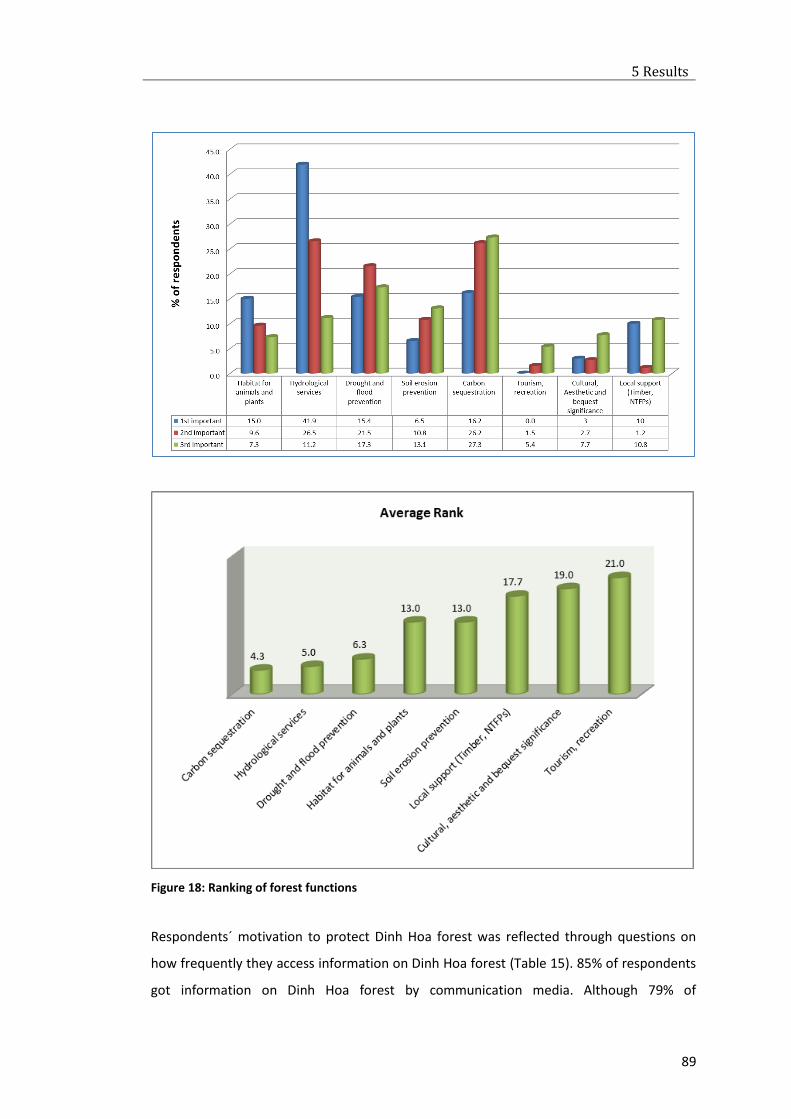
5 Results
89
Figure 18: Ranking of forest functions
Respondents´ motivation to protect Dinh Hoa forest was reflected through questions on
how frequently they access information on Dinh Hoa forest (Table 15). 85% of respondents
got information on Dinh Hoa forest by communication media. Although 79% of
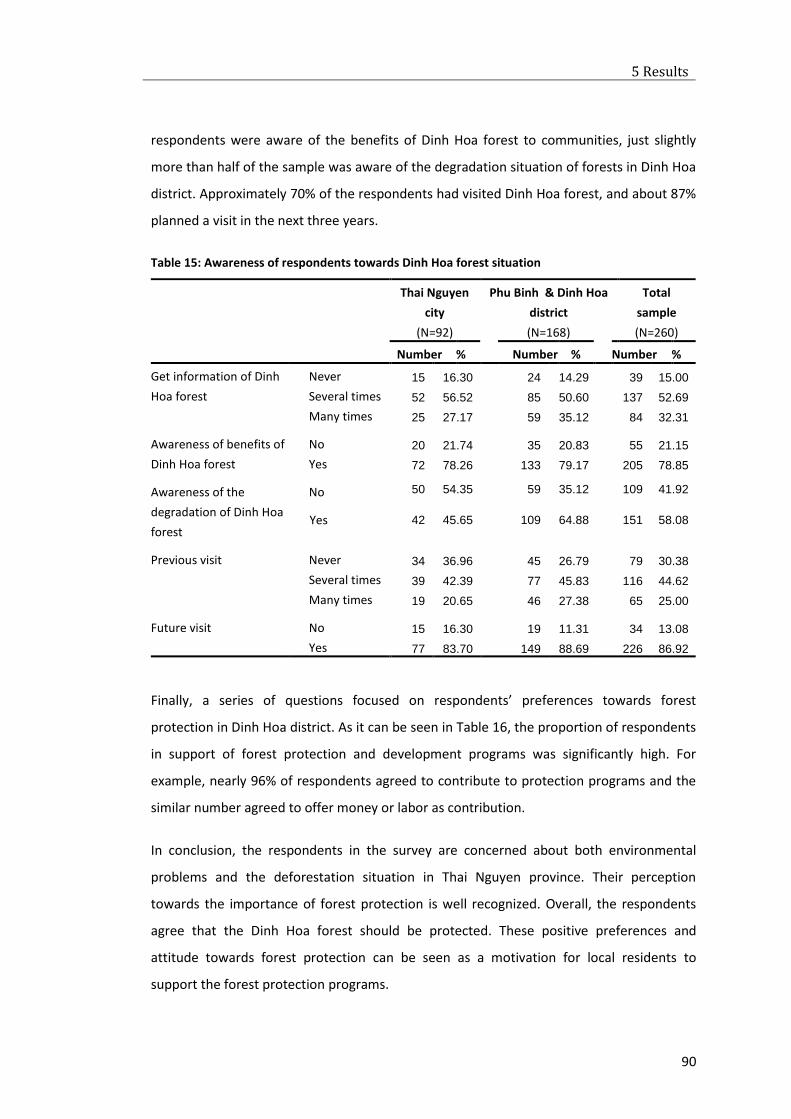
5 Results
90
respondents were aware of the benefits of Dinh Hoa forest to communities, just slightly
more than half of the sample was aware of the degradation situation of forests in Dinh Hoa
district. Approximately 70% of the respondents had visited Dinh Hoa forest, and about 87%
planned a visit in the next three years.
Table 15: Awareness of respondents towards Dinh Hoa forest situation
Thai Nguyen
city
(N=92)
Phu Binh & Dinh Hoa
district
(N=168)
Total
sample
(N=260)
Number % Number % Number %
Get information of Dinh
Hoa forest
Never 15 16.30 24 14.29 39 15.00
Several times 52 56.52 85 50.60 137 52.69
Many times 25 27.17 59 35.12 84 32.31
Awareness of benefits of
Dinh Hoa forest
No 20 21.74 35 20.83 55 21.15
Yes 72 78.26 133 79.17 205 78.85
Awareness of the
degradation of Dinh Hoa
forest
No 50 54.35 59 35.12 109 41.92
Yes 42 45.65 109 64.88 151 58.08
Previous visit Never 34 36.96 45 26.79 79 30.38
Several times 39 42.39 77 45.83 116 44.62
Many times 19 20.65 46 27.38 65 25.00
Future visit No 15 16.30 19 11.31 34 13.08
Yes 77 83.70 149 88.69 226 86.92
Finally, a series of questions focused on respondents’ preferences towards forest
protection in Dinh Hoa district. As it can be seen in Table 16, the proportion of respondents
in support of forest protection and development programs was significantly high. For
example, nearly 96% of respondents agreed to contribute to protection programs and the
similar number agreed to offer money or labor as contribution.
In conclusion, the respondents in the survey are concerned about both environmental
problems and the deforestation situation in Thai Nguyen province. Their perception
towards the importance of forest protection is well recognized. Overall, the respondents
agree that the Dinh Hoa forest should be protected. These positive preferences and
attitude towards forest protection can be seen as a motivation for local residents to
support the forest protection programs.
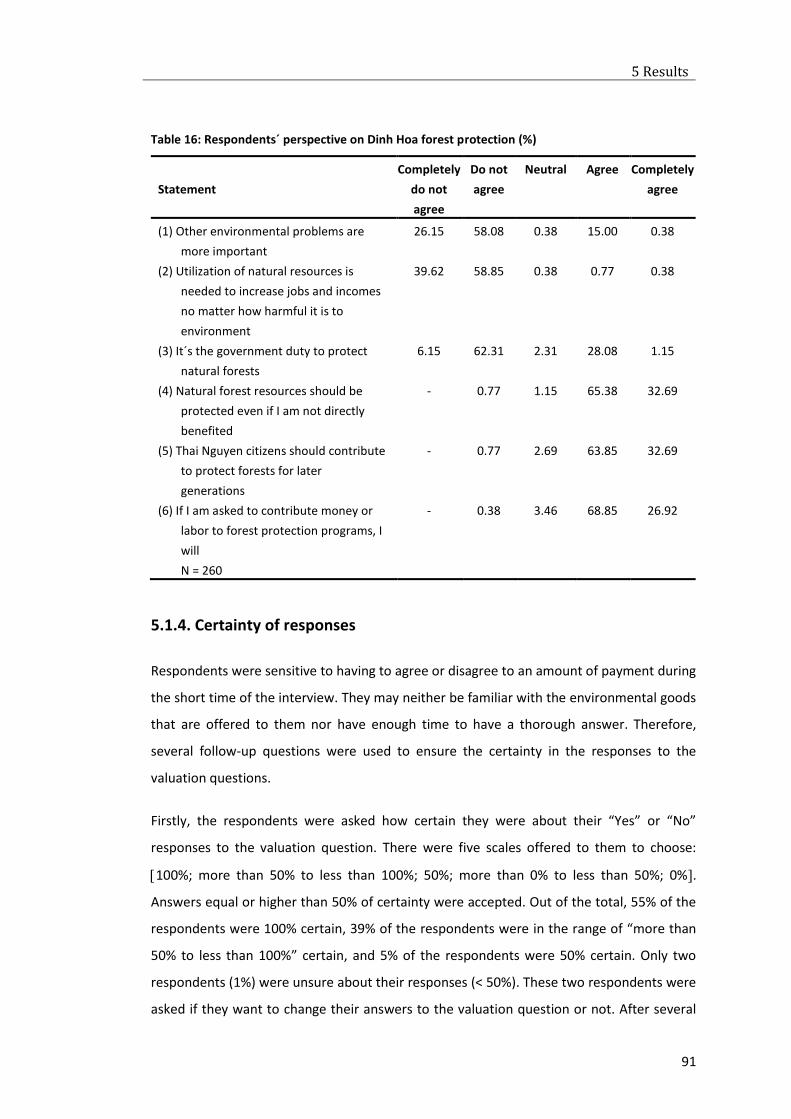
5 Results
91
Table 16: Respondents´ perspective on Dinh Hoa forest protection (%)
Statement
Completely
do not
agree
Do not
agree
Neutral
Agree
Completely
agree
(1) Other environmental problems are
more important
26.15 58.08 0.38 15.00 0.38
(2) Utilization of natural resources is
needed to increase jobs and incomes
no matter how harmful it is to
environment
39.62 58.85 0.38 0.77 0.38
(3) It´s the government duty to protect
natural forests
6.15 62.31 2.31 28.08 1.15
(4) Natural forest resources should be
protected even if I am not directly
benefited
- 0.77 1.15 65.38 32.69
(5) Thai Nguyen citizens should contribute
to protect forests for later
generations
- 0.77 2.69 63.85 32.69
(6) If I am asked to contribute money or
labor to forest protection programs, I
will
- 0.38 3.46 68.85 26.92
N = 260
5.1.4. Certainty of responses
Respondents were sensitive to having to agree or disagree to an amount of payment during
the short time of the interview. They may neither be familiar with the environmental goods
that are offered to them nor have enough time to have a thorough answer. Therefore,
several follow-up questions were used to ensure the certainty in the responses to the
valuation questions.
Firstly, the respondents were asked how certain they were about their “Yes” or “No”
responses to the valuation question. There were five scales offered to them to choose:
100%; more than 50% to less than 100%; 50%; more than 0% to less than 50%; 0%.
Answers equal or higher than 50% of certainty were accepted. Out of the total, 55% of the
respondents were 100% certain, 39% of the respondents were in the range of “more than
50% to less than 100%” certain, and 5% of the respondents were 50% certain. Only two
respondents (1%) were unsure about their responses (< 50%). These two respondents were
asked if they want to change their answers to the valuation question or not. After several
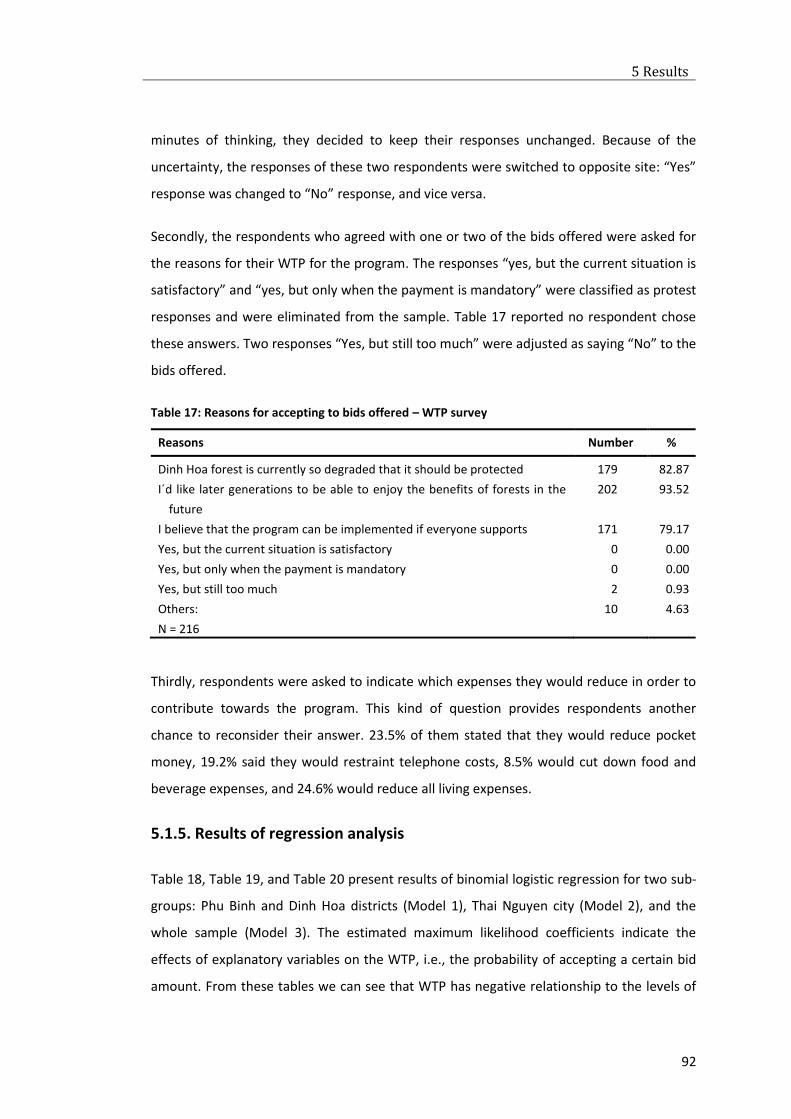
5 Results
92
minutes of thinking, they decided to keep their responses unchanged. Because of the
uncertainty, the responses of these two respondents were switched to opposite site: “Yes”
response was changed to “No” response, and vice versa.
Secondly, the respondents who agreed with one or two of the bids offered were asked for
the reasons for their WTP for the program. The responses “yes, but the current situation is
satisfactory” and “yes, but only when the payment is mandatory” were classified as protest
responses and were eliminated from the sample. Table 17 reported no respondent chose
these answers. Two responses “Yes, but still too much” were adjusted as saying “No” to the
bids offered.
Table 17: Reasons for accepting to bids offered – WTP survey
Reasons Number %
Dinh Hoa forest is currently so degraded that it should be protected 179 82.87
I´d like later generations to be able to enjoy the benefits of forests in the
future
202 93.52
I believe that the program can be implemented if everyone supports 171 79.17
Yes, but the current situation is satisfactory 0 0.00
Yes, but only when the payment is mandatory 0 0.00
Yes, but still too much 2 0.93
Others: 10 4.63
N = 216
Thirdly, respondents were asked to indicate which expenses they would reduce in order to
contribute towards the program. This kind of question provides respondents another
chance to reconsider their answer. 23.5% of them stated that they would reduce pocket
money, 19.2% said they would restraint telephone costs, 8.5% would cut down food and
beverage expenses, and 24.6% would reduce all living expenses.
5.1.5. Results of regression analysis
Table 18, Table 19, and Table 20 present results of binomial logistic regression for two sub-
groups: Phu Binh and Dinh Hoa districts (Model 1), Thai Nguyen city (Model 2), and the
whole sample (Model 3). The estimated maximum likelihood coefficients indicate the
effects of explanatory variables on the WTP, i.e., the probability of accepting a certain bid
amount. From these tables we can see that WTP has negative relationship to the levels of
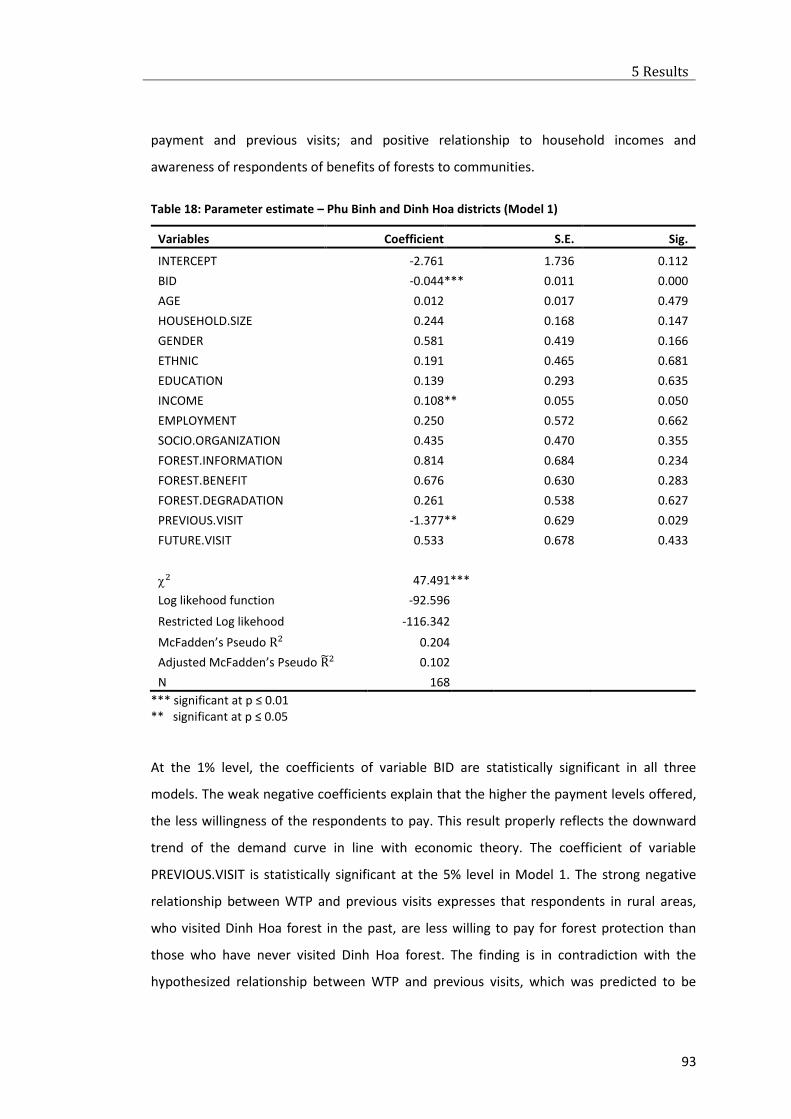
5 Results
93
payment and previous visits; and positive relationship to household incomes and
awareness of respondents of benefits of forests to communities.
Table 18: Parameter estimate – Phu Binh and Dinh Hoa districts (Model 1)
Variables Coefficient S.E. Sig.
INTERCEPT -2.761 1.736 0.112
BID -0.044 *** 0.011 0.000
AGE 0.012 0.017 0.479
HOUSEHOLD.SIZE 0.244 0.168 0.147
GENDER 0.581 0.419 0.166
ETHNIC 0.191 0.465 0.681
EDUCATION 0.139 0.293 0.635
INCOME 0.108 ** 0.055 0.050
EMPLOYMENT 0.250 0.572 0.662
SOCIO.ORGANIZATION 0.435 0.470 0.355
FOREST.INFORMATION 0.814 0.684 0.234
FOREST.BENEFIT 0.676 0.630 0.283
FOREST.DEGRADATION 0.261 0.538 0.627
PREVIOUS.VISIT -1.377 ** 0.629 0.029
FUTURE.VISIT 0.533 0.678 0.433
2 47.491 ***
Log likehood function -92.596
Restricted Log likehood -116.342
McFadden’s Pseudo R2 0.204
Adjusted McFadden’s Pseudo R2 0.102
N 168
*** significant at p ≤ 0.01 ** significant at p ≤ 0.05
At the 1% level, the coefficients of variable BID are statistically significant in all three
models. The weak negative coefficients explain that the higher the payment levels offered,
the less willingness of the respondents to pay. This result properly reflects the downward
trend of the demand curve in line with economic theory. The coefficient of variable
PREVIOUS.VISIT is statistically significant at the 5% level in Model 1. The strong negative
relationship between WTP and previous visits expresses that respondents in rural areas,
who visited Dinh Hoa forest in the past, are less willing to pay for forest protection than
those who have never visited Dinh Hoa forest. The finding is in contradiction with the
hypothesized relationship between WTP and previous visits, which was predicted to be
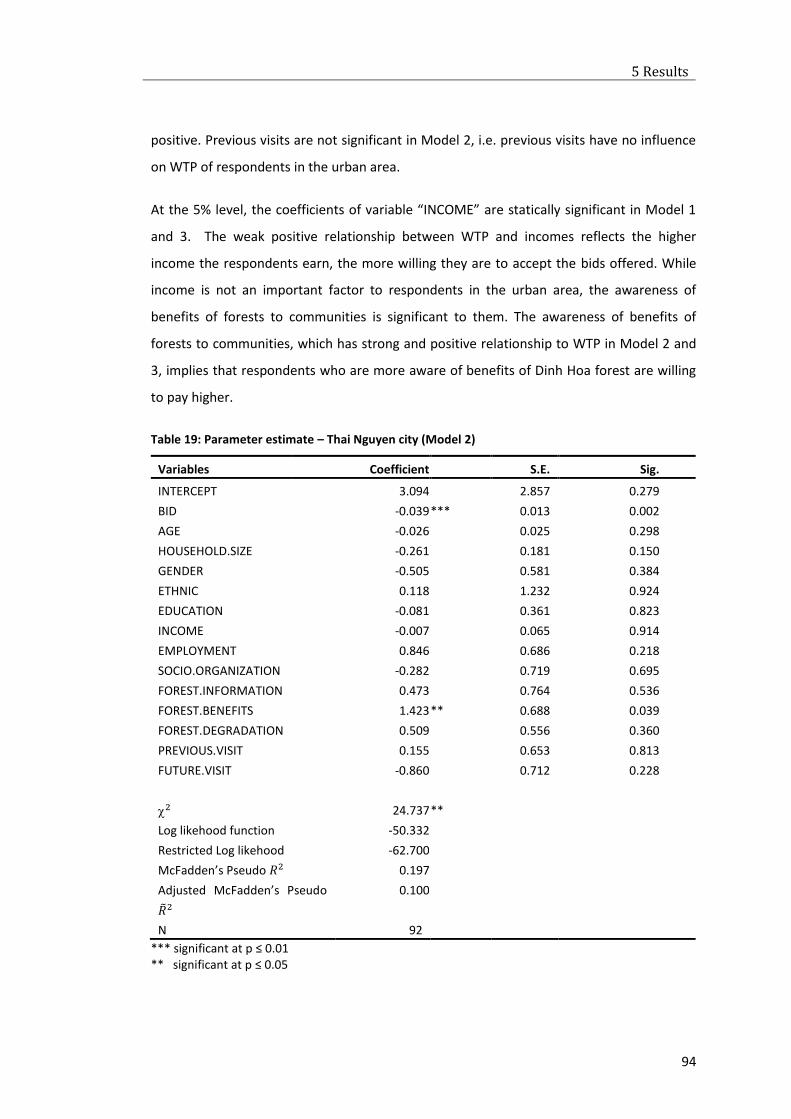
5 Results
94
positive. Previous visits are not significant in Model 2, i.e. previous visits have no influence
on WTP of respondents in the urban area.
At the 5% level, the coefficients of variable “INCOME” are statically significant in Model 1
and 3. The weak positive relationship between WTP and incomes reflects the higher
income the respondents earn, the more willing they are to accept the bids offered. While
income is not an important factor to respondents in the urban area, the awareness of
benefits of forests to communities is significant to them. The awareness of benefits of
forests to communities, which has strong and positive relationship to WTP in Model 2 and
3, implies that respondents who are more aware of benefits of Dinh Hoa forest are willing
to pay higher.
Table 19: Parameter estimate – Thai Nguyen city (Model 2)
Variables Coefficient S.E. Sig.
INTERCEPT 3.094 2.857 0.279
BID -0.039 *** 0.013 0.002
AGE -0.026 0.025 0.298
HOUSEHOLD.SIZE -0.261 0.181 0.150
GENDER -0.505 0.581 0.384
ETHNIC 0.118 1.232 0.924
EDUCATION -0.081 0.361 0.823
INCOME -0.007 0.065 0.914
EMPLOYMENT 0.846 0.686 0.218
SOCIO.ORGANIZATION -0.282 0.719 0.695
FOREST.INFORMATION 0.473 0.764 0.536
FOREST.BENEFITS 1.423 ** 0.688 0.039
FOREST.DEGRADATION 0.509 0.556 0.360
PREVIOUS.VISIT 0.155 0.653 0.813
FUTURE.VISIT -0.860 0.712 0.228
2 24.737 **
Log likehood function -50.332
Restricted Log likehood -62.700
McFadden’s Pseudo 𝑅2 0.197
Adjusted McFadden’s Pseudo
��2
0.100
N 92
*** significant at p ≤ 0.01 ** significant at p ≤ 0.05
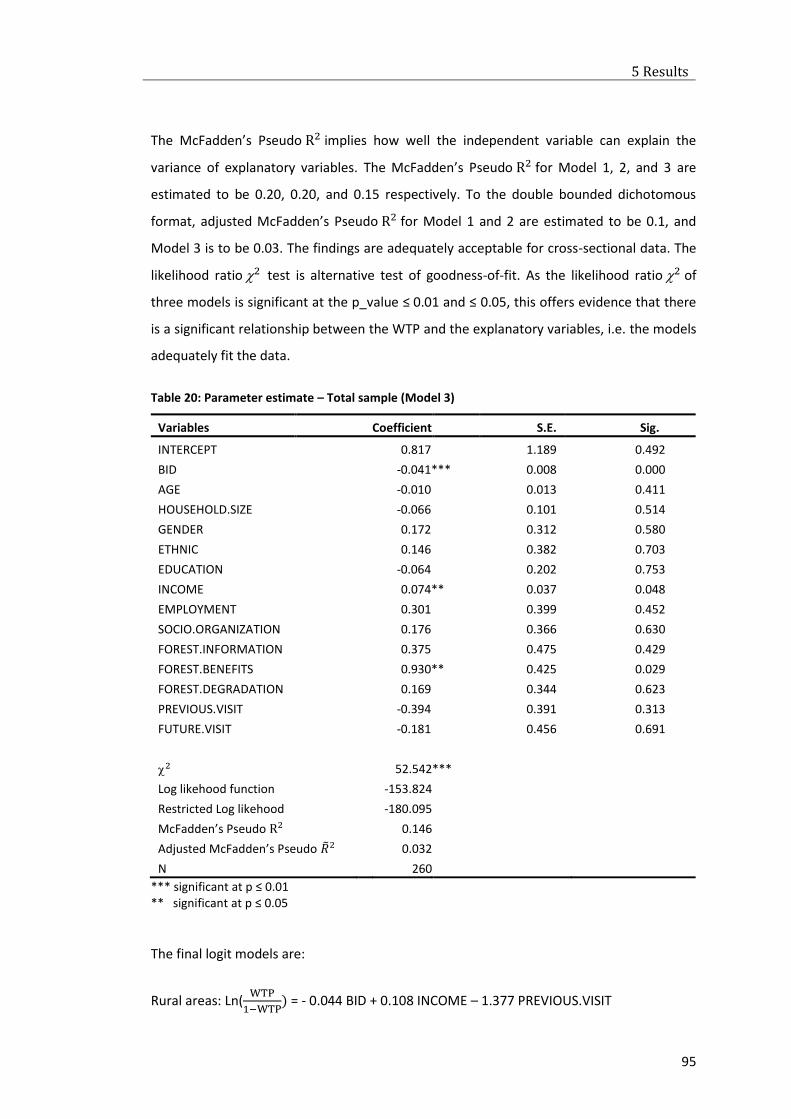
5 Results
95
The McFadden’s Pseudo R2 implies how well the independent variable can explain the
variance of explanatory variables. The McFadden’s Pseudo R2 for Model 1, 2, and 3 are
estimated to be 0.20, 0.20, and 0.15 respectively. To the double bounded dichotomous
format, adjusted McFadden’s Pseudo R2 for Model 1 and 2 are estimated to be 0.1, and
Model 3 is to be 0.03. The findings are adequately acceptable for cross-sectional data. The
likelihood ratio 2 test is alternative test of goodness-of-fit. As the likelihood ratio 2 of
three models is significant at the p_value ≤ 0.01 and ≤ 0.05, this offers evidence that there
is a significant relationship between the WTP and the explanatory variables, i.e. the models
adequately fit the data.
Table 20: Parameter estimate – Total sample (Model 3)
Variables Coefficient S.E. Sig.
INTERCEPT 0.817 1.189 0.492
BID -0.041 *** 0.008 0.000
AGE -0.010 0.013 0.411
HOUSEHOLD.SIZE -0.066 0.101 0.514
GENDER 0.172 0.312 0.580
ETHNIC 0.146 0.382 0.703
EDUCATION -0.064 0.202 0.753
INCOME 0.074 ** 0.037 0.048
EMPLOYMENT 0.301 0.399 0.452
SOCIO.ORGANIZATION 0.176 0.366 0.630
FOREST.INFORMATION 0.375 0.475 0.429
FOREST.BENEFITS 0.930 ** 0.425 0.029
FOREST.DEGRADATION 0.169 0.344 0.623
PREVIOUS.VISIT -0.394 0.391 0.313
FUTURE.VISIT -0.181 0.456 0.691
2 52.542 ***
Log likehood function -153.824
Restricted Log likehood -180.095
McFadden’s Pseudo R2 0.146
Adjusted McFadden’s Pseudo ��2 0.032
N 260
*** significant at p ≤ 0.01 ** significant at p ≤ 0.05
The final logit models are:
Rural areas: Ln(WTP
1−WTP) = - 0.044 BID + 0.108 INCOME – 1.377 PREVIOUS.VISIT
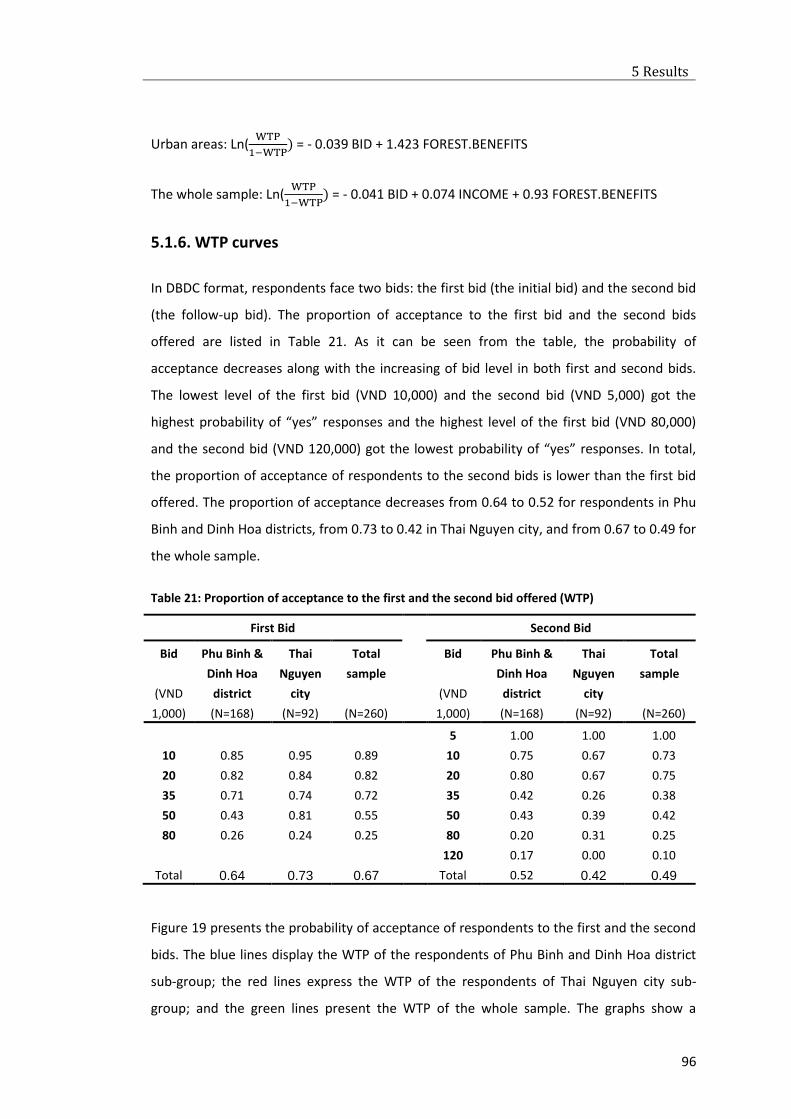
5 Results
96
Urban areas: Ln(WTP
1−WTP) = - 0.039 BID + 1.423 FOREST.BENEFITS
The whole sample: Ln(WTP
1−WTP) = - 0.041 BID + 0.074 INCOME + 0.93 FOREST.BENEFITS
5.1.6. WTP curves
In DBDC format, respondents face two bids: the first bid (the initial bid) and the second bid
(the follow-up bid). The proportion of acceptance to the first bid and the second bids
offered are listed in Table 21. As it can be seen from the table, the probability of
acceptance decreases along with the increasing of bid level in both first and second bids.
The lowest level of the first bid (VND 10,000) and the second bid (VND 5,000) got the
highest probability of “yes” responses and the highest level of the first bid (VND 80,000)
and the second bid (VND 120,000) got the lowest probability of “yes” responses. In total,
the proportion of acceptance of respondents to the second bids is lower than the first bid
offered. The proportion of acceptance decreases from 0.64 to 0.52 for respondents in Phu
Binh and Dinh Hoa districts, from 0.73 to 0.42 in Thai Nguyen city, and from 0.67 to 0.49 for
the whole sample.
Table 21: Proportion of acceptance to the first and the second bid offered (WTP)
First Bid Second Bid
Bid
(VND
1,000)
Phu Binh &
Dinh Hoa
district
(N=168)
Thai
Nguyen
city
(N=92)
Total
sample
(N=260)
Bid
(VND
1,000)
Phu Binh &
Dinh Hoa
district
(N=168)
Thai
Nguyen
city
(N=92)
Total
sample
(N=260)
5 1.00 1.00 1.00
10 0.85 0.95 0.89 10 0.75 0.67 0.73
20 0.82 0.84 0.82 20 0.80 0.67 0.75
35 0.71 0.74 0.72 35 0.42 0.26 0.38
50 0.43 0.81 0.55 50 0.43 0.39 0.42
80 0.26 0.24 0.25 80 0.20 0.31 0.25
120 0.17 0.00 0.10
Total 0.64 0.73 0.67 Total 0.52 0.42 0.49
Figure 19 presents the probability of acceptance of respondents to the first and the second
bids. The blue lines display the WTP of the respondents of Phu Binh and Dinh Hoa district
sub-group; the red lines express the WTP of the respondents of Thai Nguyen city sub-
group; and the green lines present the WTP of the whole sample. The graphs show a
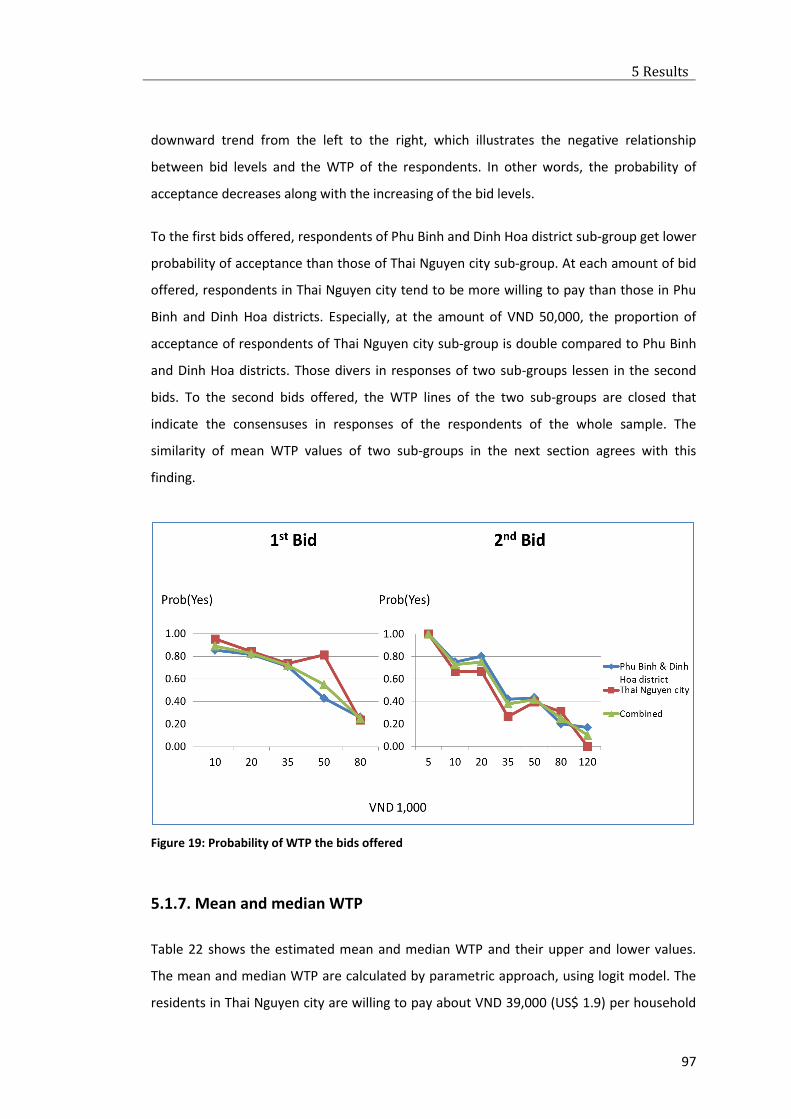
5 Results
97
downward trend from the left to the right, which illustrates the negative relationship
between bid levels and the WTP of the respondents. In other words, the probability of
acceptance decreases along with the increasing of the bid levels.
To the first bids offered, respondents of Phu Binh and Dinh Hoa district sub-group get lower
probability of acceptance than those of Thai Nguyen city sub-group. At each amount of bid
offered, respondents in Thai Nguyen city tend to be more willing to pay than those in Phu
Binh and Dinh Hoa districts. Especially, at the amount of VND 50,000, the proportion of
acceptance of respondents of Thai Nguyen city sub-group is double compared to Phu Binh
and Dinh Hoa districts. Those divers in responses of two sub-groups lessen in the second
bids. To the second bids offered, the WTP lines of the two sub-groups are closed that
indicate the consensuses in responses of the respondents of the whole sample. The
similarity of mean WTP values of two sub-groups in the next section agrees with this
finding.
Figure 19: Probability of WTP the bids offered
5.1.7. Mean and median WTP
Table 22 shows the estimated mean and median WTP and their upper and lower values.
The mean and median WTP are calculated by parametric approach, using logit model. The
residents in Thai Nguyen city are willing to pay about VND 39,000 (US$ 1.9) per household
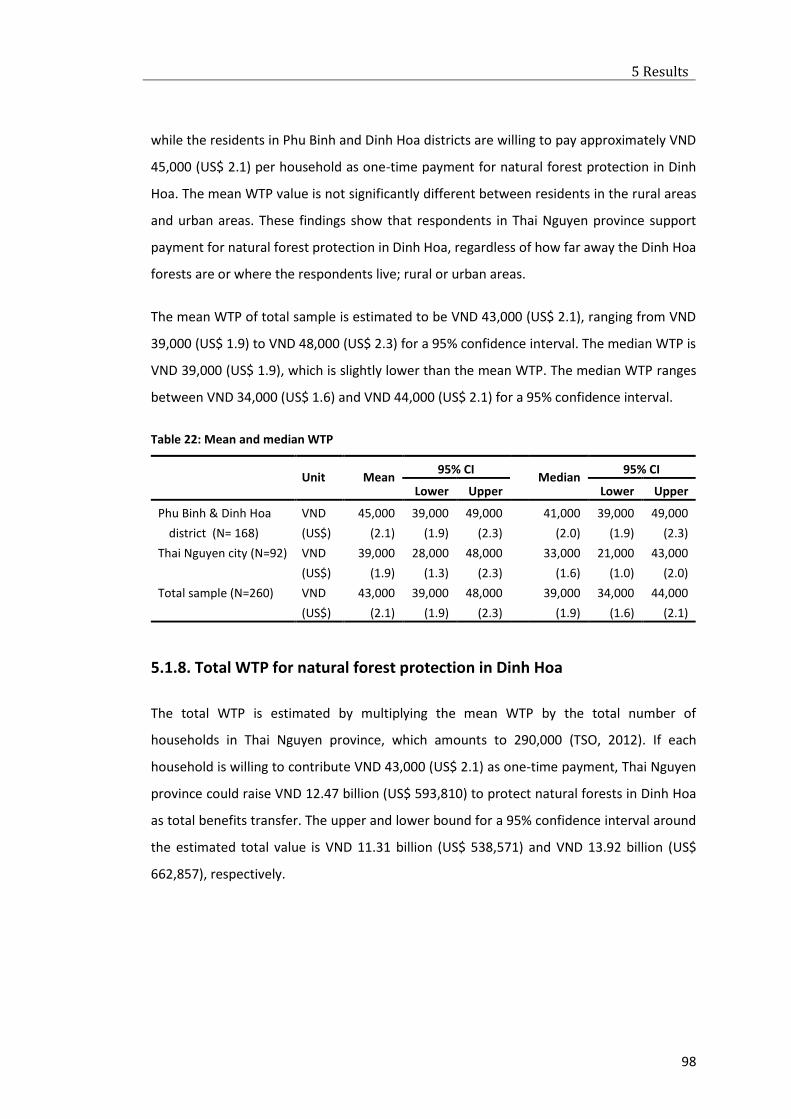
5 Results
98
while the residents in Phu Binh and Dinh Hoa districts are willing to pay approximately VND
45,000 (US$ 2.1) per household as one-time payment for natural forest protection in Dinh
Hoa. The mean WTP value is not significantly different between residents in the rural areas
and urban areas. These findings show that respondents in Thai Nguyen province support
payment for natural forest protection in Dinh Hoa, regardless of how far away the Dinh Hoa
forests are or where the respondents live; rural or urban areas.
The mean WTP of total sample is estimated to be VND 43,000 (US$ 2.1), ranging from VND
39,000 (US$ 1.9) to VND 48,000 (US$ 2.3) for a 95% confidence interval. The median WTP is
VND 39,000 (US$ 1.9), which is slightly lower than the mean WTP. The median WTP ranges
between VND 34,000 (US$ 1.6) and VND 44,000 (US$ 2.1) for a 95% confidence interval.
Table 22: Mean and median WTP
Unit Mean
95% CI Median
95% CI
Lower Upper Lower Upper
Phu Binh & Dinh Hoa
district (N= 168)
VND 45,000 39,000 49,000 41,000 39,000 49,000
(US$) (2.1) (1.9) (2.3) (2.0) (1.9) (2.3)
Thai Nguyen city (N=92) VND 39,000 28,000 48,000 33,000 21,000 43,000
(US$) (1.9) (1.3) (2.3) (1.6) (1.0) (2.0)
Total sample (N=260) VND 43,000 39,000 48,000 39,000 34,000 44,000
(US$) (2.1) (1.9) (2.3) (1.9) (1.6) (2.1)
5.1.8. Total WTP for natural forest protection in Dinh Hoa
The total WTP is estimated by multiplying the mean WTP by the total number of
households in Thai Nguyen province, which amounts to 290,000 (TSO, 2012). If each
household is willing to contribute VND 43,000 (US$ 2.1) as one-time payment, Thai Nguyen
province could raise VND 12.47 billion (US$ 593,810) to protect natural forests in Dinh Hoa
as total benefits transfer. The upper and lower bound for a 95% confidence interval around
the estimated total value is VND 11.31 billion (US$ 538,571) and VND 13.92 billion (US$
662,857), respectively.
5 Results
99
5.2. WTA survey
5.2.1. Response rate and protest responses
Of the total 300 households in the WTA survey, 23 households agreed to participate in the
survey but refused to answer the valuation question of the questionnaire. Eight of the 23
households stated that they would want to know other opinions about the program, and
15 households refused any payments to stop utilizing forest resources. These responses
then were identified as protest responses and were eliminated from the sample.
The remaining 277 responses (92%) were kept in the sample and were assigned to three
sub-groups in accordance with three types of forests that the households were contracted:
production forest sub-group (85 responses), protection forest sub-group (97 responses),
and special-use sub-group (95 responses).
5.2.2. Demographic and socio-economic characteristics
Table 23 summarizes the demographic and socio-economic characteristics of the total
sample and sub-samples. It is evident that the demographic composition of the sub-
samples is similar, except for a minor variation in ethnic group. Therefore, the discussion is
not presented for the three sub-groups separately, but for the total sample as a whole. The
respondents mainly work in agriculture, have comparatively low education levels, on
average 7th grade, and a mean age of 48. About 62% of them are male, and 80% belong to
minority ethnic groups. Each household has an average of four members.
Each household has more than three ha of contracted natural forest, and 73% of the
households have been contracted and allocated both natural forests and planted forests.
Of the total forest area per household, households contracted protection forests occupied
the highest share (6.4 ha) and the production forests the lowest (0.8 ha). The average
forest land of the whole sample of three ha per household accessed by this survey is similar
to the findings of several studies conducted in different provinces of the country: Lam
Dong, Bac Kan, Son La (Dam et al., 2014; Pham et al., 2013; Trinh and Roberto, F. Rañola Jr.,
2011), Hue, Ha Giang, Quang Nam, and Yen Bai (Wunder, 2005a). The average distance
from the respondents´ houses to the border of nearest natural forests is more than two
km. All households stated that their natural forest was degraded with low growing stock.
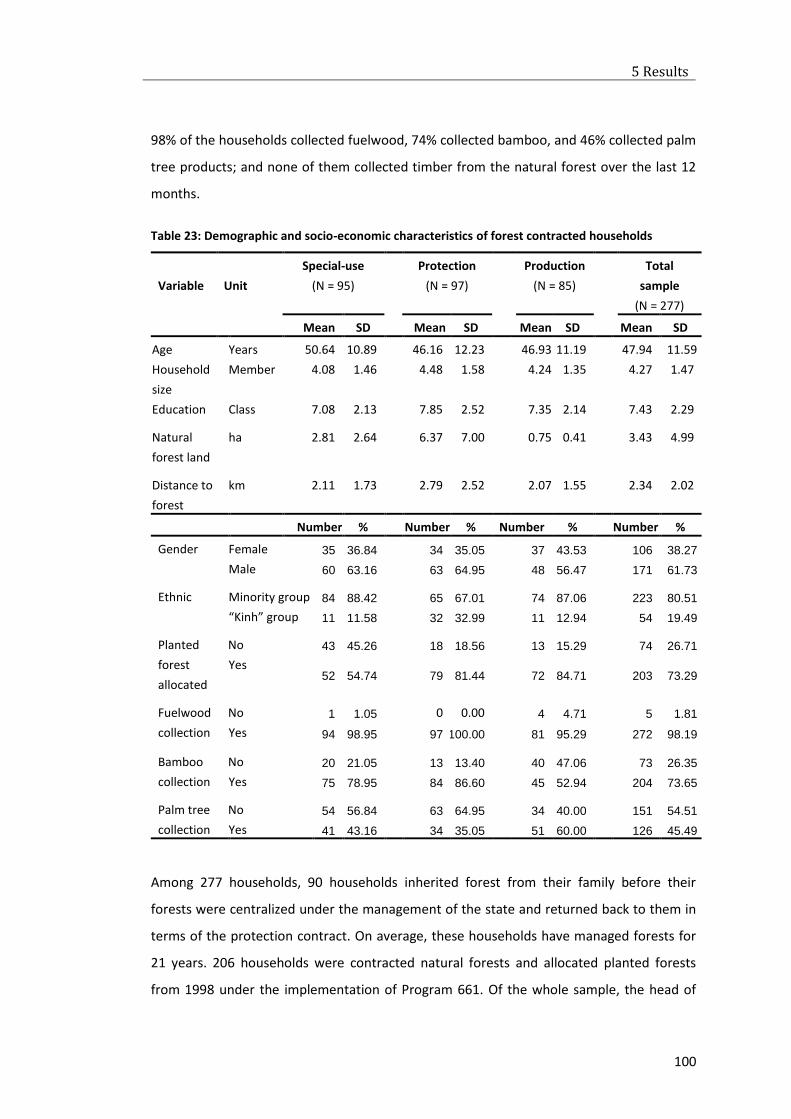
5 Results
100
98% of the households collected fuelwood, 74% collected bamboo, and 46% collected palm
tree products; and none of them collected timber from the natural forest over the last 12
months.
Table 23: Demographic and socio-economic characteristics of forest contracted households
Variable
Unit
Special-use
(N = 95)
Protection
(N = 97)
Production
(N = 85)
Total
sample
(N = 277)
Mean SD Mean SD Mean SD Mean SD
Age Years 50.64 10.89 46.16 12.23 46.93 11.19 47.94 11.59
Household
size
Member 4.08 1.46 4.48 1.58 4.24 1.35 4.27 1.47
Education Class 7.08 2.13 7.85 2.52 7.35 2.14 7.43 2.29
Natural
forest land
ha 2.81 2.64 6.37 7.00 0.75 0.41 3.43 4.99
Distance to
forest
km 2.11 1.73 2.79 2.52 2.07 1.55 2.34 2.02
Number % Number % Number % Number %
Gender Female 35 36.84 34 35.05 37 43.53 106 38.27
Male 60 63.16 63 64.95 48 56.47 171 61.73
Ethnic Minority group 84 88.42 65 67.01 74 87.06 223 80.51
“Kinh” group 11 11.58 32 32.99 11 12.94 54 19.49
Planted
forest
allocated
No 43 45.26 18 18.56 13 15.29 74 26.71
Yes 52 54.74
79 81.44
72 84.71
203 73.29
Fuelwood
collection
No 1 1.05 0 0.00 4 4.71 5 1.81
Yes 94 98.95 97 100.00 81 95.29 272 98.19
Bamboo
collection
No 20 21.05 13 13.40 40 47.06 73 26.35
Yes 75 78.95 84 86.60 45 52.94 204 73.65
Palm tree
collection
No 54 56.84 63 64.95 34 40.00 151 54.51
Yes 41 43.16 34 35.05 51 60.00 126 45.49
Among 277 households, 90 households inherited forest from their family before their
forests were centralized under the management of the state and returned back to them in
terms of the protection contract. On average, these households have managed forests for
21 years. 206 households were contracted natural forests and allocated planted forests
from 1998 under the implementation of Program 661. Of the whole sample, the head of
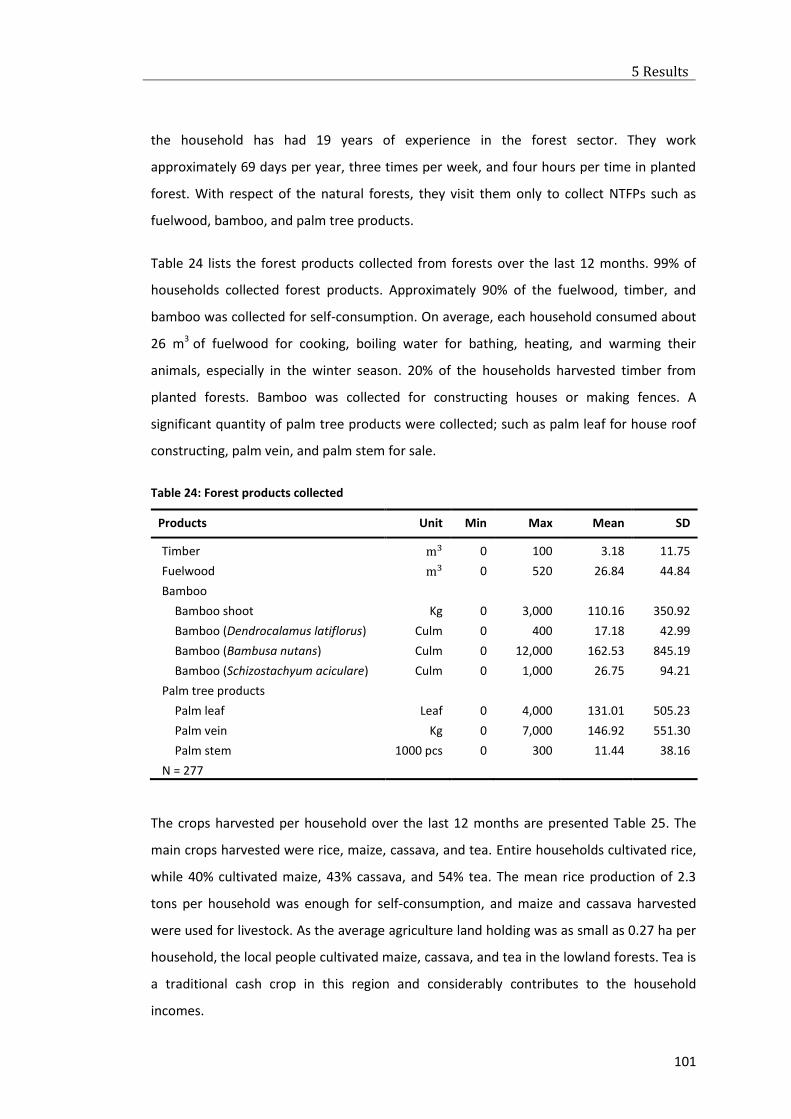
5 Results
101
the household has had 19 years of experience in the forest sector. They work
approximately 69 days per year, three times per week, and four hours per time in planted
forest. With respect of the natural forests, they visit them only to collect NTFPs such as
fuelwood, bamboo, and palm tree products.
Table 24 lists the forest products collected from forests over the last 12 months. 99% of
households collected forest products. Approximately 90% of the fuelwood, timber, and
bamboo was collected for self-consumption. On average, each household consumed about
26 m3 of fuelwood for cooking, boiling water for bathing, heating, and warming their
animals, especially in the winter season. 20% of the households harvested timber from
planted forests. Bamboo was collected for constructing houses or making fences. A
significant quantity of palm tree products were collected; such as palm leaf for house roof
constructing, palm vein, and palm stem for sale.
Table 24: Forest products collected
Products Unit Min Max Mean SD
Timber m3 0 100 3.18 11.75
Fuelwood m3 0 520 26.84 44.84
Bamboo
Bamboo shoot Kg 0 3,000 110.16 350.92
Bamboo (Dendrocalamus latiflorus) Culm 0 400 17.18 42.99
Bamboo (Bambusa nutans) Culm 0 12,000 162.53 845.19
Bamboo (Schizostachyum aciculare) Culm 0 1,000 26.75 94.21
Palm tree products
Palm leaf Leaf 0 4,000 131.01 505.23
Palm vein Kg 0 7,000 146.92 551.30
Palm stem 1000 pcs 0 300 11.44 38.16
N = 277
The crops harvested per household over the last 12 months are presented Table 25. The
main crops harvested were rice, maize, cassava, and tea. Entire households cultivated rice,
while 40% cultivated maize, 43% cassava, and 54% tea. The mean rice production of 2.3
tons per household was enough for self-consumption, and maize and cassava harvested
were used for livestock. As the average agriculture land holding was as small as 0.27 ha per
household, the local people cultivated maize, cassava, and tea in the lowland forests. Tea is
a traditional cash crop in this region and considerably contributes to the household
incomes.
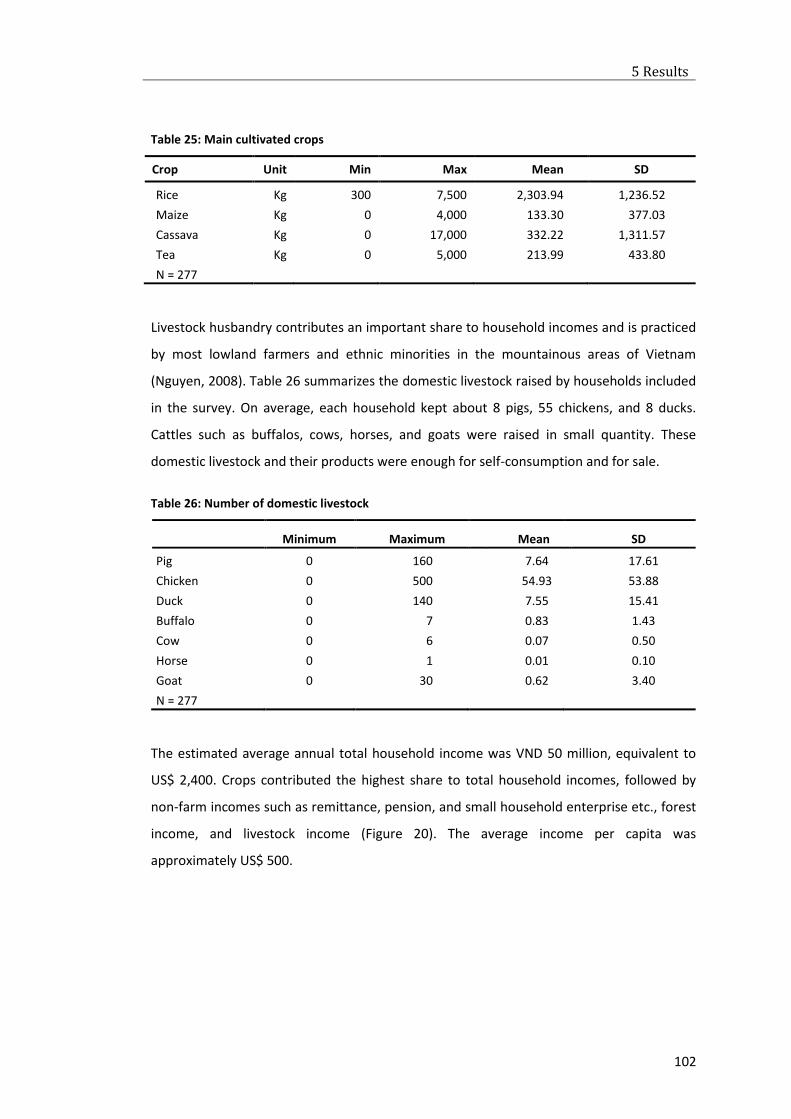
5 Results
102
Table 25: Main cultivated crops
Crop Unit Min Max Mean SD
Rice Kg 300 7,500 2,303.94 1,236.52
Maize Kg 0 4,000 133.30 377.03
Cassava Kg 0 17,000 332.22 1,311.57
Tea Kg 0 5,000 213.99 433.80
N = 277
Livestock husbandry contributes an important share to household incomes and is practiced
by most lowland farmers and ethnic minorities in the mountainous areas of Vietnam
(Nguyen, 2008). Table 26 summarizes the domestic livestock raised by households included
in the survey. On average, each household kept about 8 pigs, 55 chickens, and 8 ducks.
Cattles such as buffalos, cows, horses, and goats were raised in small quantity. These
domestic livestock and their products were enough for self-consumption and for sale.
Table 26: Number of domestic livestock
Minimum Maximum Mean SD
Pig 0 160 7.64 17.61
Chicken 0 500 54.93 53.88
Duck 0 140 7.55 15.41
Buffalo 0 7 0.83 1.43
Cow 0 6 0.07 0.50
Horse 0 1 0.01 0.10
Goat 0 30 0.62 3.40
N = 277
The estimated average annual total household income was VND 50 million, equivalent to
US$ 2,400. Crops contributed the highest share to total household incomes, followed by
non-farm incomes such as remittance, pension, and small household enterprise etc., forest
income, and livestock income (Figure 20). The average income per capita was
approximately US$ 500.
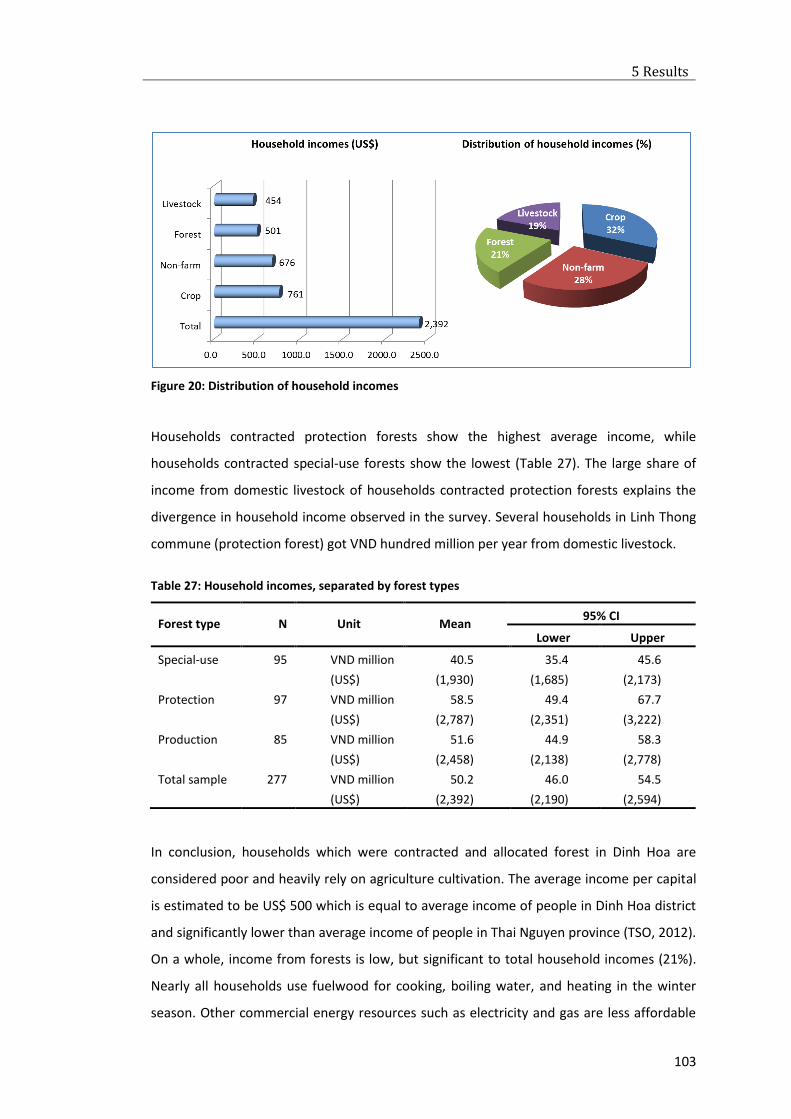
5 Results
103
Figure 20: Distribution of household incomes
Households contracted protection forests show the highest average income, while
households contracted special-use forests show the lowest (Table 27). The large share of
income from domestic livestock of households contracted protection forests explains the
divergence in household income observed in the survey. Several households in Linh Thong
commune (protection forest) got VND hundred million per year from domestic livestock.
Table 27: Household incomes, separated by forest types
Forest type N Unit Mean 95% CI
Lower Upper
Special-use 95 VND million 40.5 35.4 45.6
(US$) (1,930) (1,685) (2,173)
Protection 97 VND million 58.5 49.4 67.7
(US$) (2,787) (2,351) (3,222)
Production 85 VND million 51.6 44.9 58.3
(US$) (2,458) (2,138) (2,778)
Total sample 277 VND million 50.2 46.0 54.5
(US$) (2,392) (2,190) (2,594)
In conclusion, households which were contracted and allocated forest in Dinh Hoa are
considered poor and heavily rely on agriculture cultivation. The average income per capital
is estimated to be US$ 500 which is equal to average income of people in Dinh Hoa district
and significantly lower than average income of people in Thai Nguyen province (TSO, 2012).
On a whole, income from forests is low, but significant to total household incomes (21%).
Nearly all households use fuelwood for cooking, boiling water, and heating in the winter
season. Other commercial energy resources such as electricity and gas are less affordable
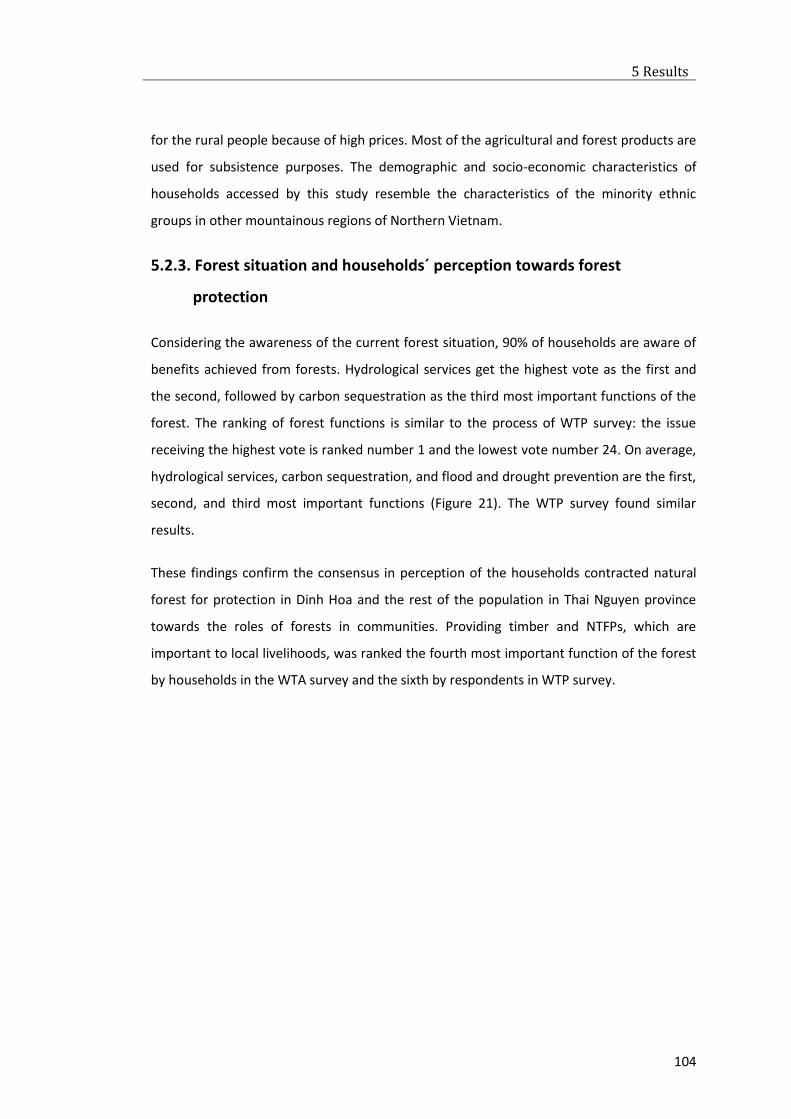
5 Results
104
for the rural people because of high prices. Most of the agricultural and forest products are
used for subsistence purposes. The demographic and socio-economic characteristics of
households accessed by this study resemble the characteristics of the minority ethnic
groups in other mountainous regions of Northern Vietnam.
5.2.3. Forest situation and households´ perception towards forest
protection
Considering the awareness of the current forest situation, 90% of households are aware of
benefits achieved from forests. Hydrological services get the highest vote as the first and
the second, followed by carbon sequestration as the third most important functions of the
forest. The ranking of forest functions is similar to the process of WTP survey: the issue
receiving the highest vote is ranked number 1 and the lowest vote number 24. On average,
hydrological services, carbon sequestration, and flood and drought prevention are the first,
second, and third most important functions (Figure 21). The WTP survey found similar
results.
These findings confirm the consensus in perception of the households contracted natural
forest for protection in Dinh Hoa and the rest of the population in Thai Nguyen province
towards the roles of forests in communities. Providing timber and NTFPs, which are
important to local livelihoods, was ranked the fourth most important function of the forest
by households in the WTA survey and the sixth by respondents in WTP survey.
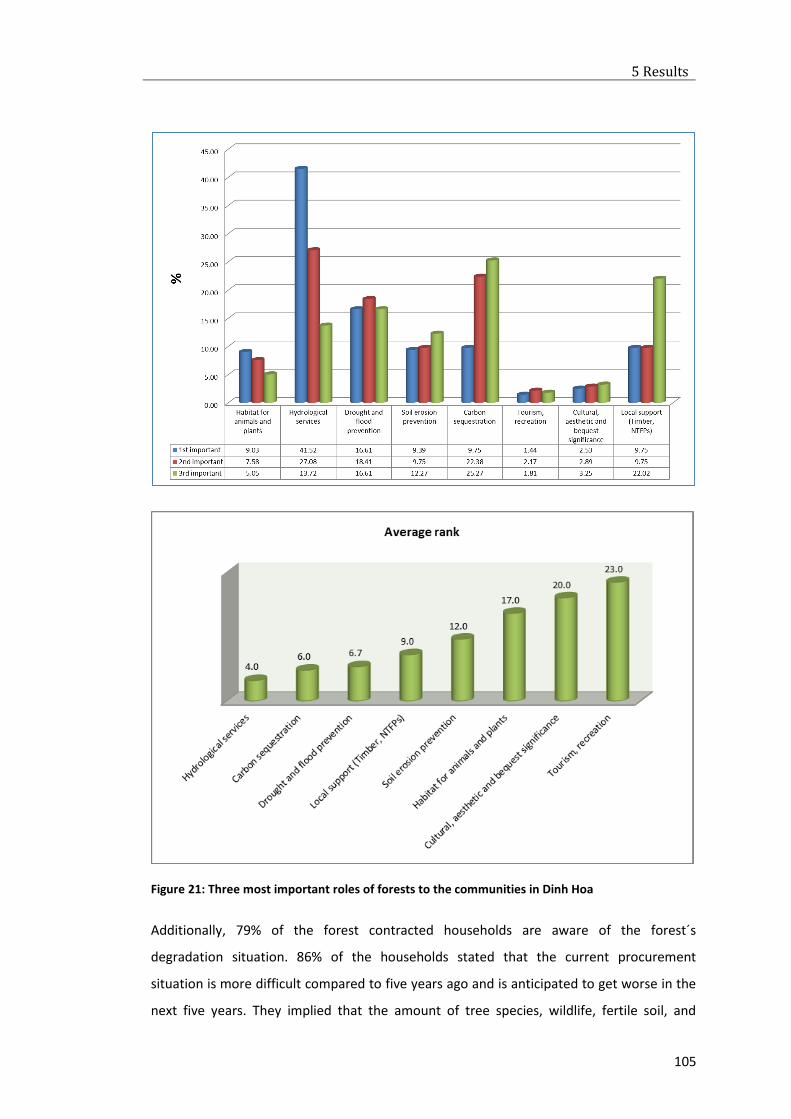
5 Results
105
Figure 21: Three most important roles of forests to the communities in Dinh Hoa
Additionally, 79% of the forest contracted households are aware of the forest´s
degradation situation. 86% of the households stated that the current procurement
situation is more difficult compared to five years ago and is anticipated to get worse in the
next five years. They implied that the amount of tree species, wildlife, fertile soil, and
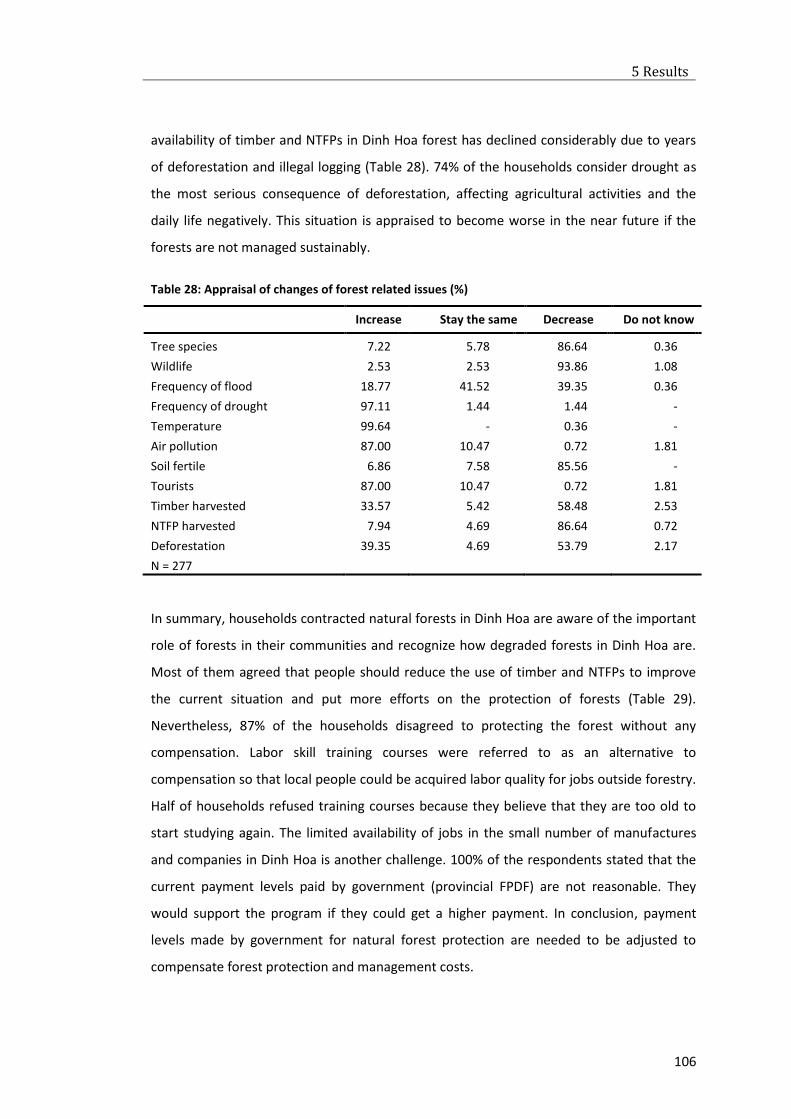
5 Results
106
availability of timber and NTFPs in Dinh Hoa forest has declined considerably due to years
of deforestation and illegal logging (Table 28). 74% of the households consider drought as
the most serious consequence of deforestation, affecting agricultural activities and the
daily life negatively. This situation is appraised to become worse in the near future if the
forests are not managed sustainably.
Table 28: Appraisal of changes of forest related issues (%)
Increase Stay the same Decrease Do not know
Tree species 7.22 5.78 86.64 0.36
Wildlife 2.53 2.53 93.86 1.08
Frequency of flood 18.77 41.52 39.35 0.36
Frequency of drought 97.11 1.44 1.44 -
Temperature 99.64 - 0.36 -
Air pollution 87.00 10.47 0.72 1.81
Soil fertile 6.86 7.58 85.56 -
Tourists 87.00 10.47 0.72 1.81
Timber harvested 33.57 5.42 58.48 2.53
NTFP harvested 7.94 4.69 86.64 0.72
Deforestation 39.35 4.69 53.79 2.17
N = 277
In summary, households contracted natural forests in Dinh Hoa are aware of the important
role of forests in their communities and recognize how degraded forests in Dinh Hoa are.
Most of them agreed that people should reduce the use of timber and NTFPs to improve
the current situation and put more efforts on the protection of forests (Table 29).
Nevertheless, 87% of the households disagreed to protecting the forest without any
compensation. Labor skill training courses were referred to as an alternative to
compensation so that local people could be acquired labor quality for jobs outside forestry.
Half of households refused training courses because they believe that they are too old to
start studying again. The limited availability of jobs in the small number of manufactures
and companies in Dinh Hoa is another challenge. 100% of the respondents stated that the
current payment levels paid by government (provincial FPDF) are not reasonable. They
would support the program if they could get a higher payment. In conclusion, payment
levels made by government for natural forest protection are needed to be adjusted to
compensate forest protection and management costs.
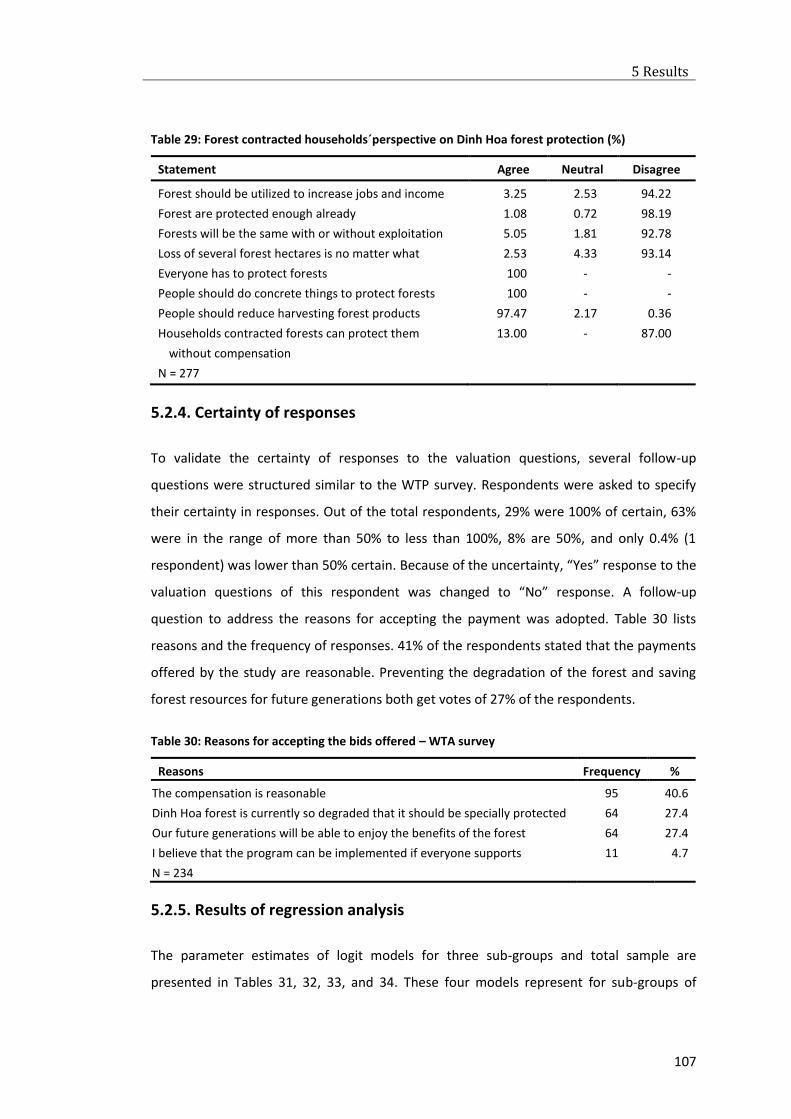
5 Results
107
Table 29: Forest contracted households´perspective on Dinh Hoa forest protection (%)
Statement Agree Neutral Disagree
Forest should be utilized to increase jobs and income 3.25 2.53 94.22
Forest are protected enough already 1.08 0.72 98.19
Forests will be the same with or without exploitation 5.05 1.81 92.78
Loss of several forest hectares is no matter what 2.53 4.33 93.14
Everyone has to protect forests 100 - -
People should do concrete things to protect forests 100 - -
People should reduce harvesting forest products 97.47 2.17 0.36
Households contracted forests can protect them
without compensation
13.00 - 87.00
N = 277
5.2.4. Certainty of responses
To validate the certainty of responses to the valuation questions, several follow-up
questions were structured similar to the WTP survey. Respondents were asked to specify
their certainty in responses. Out of the total respondents, 29% were 100% of certain, 63%
were in the range of more than 50% to less than 100%, 8% are 50%, and only 0.4% (1
respondent) was lower than 50% certain. Because of the uncertainty, “Yes” response to the
valuation questions of this respondent was changed to “No” response. A follow-up
question to address the reasons for accepting the payment was adopted. Table 30 lists
reasons and the frequency of responses. 41% of the respondents stated that the payments
offered by the study are reasonable. Preventing the degradation of the forest and saving
forest resources for future generations both get votes of 27% of the respondents.
Table 30: Reasons for accepting the bids offered – WTA survey
Reasons Frequency %
The compensation is reasonable 95 40.6
Dinh Hoa forest is currently so degraded that it should be specially protected 64 27.4
Our future generations will be able to enjoy the benefits of the forest 64 27.4
I believe that the program can be implemented if everyone supports 11 4.7
N = 234
5.2.5. Results of regression analysis
The parameter estimates of logit models for three sub-groups and total sample are
presented in Tables 31, 32, 33, and 34. These four models represent for sub-groups of
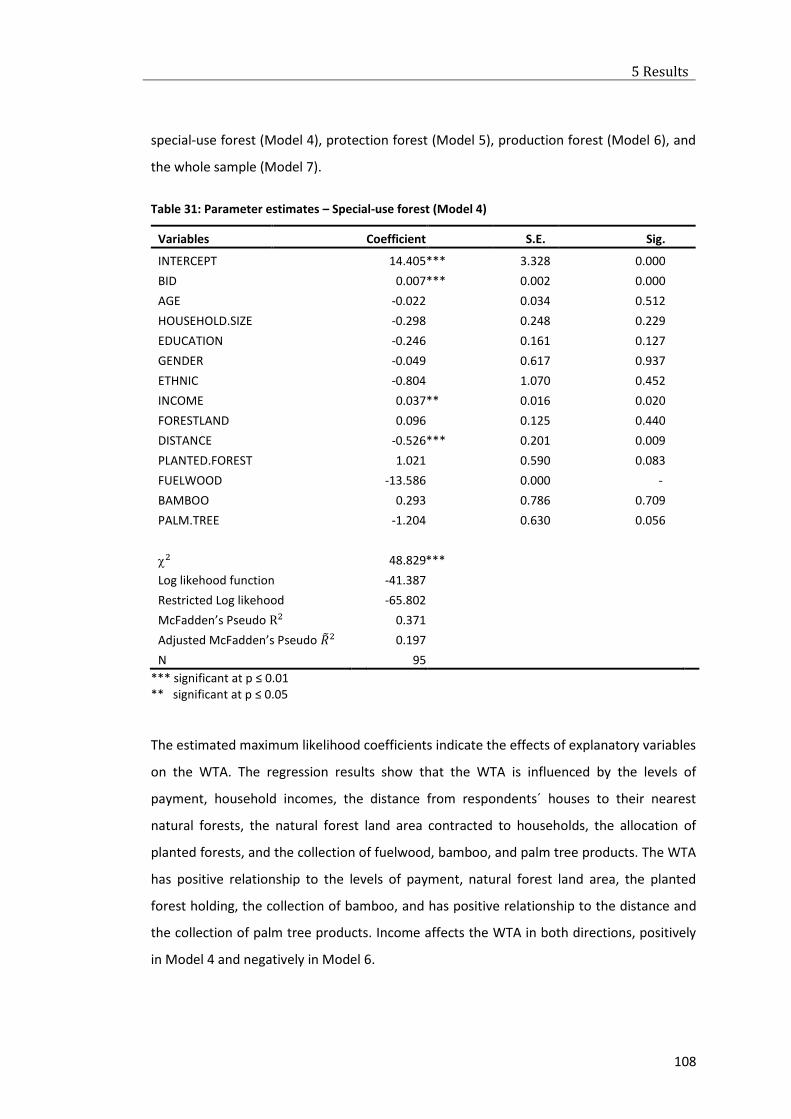
5 Results
108
special-use forest (Model 4), protection forest (Model 5), production forest (Model 6), and
the whole sample (Model 7).
Table 31: Parameter estimates – Special-use forest (Model 4)
Variables Coefficient S.E. Sig.
INTERCEPT 14.405 *** 3.328 0.000
BID 0.007 *** 0.002 0.000
AGE -0.022 0.034 0.512
HOUSEHOLD.SIZE -0.298 0.248 0.229
EDUCATION -0.246 0.161 0.127
GENDER -0.049 0.617 0.937
ETHNIC -0.804 1.070 0.452
INCOME 0.037 ** 0.016 0.020
FORESTLAND 0.096 0.125 0.440
DISTANCE -0.526 *** 0.201 0.009
PLANTED.FOREST 1.021 0.590 0.083
FUELWOOD -13.586 0.000 -
BAMBOO 0.293 0.786 0.709
PALM.TREE -1.204 0.630 0.056
2 48.829 ***
Log likehood function -41.387
Restricted Log likehood -65.802
McFadden’s Pseudo R2 0.371
Adjusted McFadden’s Pseudo ��2 0.197
N 95
*** significant at p ≤ 0.01 ** significant at p ≤ 0.05
The estimated maximum likelihood coefficients indicate the effects of explanatory variables
on the WTA. The regression results show that the WTA is influenced by the levels of
payment, household incomes, the distance from respondents´ houses to their nearest
natural forests, the natural forest land area contracted to households, the allocation of
planted forests, and the collection of fuelwood, bamboo, and palm tree products. The WTA
has positive relationship to the levels of payment, natural forest land area, the planted
forest holding, the collection of bamboo, and has positive relationship to the distance and
the collection of palm tree products. Income affects the WTA in both directions, positively
in Model 4 and negatively in Model 6.
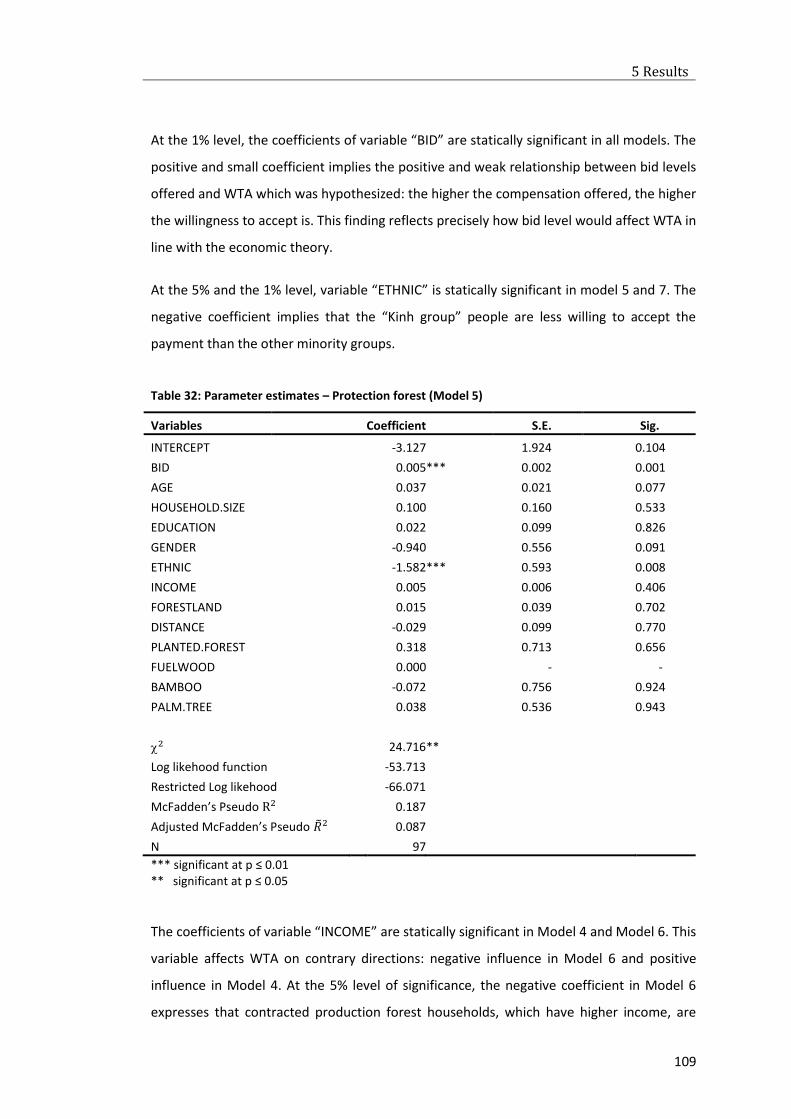
5 Results
109
At the 1% level, the coefficients of variable “BID” are statically significant in all models. The
positive and small coefficient implies the positive and weak relationship between bid levels
offered and WTA which was hypothesized: the higher the compensation offered, the higher
the willingness to accept is. This finding reflects precisely how bid level would affect WTA in
line with the economic theory.
At the 5% and the 1% level, variable “ETHNIC” is statically significant in model 5 and 7. The
negative coefficient implies that the “Kinh group” people are less willing to accept the
payment than the other minority groups.
Table 32: Parameter estimates – Protection forest (Model 5)
Variables Coefficient S.E. Sig.
INTERCEPT -3.127 1.924 0.104
BID 0.005 *** 0.002 0.001
AGE 0.037 0.021 0.077
HOUSEHOLD.SIZE 0.100 0.160 0.533
EDUCATION 0.022 0.099 0.826
GENDER -0.940 0.556 0.091
ETHNIC -1.582 *** 0.593 0.008
INCOME 0.005 0.006 0.406
FORESTLAND 0.015 0.039 0.702
DISTANCE -0.029 0.099 0.770
PLANTED.FOREST 0.318 0.713 0.656
FUELWOOD 0.000 - -
BAMBOO -0.072 0.756 0.924
PALM.TREE 0.038 0.536 0.943
2 24.716 **
Log likehood function -53.713
Restricted Log likehood -66.071
McFadden’s Pseudo R2 0.187
Adjusted McFadden’s Pseudo ��2 0.087
N 97
*** significant at p ≤ 0.01 ** significant at p ≤ 0.05
The coefficients of variable “INCOME” are statically significant in Model 4 and Model 6. This
variable affects WTA on contrary directions: negative influence in Model 6 and positive
influence in Model 4. At the 5% level of significance, the negative coefficient in Model 6
expresses that contracted production forest households, which have higher income, are
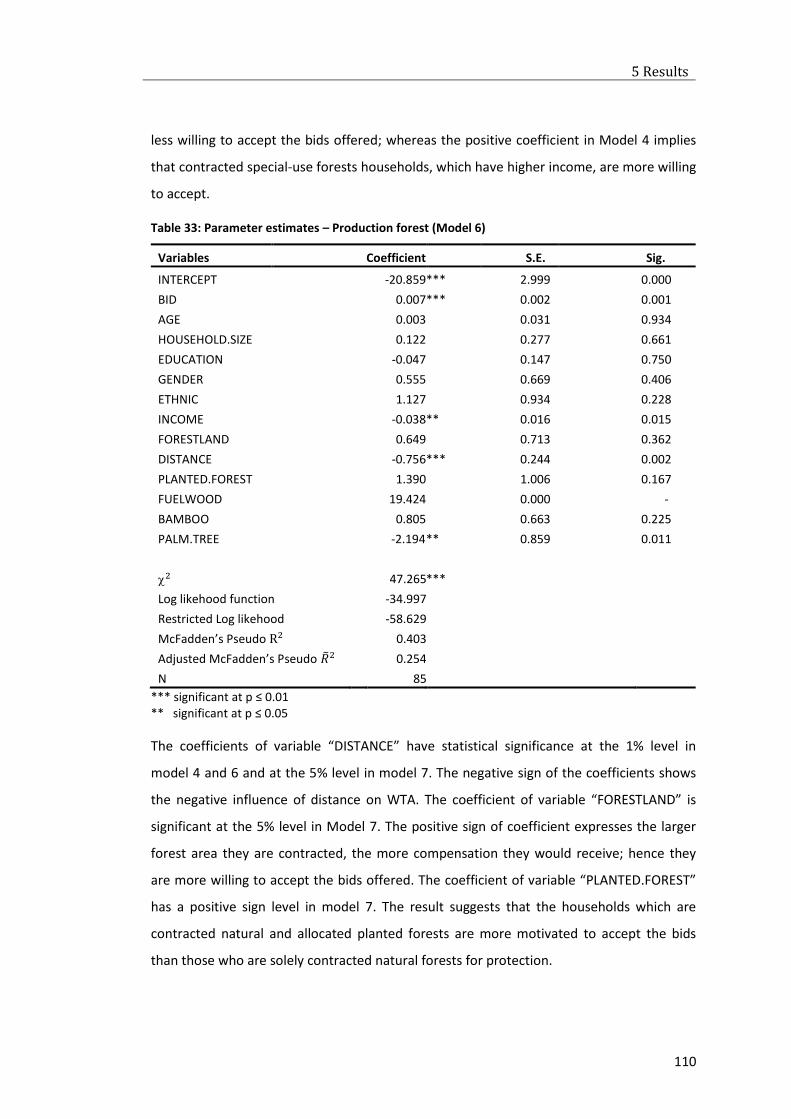
5 Results
110
less willing to accept the bids offered; whereas the positive coefficient in Model 4 implies
that contracted special-use forests households, which have higher income, are more willing
to accept.
Table 33: Parameter estimates – Production forest (Model 6)
Variables Coefficient S.E. Sig.
INTERCEPT -20.859 *** 2.999 0.000
BID 0.007 *** 0.002 0.001
AGE 0.003 0.031 0.934
HOUSEHOLD.SIZE 0.122 0.277 0.661
EDUCATION -0.047 0.147 0.750
GENDER 0.555 0.669 0.406
ETHNIC 1.127 0.934 0.228
INCOME -0.038 ** 0.016 0.015
FORESTLAND 0.649 0.713 0.362
DISTANCE -0.756 *** 0.244 0.002
PLANTED.FOREST 1.390 1.006 0.167
FUELWOOD 19.424 0.000 -
BAMBOO 0.805 0.663 0.225
PALM.TREE -2.194 ** 0.859 0.011
2 47.265 ***
Log likehood function -34.997
Restricted Log likehood -58.629
McFadden’s Pseudo R2 0.403
Adjusted McFadden’s Pseudo ��2 0.254
N 85
*** significant at p ≤ 0.01 ** significant at p ≤ 0.05
The coefficients of variable “DISTANCE” have statistical significance at the 1% level in
model 4 and 6 and at the 5% level in model 7. The negative sign of the coefficients shows
the negative influence of distance on WTA. The coefficient of variable “FORESTLAND” is
significant at the 5% level in Model 7. The positive sign of coefficient expresses the larger
forest area they are contracted, the more compensation they would receive; hence they
are more willing to accept the bids offered. The coefficient of variable “PLANTED.FOREST”
has a positive sign level in model 7. The result suggests that the households which are
contracted natural and allocated planted forests are more motivated to accept the bids
than those who are solely contracted natural forests for protection.
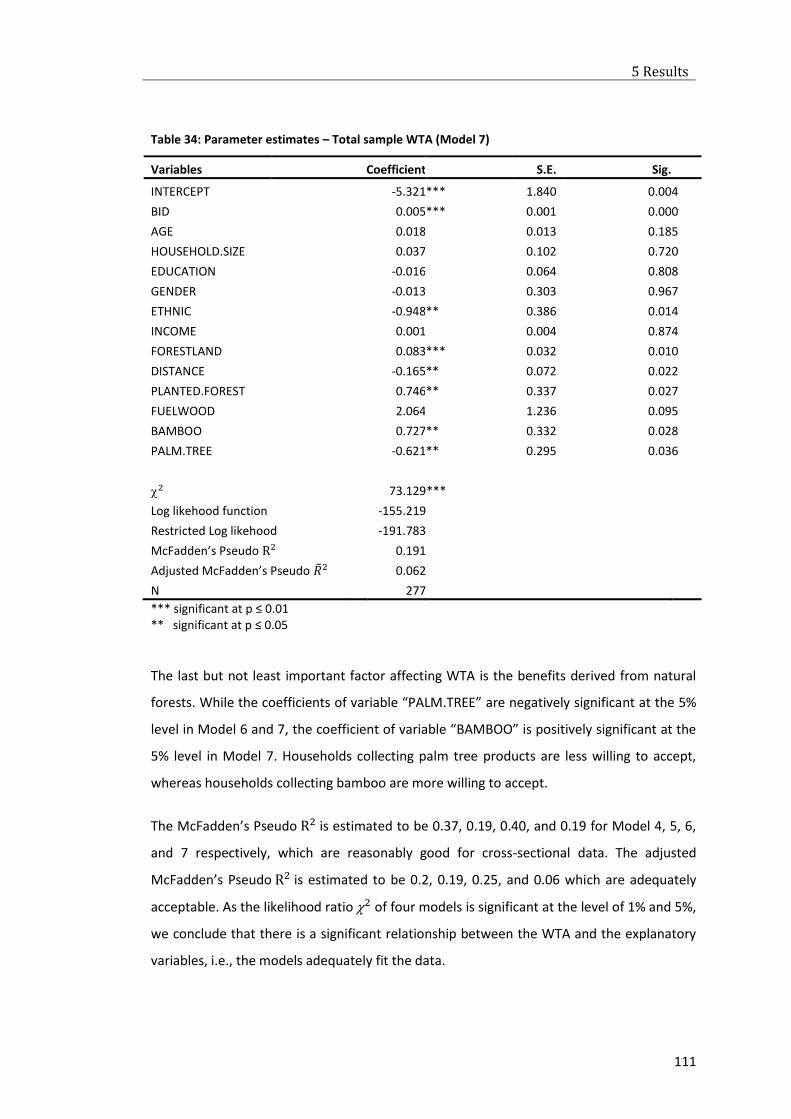
5 Results
111
Table 34: Parameter estimates – Total sample WTA (Model 7)
Variables Coefficient S.E. Sig.
INTERCEPT -5.321 *** 1.840 0.004
BID 0.005 *** 0.001 0.000
AGE 0.018 0.013 0.185
HOUSEHOLD.SIZE 0.037 0.102 0.720
EDUCATION -0.016 0.064 0.808
GENDER -0.013 0.303 0.967
ETHNIC -0.948 ** 0.386 0.014
INCOME 0.001 0.004 0.874
FORESTLAND 0.083 *** 0.032 0.010
DISTANCE -0.165 ** 0.072 0.022
PLANTED.FOREST 0.746 ** 0.337 0.027
FUELWOOD 2.064 1.236 0.095
BAMBOO 0.727 ** 0.332 0.028
PALM.TREE -0.621 ** 0.295 0.036
2 73.129 ***
Log likehood function -155.219
Restricted Log likehood -191.783
McFadden’s Pseudo R2 0.191
Adjusted McFadden’s Pseudo ��2 0.062
N 277
*** significant at p ≤ 0.01 ** significant at p ≤ 0.05
The last but not least important factor affecting WTA is the benefits derived from natural
forests. While the coefficients of variable “PALM.TREE” are negatively significant at the 5%
level in Model 6 and 7, the coefficient of variable “BAMBOO” is positively significant at the
5% level in Model 7. Households collecting palm tree products are less willing to accept,
whereas households collecting bamboo are more willing to accept.
The McFadden’s Pseudo R2 is estimated to be 0.37, 0.19, 0.40, and 0.19 for Model 4, 5, 6,
and 7 respectively, which are reasonably good for cross-sectional data. The adjusted
McFadden’s Pseudo R2 is estimated to be 0.2, 0.19, 0.25, and 0.06 which are adequately
acceptable. As the likelihood ratio 2 of four models is significant at the level of 1% and 5%,
we conclude that there is a significant relationship between the WTA and the explanatory
variables, i.e., the models adequately fit the data.
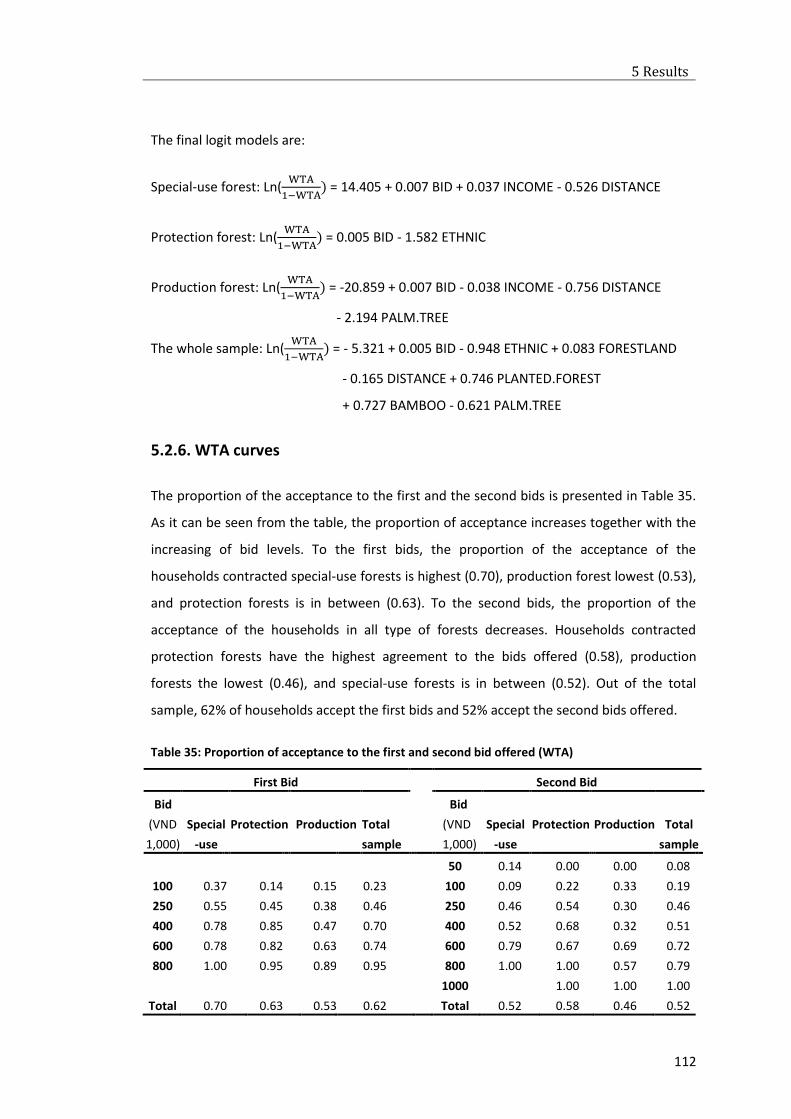
5 Results
112
The final logit models are:
Special-use forest: Ln(WTA
1−WTA) = 14.405 + 0.007 BID + 0.037 INCOME - 0.526 DISTANCE
Protection forest: Ln(WTA
1−WTA) = 0.005 BID - 1.582 ETHNIC
Production forest: Ln(WTA
1−WTA) = -20.859 + 0.007 BID - 0.038 INCOME - 0.756 DISTANCE
- 2.194 PALM.TREE
The whole sample: Ln(WTA
1−WTA) = - 5.321 + 0.005 BID - 0.948 ETHNIC + 0.083 FORESTLAND
- 0.165 DISTANCE + 0.746 PLANTED.FOREST
+ 0.727 BAMBOO - 0.621 PALM.TREE
5.2.6. WTA curves
The proportion of the acceptance to the first and the second bids is presented in Table 35.
As it can be seen from the table, the proportion of acceptance increases together with the
increasing of bid levels. To the first bids, the proportion of the acceptance of the
households contracted special-use forests is highest (0.70), production forest lowest (0.53),
and protection forests is in between (0.63). To the second bids, the proportion of the
acceptance of the households in all type of forests decreases. Households contracted
protection forests have the highest agreement to the bids offered (0.58), production
forests the lowest (0.46), and special-use forests is in between (0.52). Out of the total
sample, 62% of households accept the first bids and 52% accept the second bids offered.
Table 35: Proportion of acceptance to the first and second bid offered (WTA)
First Bid Second Bid
Bid
(VND
1,000)
Special
-use
Protection
Production
Total
sample
Bid
(VND
1,000)
Special
-use
Protection
Production
Total
sample
50 0.14 0.00 0.00 0.08
100 0.37 0.14 0.15 0.23 100 0.09 0.22 0.33 0.19
250 0.55 0.45 0.38 0.46 250 0.46 0.54 0.30 0.46
400 0.78 0.85 0.47 0.70 400 0.52 0.68 0.32 0.51
600 0.78 0.82 0.63 0.74 600 0.79 0.67 0.69 0.72
800 1.00 0.95 0.89 0.95 800 1.00 1.00 0.57 0.79
1000 1.00 1.00 1.00
Total 0.70 0.63 0.53 0.62 Total 0.52 0.58 0.46 0.52
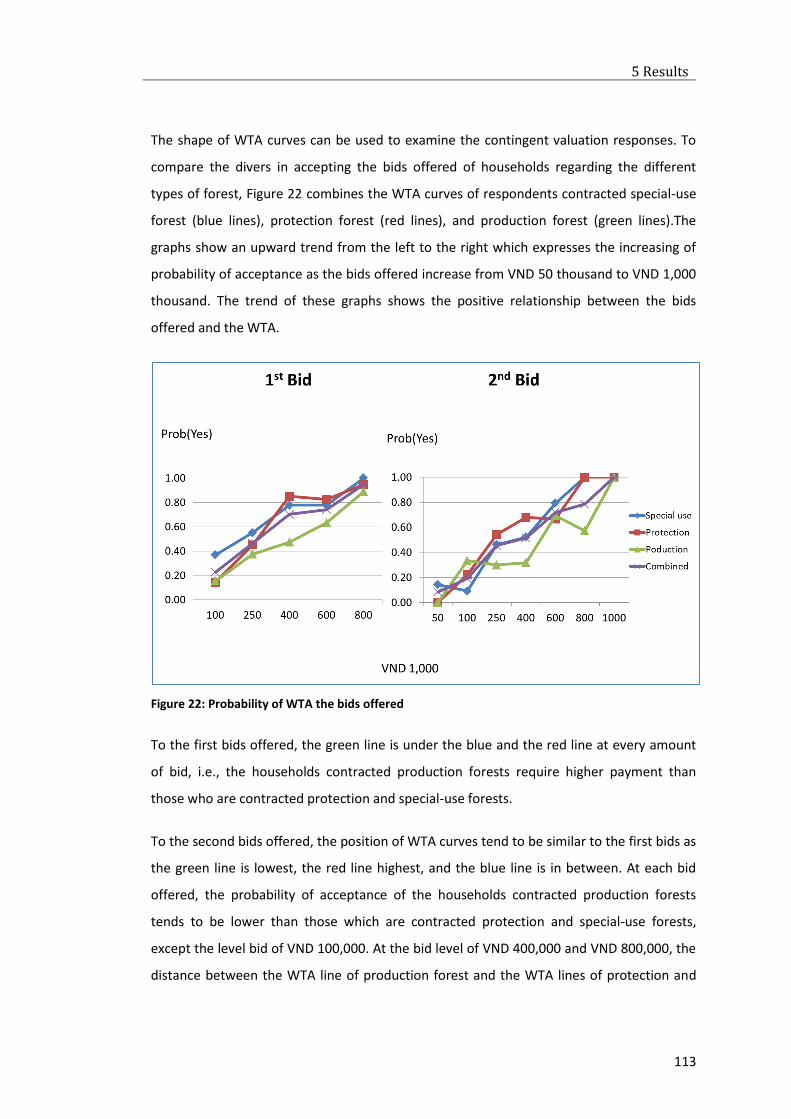
5 Results
113
The shape of WTA curves can be used to examine the contingent valuation responses. To
compare the divers in accepting the bids offered of households regarding the different
types of forest, Figure 22 combines the WTA curves of respondents contracted special-use
forest (blue lines), protection forest (red lines), and production forest (green lines).The
graphs show an upward trend from the left to the right which expresses the increasing of
probability of acceptance as the bids offered increase from VND 50 thousand to VND 1,000
thousand. The trend of these graphs shows the positive relationship between the bids
offered and the WTA.
Figure 22: Probability of WTA the bids offered
To the first bids offered, the green line is under the blue and the red line at every amount
of bid, i.e., the households contracted production forests require higher payment than
those who are contracted protection and special-use forests.
To the second bids offered, the position of WTA curves tend to be similar to the first bids as
the green line is lowest, the red line highest, and the blue line is in between. At each bid
offered, the probability of acceptance of the households contracted production forests
tends to be lower than those which are contracted protection and special-use forests,
except the level bid of VND 100,000. At the bid level of VND 400,000 and VND 800,000, the
distance between the WTA line of production forest and the WTA lines of protection and
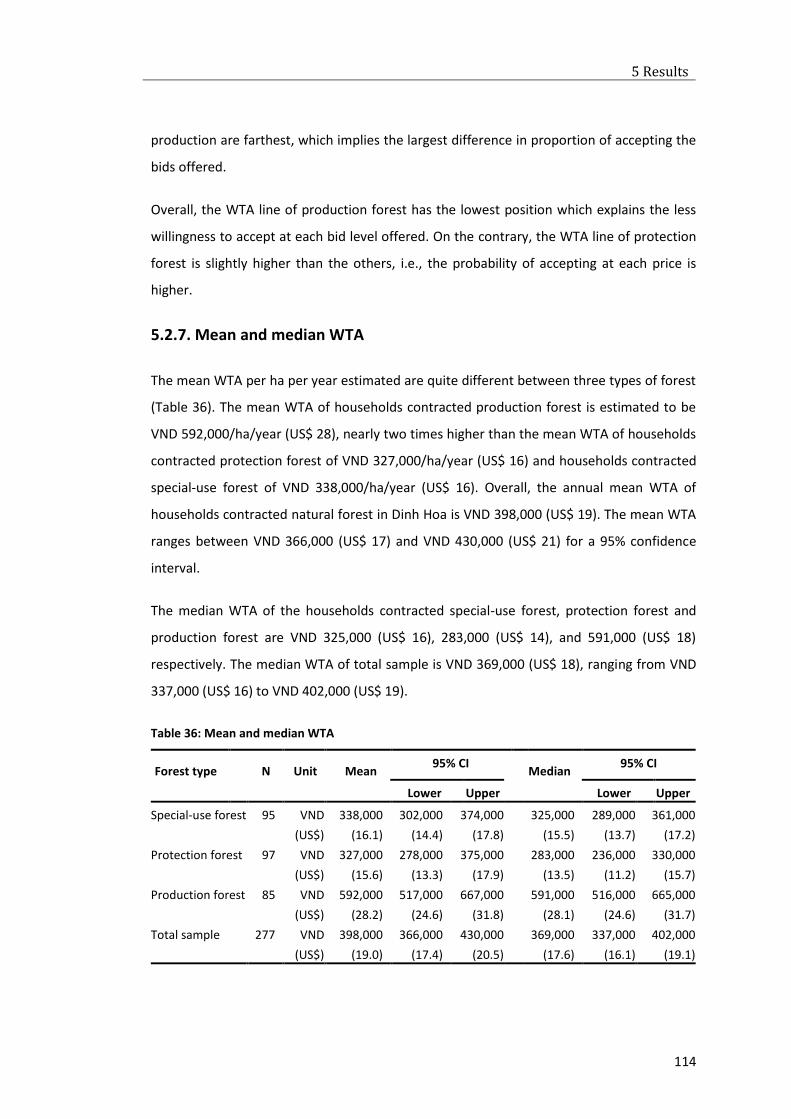
5 Results
114
production are farthest, which implies the largest difference in proportion of accepting the
bids offered.
Overall, the WTA line of production forest has the lowest position which explains the less
willingness to accept at each bid level offered. On the contrary, the WTA line of protection
forest is slightly higher than the others, i.e., the probability of accepting at each price is
higher.
5.2.7. Mean and median WTA
The mean WTA per ha per year estimated are quite different between three types of forest
(Table 36). The mean WTA of households contracted production forest is estimated to be
VND 592,000/ha/year (US$ 28), nearly two times higher than the mean WTA of households
contracted protection forest of VND 327,000/ha/year (US$ 16) and households contracted
special-use forest of VND 338,000/ha/year (US$ 16). Overall, the annual mean WTA of
households contracted natural forest in Dinh Hoa is VND 398,000 (US$ 19). The mean WTA
ranges between VND 366,000 (US$ 17) and VND 430,000 (US$ 21) for a 95% confidence
interval.
The median WTA of the households contracted special-use forest, protection forest and
production forest are VND 325,000 (US$ 16), 283,000 (US$ 14), and 591,000 (US$ 18)
respectively. The median WTA of total sample is VND 369,000 (US$ 18), ranging from VND
337,000 (US$ 16) to VND 402,000 (US$ 19).
Table 36: Mean and median WTA
Forest type N Unit Mean 95% CI
Median 95% CI
Lower Upper Lower Upper
Special-use forest 95 VND 338,000 302,000 374,000 325,000 289,000 361,000
(US$) (16.1) (14.4) (17.8) (15.5) (13.7) (17.2)
Protection forest 97 VND 327,000 278,000 375,000 283,000 236,000 330,000
(US$) (15.6) (13.3) (17.9) (13.5) (11.2) (15.7)
Production forest 85 VND 592,000 517,000 667,000 591,000 516,000 665,000
(US$) (28.2) (24.6) (31.8) (28.1) (24.6) (31.7)
Total sample 277 VND 398,000 366,000 430,000 369,000 337,000 402,000
(US$) (19.0) (17.4) (20.5) (17.6) (16.1) (19.1)
5 Results
115
5.2.8. Costs of natural forest protection in Dinh Hoa
The total costs of natural forest protection in Dinh Hoa takes into account the total natural
forest area which is contracted to households for protection. Multiplying the average WTA
of VND 398,000/ha/year with total natural forest land of approximately 12,000 ha, which
are contracted to local households, the annual cost of natural forest protection in Dinh Hoa
district is estimated to be VND 4.78 billion (US$ 227,475). The upper and lower boundary of
the 95% confidence interval around the estimated total value is VND 4.39 billion (US$
209,005) and VND 5.16 billion (US$ 245,944), respectively. Assuming a discount rate of 5%,
the total net present value of a five-years project costs VND 18.71 billion (US$ 891,162),
ranging between VND 17.19 billion (US$ 818,805) and VND 20.23 billion (US$ 963,519) for a
95% confidence interval.
6 Discussion
116
CHAPTER 6: DISCUSSION
The study attempts to identify perception and attitudes of the local residents towards natural
forest protection, their WTP, and factors influencing their WTP; assess the livelihoods of rural
households who are contracted and allocated natural forest for protection, their WTA
compensation for natural forest protection, and factors influencing their WTA; evaluate costs of
protection of natural forest; and provide possible suggestions for strengthening the policy of
payment for forest protection related to PFES, REDD+, poverty alleviation, equity, local
involvement in decision-making, conditional payment, capacity building, and technical support.
6.1. Perception and attitudes of local residents towards natural forest
protection
The perception and attitudes of the local residents towards the role of forests in communities
and their WTP for forest protection show the possibility of increasing social and financial
support, which play an important role in the success of a protected area. The study showed that
the local residents are concerned about environmental quality in the area. They perceived that
reducing deforestation and protection of natural forests could be efficient ways to improve
environmental quality. They are willing to contribute finance to support the protection program.
However, they are uncertain about the equity of the mechanism of incentives distribution and
problems related to forest management could be resolved. The lack of a transparent, proper
distribution mechanism and a sufficient control system makes it possible to misuse forest
protection funds, generates corruption (Pham, 2014), and increases transaction costs, which
raises the concern of donors. Without strict compliance to a protection contract and strong law
enforcement, the forest services´ users become less willing to pay for the services.
The study results proved that understanding local perception and attitudes towards natural
forest protection and using it as a starting point to develop economic tools to evaluate the WTP
for environmental services is necessary to increase public support for forest protection at a local
scale.
6 Discussion
117
6.2. WTP and factors influence WTP
The local residents in Thai Nguyen province are willing to pay VND 43,000 (US$ 2.1) as a one-
time payment for Dinh Hoa forest protection. This amount is equivalent to about 0.04% of
annual income of households in Thai Nguyen province and 0.03% of annual income of
households in Vietnam. The amount estimated by our study is slightly lower than the amount of
recent studies in Southeast Asian related to payment for forest protection and conservation.
Vincent et al. (2014) estimated the WTP of households in Malaysia for the protection of Belum-
Temengo park to be about US$ 12 from logging and about US$ 8 from poaching (0.1% of annual
household income). Yoeu and Pabuayon (2011) found the WTP of households in the Tonle Sap
Biosphere reserve, Cambodia for the conservation of flooded forest to be about US$ 7 (1% of
annual household income).
The payment estimated by our study seems low, but it is understandable in an area where there
has never been any payment for forest protection or payment for environmental services in the
past. Our study found similarity with Truong (2008) who estimated the WTP of households in
Hanoi and Ho Chi Minh city for the conservation of Vietnamese Rihno to be US$ 2.5 (0.05% of
annual household income in Vietnam). As Vietnamese are unfamiliar with payment for
environmental services and biodiversity protection, the amount evaluated in our study is
considered affordable. The payment for natural resources protection is expected to increase in
the future when household incomes increase.
The result of this study showed no significant difference in payment level between residents in
urban areas and rural areas. Even though urban residents have higher incomes, higher education
levels, better access to information, greater awareness of environmental problems, and more
appreciation for natural resources, they are unlikely to be willing to pay more than rural
residents for forest protection.
Several factors were found to be significant in the WTP study. Payment level, previous forest
visits, an awareness of the forests´ public benefits, and household income are the factors which
influence the WTP. Demographic characteristics such as age, gender, household size, education,
ethnic, and employment have no significant relationship to WTP. While payment level and
previous forest visits negatively affect WTP, the awareness of the forests´ public benefits and
household income influence the WTP positively. It is clear that a lower payment level for forest
6 Discussion
118
protection, a higher awareness of the forests´ public benefits and a higher household income
increases the probability of acceptance the payment offered.
The negative relationship between previous forest visits and the WTP reflects that the
respondents, who visited Dinh Hoa forest, tend to be less willing to pay than those never visited
before. These findings contrast with the hypothesis that people who had visited Dinh Hoa forest
might be aware of the forests´ situation and appreciate the forests´ public benefits, and thus be
more willing to pay than those who had never visited. One potential reason might be that
people consider Dinh Hoa forest as a recreational site (Dinh Hoa Safety Zone, a national
historical site, is one part of Dinh Hoa forest) rather than a source environmental services. Since
they already visited Dinh Hoa forest once to several times, instead of paying for Dinh Hoa forest
protection, they might be interested in paying for other places for future visits.
6.3. Livelihoods of forest dependent households
The rural households in Dinh Hoa district are poor, mainly belong to minority ethnic groups
(more than 70%), and rely on agricultural activities for self-consumption, i.e., most agricultural
and forest products are used for subsistence purposes. Each household manages and protects
small (3 ha) and scattered forest land; and few of them have received payment for forest
protection for several years. Forest products such as fuelwood, timber, bamboo, and palm tree
products are important to local households. The share of forest income to total household
incomes (21%) is significant. These findings are similar to the results found by Neupane (2015)
who conducted a survey in Dinh Hoa district to assess the jurisdictional reduced emissions from
deforestation and forest degradation implementation. A forest dependent household in
Indonesia earned a similar proportion of forest income between 20% to 30% (Purnamasari,
2008). Early studies by Vedeld et al. (2007) and Vedeld et al. (2004) estimated average forest
income contribution was 22%, the third most important income after off-farm income and
agricultural income (crops and livestock). Our findings are consistent with previous results.
The average income per capital of forest dependents estimated by the study (US$ 500) is
significantly lower than average income of Thai Nguyen province (US$ 1,400) (TSO, 2012) and
Vietnam (US$ 1,800) (FAO, 2015a). Hence, an additional income from forest protection is
needed to improve local livelihoods and increase their contribution to poverty alleviation.
6 Discussion
119
6.4. WTA and factors influence WTA
The mean WTA of the households allocated and contracted natural forest in Dinh Hoa estimated
by this study of US$ 19/ha/year is four times higher than the current payment level paid by
provincial FPDF for forest protection and development (US$ 4.8), and two times higher than
average level of the PFES in Vietnam (USD$ 11) (Pham, 2014).
The PFES program pays between US$ 14 and US$ 21 per ha per year to forest owners and forest-
contracted households in Lam Dong, US$ 11 in Son La (Pham et al., 2013), US$ 10 in Bac Kan
(Dam et al., 2013), between US$ 0.1 (for landscape protection) and US$ 10 (forest protection) in
Gia Lai, and between US$ 1 (for landscape protection) and US$ 22 (forest protection) in Yen Bai
(Pham, 2014). Trinh and Rañola (2011) conducted a contingent valuation survey in Son La
province and found the WTA for participation in forest management of upland farmers in the
Northwest mountainous region of Vietnam to be US$ 14. Compared to the amount paid by PES
programs in Costa Rica and Ecuador (about US$ 60/ha/year) (FONAFIFO, CONAFOR and Ministry
of Environment, 2012; Porras et al., 2013), the payment of US$ 19/ha/year estimated by our
study is three times lower. But this amount affordably fit the local context and is in line with the
range of payment levels of PFES program in Vietnam.
The level of payments expected by the households depends upon the types of forests contracted
and allocated to them. Households who are contracted and allocated natural production forests
require payments two times higher compared to the households contracted protection and
special-use forests. Two plausible reasons might explain for this divergence: i) the area of forests
they were contracted and allocated, and ii) the differing use rights over the forest types. Firstly,
the average area of production, protection, and special-use forests contracted to the households
are 0.8 ha, 6.7 ha, and 2.8 ha, respectively. The possession of smaller area of the production
forest resulted in the higher monetary expectation. Secondly, there are higher restrictions on
the use of protection and special-use forests compared to the use of production forests (Dang et
al. 2012). Due to the right to access to the forests, households contracted production forests
enjoy greater benefits compared to other forests. The greater benefits imply the higher
opportunity costs for forest protection, and thus households contracted and allocated
production forest demand higher compensation.
The WTA is influenced by the level of payment, the ethnic group, income, natural forest land
6 Discussion
120
area, plantation forest allocated, distance to the forests, and the NTFPs. The WTA has a positive
relationship to the level of payment, forest land area contracted, and plantation forest allocated
and a negative relationship to the ethnic group and distance to the forests. The effects of these
factors are constant with the findings of Bush et al. (2013), Minten (2003), Shyamsundar and
Kramer (1996), and Trinh and Rañola (2011).
Income is an important variable to many WTA and WTP studies. Ma et al. (2009) found that
lower income respondents are more likely willing to accept the compensation than higher
income respondents as they consider that amount of payment as an additional income. On the
contrary, Dolisca et al. (2006) concluded that higher income respondents, who are more aware
of the consequences of deforestation, are more willing to accept. In the case study of Dinh Hoa
district, income has an opposing influence on the WTA: positive in special-use forest model and
negative in production forest model. Two reasons mentioned above might explain why income
variable has an opposing influence on the WTA. In our models, opportunity cost of labor might
be another reason. If we look at the income proportion, the non-farm incomes of households
allocated and contracted production forest is nearly three times higher than those allocated and
contracted special-use forest. Hence, it is understandable that higher income households which
are allocated and contracted production forest tend to be less willing to accept payments
offered than those allocated and contracted special-use forest.
The types of the forest products, i.e., bamboo, palm tree products etc. collected by the
households also affect the acceptance of the bid in opposite direction. Households which
collected bamboo require lower payment level, while households which collected palm tree
products demand higher compensation. Bamboo is commonly collected for self-consumption,
and thus contributes less to the total household cash income, whereas palm tree products such
as palm vein, stem, and leaf are used for commercial purposes. The different purposes for using
NTFPs might explain the different effects of NTFPs on the WTA of households in the WTA survey.
6.5. Costs of natural forest protection
If the project is implemented, the five-year natural forest protection project in Dinh Hoa district
would cost VND 18.7 billion (US$ 891,162). As a whole, the population in Thai Nguyen province
could contribute VND 12.5 billion (US$ 593,810) in a one-time payment. It is evident that
residents in That Nguyen province can afford to finance two thirds of the total project costs
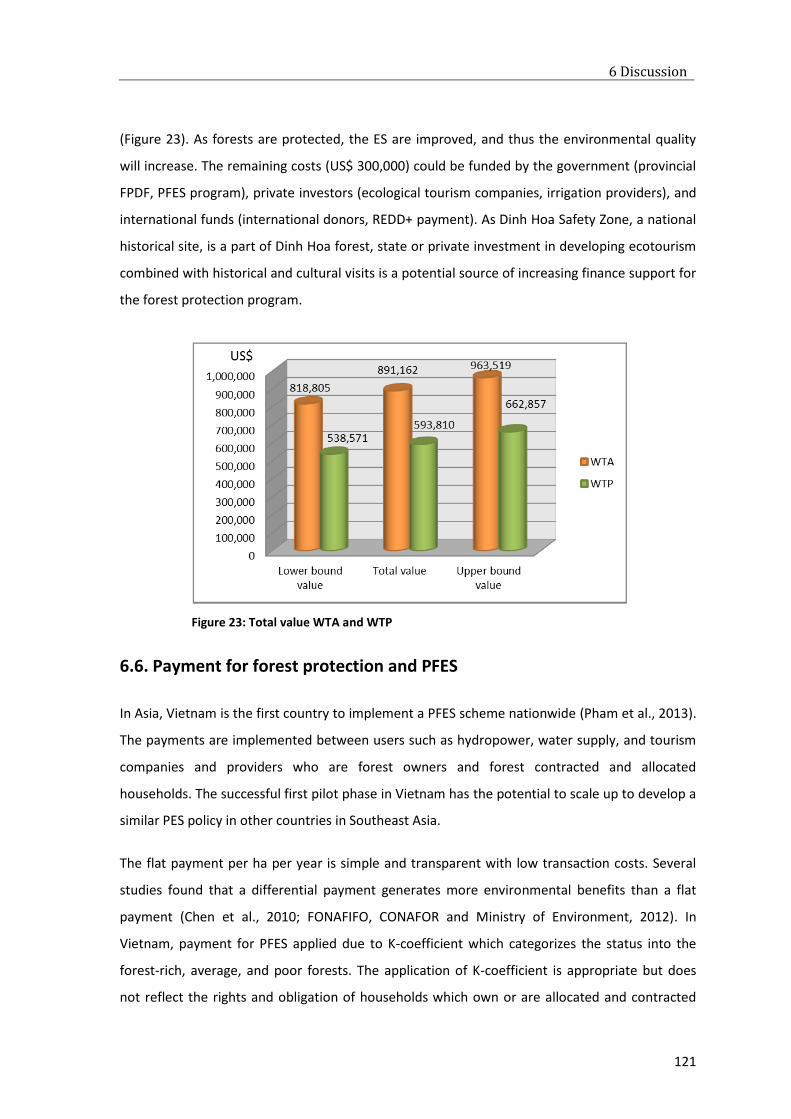
6 Discussion
121
(Figure 23). As forests are protected, the ES are improved, and thus the environmental quality
will increase. The remaining costs (US$ 300,000) could be funded by the government (provincial
FPDF, PFES program), private investors (ecological tourism companies, irrigation providers), and
international funds (international donors, REDD+ payment). As Dinh Hoa Safety Zone, a national
historical site, is a part of Dinh Hoa forest, state or private investment in developing ecotourism
combined with historical and cultural visits is a potential source of increasing finance support for
the forest protection program.
Figure 23: Total value WTA and WTP
6.6. Payment for forest protection and PFES
In Asia, Vietnam is the first country to implement a PFES scheme nationwide (Pham et al., 2013).
The payments are implemented between users such as hydropower, water supply, and tourism
companies and providers who are forest owners and forest contracted and allocated
households. The successful first pilot phase in Vietnam has the potential to scale up to develop a
similar PES policy in other countries in Southeast Asia.
The flat payment per ha per year is simple and transparent with low transaction costs. Several
studies found that a differential payment generates more environmental benefits than a flat
payment (Chen et al., 2010; FONAFIFO, CONAFOR and Ministry of Environment, 2012). In
Vietnam, payment for PFES applied due to K-coefficient which categorizes the status into the
forest-rich, average, and poor forests. The application of K-coefficient is appropriate but does
not reflect the rights and obligation of households which own or are allocated and contracted
6 Discussion
122
forests among three types of forests in benefit sharing. In the case of Vietnam, the rights and the
obligations of the forest land holders depend on the type of forest. As our study shows that
households allocated and contracted different types of forest require different payment level,
the PFES should consider different payment levels due to different types of forest to compensate
opportunity costs, and thus satisfy and encourage the local participation.
The levels of payment for PFES (US$ 11/ha/year) and of provincial FPDF (US$ 5/ha/year) are not
realistic for forest owners and forest allocated and contracted households in many provinces. As
the payment is not equal to opportunity costs, the providers are not interested in providing the
ES. Our study is a PES-like experiment to identify the opinions and preferences of the local public
towards the policy implementation and decision-making. The WTA estimated by the study
strengthens the argument that the level of payment currently made by the government needs to
be raised to meet local expectations.
The PFES in Vietnam comes from hydropower, water supply, and tourism companies. When the
forests are protected, ES are increased and improved in both quality and quantity, and thus
residents in a particular area where forests are protected can enjoy larger benefits from ES.
Additionally, the amount of payment by the state is limited because of many other competing
priorities. Our study shows that residents in a province are willing to voluntarily contribute to
forest protection, if and only if the benefits distribution mechanism and monitor system are
transparent, effective, and equitable. Diversity funding sources can contribute to sustainability
of the transaction. A legislative framework to enable private investment (NTFPs enterprises,
tourism enterprises) is necessary. To involve the public in these transactions, environmental
education and an information campaign on PES are necessary to gain public awareness.
6.7. Payment for forest protection and REDD+
Payment for forest protection creates economic incentives and rewards land managers for
implementing practices that enhance forest resources. REDD+ pursues rewards to governments,
companies, or forest owners in developing countries for keeping tropical forests (Namirembe,
2011). Payment for forest protection motivates communities to protect and conserve forest
areas, and thus addressing REDD+ objective. Protection of forest that reduces deforestation and
forest degradation is enabling to receive REDD+ payment. As payment from developing
government is restricted, REDD+ payment is able to be substantial financial resources. Vietnam
6 Discussion
123
has finished the first phase of the UN-REDD program (2009-2011) to establish a national REDD+
network and moved to the second phase (2012-2015) to test the scheme of payment for carbon
sequestration to development payment legal frameworks. Our experiment of payment for forest
protection provides an economic rationale for implementing REDD payment in Vietnam,
presents a tool for REDD+ to minimize participation costs and time, and allows productive
activities to work alongside REDD+.
6.8. Payment for forest protection and poverty alleviation
Forest protection generates incomes, capital, and employment opportunities for forest
dependents who are often poor and vulnerable. The protection program will be a success if
focus is placed on balancing ecosystem and societal outcomes and harmonizing community
livelihoods and ecosystem conservation. A forest protection program should be designed with
attention to poverty reduction and food security.
Our study found that households allocated and contracted forests for protection are poor and
rely heavily on agricultural cultivation. The current payment to households and individuals for
forest protection accounts for 0.6% of the total household incomes. This finding is similar to the
contribution of income from forest protection estimated by Wunder (2005), which is around 1-
2% of the household incomes. Increased forest protection may improve the livelihoods of poor
farmers. A problem, however, is that the forests they have been contracted and allocated are
too small and scattered, which increases the management costs. In this context, the current
payment for protection of forests made by provincial FPDF is unreasonable in terms of poverty
alleviation.
Lessons from successful pilot phase of PFES in Lam Dong province in the Central Highlands,
Vietnam and PES implementation in Latin America prove that local farmers are interested in PES
programs if their protection land is equal to or larger than 20 ha/household (Chiramba et al.,
2011; FONAFIFO, CONAFOR and Ministry of Environment, 2012). To improve the equity between
farmers, Ecuador´s Socio Bosque conservative program pays highest payment level per ha for 20
ha forest or less. For the following forest land more than 20 ha, the payment levels are lower
(FONAFIFO, CONAFOR and Ministry of Environment, 2012). Reallocation of higher forest land to
rural households to ensure forest protection contributes to household incomes is a possible way
to create higher income and more incentives for local participation.
6 Discussion
124
Forest protection should be combined with rural development (agroforestry) to realize other
business opportunities. Better quality forests support soil fertility to improve productivity of
agroforestry. In the case study in Dinh Hoa district, besides main crops, tea plants, which
contribute considerably to household incomes, are integrated in the lowland forest areas.
However, poor rural households lack access to stable markets and prices, which are controlled
by middlemen. Because of low volumes produced, they are unable to market their products.
Organizing farmers into marketing groups with technical support is one solution to link with
niche markets and stabilize the markets for agricultural outputs.
Allowing NTFPs collection, establishing agroforestry systems, intensifying agricultural and
livestock on non-forest land along with incentives for forest protection, setting up producing
NTFPs and ecotourism enterprises to generate employment and incomes for the local
population are options for gradually alleviating poverty.
6.9. Payment for forest protection and equity
Payment for forest protection projects seek for the equity of policies affecting the most
vulnerable stakeholder groups such as poor, women, ethnic minorities (FONAFIFO, CONAFOR
and Ministry of Environment, 2012). They seem to have lower WTA due to low opportunity
costs. Our study shows two thirds of participant belongs to minority ethnic groups; half of them
are women responsible for working in the forest; most are poor and rely heavily on agricultural
activities. To encourage these vulnerable groups to be more involved in forest protection
projects, special contracts with indigenous, poor, and women may give them more access.
Because of the small area of forest landholdings and low payment per ha, the payment
mechanism with higher payment per ha for smaller landholdings may bring more incentives to
poor and small-scale farmers.
6.10. Payment for forest protection and local involvement in decision
making
Households in our study which have been allocated and contracted forests for protection mostly
belong to minority ethnic groups. Few households are aware of contract terms though these
contracts directly affect their rights and obligations and all communities. Local people do not
know and do not fully understand their rights. Their complaints about delayed payments are not
6 Discussion
125
forwarded to higher-level officials. Consequently, communities and households are kept out of
direct decision-making.
To date, payment for forest protection in many regions is used as a command-and-control
instrument rather than an economic incentive (Wunder, 2005a). The lack of voice and choice of
the locals explains the unreasonable and unrealistic payment policy. Compensation expected for
natural forest protection is far higher than the current payment made available by the
government. Their suggestions and comments must be strongly considered, otherwise, it will be
impossible to change the local behavior towards sustainable forest management. In the long
term, payments for the forest protection need to combine with capacity development,
knowledge sharing, and risk alleviation. All stakeholders should be involved at all levels of
governance and administration to strengthen cooperation. Policymakers must understand,
evaluate, and manage within this framework.
6.11. Conditional payment for forest protection
In the PES surveys conducted in several provinces in Vietnam, Wunder (2005a) found no
evidence of punishment or withdrawal of forest land use right in cases of incompliance with
contract terms. Our study found similar results. The complex and complicated administrative
management, the poor implementation of monitoring, report, and verifying, and the poor
understanding of contract terms are the main reasons causing contract incompliance. Only a
small portion of households allocated and contracted forests actual receive payment from the
government, and thus they have no motivation to comply with the contract terms. As current
payment for forest protection made available by the government is considered as an instrument
of command-and-control system rather than an economic incentive, the monitoring, report, and
verifying of contract compliance are very weak or ignored.
To ensure the sustainability of the payment for the long term and encourage payment from
public ES users, the conditional payment is a must. A regularly communicated management plan
is required for patrolling the forest, managing forest fires, and tracking the condition of the
forests. In order to achieve the protection targets, the monitoring and verification system should
be clear, baselined, and flexible. Setting up relevant criteria and indicators of measurement and
inspection ensures that evaluations can be made efficiently. The payment should be made along
with the verification that no land use changes have taken place. Participants who terminate,
6 Discussion
126
cancel, or fail to comply with the forest protection contract will have to return a portion of the
incentives received. Beneficiaries should have a plan for how they will use payments, including
for family consumption. A payment level equal or above opportunity costs may bring a high level
of contract compliance.
6.12. Payment for forest protection and capacity building and technical
support
Poor participants of forest protection projects may face obstacles such as high transaction costs,
complicated procedures, poor understanding of contract terms, and limited education and
literacy. Given the very low amount of payment for forest protection, the locals have fewer
opportunities for capacity building and technical support. Our findings provide not only rationale
of economic incentives for households allocated and contracted forest land, but also potential
financial support from the public. These contributions from the public can be a supplemented
resource for capacity building and technical support. Payments alone, however, cannot solve
problems. Cash payments should be combined with nonmonetary benefits of improving the
efficiency of protection projects. Investment in human capital and capacity building is an
important target of a forest protection project. Forest protection programs contribute to the
development of rural areas by providing a clear legal and institutionalized framework, offering
technical assistance, investing in infrastructure, providing bank loans for agricultural production,
training and support to implement participants´ investment plan, and improving the negotiation
power of the local population.
7 Conclusion
127
CHAPTER 7: CONCLUSION
The global deforestation rate has decreased in recent years due to improvements in forest
management and greater government protection (FAO, 2015b). Payments for forest
management and protection aim to promote sustainable forest management by
compensating farmers and landowners for their efforts to protect the forest and by
collecting payments from ecosystem services users. The majority of PES programs is funded
by the governments and involves non-government organizations. To date, there has been
no comprehensive study to assess and identify the preferences towards natural forest
protection on the part of both ecosystem services providers (i.e., forest farmers and
landowners) and ecosystem services users (i.e., the rest of the local population).
This study was conducted to understand the preferences and attitudes of the local
population towards the protection of natural forests from both the ecosystem services
provider´s and user´s point of view. The object was to find a consensus between ecosystem
services providers and users to ensure sustainable forest management. Since PFES scheme
are being implemented nationwide in many provinces in Vietnam, including Thai Nguyen
province, this study provides useful information from both local forest farmers, who are
contracted and allocated forests for protection, and the local population in general. Our
study is a PES-like experiment to identify the opinions and the preferences of the local
population towards policy implementation and decision-making. The results of this study
confirm that the payment level expected by local households and individuals as
compensation for their forest protection is much higher than the current payment level.
The study suggests that raising the level of compensation will positively influence local
behavior towards sustainable forest management. The effective level of compensation
estimated by the study supports the argument that in order to meet local expectations, the
level of payment currently made for forest protection by the government needs to be
increased.
7 Conclusion
128
Tropical deforestation and forest degradation accounts for approximately 17% of global
greenhouse gas emissions (Metz et al., 2007). Reducing emissions from tropical
deforestation and forest degradation is widely accepted to be the key and least expensive
way to fight against global warming. PES and PES-like approaches can be used as economic
tools to help inform the design and implementation of REDD+ programs (Bond et al., 2009).
PFES and REDD+ are complex and have a potential conflicting framework of social,
environmental, and economic issues. They require regular economic and social surveys to
assess the impacts of payment policy on local livelihoods to determine incentives for
sustainable forest protection in the long term.
The study provides an economic rationale and builds the foundation for implementing PFES
and REDD payment in Vietnam that will minimize participation costs and time investments,
and allow productive activities to be carried out alongside REDD+. These findings
empirically suggested a maximum payment level for forest environmental services users
and a minimum compensation level for forest environmental services providers that match
local expectations, considering to the variance in use-rights of the different forest types.
The study shows possible applications of the contingent valuation method to identify
economic incentives for forest protection in a developing country. The study reflects a
theoretical approach that can be implemented in various contexts, paying attention to
cultural dimension, complexity of local populations, and environmental systems. WTA and
WTP are used as market-based approaches to measure the price of protection of natural
resources and assess structure of households´ livelihoods to understand the underlying
factors that influence the local behaviors. WTA and WTP are used as a proxy to develop
incentive systems that are not only giving money but also building capacity through
education and training skills.
Focusing on individual households provides a better fit to the diverse socio-economic,
cultural, and geographic character of the region. Payments for forest protection motivate
local households to the direction of PES, provide additional income by compensating their
protection efforts, create jobs, and contribute to the livelihoods of local communities. A
good forest protection and management program would enhance the efficiency of natural
resources conservation, contribute to poverty alleviation, enable community capacity
7 Conclusion
129
building, and influence local decision making. This approach should be further developed
focusing on creating economic incentives for the willingness to protect forests.
The study shows the possible estimation of WTA and WTP in a small scale case study in
Dinh Hoa district, Thai Nguyen province. Replication of a similar approach under different
circumstances allows scaling up experience to address problems and understand payment
system in general.
8 References
130
References
Adamowicz, W., Louviere, J., Swait, J., 1998. Introduction to attribute-based stated choice methods.
Final Report to NOAA, US.
http://www.greateratlantic.fisheries.noaa.gov/hcd/statedchoicemethods.pdf.
Alberini, A., Kahn, J.R., 2006. Handbook on contingent valuation. Edward Elgar Publishing,
Cheltenham, 448 pp.
Arrow, K.J., Solow, R., Leamer, E., Portney, P., Radner, R., Schuman, H., 1993. Report of the NOAA
panel on contingent valuation. Federal Register 58, 4601–4614.
ATKFMB, 2013. Forest land allocation in Dinh Hoa district, Thai Nguyen province: Report of ATK Dinh
Hoa Forest Management Board.
Atkinson, G., Bateman, I., Mourato, S., 2012. Recent advances in the valuation of ecosystem services
and biodiversity. Oxford Review of Economic Policy 28 (1), 22–47.
Barbier, E., Acreman, M., Knowler, D., 1997. Economic valuation of wetlands: a guide for policy
makers and planners. Ramsar Convention Bureau, Gland, Switzerland, 127 pp.
Barbier, E.B., 2007. Valuing ecosystem services as productive inputs. Economic Policy 22 (49), 178–
229.
Barrett, C.B., Bulte, E.H., Ferraro, P., Wunder, S. (Eds.), 2013. Economic instruments for nature
conservation. In: Macdonald, D.W., Willis, K.J. Key Topics in Conservation Biology 2. John Wiley
& Sons, Oxford, 59-73.
Bateman, I., Carson, R.T., Day, B., Hanemann, W.M., Hanley, N., Hett, T., Jones-Lee, M., 2002.
Economic valuation with stated preference techniques: A manual. Edward Elgar, Cheltenham,
458 pp.
Bateman, I.J., Abson, D., Nicola, B., Darnell, A., Fezzi, C., Hanley, N., Kontoleon, A., Maddison, D.,
Morling, P., Morris, J., Mourato, S., Pascual, U., Perino G., Sen, A., Tinch, D., Turner, K., Valatin,
G. (Eds.), 2011. Economic values from ecosystems. In: The UK National Ecosystem Assessment
Technical Report, UK National Ecosystem Assessment, UNEP-WCMC, Cambridge, 1068-1151.
Bateman, I.J., Turner, K. (Eds.), 1993. Valuation of environment, methods and techniques: the
contingent valuation method. In: Kerry Turner R. Sustainable environmental economics and
management: Principles and practice. Belhaven Press, London, 120-191.
Bond, I., Grieg-Gran, M., Wertz-Kanounnikoff, S., Hazlewood, P., Wunder, S., Angelsen, A., 2009.
Incentives to sustain forest ecosystem services: A review and lessons for REDD. International
Institute for Environment and Development, London, 47 pp.
Bowen, H.R., 1943. The interpretation of voting in the allocation of economic resources. The
Quarterly Journal of Economics 58 (1), 27–48.
8 References
131
Brander, L.M., van Beukering, P., Cesar, H.S., 2007. The recreational value of coral reefs: A meta-
analysis. Ecological Economics 63 (1), 209–218.
Bush, G., Hanley, N., Moro, M., Rondeau, D., 2013. Measuring the local costs of conservation: A
provision point mechanism for eliciting willingness to accept compensation. Land Economics 89
(3), 490–513.
Calia, P., Strazzera, E., 1998. Bias and efficiency of single vs. double bound models for contingent
valuation studies: a Monte Carlo Analysis. Working paper, University of Cagliari.
Carson, R.T., Groves, T., 2007. Incentive and informational properties of preference questions.
Environmental and Resource Economics 37 (1), 181–210.
Carson, R.T., Hanemann, W.M. (Eds.), 2005. Chapter 17 Contingent valuation. In: Mäler, V., Valuing
Environmental Changes. Hanbook of Environmental Economics, volume 2, 821–936.
Carson, R.T., Wright, J., Carson, N. , Alberini, A., and Flores, N., 1995. A bibliography of contingent
valuation studies and papers. Natural Resource Damage Assessment Inc, La Jolla, Ca, 186 pp.
Carson, R.T., 2011. Contingent valuation: A comprehensive bibliography and history. Edward Elgar,
Cheltenham, 464 pp.
CEPF, 2012. Ecosystem profile: Indo-Burma biodiversity hotspot, 2011 update.
http://www.cepf.net/Documents/final.indoburma_indochina.ep.pdf.
Champ, P.A., Boyle, K.J., Brown, T.C., 2003. A primer on nonmarket valuation. Kluwer Academic
Publishers, Dordrecht, Boston, 576 pp.
Champ, P.A. (Ed.), 2003. Collecting survey data for nonmarket valuation. In: Patricia A.C., A Primer
on Nonmarket Valuation. Springer Netherlands, 59-98.
Champ, P.A., Moore, R., Bishop, R.C., 2009. A comparison of approaches to mitigate hypothetical
bias. Agricultural and Resource Economics Review 38 (2), 166–180.
Chen, X., Lupi, F., Viña, A., He, G., Liu, J., 2010. Using cost-effective targeting to enhance the
efficiency of conservation investments in payments for ecosystem services. Society for
Conservation Biology 24 (6), 1469–1478.
Chiramba, T., Mogoi, S., Martinez, I., Jones, T., 2011. Payment for Forest Ecosystem Services (PFES):
Pilot implementation in Lam Dong province, Vietnam. UN-Water International Conference.
Water in the Green Economy in Practice: toward Rio+20, Zaragoza, Spain. October 3-5, 2011.
CIA, 2014. The World Factbook.
https://www.cia.gov/library/publications/the-world-factbook/geos/vm.html.
Ciriacy-Wantrup, S.V., 1947. Capital returns from soil-conservation practices. Farm Economics 29 (4),
1181–1196.
Collins, N. Mark, Sayer, J.A., Whitmore, T.C., 1991. The conservation atlas of tropical forests: Asia
and Pacific. Macmillan, London, 256 pp.
Cummings, R.G., Taylor, L.O., 1999. Unbiased value estimates for environmental goods: A cheap talk
design for the contingent valuation method. American Economic Review 89 (3), 649–665.
8 References
132
Dam, V.B., Delia, C.C., Hoang, M.H., 2014. Importance of national policy and local interpretation in
designing payment for forest environmental services scheme for the Ta Leng river basin in
Northeast Vietnam. Environment and Natural Resources Research 4 (1), 39–53.
Dang, T.K.P., Turnhout, E., Arts, B., 2012. Dang, T.K.P., Turnhout, E., Arts, B., 2012. Changing forestry
discourses in Vietnam in the past 20 years Forest Policy and Economics 25, 31-41.
Davis, R.K., 1963. The value of outdoor recreation: an economic study of the Maine woods. Doctoral
Dissertation in Economics. Harvard University.
Diamond, P., Hausman, J.A., Leonard, G.K., Denning, M.A. (Eds.), 1993. Does contingent valuation
measure preferences? Experimental evidence. In: Hausman, J.A., Contingent valuation: A critical
assessment. North-Holland, Amsterdam, New York, 41-85.
Do, D.S., Le, Q.T. (Eds.), 2003. Forest policy trends in Vietnam. In: Inoue, M. and Isozaki, H., People
and forest - Policy and local reality in Southeast Asia, the Russian Far East, and Japan. Kluwer
Academic Publishers, 157-167.
Dolisca, F., Carter, D.R., McDaniel, J.M., Shannon, D.A., Jolly, C.M., 2006. Factors influencing farmers’
participation in forestry management programs: A case study from Haiti. Forest Ecology and
Management 236 (2-3), 324–331.
Durst, P.B., Waggener, T.R., Enters, T., Cheng, T.L., 2001. Forests out of bounds: Impacts and
effectiveness of logging bans in natural forests in Asia-Pacific. Food and Agricultural
Organization of the United Nations, Regional Office for Asia and the Pacific, Bangkok, Thailand,
207 pp.
Engel, S., Pagiola, S., Wunder, S., 2008. Designing payments for environmental services in theory and
practice: An overview of the issues. Ecological Economics 65 (4), 663–674.
Engel, S., Wunscher, T., Wunder, S. (Eds.), 2007. Increasing the efficiency of conservation spending:
the case of payments for environmental services in Costa Rica. In: Schmitt, C.B., Pistorius, T.,
Winkel, G., A global network of forest protected areas under the CBD: opportunities and
challenges. Kessel, Remagen, 149 pp.
FAO, 2009. Vietnam forestry outlook study. Working paper No. APFSOS II/WP/2009/09, Bangkok.
FAO, 2010. Global forest resources assessment 2010: Main report. Food and Agriculture
Organization of the United Nations, Rome, 340 pp.
FAO, 2013. Rice Market Monitor. Volume XVI - Issue No. 1.
http://www.fao.org/docrep/017/aq144e/aq144e.pdf.
FAO, 2014. The state of world fisheries and aquaculture: Opportunities and challenges. Food and
Agriculture Organization of the United Nations, Rome, 223 pp.
FAO, 2015a. GDP per capita.
http://data.worldbank.org/indicator/NY.GDP.PCAP.CD.
FAO, 2015b. Global forest resources assessment 2015: How are the world´s forests changing? Food
and Agriculture Organization of the United Nations, Rome, 56 pp.
8 References
133
FAO, 2015c. World tea production and trade: Current and future development. Food and Agriculture
Organization of the United Nations, Rome, 17 pp.
Ferraro, P.J., 2001. Global habitat protection: Limitations of development interventions and a role
for conservation performance payments. Conservation Biology 15 (4), 990–1000.
FIPI, 2010. Forest development and protection plan 2011-2020, Dinh Hoa District, Thai Nguyen
province.
Fleming, C.M., Bowden, M., 2009. Web-based surveys as an alternative to traditional mail methods.
Environmental Management 90 (1), 284–292.
FONAFIFO, CONAFOR and Ministry of Environment, 2012. Lessons Learned for REDD+ from PES and
Conservation Incentive Programs. Examples from Costa Rica, Mexico, and Ecuador, 164 pp.
Freeman, A.M., Herriges, J.A., Kling, C.L., 2014. The measurement of environmental and resource
values: Theory and methods. RFF Press, Abingdon, Oxon, New York, N.Y., 459 pp.
Gallai, N., Salles, J.-M., Settele, J., Vaissière, B.E., 2009. Economic valuation of the vulnerability of
world agriculture confronted with pollinator decline. Ecological Economics 68 (3), 810–821.
Garrod, G., Willis, K.G., 1999. Economic valuation of the environment: Methods and cases. Edward
Elgar, Cheltenham, 384 pp.
GSO, 2010. The 2009 Vietnam population and housing census: Completed results. General Statistics
Office Of Vietnam, Hanoi.
GSO, 2012. Average population by sex and by residence.
http://www.gso.gov.vn/default_en.aspx?tabid=467&idmid=3&ItemID=12940.
Haimo, C.R., 2010. Forest and forest land allocation in Vietnam: Some questions. CTA-Pro Poor
Forestry Project, SNV-Vietnam.
Hanemann, M., Loomis, J., Kanninen, B., 1991. Statistical efficiency of double-bounded dichotomous
choice contingent valuation. American Journal of Agricultural Economics 73 (4), 1255–1263.
Hanemann, W.M., 1991. Willingness to pay and willingness to accept: How much can they differ?
The American Economic Review 81 (3), 635–647.
Hanley, N., Barbier, E., 2009. Pricing nature: Cost-benefit analysis and environmental policy. Edward
Elgar, Cheltenham, 353 pp.
Hanley, N., Spash, C.L., 1993. Cost-benefit analysis and the environment. Edward Elgar, Aldershot,
Hants, England, 278 pp.
Heal, G., 2007. A celebration of environmental and resource economics. Review of Environmental
Economics and Policy 1 (1), 7–25.
Herriges, J.A., 1999. Measuring goodness of fit for the double-bounded logit model: Comment.
American Journal of Agricultural Economics 81 (1), 231–234.
Hess, J., To, T., 2010. Connecting local forest managers with beneficiaries: Payment for forest
environmental services in Vietnam - Policy brief. GTZ Vietnam, Hanoi.
8 References
134
Hoang, M.H., van Noordwijk, M., Pham, T.T., 2008. Payment for environmental services: Experiences
and lesson in Vietnam. Vietnam National University Publishing House, Hanoi.
ICO, 2013. Annual Review 2011/12 - 1. International Coffee Organization.
IPC, 2014. Pepper statistical yearbook 2013. International Pepper Community.
ITC, 2011. Export factsheet: Cashew nuts. International Trade Center.
IUCN, 2012. IUCN red list of threatened species: Version 2012.2. International Union for
Conservation of Nature. http://www.iucnredlist.org/search.
Jong, W.d., 2006. Forest rehabilitation in Vietnam: Histories, realities, and future. Center for
International Forestry Research, Bogar Barat, Indonesia, 76 pp.
Kahneman, D., Tversky, A., 1979. Prospect theory: An analysis of decision under risk. Econometrica
47 (2), 263–292.
Kanninen, B.J., 1993. Optimal experimental design for double-bounded dichotomous choice
contingent valuation. Land Economics 69 (2), 138–146.
Kanninen, B.J., Khawaja, M.S., 1995. Measuring goodness of fit for the double bounded logit model.
American Journal of Agricultural Economics 77 (4), 885–890.
Kareiva, P.M., Tallis, H., Ricketts, T.H., Daily, G.C., Polasky, S., 2011. Natural capital: Theory and
practice of mapping ecosystem services. Oxford University Press, Oxford, England, 365 pp.
Kissinger, G.M., Herold, M., Sy, V.D., 2012. Drivers of deforestation and forest degradation: A
synthesis report for REDD+ policy makers, Lexeme Consulting, Vancouver, Canada.
Kolinjivadi, V.K., Sunderland, T., 2012. A review of two payment schemes for watershed services
from China and Vietnam: The interface of government control and PES theory. Ecology and
Society 17 (4), 10.
Koninck, R.d., 1999. Deforestation in Viet Nam. IDRC, Ottawa, Ont., Canada, 101 pp.
Krosnick, J.A., Holbrook, A.L., Berent, M.K., Carson, R.T., Hanemann, W.M., Kopp, R.J., Mitchell, R.C.,
Presser, S., Ruud, P.A., Smith, V.K., Moody, W.R., Green, M.C., Conaway, M., 2001. The impact of
“No Opinion” response options on data quality. Public Opinion Quarterly 66 (3), 371–403.
Krutilla, J.V., 1967. Conservation reconsidered. The American Economic Review 57 (4), 777–786.
Lienhoop, N., 2004. Valuing wilderness preservation in Iceland using WTP and WTA: An investigation
into data collection modes. Dotoral Dissertation, UK.
Luoma-aho, T., 2004. Forest genetic resources conservation and management: Proceedings of the
Asia Pacific Forest Genetic Resources Programme (APFORGEN) Inception Workshop, Kepong,
Kuala Lumpur, Malaysia, 15-18 July, 2003. International Plant Genetic Resources Institute,
Serdang, Malaysia, 338 pp.
Ma, H., Lu, Y., Xing, Y., He, G., Sun, Y., 2009. Rural households' attitude and economic strategies
toward the conversion of cropland to forest and grassland program (CCFG): A case study in Qira,
China. Environmental Management 43 (6), 1039–1047.
8 References
135
MA, 2005. Ecosystems and human well-being: A framework for assessment. Island Press,
Washington, 245 pp.
Maguire, K.B., 2009. Does mode matter? A comparison of telephone, mail, and in-person treatments
in contingent valuation surveys. Environmental Management 90 (11), 3528–3533.
Maraseni, T.N., Neupane, P.R., Lopez-Casero, F., Cadman, T., 2014. An assessment of the impacts of
the REDD+ pilot project on community forests user groups (CFUGs) and their community forests
in Nepal. Environmental Management 136, 37–46.
MARD, 2001. Five million hectare reforestation program and partnership: Synthesis report. 5MHRP
Partnership Secretariat, International Coorperation Department, Ministry of Agricultural and
Rural development, Hanoi.
MARD, 2015. Forest Sector Development Report 2014. For distribution at the FSSP Annual Meeting
on 4 February, 2015.
MARD, MOF & MONRE, 2003. Vietnam national report on protected areas and development. Review
of Protected Areas and Development in the Lower Mekong River Region. Indooroopilly,
Queensland, Australia, 60 pp.
Marta-Pedroso, C., Freitas, H., Domingos, T., 2007. Testing for the survey mode effect on contingent
valuation data quality: A case study of web based versus in-person interviews. Ecological
Economics 62 (3-4), 388–398.
McElwee, P.D., 2012. Payments for environmental services as neoliberal market-based forest
conservation in Vietnam: Panacea or problem? Geoforum 43 (3), 412–426.
Metz, B., Davidson, O., Bosch, P., Dave, R., Mayer, L., 2007. Climate change 2007: Mitigation of
climate change. Contribution of Working Group III to the Assessment Report of the
Intergovernmental Panel on Climate Change. Cambridge University Press, Cambridge, 851 pp.
Minten, B., 2003. Compensation and cost of conservation payments for biodiversity, Cornell Food
and Nutrition Policy Program. Working paper No. 142.
Mitchell, R.C., Carson, R.T., 1989. Using surveys to value public goods: The contingent valuation
method. Resources for the Future. Johns Hopkins University Press, Washington, 463 pp.
MOF, 1993. Report on activities in 1993 and the overall activities for 1994. Ministry of Finance,
Hanoi.
MONRE, 2008. 4th country report: Vietnam´s implement of biodiversity convention. Report to the
Biodiversity Convention Secretariat. Ministry of Natural Resources and Environment.
https://www.cbd.int/doc/world/vn/vn-nr-04-en.pdf.
Mourato, S., 2014. Valuation of biodiversity and ecosystem services. Economics of Biodiversity and
Ecosystem Services Workshop, Cambridge, 20-21 September 2014.
Murphy, J.J., Stevens, T., Weatherhead, D., 2005. Is cheap talk effective at eliminating hypothetical
bias in a provision point mechanism? Environmental and Resource Economics 30 (3), 327–343.
8 References
136
Namirembe, S., 2011. Introduction to PES and REDD+: Implications for participating land managers.
Trainning Workshop on Payments for Ecosystem Services (PES) and Reducing Emissions from
Deforestation and Forest Degradation (REDD+), Narobi, Kenya, 8 August, 2011.
Neupane, P.R., 2015. Viability assessment of jurisdictional reduced emissions from deforestation and
forest degradation (REDD+) implementation in Vietnam. Doctoral Dissertation. University of
Hamburg.
Nguyen, N.B., 2001. Forest management systems in the uplands of Vietnam: Social, economic and
environmental perspectives. EEPSEA Research Report No. rr2001011. Economy and
Environment Program for Southeast Asia.
Nguyen, Q.T., 2011. Payment for environmental services in Vietnam: An analysis of the pilot project
in Lam Dong province. Forest Conservation Project. Occasional Paper 5.
Nguyen, T., Pham, T.N., 2014. Payment for environmental services in Southeast Asia: A regional
review of policy implementation. WorldFish (ICLARM), Laguna, Philippines, 60 pp.
Nguyen, Thi Y Ly, 2013. Evaluating the pilot implementation of payment for forest environmental
services in Lam Dong, Vietnam. Working paper number rr2013023. WorldFish (ICLARM), Laguna,
Philippines.
Ninan, K.N., 2009. Conserving and valuing ecosystem services and biodiversity: Economic,
institutional and social challenges. Earthscan, London, Sterling, VA, 402 pp.
NOAA, 1993. Report of the NOAA Panel on contingent valuation. National Oceanic and Atmospheric
Administration.
Nurse, M., Malla, Y., 2005. Advances in community forestry in Asia. Regional Communit Forestry
Training Center for Asia and the Pacific, Bangkok, Thailand.
Nyborg, K., 2014. Project evaluation with democratic decision-making: What does cost–benefit
analysis really measure? Ecological Economics 106 (2014), 124–131.
Pagiola, S., Arcenas, A., Platais, G., 2003. Ensuring that the poor benefit from payments for
environmental services. Workshop on Reconciling Rural Poverty Reduction and Resource
Conservation: Identifying Relationships and Remedies. Cornell University, Ithaca, New York. 2-3
May 2003.
Pagiola, S., Arcenas, A., Platais, G., 2005. Can payments for environmental services help reduce
poverty? An axploration of the issues and the evidence to date from Latin America. World
Development 33 (2), 237–253.
Pagiola, S., Platais, G., 2007. Payments for environmental services: From theory to practice. World
Bank, Washington.
Pagiola, S., Ritter, K.v., Bishop, J., 2004. Assessing the economic value of ecosystem conservation.
Environment Department Paper No.101. The World Bank.
Pagiola, S., 2007. Payments for environmental services in Costa Rica. Ecological Economics 65 (4),
712–724.
8 References
137
Pascal, U., Muradian, R., Brander, L., Gómez-Baggethun, E., Martínez-López, B., Berma, M., Christie
M. (Eds.), 2010a. TEEB Chapter 5 The economics of valuing ecosystem services and biodiversity.
In Kumar P., The Economics of Ecosystems and Biodiversity: The Ecological and Economic
Foundations. Taylor & Francis, London, 183-256.
Pascal, U., Muradian, R., Gómez-Baggethun, E., Armsworth, P., Brander, L., Cornelissen, H., Farley, J.,
Loomes, J., Martinez-Lospez, B., Pearson, L., Perrings, C., Polasky, S., Verma, M., 2010b.
Valuation of ecosystems services: Methodology and challenges. In Kumar, P. (Ed.), The
Economics of Ecosystems and Biodiversity: Ecological and Economic Foundations. Earthscan,
London, Washington, DC, 410 pp.
Pearce, D.W., Atkinson, G., Mourato, S., 2006. Cost-benefit analysis and the environment: Recent
developments. Organisation for Economic Co-operation and Development, Paris, 315 pp.
Pearce, D.W., Pearce, C., Palmer, C., 2002. Valuing the environment in developing countries: Case
studies. Edward Elgar, Cheltenham, 585 pp.
Pham, T.T., K., B., T.P., V., J., B., Le, N.D., Nguyen, D.T., 2013. Payments for forest environmental
services in Vietnam: From policy to practice. Center for International Forestry Research (CIFOR),
Bogor, Indonesia, 78 pp.
Pham, V.T., 2014. Implementation of Payment for Forest Environmental Services in Vietnam.
Forest Asia Summit 2014. Sustainable Landscapes for Green Growth in Southeast Asia. Jakarta,
5-6 May 2014.
Pokharel, R.K., Neupane, P.R., Tiwari, K.R., Köhl, M., 2015. Assessing the sustainability in community
based forestry: A case from Nepal. Forest Policy and Economics 58, 75–84.
Porras, I., Barton, D.N., Chacon-Cascante, A., Miranda, M., 2013. Learning from 20 years of payments
for ecosystem services in Costa Rica. International Institute for Environmental and Development,
London.
Prime Minister, 2008. Decision No.1134/QD-TTg of August 21st, 2008, approving the scheme on
forest protection and development in Dinh Hoa safety zone, Thai Nguyen province, in the 2008-
2020 period.
Purnamasari, R.S., 2008. Deforestation in Indonesia: A household level analysis of the role of forest
income dependence and poverty, CIFOR - PEN Workshop, Barcenola, 8-12 January 2008.
Qeiroz, J.S., Griswold, D., Nguyen, D.T., Hall, P., 2013. Vietnam tropical forest and biodiversity
assessment. United States Agency for International Development (USAID). US Foreign Assistance
Act, Section 118/119 Report.
Shyamsundar, P., Kramer, R.A., 1996. Tropical forest protection: An empirical analysis of the costs
borne by local people. Environmental Economics and Management 31 (2), 129–144.
Sikor, T. (Ed.), 1998. Forest policy reform in Vietnam: From state to household forestry. In: Mark, P.,
Stewards of Vietnam´s upland forest. Asia Forest Network, Berkeley, 18-37.
Silva, A., Nayga, JR., Rodolfo M., Campbell, B.L., Park, J.L., 2011. Revisiting cheap talk with new
evidence from a field experiment. Agricultural and Resource Economics 36 (2), 280–291.
Sloman, J., Wride, A., 2009. Economics. Pearson Education; 7 edition, Harlow, England, 835 pp.
8 References
138
Sloman, J., Wride, A., Garratt, D., 2012. Economics. Pearson Education; 8 edition, Harlow, England,
944 pp.
Sterner, T., 2003. Policy instruments for environmental and natural resource management.
Resources for the Future. World Bank, Swedish International Development Cooperation Agency,
Washington, 504 pp.
Subade, R.F., 2007. Mechanisms to capture economic values of marine biodiversity: The case of
Tubbataha Reefs UNESCO World Heritage Site, Philippines. Marine Policy 31 (2), 135–142.
Swanson, T.M., 2002. An introduction to the law and economics of environmental policy: Issues in
institutional design. Research in law and economics, 1st ed. JAI, Amsterdam, 540 pp.
Tacconi, L., Mahanty, S., Suich, H., 2010. Payments for environmental services, forest conservation,
and climate change: Livelihoods in the REDD? Edward Elgar, Cheltenham, 267 pp.
Thai Nguyen Province Committee, 2007. Report No. 45/NLN dated December 14, 2007 on forest
protection and development in Dinh Hoa safety zone, Thai Nguyen province, in the 2008-2020
period.
To, P.X., Dressler, W.H., Mahanty, S., Pham, T.T., Zingerli, C., 2012. The prospects for payment for
ecosystem services (PES) in Vietnam: A look at three payment schemes. Human Ecology: An
Interdisciplinary Journal 40 (2), 237–249.
To, T., Laslo, P., 2009. Piloting experience of payment for environmental services (PES) in the North
West of Vietnam. GTZ Vietnam, Hanoi.
To, X.P., Canby, K., 2011. EU FLEGT Facility, Baseline study 3, Vietnam: Overview of Forest Law
Enforcement, Governance and Trade. European Forest Institute - FLEGT Asia Regional Office,
Kuala Lumpur.
To, X.P., Sikor, T., 2006. Illegal timber logging in Vietnam: Who profits from forest privatization
connected with a logging ban?, The Eleventh Conference of the International Association for the
Study of Common Property. Bali, Indonesia, 19-23 June 2006.
To, X.P., Tran, H.N., 2014. Forest land allocation in the context of forestry sector restructuring:
Opportunities for forestry development and uplands livelihood improvement. Tropenbos
International Vietnam, Hue, Vietnam, 80 pp.
Trinh, Q.T., Rañola, R.F., 2011. Willingness to Accept Payment of Upland Farmers to Participate in
Forest Management in the Northwest Mountainous Region of Vietnam The Philippine
agricultural scientist 94 (1), 46–53.
Trinh, Q.T., Roberto, F. Rañola Jr., 2011. Willingness to accept payment of upland farmers to
participate in forest management in the Northwest mountainous region of Vietnam. Philippine
Agricultural Scientist 94 (1), 46–53.
Truong, D.T., 2008. WTP for conservation of Vietnamese Rhino. Economy and Environment Program
for Southeast Asia (EEPSEA).
TSO, 2012. The annual abstract of statistics of Thai Nguyen province (2011). General Statistics Office
Thai Nguyen, Vietnam.
8 References
139
UN, 2013. World statistics pocketbook. United Nations, New York, 239 pp.
UNCCC, 2007. Investment and financial flows to address climate change. United Nations Framework
Convention on Climate Change, 272 pp.
UNEP, 2008. Payments for ecosystem services: Getting started. A primer. UNON/Publishing Services
Section, Nairobi, 64 pp.
UNFPA, 2011. Ethnic groups in Vietnam: An analysis of key indicators from the 2009 Vietnam
population and housing census. The United Nations Population Fund (UNFPA), Hanoi, 62 pp.
UN-REDD, 2009. Revised standard joint programme document. UN-REDD Vietnam program, Hanoi.
UN-REDD, 2011. Final report on forest ecological stratification in Vietnam. UN-REDD program, Hanoi.
Vedeld, P., Angelsen, A., Bojö, J., Sjaastad, E., Kobugabe Berg, G., 2007. Forest environmental
incomes and the rural poor. Forest Policy and Economics 9 (7), 869–879.
Vedeld, P., Angelsen, A., Sjaastad, E., Berg, G.K., 2004. Counting on the environment: Forest incomes
and the rural poor. Environmental Economics Series. Paper No. 98. World Bank.
Venkatachalam, L., 2004. The contingent valuation method: A review. Environmental Impact
Assessment Review 24 (1), 89–124.
VFPD, 2012. Land and forest land allocation in Vietnam. Conference on Land Use and Management
of Moutainous Ethnic Communities. Vietnam Forest Protection Department, Hanoi.
Vietnam Government, 1998. Decision No. 661/QD-TTg og July 29, 1998 on the target, task, policy
and organization for the implementation of the project.
Vietnam Government, 2001. Decision No. 178/2001/QD-TTg of November 12, 2001 on the benefits
and obligations of households and individuals assigned, leased or contracted forests and forestry
land.
Vietnam Government, 2007. Decision No. 100/2007/QD-TTg of July 6, 2007, amending and
supplementing a number of articles of Decision No. 661/QD-TTg of July 29, 1998, on the targets,
tasks, policies and organization of implementation of the project on planting 5 million hectares
of forests.
Vietnam Government, 2010. Decree No. 99/2010/ND-CP on payment for forest environmental
services.
Vietnam National Assembly, 2004. Law on forest protection and development.
Vincent, J.R., Carson, R.T., DeShazo, J.R., Schwabe, K.A., Ahmad, I., Chong, S.K., Chang, Y.T., Potts,
M.D., 2014. Tropical countries may be willing to pay more to protect their forests. Proceedings
of the National Academy of Sciences of the United States of America 111 (28), 10113–10118.
WB, 2012a. World Bank Open Data.
http://data.worldbank.org/indicator/NV.AGR.TOTL.ZS/countries.
WB, 2012b. World Bank Open Data.
http://data.worldbank.org/indicator/SL.AGR.EMPL.ZS/countries.
WB, 2014. World development indicators 2014. World Bank Publications, Washington, 115 pp.

8 References
140
Whittington, D., 1989. Willingness to pay for water in Newala district, Tanzania: Strategies for cost
recovery. Water and Sanitation for Health Project (WASH), Arlington, VA, USA, 264 pp.
Whittington, D., 1990. Estimating the willingness to pay for water services in developing countries: A
case study of the use of contingent valuation surveys in southern Haiti. Economic Development
and Cultural Change, University of Chicago Press 38 (2), 293–311.
Whittington, D., Lauria, D.T., Choe, K., Hughes, J.A., Swarna, V., Wright, A.M., 1993. Household
sanitation in Kumasi, Ghana: A description of current practices, attitudes, and perceptions.
World Development 21 (5), 733–748.
Whittington, D., Smith, V., Okorafor, A., Okore, A., Liu, Jin Long, McPhail, A., 1992. Giving
respondents time to think in contingent valuation studies: A developing country application.
Environmental Economics and Management 22 (3), 205–225.
Whittington, D., 1998. Administering contingent valuation surveys in developing countries. World
Development 26 (1), 21–30.
Whittington, D., 2010. What Have We Learned from 20 Years of Stated Preference Research in Less-
Developed Countries? Annual Review of Resource Economics 2 (1), 209–236.
Wunder, S., 2005a. Payment is good, control is better: Why payments for forest environmental
services in Vietnam have so far remained incipient. Center for International Forestry Research,
Bogor, Indonesia, 61 pp.
Wunder, S., 2005b. Payments for environmental services: some nuts and bolts. Occasional Paper No.
42. CIFOR, Bogor.
Wunder, S., 2007. The efficiency of payments for environmental services in tropical conservation.
Society for Conservation Biology 21 (1), 48–58.
Yoeu, A., Pabuayon, I.M., 2011. Willingness to pay for the conservation of flooded forest in the Tonle
Sap Biosphere Reserve, Cambodia. International Journal of Environmental and Rural
Development (2011) 2-2.
Zhao, J., Kling, C.L., 2001. A new explanation for the WTP/WTA disparity. Economics Letters 73 (3),
293–300.
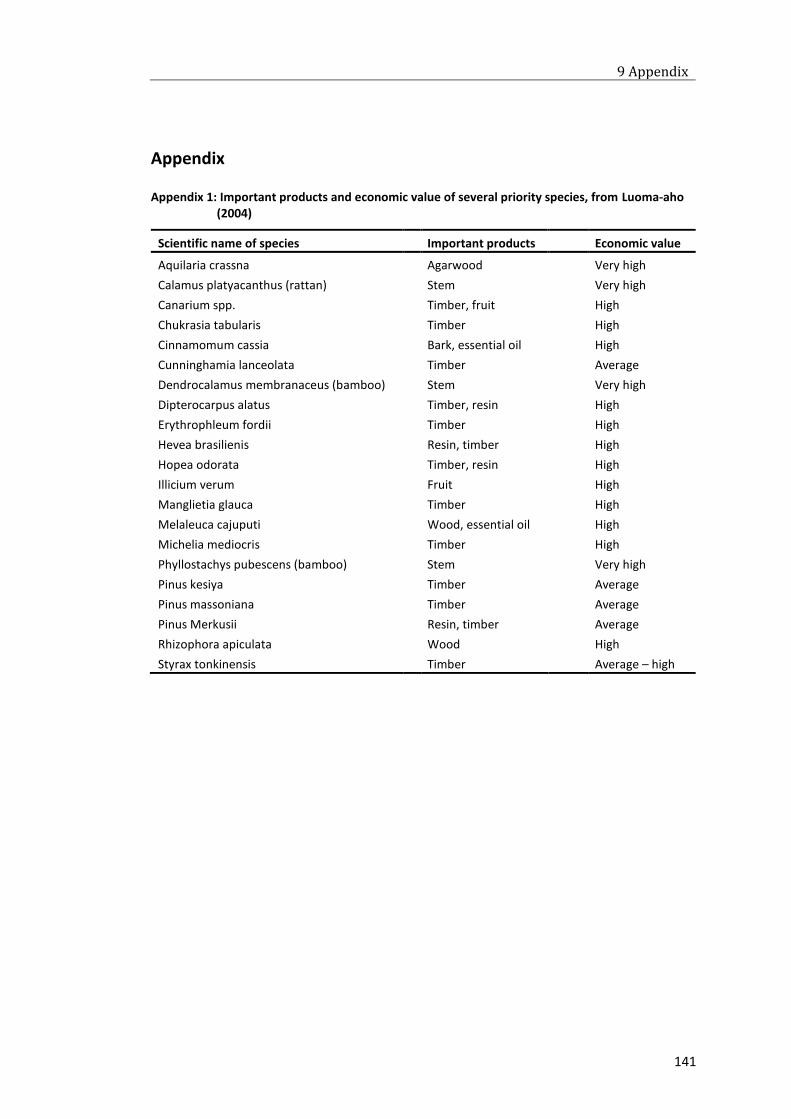
9 Appendix
141
Appendix
Appendix 1: Important products and economic value of several priority species, from Luoma-aho (2004)
Scientific name of species Important products Economic value
Aquilaria crassna Agarwood Very high
Calamus platyacanthus (rattan) Stem Very high
Canarium spp. Timber, fruit High
Chukrasia tabularis Timber High
Cinnamomum cassia Bark, essential oil High
Cunninghamia lanceolata Timber Average
Dendrocalamus membranaceus (bamboo) Stem Very high
Dipterocarpus alatus Timber, resin High
Erythrophleum fordii Timber High
Hevea brasilienis Resin, timber High
Hopea odorata Timber, resin High
Illicium verum Fruit High
Manglietia glauca Timber High
Melaleuca cajuputi Wood, essential oil High
Michelia mediocris Timber High
Phyllostachys pubescens (bamboo) Stem Very high
Pinus kesiya Timber Average
Pinus massoniana Timber Average
Pinus Merkusii Resin, timber Average
Rhizophora apiculata Wood High
Styrax tonkinensis Timber Average – high
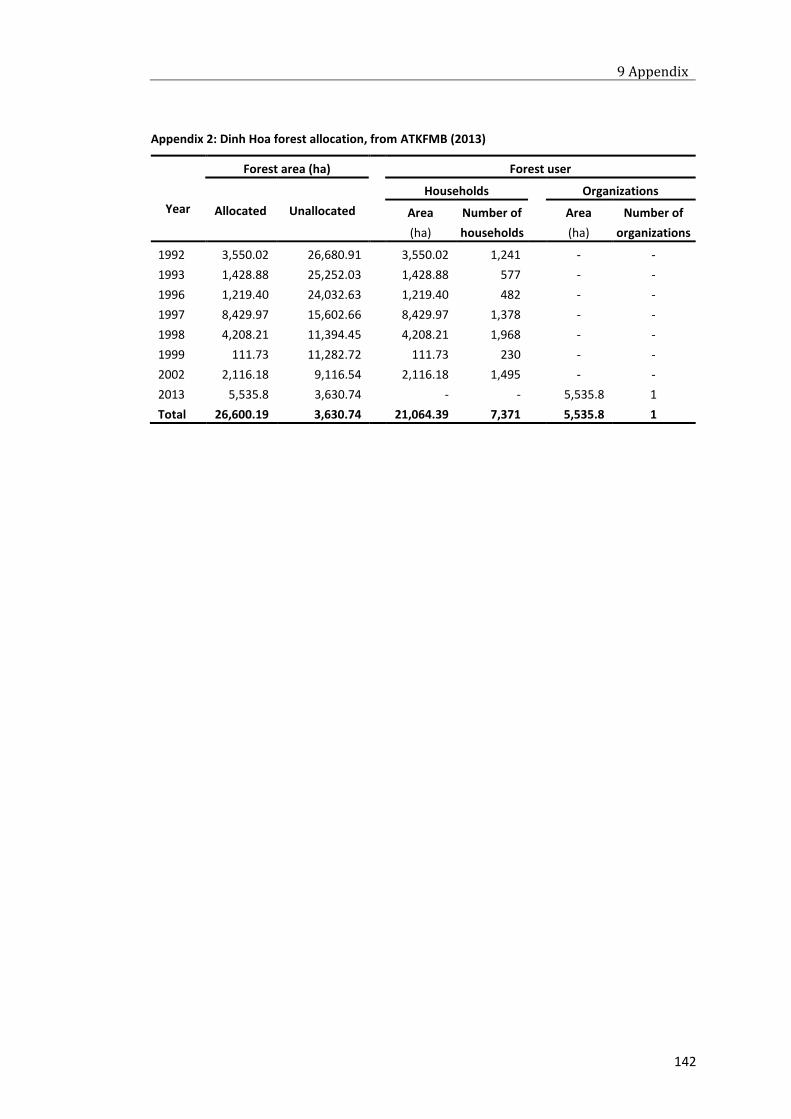
9 Appendix
142
Appendix 2: Dinh Hoa forest allocation, from ATKFMB (2013)
Year
Forest area (ha) Forest user
Allocated
Unallocated
Households Organizations
Area
(ha)
Number of
households
Area
(ha)
Number of
organizations
1992 3,550.02 26,680.91 3,550.02 1,241 - -
1993 1,428.88 25,252.03 1,428.88 577 - -
1996 1,219.40 24,032.63 1,219.40 482 - -
1997 8,429.97 15,602.66 8,429.97 1,378 - -
1998 4,208.21 11,394.45 4,208.21 1,968 - -
1999 111.73 11,282.72 111.73 230 - -
2002 2,116.18 9,116.54 2,116.18 1,495 - -
2013 5,535.8 3,630.74 - - 5,535.8 1
Total 26,600.19 3,630.74 21,064.39 7,371 5,535.8 1
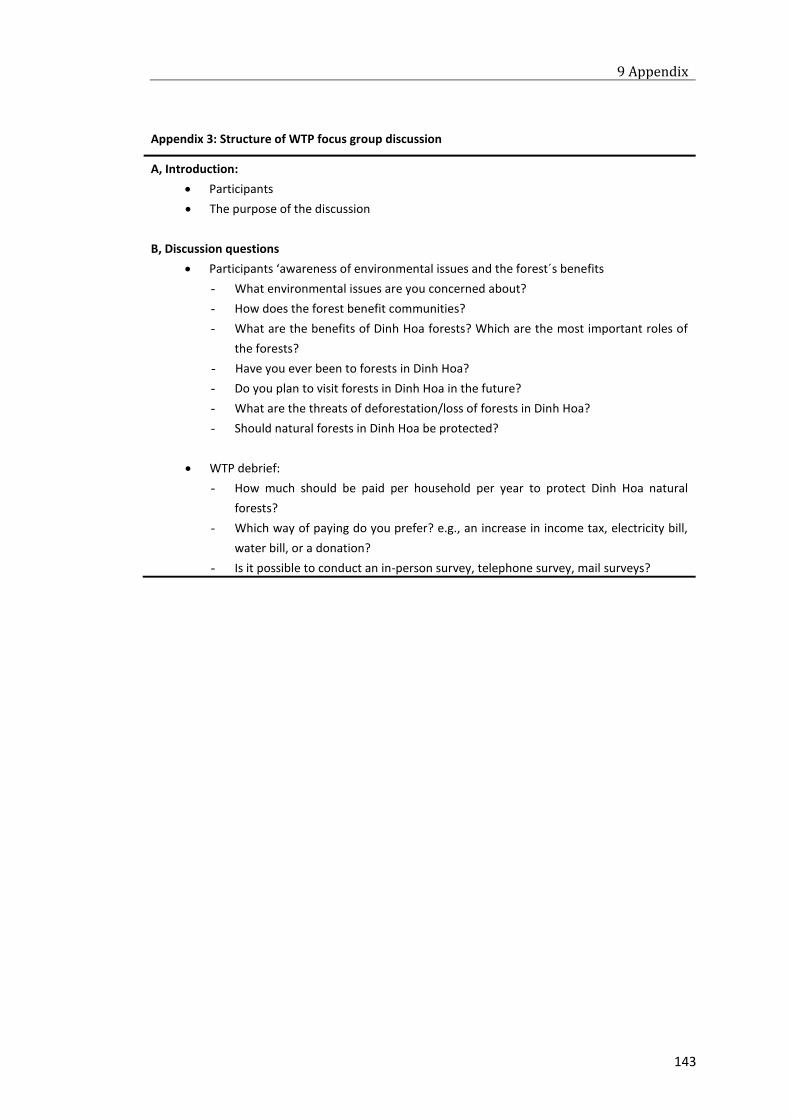
9 Appendix
143
Appendix 3: Structure of WTP focus group discussion
A, Introduction:
Participants
The purpose of the discussion
B, Discussion questions
Participants ‘awareness of environmental issues and the forest´s benefits
- What environmental issues are you concerned about?
- How does the forest benefit communities?
- What are the benefits of Dinh Hoa forests? Which are the most important roles of
the forests?
- Have you ever been to forests in Dinh Hoa?
- Do you plan to visit forests in Dinh Hoa in the future?
- What are the threats of deforestation/loss of forests in Dinh Hoa?
- Should natural forests in Dinh Hoa be protected?
WTP debrief:
- How much should be paid per household per year to protect Dinh Hoa natural
forests?
- Which way of paying do you prefer? e.g., an increase in income tax, electricity bill,
water bill, or a donation?
- Is it possible to conduct an in-person survey, telephone survey, mail surveys?
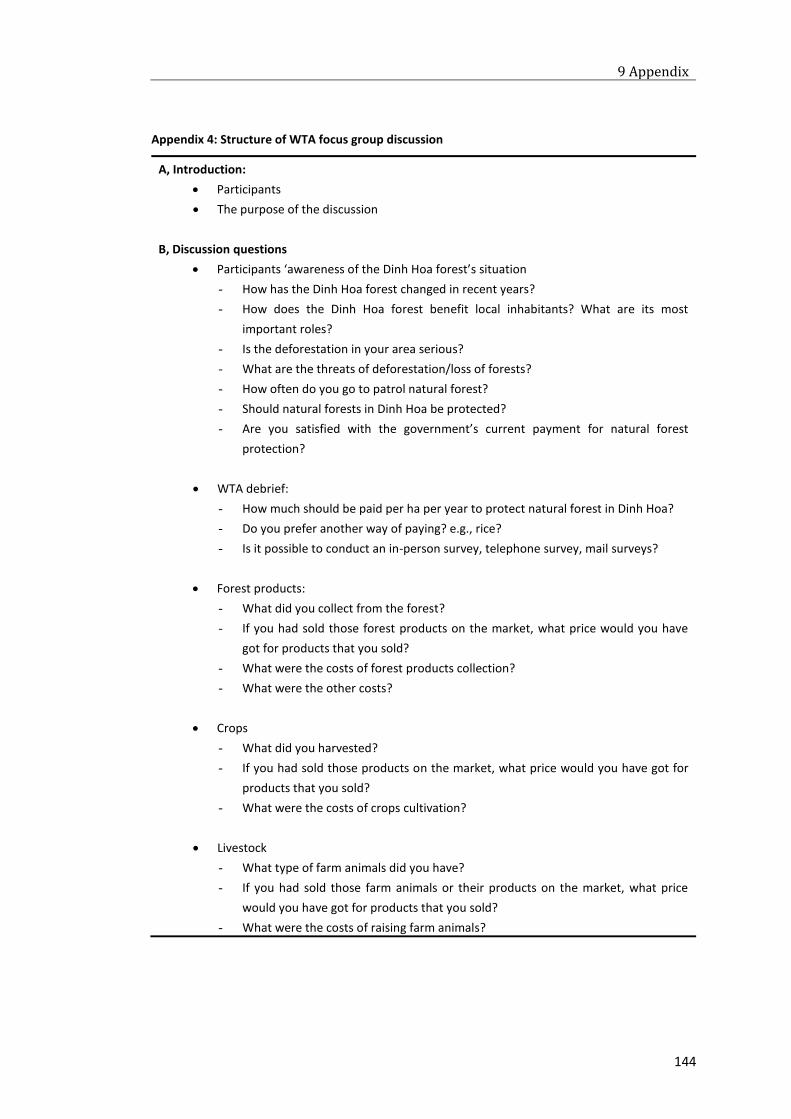
9 Appendix
144
Appendix 4: Structure of WTA focus group discussion
A, Introduction:
Participants
The purpose of the discussion
B, Discussion questions
Participants ‘awareness of the Dinh Hoa forest’s situation
- How has the Dinh Hoa forest changed in recent years?
- How does the Dinh Hoa forest benefit local inhabitants? What are its most
important roles?
- Is the deforestation in your area serious?
- What are the threats of deforestation/loss of forests?
- How often do you go to patrol natural forest?
- Should natural forests in Dinh Hoa be protected?
- Are you satisfied with the government’s current payment for natural forest
protection?
WTA debrief:
- How much should be paid per ha per year to protect natural forest in Dinh Hoa?
- Do you prefer another way of paying? e.g., rice?
- Is it possible to conduct an in-person survey, telephone survey, mail surveys?
Forest products:
- What did you collect from the forest?
- If you had sold those forest products on the market, what price would you have
got for products that you sold?
- What were the costs of forest products collection?
- What were the other costs?
Crops
- What did you harvested?
- If you had sold those products on the market, what price would you have got for
products that you sold?
- What were the costs of crops cultivation?
Livestock
- What type of farm animals did you have?
- If you had sold those farm animals or their products on the market, what price
would you have got for products that you sold?
- What were the costs of raising farm animals?
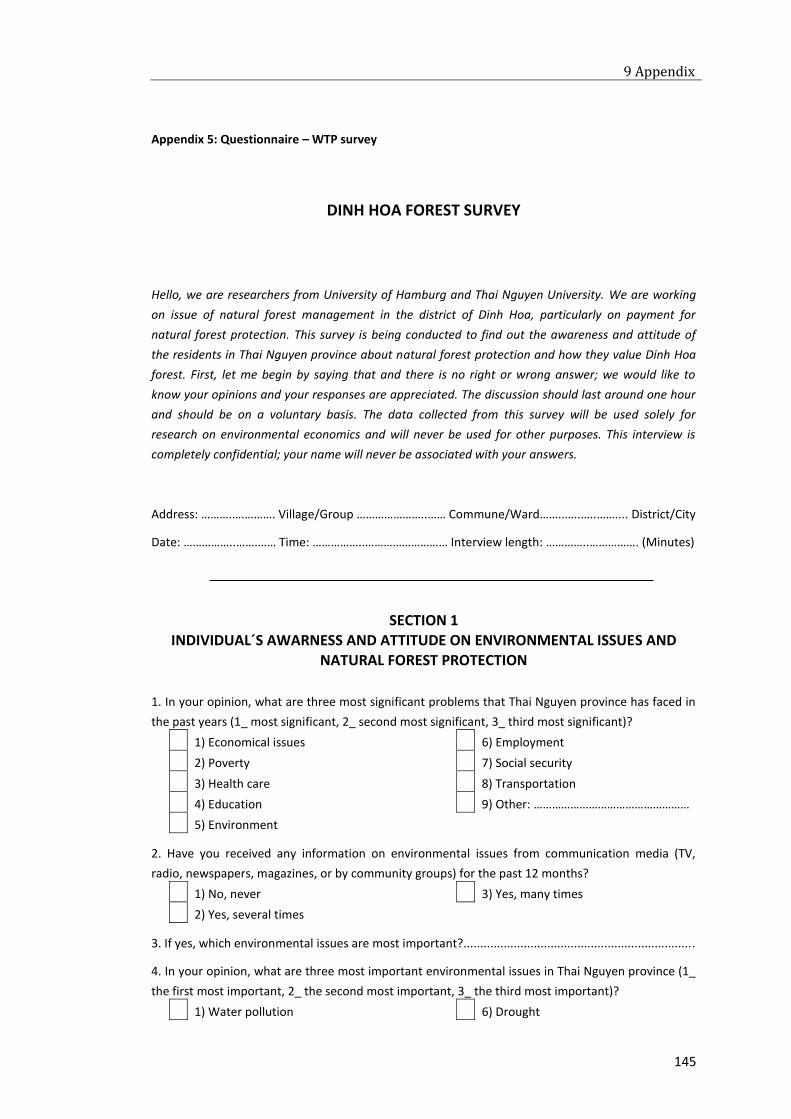
9 Appendix
145
Appendix 5: Questionnaire – WTP survey
DINH HOA FOREST SURVEY
Hello, we are researchers from University of Hamburg and Thai Nguyen University. We are working
on issue of natural forest management in the district of Dinh Hoa, particularly on payment for
natural forest protection. This survey is being conducted to find out the awareness and attitude of
the residents in Thai Nguyen province about natural forest protection and how they value Dinh Hoa
forest. First, let me begin by saying that and there is no right or wrong answer; we would like to
know your opinions and your responses are appreciated. The discussion should last around one hour
and should be on a voluntary basis. The data collected from this survey will be used solely for
research on environmental economics and will never be used for other purposes. This interview is
completely confidential; your name will never be associated with your answers.
Address: ……….….………. Village/Group …………………..…… Commune/Ward……..…..…..…….... District/City
Date: ……………..…….…… Time: ……………..……………………… Interview length: …………..……………. (Minutes)
SECTION 1
INDIVIDUAL´S AWARNESS AND ATTITUDE ON ENVIRONMENTAL ISSUES AND NATURAL FOREST PROTECTION
1. In your opinion, what are three most significant problems that Thai Nguyen province has faced in
the past years (1_ most significant, 2_ second most significant, 3_ third most significant)?
1) Economical issues 6) Employment
2) Poverty 7) Social security
3) Health care 8) Transportation
4) Education 9) Other: ……………………………………………
5) Environment
2. Have you received any information on environmental issues from communication media (TV,
radio, newspapers, magazines, or by community groups) for the past 12 months?
1) No, never 3) Yes, many times
2) Yes, several times
3. If yes, which environmental issues are most important?.....................................................................
4. In your opinion, what are three most important environmental issues in Thai Nguyen province (1_
the first most important, 2_ the second most important, 3_ the third most important)?
1) Water pollution 6) Drought
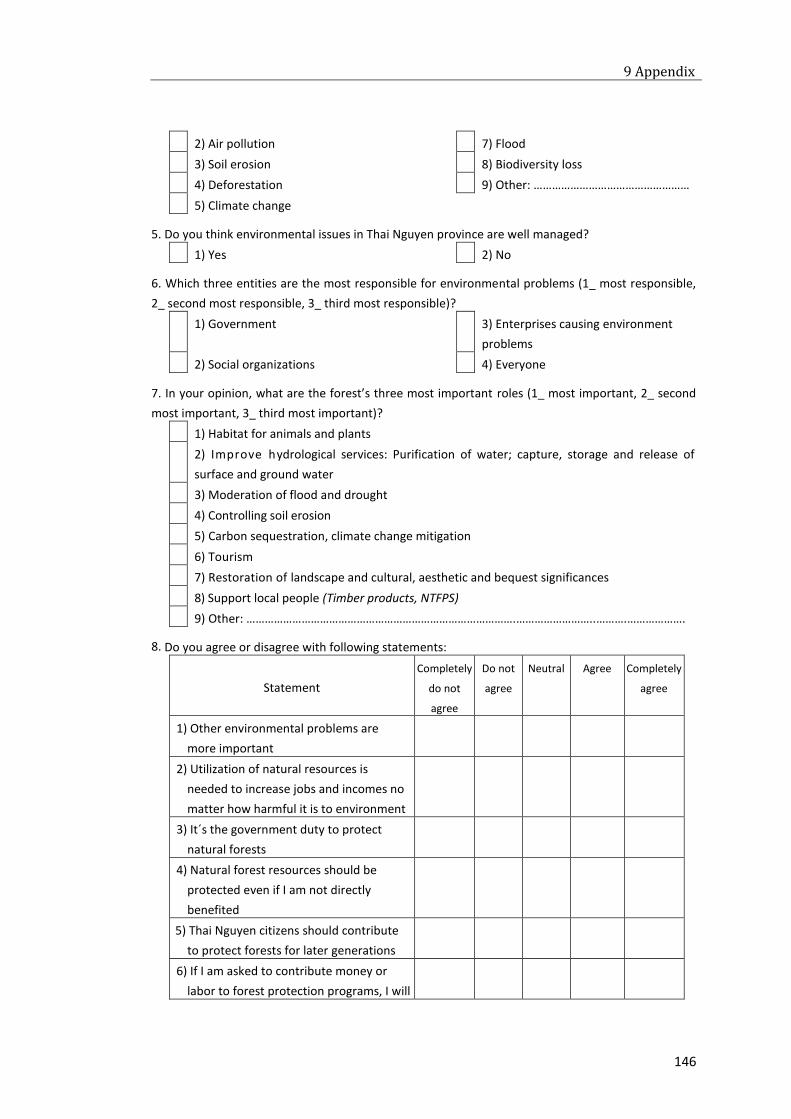
9 Appendix
146
2) Air pollution 7) Flood
3) Soil erosion 8) Biodiversity loss
4) Deforestation 9) Other: ……………………………………………
5) Climate change
5. Do you think environmental issues in Thai Nguyen province are well managed?
1) Yes 2) No
6. Which three entities are the most responsible for environmental problems (1_ most responsible,
2_ second most responsible, 3_ third most responsible)?
1) Government 3) Enterprises causing environment
problems
2) Social organizations 4) Everyone
7. In your opinion, what are the forest’s three most important roles (1_ most important, 2_ second
most important, 3_ third most important)?
1) Habitat for animals and plants
2) Improve hydrological services: Purification of water; capture, storage and release of
surface and ground water
3) Moderation of flood and drought
4) Controlling soil erosion
5) Carbon sequestration, climate change mitigation
6) Tourism
7) Restoration of landscape and cultural, aesthetic and bequest significances
8) Support local people (Timber products, NTFPS)
9) Other: …………………………………………………………………………….……………………..……….……………….
8. Do you agree or disagree with following statements:
Statement
Completely
do not
agree
Do not
agree
Neutral Agree Completely
agree
1) Other environmental problems are
more important
2) Utilization of natural resources is
needed to increase jobs and incomes no
matter how harmful it is to environment
3) It´s the government duty to protect
natural forests
4) Natural forest resources should be
protected even if I am not directly
benefited
5) Thai Nguyen citizens should contribute
to protect forests for later generations
6) If I am asked to contribute money or
labor to forest protection programs, I will
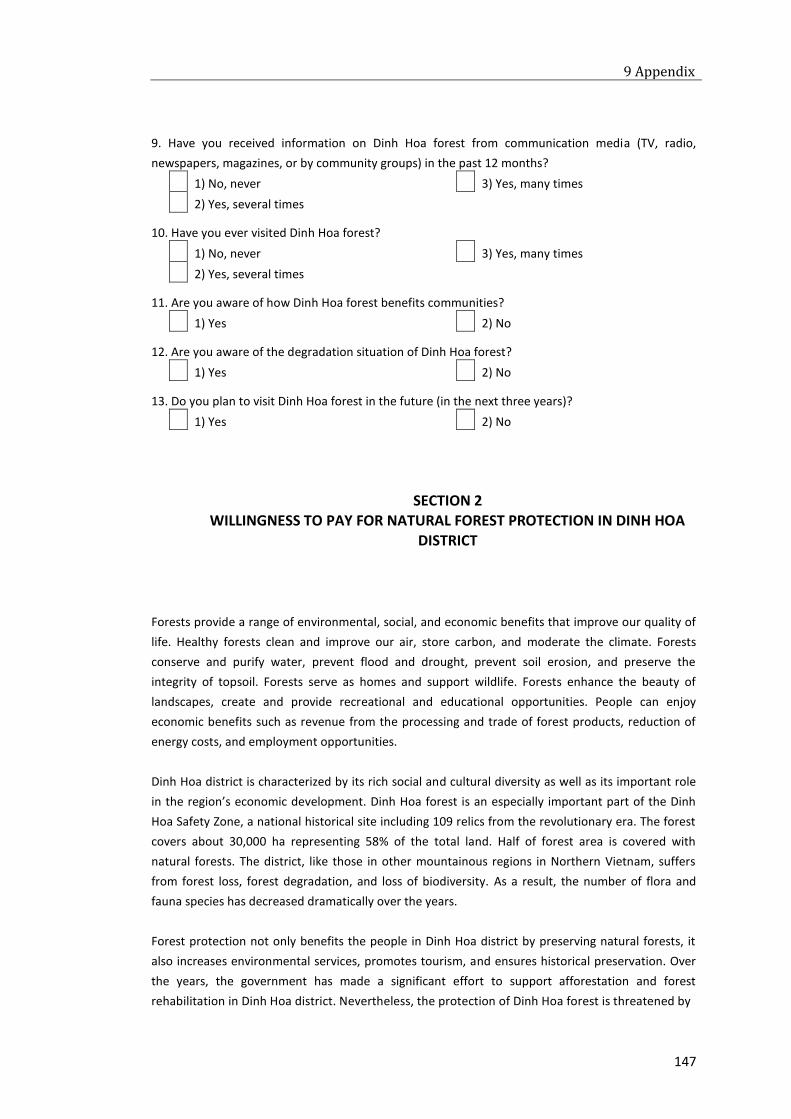
9 Appendix
147
9. Have you received information on Dinh Hoa forest from communication media (TV, radio,
newspapers, magazines, or by community groups) in the past 12 months?
1) No, never 3) Yes, many times
2) Yes, several times
10. Have you ever visited Dinh Hoa forest?
1) No, never 3) Yes, many times
2) Yes, several times
11. Are you aware of how Dinh Hoa forest benefits communities?
1) Yes 2) No
12. Are you aware of the degradation situation of Dinh Hoa forest?
1) Yes 2) No
13. Do you plan to visit Dinh Hoa forest in the future (in the next three years)?
1) Yes 2) No
SECTION 2 WILLINGNESS TO PAY FOR NATURAL FOREST PROTECTION IN DINH HOA
DISTRICT
Forests provide a range of environmental, social, and economic benefits that improve our quality of
life. Healthy forests clean and improve our air, store carbon, and moderate the climate. Forests
conserve and purify water, prevent flood and drought, prevent soil erosion, and preserve the
integrity of topsoil. Forests serve as homes and support wildlife. Forests enhance the beauty of
landscapes, create and provide recreational and educational opportunities. People can enjoy
economic benefits such as revenue from the processing and trade of forest products, reduction of
energy costs, and employment opportunities.
Dinh Hoa district is characterized by its rich social and cultural diversity as well as its important role
in the region’s economic development. Dinh Hoa forest is an especially important part of the Dinh
Hoa Safety Zone, a national historical site including 109 relics from the revolutionary era. The forest
covers about 30,000 ha representing 58% of the total land. Half of forest area is covered with
natural forests. The district, like those in other mountainous regions in Northern Vietnam, suffers
from forest loss, forest degradation, and loss of biodiversity. As a result, the number of flora and
fauna species has decreased dramatically over the years.
Forest protection not only benefits the people in Dinh Hoa district by preserving natural forests, it
also increases environmental services, promotes tourism, and ensures historical preservation. Over
the years, the government has made a significant effort to support afforestation and forest
rehabilitation in Dinh Hoa district. Nevertheless, the protection of Dinh Hoa forest is threatened by
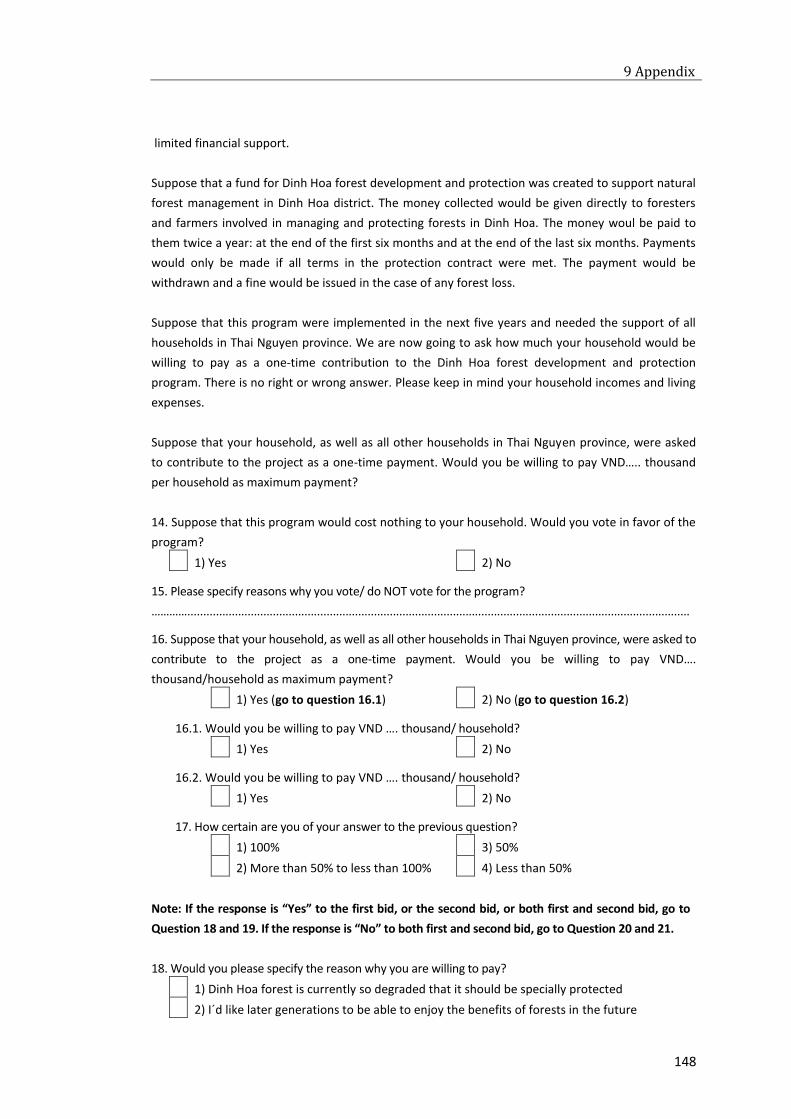
9 Appendix
148
limited financial support.
Suppose that a fund for Dinh Hoa forest development and protection was created to support natural
forest management in Dinh Hoa district. The money collected would be given directly to foresters
and farmers involved in managing and protecting forests in Dinh Hoa. The money woul be paid to
them twice a year: at the end of the first six months and at the end of the last six months. Payments
would only be made if all terms in the protection contract were met. The payment would be
withdrawn and a fine would be issued in the case of any forest loss.
Suppose that this program were implemented in the next five years and needed the support of all
households in Thai Nguyen province. We are now going to ask how much your household would be
willing to pay as a one-time contribution to the Dinh Hoa forest development and protection
program. There is no right or wrong answer. Please keep in mind your household incomes and living
expenses.
Suppose that your household, as well as all other households in Thai Nguyen province, were asked
to contribute to the project as a one-time payment. Would you be willing to pay VND….. thousand
per household as maximum payment?
14. Suppose that this program would cost nothing to your household. Would you vote in favor of the
program?
1) Yes 2) No
15. Please specify reasons why you vote/ do NOT vote for the program?
…………...............................................................................................................................................................
16. Suppose that your household, as well as all other households in Thai Nguyen province, were asked to
contribute to the project as a one-time payment. Would you be willing to pay VND….
thousand/household as maximum payment?
1) Yes (go to question 16.1) 2) No (go to question 16.2)
16.1. Would you be willing to pay VND …. thousand/ household?
1) Yes 2) No
16.2. Would you be willing to pay VND …. thousand/ household?
1) Yes 2) No
17. How certain are you of your answer to the previous question?
1) 100% 3) 50%
2) More than 50% to less than 100% 4) Less than 50%
Note: If the response is “Yes” to the first bid, or the second bid, or both first and second bid, go to
Question 18 and 19. If the response is “No” to both first and second bid, go to Question 20 and 21.
18. Would you please specify the reason why you are willing to pay?
1) Dinh Hoa forest is currently so degraded that it should be specially protected
2) I´d like later generations to be able to enjoy the benefits of forests in the future
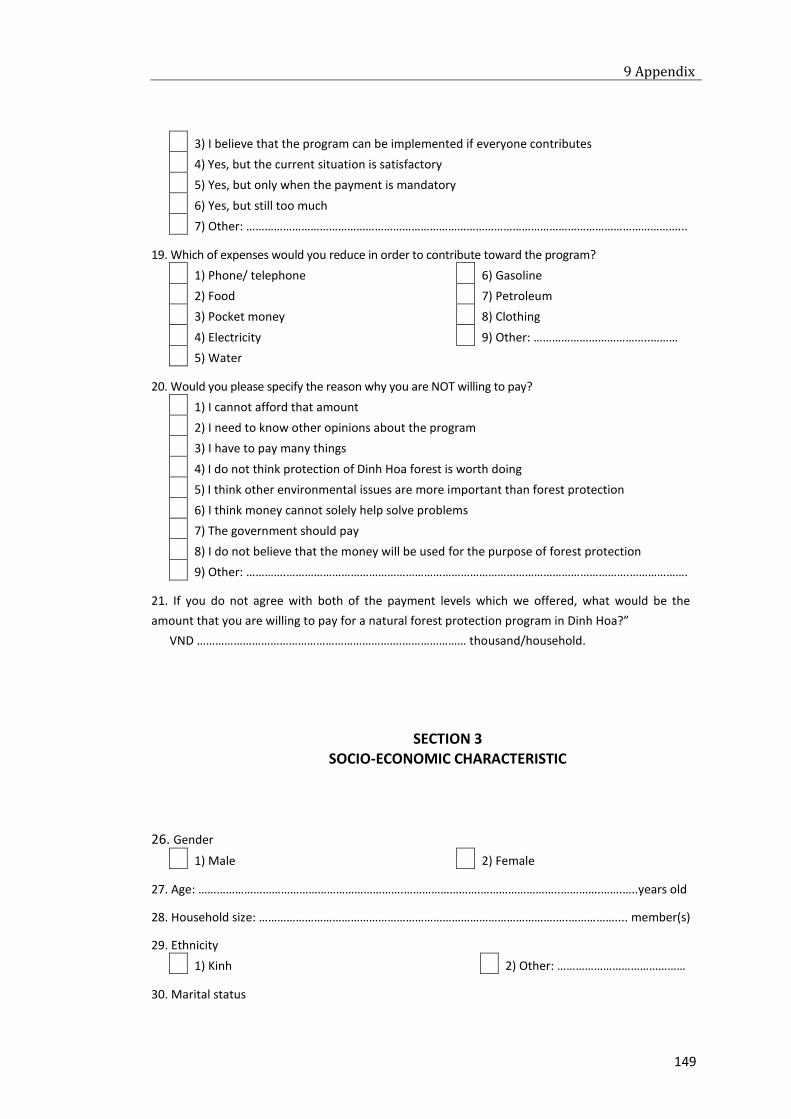
9 Appendix
149
3) I believe that the program can be implemented if everyone contributes
4) Yes, but the current situation is satisfactory
5) Yes, but only when the payment is mandatory
6) Yes, but still too much
7) Other: ……………………………………………………………………………………………………………………………...
19. Which of expenses would you reduce in order to contribute toward the program?
1) Phone/ telephone 6) Gasoline
2) Food 7) Petroleum
3) Pocket money 8) Clothing
4) Electricity 9) Other: ………………………………..………
5) Water
20. Would you please specify the reason why you are NOT willing to pay?
1) I cannot afford that amount
2) I need to know other opinions about the program
3) I have to pay many things
4) I do not think protection of Dinh Hoa forest is worth doing
5) I think other environmental issues are more important than forest protection
6) I think money cannot solely help solve problems
7) The government should pay
8) I do not believe that the money will be used for the purpose of forest protection
9) Other: ………….………………………………………………………………………………………………….……………….
21. If you do not agree with both of the payment levels which we offered, what would be the
amount that you are willing to pay for a natural forest protection program in Dinh Hoa?”
VND ………………………………………………………….………………… thousand/household.
SECTION 3 SOCIO-ECONOMIC CHARACTERISTIC
26. Gender
1) Male 2) Female
27. Age: ………………………………………………………….…………………….……………………..………….…….…..years old
28. Household size: …………………………………………………………………………………….….…………….... member(s)
29. Ethnicity
1) Kinh 2) Other: ……………………………………
30. Marital status
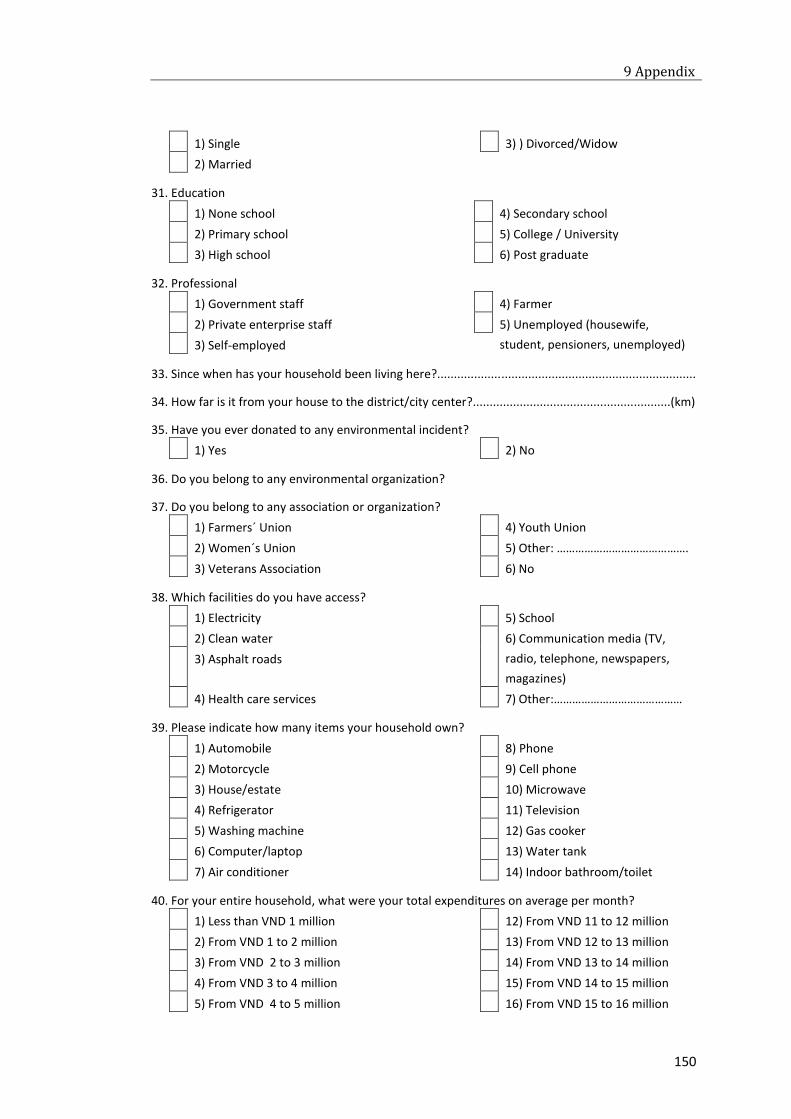
9 Appendix
150
1) Single 3) ) Divorced/Widow
2) Married
31. Education
1) None school 4) Secondary school
2) Primary school 5) College / University
3) High school 6) Post graduate
32. Professional
1) Government staff 4) Farmer
2) Private enterprise staff 5) Unemployed (housewife,
student, pensioners, unemployed) 3) Self-employed
33. Since when has your household been living here?.............................................................................
34. How far is it from your house to the district/city center?...........................................................(km)
35. Have you ever donated to any environmental incident?
1) Yes 2) No
36. Do you belong to any environmental organization?
37. Do you belong to any association or organization?
1) Farmers´ Union 4) Youth Union
2) Women´s Union 5) Other: …………………………………….
3) Veterans Association 6) No
38. Which facilities do you have access?
1) Electricity 5) School
2) Clean water 6) Communication media (TV,
radio, telephone, newspapers,
magazines)
3) Asphalt roads
4) Health care services 7) Other:……………………………………
39. Please indicate how many items your household own?
1) Automobile 8) Phone
2) Motorcycle 9) Cell phone
3) House/estate 10) Microwave
4) Refrigerator 11) Television
5) Washing machine 12) Gas cooker
6) Computer/laptop 13) Water tank
7) Air conditioner 14) Indoor bathroom/toilet
40. For your entire household, what were your total expenditures on average per month?
1) Less than VND 1 million 12) From VND 11 to 12 million
2) From VND 1 to 2 million 13) From VND 12 to 13 million
3) From VND 2 to 3 million 14) From VND 13 to 14 million
4) From VND 3 to 4 million 15) From VND 14 to 15 million
5) From VND 4 to 5 million 16) From VND 15 to 16 million
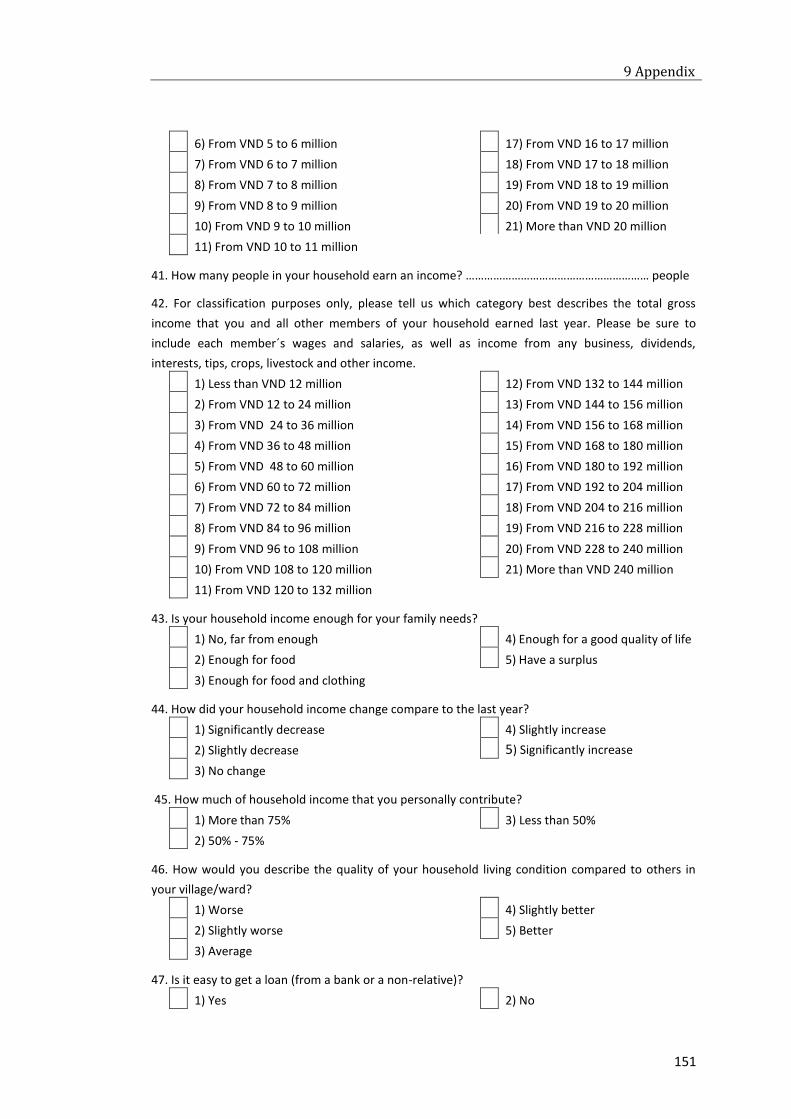
9 Appendix
151
6) From VND 5 to 6 million 17) From VND 16 to 17 million
7) From VND 6 to 7 million 18) From VND 17 to 18 million
8) From VND 7 to 8 million 19) From VND 18 to 19 million
9) From VND 8 to 9 million 20) From VND 19 to 20 million
10) From VND 9 to 10 million 21) More than VND 20 million
11) From VND 10 to 11 million
41. How many people in your household earn an income? …………………………………………………… people
42. For classification purposes only, please tell us which category best describes the total gross
income that you and all other members of your household earned last year. Please be sure to
include each member´s wages and salaries, as well as income from any business, dividends,
interests, tips, crops, livestock and other income.
1) Less than VND 12 million 12) From VND 132 to 144 million
2) From VND 12 to 24 million 13) From VND 144 to 156 million
3) From VND 24 to 36 million 14) From VND 156 to 168 million
4) From VND 36 to 48 million 15) From VND 168 to 180 million
5) From VND 48 to 60 million 16) From VND 180 to 192 million
6) From VND 60 to 72 million 17) From VND 192 to 204 million
7) From VND 72 to 84 million 18) From VND 204 to 216 million
8) From VND 84 to 96 million 19) From VND 216 to 228 million
9) From VND 96 to 108 million 20) From VND 228 to 240 million
10) From VND 108 to 120 million 21) More than VND 240 million
11) From VND 120 to 132 million
43. Is your household income enough for your family needs?
1) No, far from enough 4) Enough for a good quality of life
2) Enough for food 5) Have a surplus
3) Enough for food and clothing
44. How did your household income change compare to the last year?
1) Significantly decrease 4) Slightly increase
2) Slightly decrease 5) Significantly increase
3) No change
45. How much of household income that you personally contribute?
1) More than 75% 3) Less than 50%
2) 50% - 75%
46. How would you describe the quality of your household living condition compared to others in
your village/ward?
1) Worse 4) Slightly better
2) Slightly worse 5) Better
3) Average
47. Is it easy to get a loan (from a bank or a non-relative)?
1) Yes 2) No

9 Appendix
152
48. Would you like to make any comment?
………..……………………………………………………………………………………………………………………………..…………..………
CLOSING: Thank you for your time and cooperation!
Interviewer’s comment:
………..……………………………………………………………………………………………………………………………..…………………
I hereby certify that this is an honest interview taken in accordance with my instructions
Interviewer´s signature
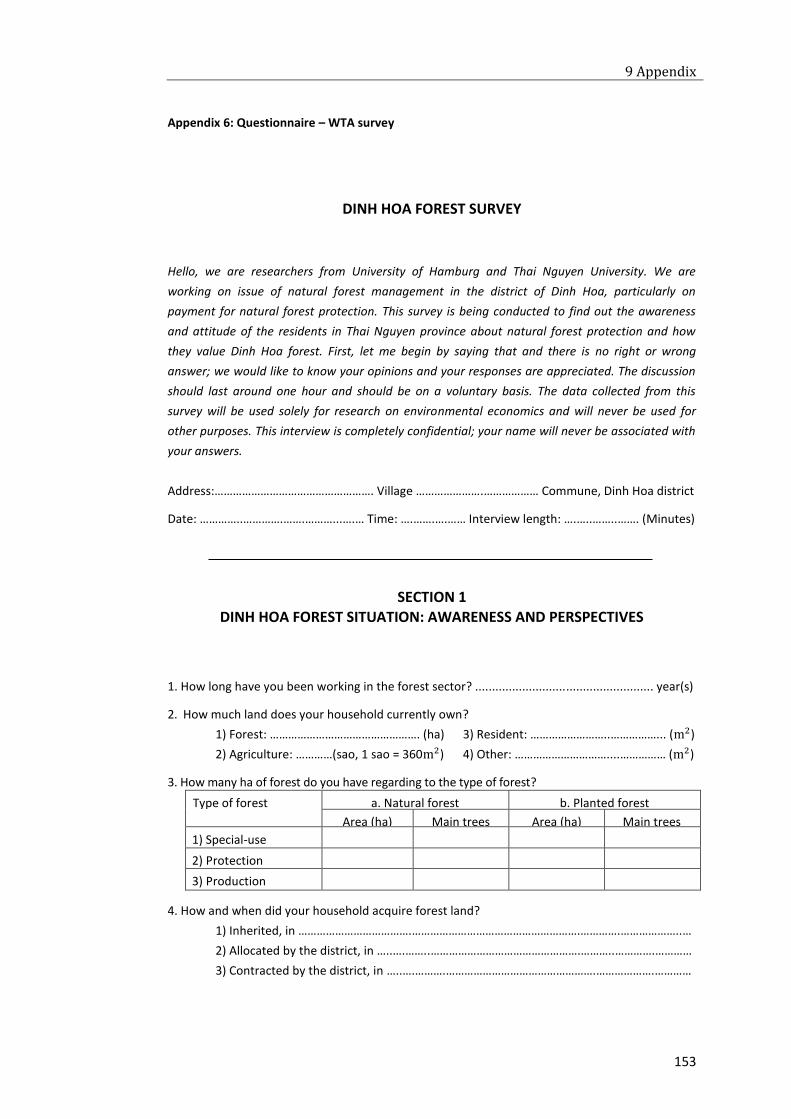
9 Appendix
153
Appendix 6: Questionnaire – WTA survey
DINH HOA FOREST SURVEY
Hello, we are researchers from University of Hamburg and Thai Nguyen University. We are
working on issue of natural forest management in the district of Dinh Hoa, particularly on
payment for natural forest protection. This survey is being conducted to find out the awareness
and attitude of the residents in Thai Nguyen province about natural forest protection and how
they value Dinh Hoa forest. First, let me begin by saying that and there is no right or wrong
answer; we would like to know your opinions and your responses are appreciated. The discussion
should last around one hour and should be on a voluntary basis. The data collected from this
survey will be used solely for research on environmental economics and will never be used for
other purposes. This interview is completely confidential; your name will never be associated with
your answers.
Address:……………………………………………. Village ………………….……………… Commune, Dinh Hoa district
Date: …………..………….…….………...….… Time: ….…….….…… Interview length: ….…..……..……. (Minutes)
SECTION 1 DINH HOA FOREST SITUATION: AWARENESS AND PERSPECTIVES
1. How long have you been working in the forest sector? ..................................................... year(s)
2. How much land does your household currently own?
1) Forest: …………………………………………. (ha) 3) Resident: ……………………..……………... (m2)
2) Agriculture: …………(sao, 1 sao = 360m2) 4) Other: …………………………....…………… (m2)
3. How many ha of forest do you have regarding to the type of forest?
Type of forest a. Natural forest b. Planted forest
Area (ha) Main trees Area (ha) Main trees
1) Special-use
2) Protection
3) Production
4. How and when did your household acquire forest land?
1) Inherited, in ……………………………….……………………………………………….………….………………..…
2) Allocated by the district, in …..….……..………………………………………….………..………….…………
3) Contracted by the district, in …..….……….………………………………………….……………….…………
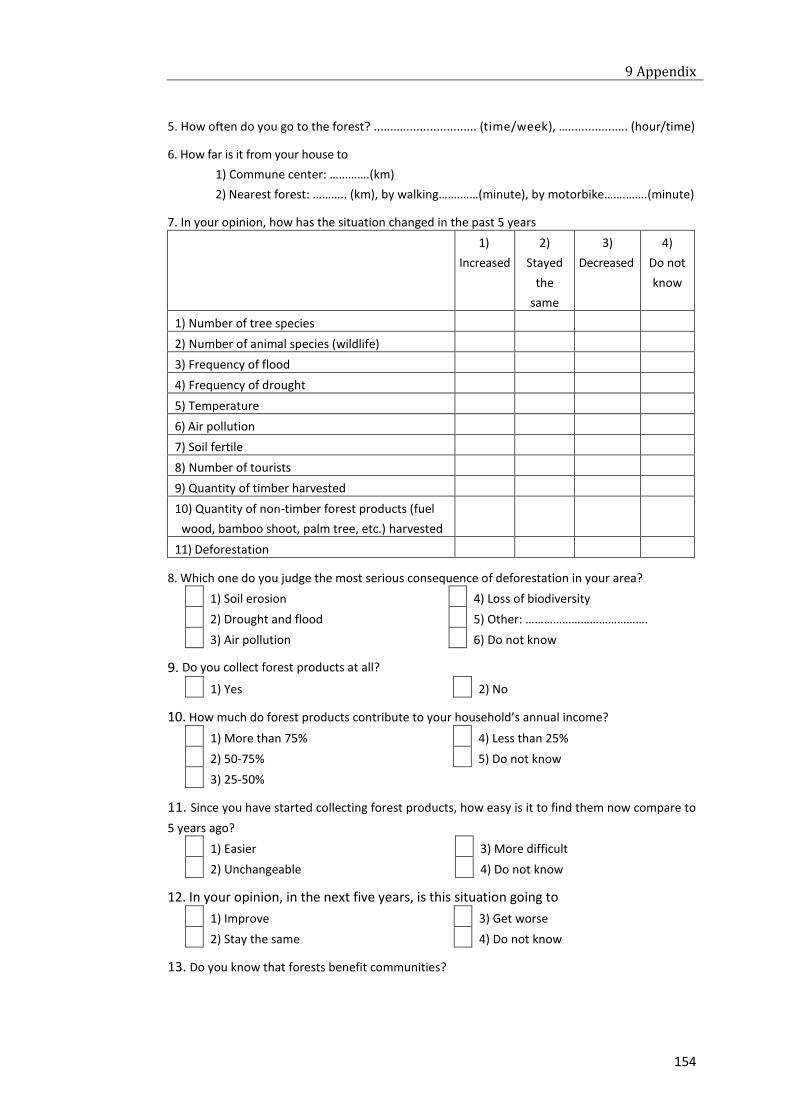
9 Appendix
154
5. How often do you go to the forest? ............................... (time/week), ….................. (hour/time)
6. How far is it from your house to
1) Commune center: ………….(km)
2) Nearest forest: ……….. (km), by walking…….……(minute), by motorbike…….…….(minute)
7. In your opinion, how has the situation changed in the past 5 years
1)
Increased
2)
Stayed
the
same
3)
Decreased
4)
Do not
know
1) Number of tree species
2) Number of animal species (wildlife)
3) Frequency of flood
4) Frequency of drought
5) Temperature
6) Air pollution
7) Soil fertile
8) Number of tourists
9) Quantity of timber harvested
10) Quantity of non-timber forest products (fuel
wood, bamboo shoot, palm tree, etc.) harvested
11) Deforestation
8. Which one do you judge the most serious consequence of deforestation in your area?
1) Soil erosion 4) Loss of biodiversity
2) Drought and flood 5) Other: ………………………………….
3) Air pollution 6) Do not know
9. Do you collect forest products at all?
1) Yes 2) No
10. How much do forest products contribute to your household’s annual income?
1) More than 75% 4) Less than 25%
2) 50-75% 5) Do not know
3) 25-50%
11. Since you have started collecting forest products, how easy is it to find them now compare to
5 years ago?
1) Easier 3) More difficult
2) Unchangeable 4) Do not know
12. In your opinion, in the next five years, is this situation going to
1) Improve 3) Get worse
2) Stay the same 4) Do not know
13. Do you know that forests benefit communities?
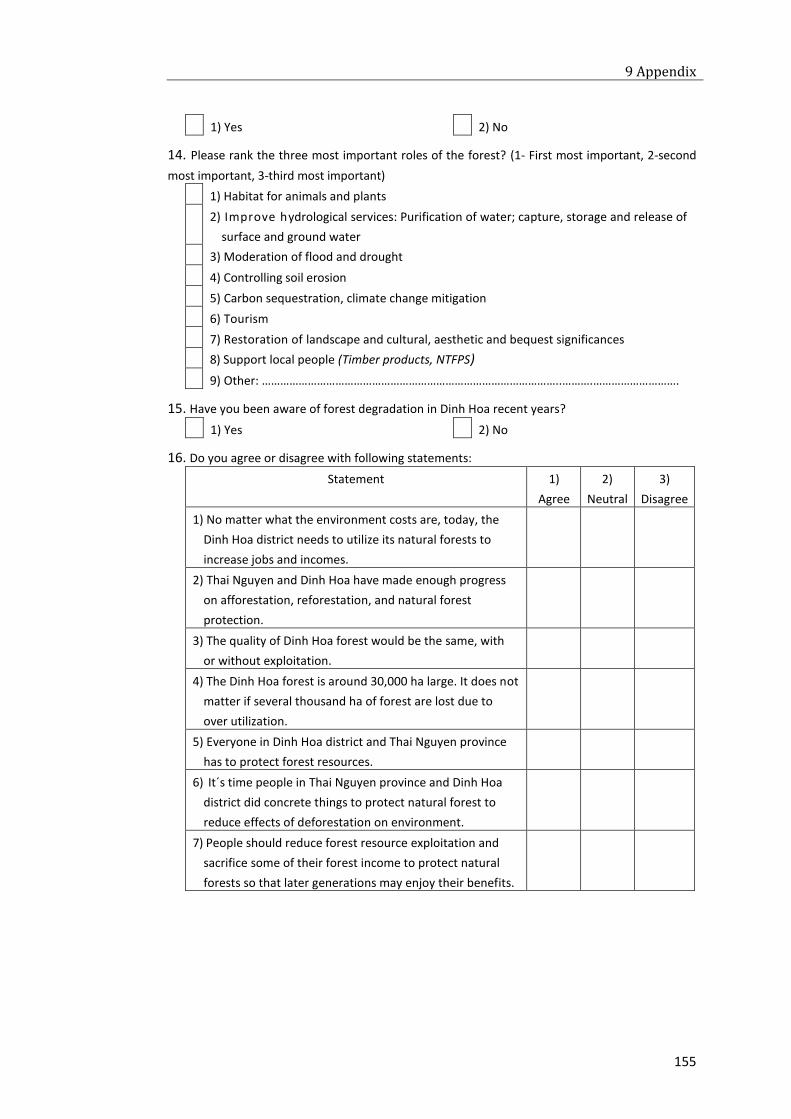
9 Appendix
155
1) Yes 2) No
14. Please rank the three most important roles of the forest? (1- First most important, 2-second
most important, 3-third most important)
1) Habitat for animals and plants
2) Improve hydrological services: Purification of water; capture, storage and release of
surface and ground water
3) Moderation of flood and drought
4) Controlling soil erosion
5) Carbon sequestration, climate change mitigation
6) Tourism
7) Restoration of landscape and cultural, aesthetic and bequest significances
8) Support local people (Timber products, NTFPS)
9) Other: ……………………………………………………………………………………..……….……………………….
15. Have you been aware of forest degradation in Dinh Hoa recent years?
1) Yes 2) No
16. Do you agree or disagree with following statements:
Statement 1)
Agree
2)
Neutral
3)
Disagree
1) No matter what the environment costs are, today, the
Dinh Hoa district needs to utilize its natural forests to
increase jobs and incomes.
2) Thai Nguyen and Dinh Hoa have made enough progress
on afforestation, reforestation, and natural forest
protection.
3) The quality of Dinh Hoa forest would be the same, with
or without exploitation.
4) The Dinh Hoa forest is around 30,000 ha large. It does not
matter if several thousand ha of forest are lost due to
over utilization.
5) Everyone in Dinh Hoa district and Thai Nguyen province
has to protect forest resources.
6) It´s time people in Thai Nguyen province and Dinh Hoa
district did concrete things to protect natural forest to
reduce effects of deforestation on environment.
7) People should reduce forest resource exploitation and
sacrifice some of their forest income to protect natural
forests so that later generations may enjoy their benefits.
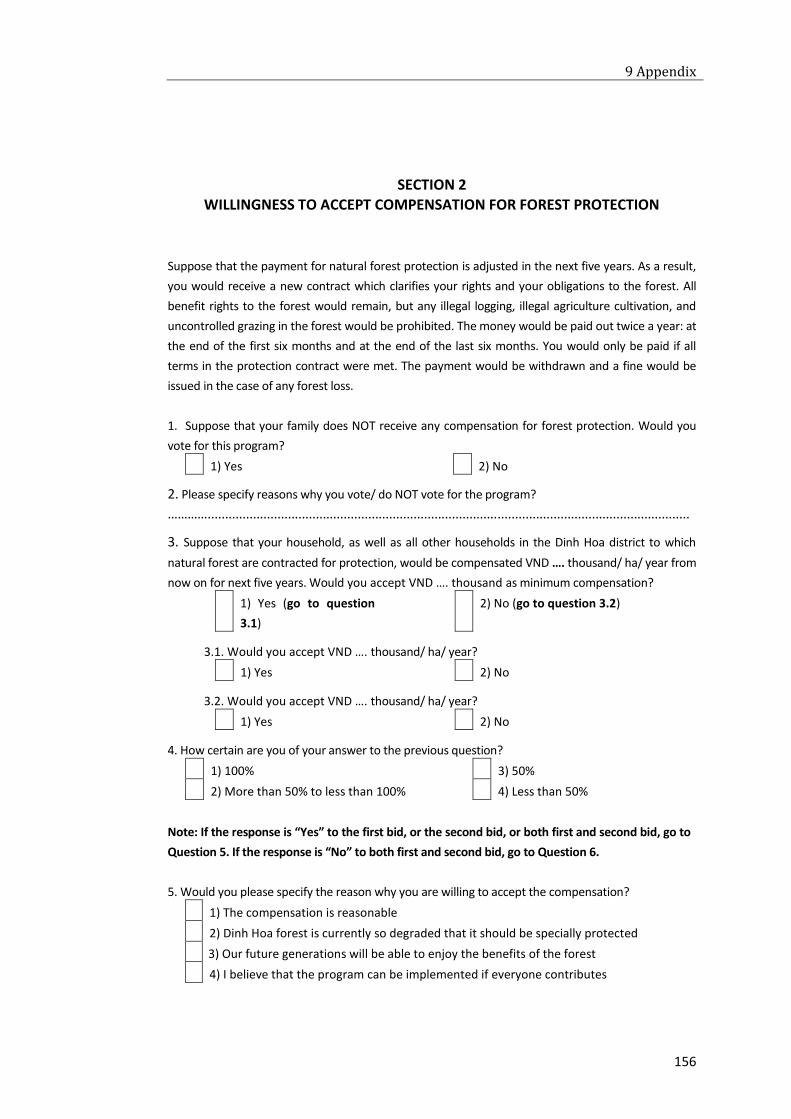
9 Appendix
156
SECTION 2 WILLINGNESS TO ACCEPT COMPENSATION FOR FOREST PROTECTION
Suppose that the payment for natural forest protection is adjusted in the next five years. As a result,
you would receive a new contract which clarifies your rights and your obligations to the forest. All
benefit rights to the forest would remain, but any illegal logging, illegal agriculture cultivation, and
uncontrolled grazing in the forest would be prohibited. The money would be paid out twice a year: at
the end of the first six months and at the end of the last six months. You would only be paid if all
terms in the protection contract were met. The payment would be withdrawn and a fine would be
issued in the case of any forest loss.
1. Suppose that your family does NOT receive any compensation for forest protection. Would you
vote for this program?
1) Yes 2) No
2. Please specify reasons why you vote/ do NOT vote for the program?
…………..........................................................................................................................................
3. Suppose that your household, as well as all other households in the Dinh Hoa district to which
natural forest are contracted for protection, would be compensated VND …. thousand/ ha/ year from
now on for next five years. Would you accept VND …. thousand as minimum compensation?
1) Yes (go to question
3.1)
2) No (go to question 3.2)
3.1. Would you accept VND …. thousand/ ha/ year?
1) Yes 2) No
3.2. Would you accept VND …. thousand/ ha/ year?
1) Yes 2) No
4. How certain are you of your answer to the previous question?
1) 100% 3) 50%
2) More than 50% to less than 100% 4) Less than 50%
Note: If the response is “Yes” to the first bid, or the second bid, or both first and second bid, go to
Question 5. If the response is “No” to both first and second bid, go to Question 6.
5. Would you please specify the reason why you are willing to accept the compensation?
1) The compensation is reasonable
2) Dinh Hoa forest is currently so degraded that it should be specially protected
3) Our future generations will be able to enjoy the benefits of the forest
4) I believe that the program can be implemented if everyone contributes
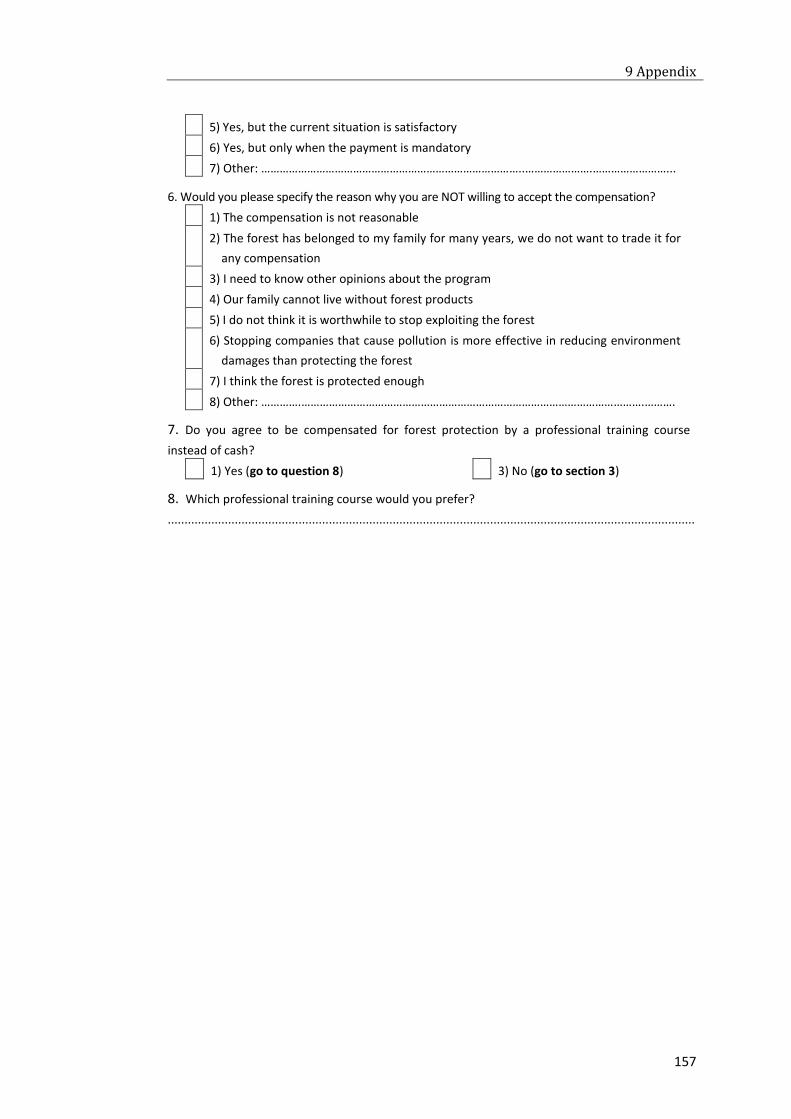
9 Appendix
157
5) Yes, but the current situation is satisfactory
6) Yes, but only when the payment is mandatory
7) Other: …………………………………………………………………………..………………….……………………...
6. Would you please specify the reason why you are NOT willing to accept the compensation?
1) The compensation is not reasonable
2) The forest has belonged to my family for many years, we do not want to trade it for
any compensation
3) I need to know other opinions about the program
4) Our family cannot live without forest products
5) I do not think it is worthwhile to stop exploiting the forest
6) Stopping companies that cause pollution is more effective in reducing environment
damages than protecting the forest
7) I think the forest is protected enough
8) Other: ………….………………………………………………………………………………………………….……….
7. Do you agree to be compensated for forest protection by a professional training course
instead of cash?
1) Yes (go to question 8) 3) No (go to section 3)
8. Which professional training course would you prefer?
.............................................................................................................................................................
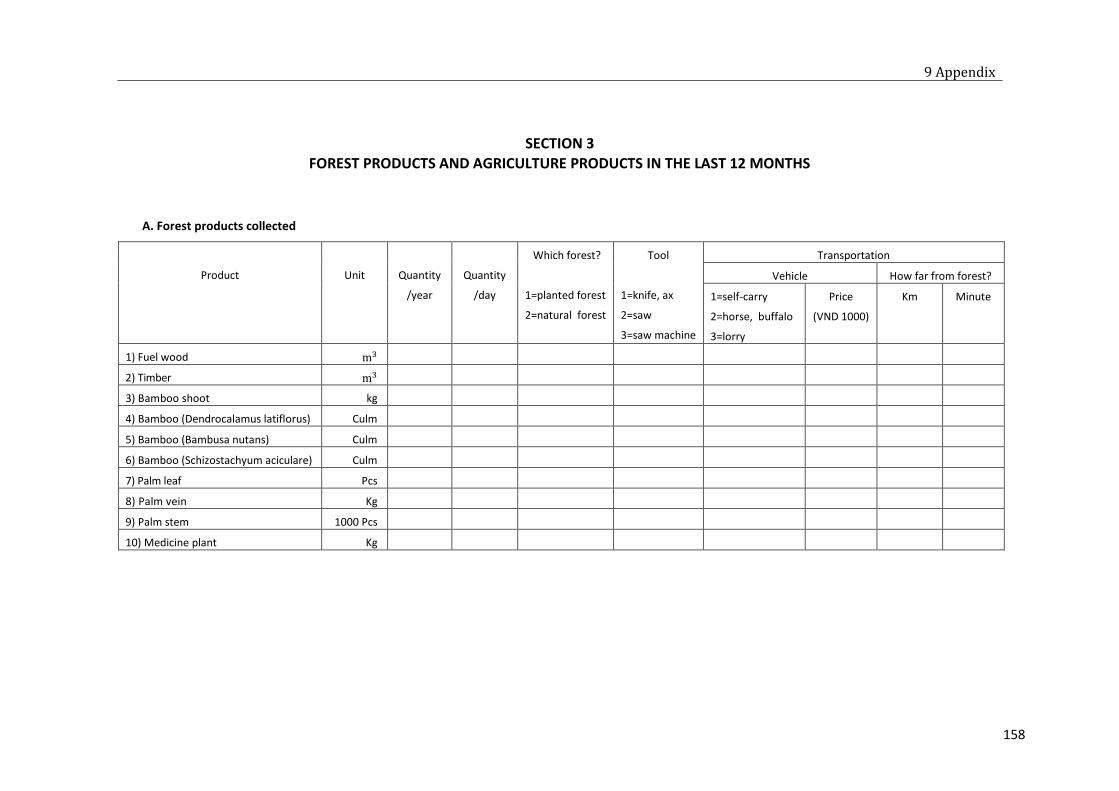
9 Appendix
158
SECTION 3 FOREST PRODUCTS AND AGRICULTURE PRODUCTS IN THE LAST 12 MONTHS
A. Forest products collected
Product
Unit
Quantity
/year
Quantity
/day
Which forest?
1=planted forest
2=natural forest
Tool
1=knife, ax
2=saw
3=saw machine
Transportation
Vehicle How far from forest?
1=self-carry
2=horse, buffalo
3=lorry
Price
(VND 1000)
Km Minute
1) Fuel wood m3
2) Timber m3
3) Bamboo shoot kg
4) Bamboo (Dendrocalamus latiflorus) Culm
5) Bamboo (Bambusa nutans) Culm
6) Bamboo (Schizostachyum aciculare) Culm
7) Palm leaf Pcs
8) Palm vein Kg
9) Palm stem 1000 Pcs
10) Medicine plant Kg
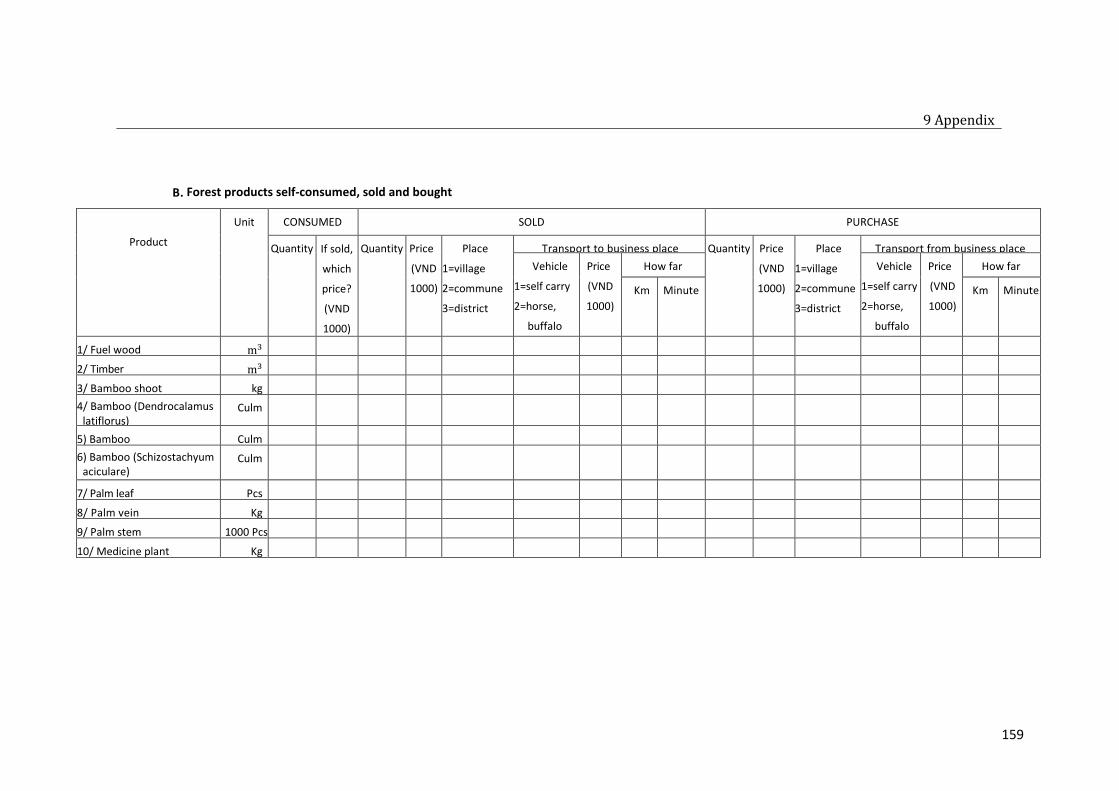
9 Appendix
159
B. Forest products self-consumed, sold and bought
Product
Unit CONSUMED
SOLD PURCHASE
Quantity
If sold,
which
price?
(VND
1000)
Quantity
Price
(VND
1000)
Place
1=village
2=commune
3=district
Transport to business place Quantity
Price
(VND
1000)
Place
1=village
2=commune
3=district
Transport from business place
Vehicle
1=self carry
2=horse,
buffalo
3=lorry
Price
(VND
1000)
How far Vehicle
1=self carry
2=horse,
buffalo
3=lorry
Price
(VND
1000)
How far
Km Minute Km Minute
1/ Fuel wood m3
2/ Timber m3
3/ Bamboo shoot kg
4/ Bamboo (Dendrocalamus latiflorus)
Culm
5) Bamboo
(Bambusa nutans)
Culm
6) Bamboo (Schizostachyum aciculare)
Culm
7/ Palm leaf Pcs
8/ Palm vein Kg
9/ Palm stem 1000 Pcs
10/ Medicine plant Kg
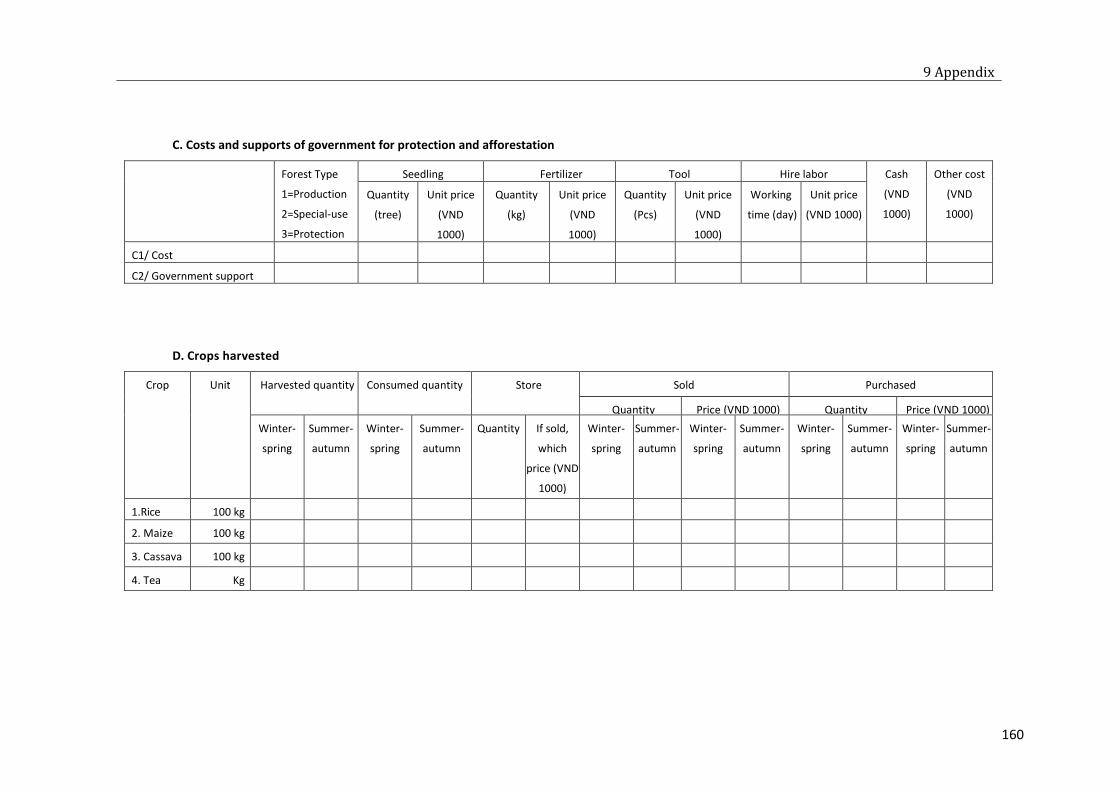
9 Appendix
160
C. Costs and supports of government for protection and afforestation
Forest Type
1=Production
2=Special-use
3=Protection
Seedling Fertilizer Tool Hire labor Cash
(VND
1000)
Other cost
(VND
1000)
Quantity
(tree)
Unit price
(VND
1000)
Quantity
(kg)
Unit price
(VND
1000)
Quantity
(Pcs)
Unit price
(VND
1000)
Working
time (day)
Unit price
(VND 1000)
C1/ Cost
C2/ Government support
D. Crops harvested
Crop Unit Harvested quantity Consumed quantity Store Sold Purchased
Quantity Price (VND 1000) Quantity Price (VND 1000)
Winter-
spring
Summer-
autumn
Winter-
spring
Summer-
autumn
Quantity
If sold,
which
price (VND
1000)
Winter-
spring
Summer-
autumn
Winter-
spring
Summer-
autumn
Winter-
spring
Summer-
autumn
Winter-
spring
Summer-
autumn
1.Rice
100 kg
2. Maize 100 kg
3. Cassava 100 kg
4. Tea Kg
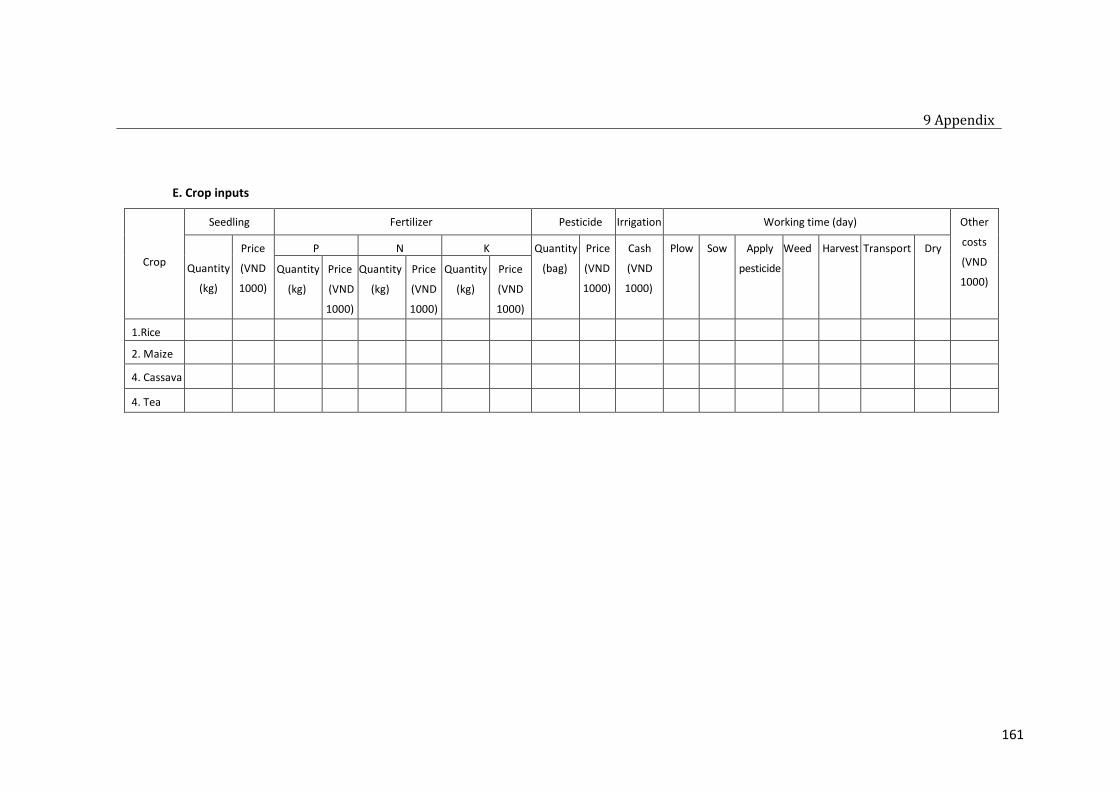
9 Appendix
161
E. Crop inputs
Crop
Seedling Fertilizer Pesticide Irrigation Working time (day) Other
costs
(VND
1000)
Quantity
(kg)
Price
(VND
1000)
P N K Quantity
(bag)
Price
(VND
1000)
Cash
(VND
1000)
Plow
Sow
Apply
pesticide
Weed
Harvest
Transport
Dry
Quantity
(kg)
Price
(VND
1000)
Quantity
(kg)
Price
(VND
1000)
Quantity
(kg)
Price
(VND
1000)
1.Rice
2. Maize
4. Cassava
4. Tea
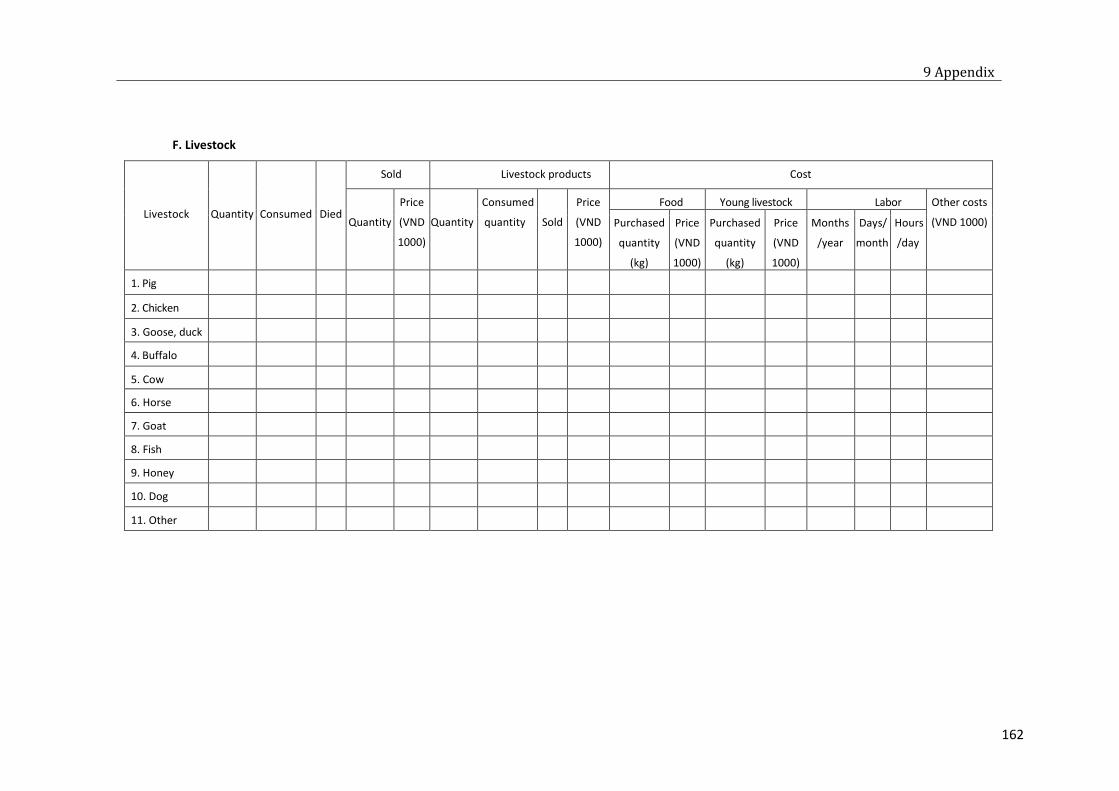
9 Appendix
162
F. Livestock
Livestock
Quantity
Consumed
Died
Sold Livestock products Cost
Quantity
Price
(VND
1000)
Quantity
Consumed
quantity
Sold
Price
(VND
1000)
Food Young livestock Labor Other costs
(VND 1000) Purchased
quantity
(kg)
Price
(VND
1000)
Purchased
quantity
(kg)
Price
(VND
1000)
Months
/year
Days/
month
Hours
/day
1. Pig
2. Chicken
3. Goose, duck
4. Buffalo
5. Cow
6. Horse
7. Goat
8. Fish
9. Honey
10. Dog
11. Other
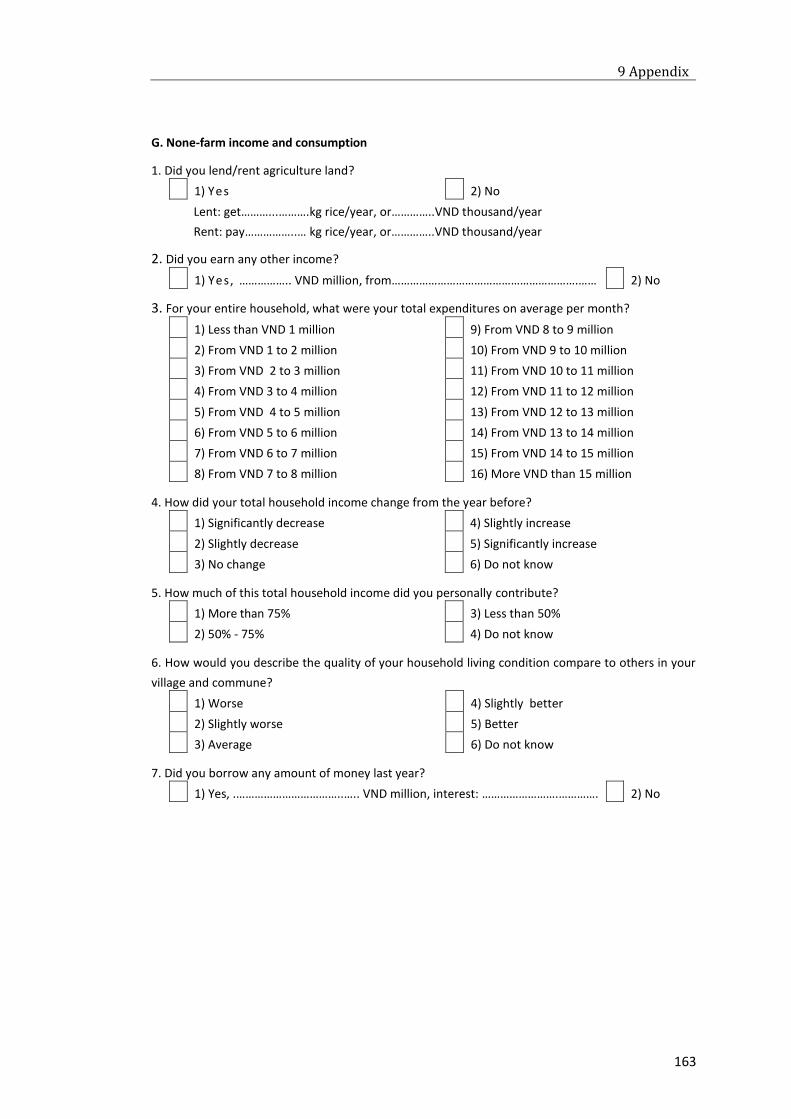
9 Appendix
163
G. None-farm income and consumption
1. Did you lend/rent agriculture land?
1) Yes 2) No
Lent: get………...……….kg rice/year, or…………..VND thousand/year
Rent: pay……………..… kg rice/year, or…………..VND thousand/year
2. Did you earn any other income?
1) Yes, …………….. VND million, from…………………………………………………….…… 2) No
3. For your entire household, what were your total expenditures on average per month?
1) Less than VND 1 million 9) From VND 8 to 9 million
2) From VND 1 to 2 million 10) From VND 9 to 10 million
3) From VND 2 to 3 million 11) From VND 10 to 11 million
4) From VND 3 to 4 million 12) From VND 11 to 12 million
5) From VND 4 to 5 million 13) From VND 12 to 13 million
6) From VND 5 to 6 million 14) From VND 13 to 14 million
7) From VND 6 to 7 million 15) From VND 14 to 15 million
8) From VND 7 to 8 million 16) More VND than 15 million
4. How did your total household income change from the year before?
1) Significantly decrease 4) Slightly increase
2) Slightly decrease 5) Significantly increase
3) No change 6) Do not know
5. How much of this total household income did you personally contribute?
1) More than 75% 3) Less than 50%
2) 50% - 75% 4) Do not know
6. How would you describe the quality of your household living condition compare to others in your
village and commune?
1) Worse 4) Slightly better
2) Slightly worse 5) Better
3) Average 6) Do not know
7. Did you borrow any amount of money last year?
1) Yes, .……………………………..….. VND million, interest: …………………….…………. 2) No
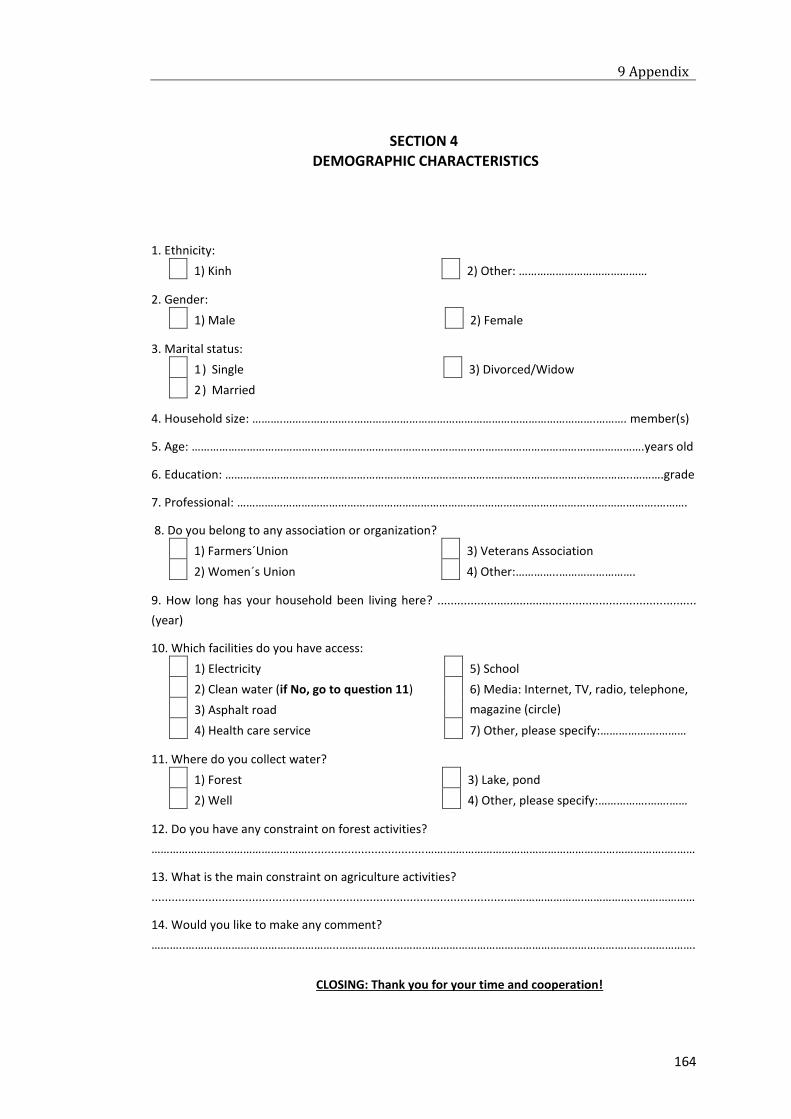
9 Appendix
164
SECTION 4
DEMOGRAPHIC CHARACTERISTICS
1. Ethnicity:
1) Kinh 2) Other: ……………………………………
2. Gender:
1) Male 2) Female
3. Marital status:
1) Single 3) Divorced/Widow
2) Married
4. Household size: ……….…………………..…………………………………………………………………….………. member(s)
5. Age: ………………………………………………………………………………………………………………………………….years old
6. Education: ………………………….………………………………………………………………………………….……..……….grade
7. Professional: ……………………………………………………………………………………………………….……………….……….
8. Do you belong to any association or organization?
1) Farmers´Union 3) Veterans Association
2) Women´s Union 4) Other:…………..…………………….
9. How long has your household been living here? ..............................................................................
(year)
10. Which facilities do you have access:
1) Electricity 5) School
2) Clean water (if No, go to question 11) 6) Media: Internet, TV, radio, telephone,
magazine (circle) 3) Asphalt road
4) Health care service 7) Other, please specify:……………….………
11. Where do you collect water?
1) Forest 3) Lake, pond
2) Well 4) Other, please specify:…………….…….……
12. Do you have any constraint on forest activities?
……………………………………………...................................…….…………………………………………….……………….….……
13. What is the main constraint on agriculture activities?
..........................................................................................................…………………….……………...………………
14. Would you like to make any comment?
………..…………………………………………..…………………………………………………………………………………..…..…………….
CLOSING: Thank you for your time and cooperation!

9 Appendix
165
Interviewer’s comment:
………..……………………………………………………………………………………………………………………………..…………………
I hereby certify that this is an honest interview taken in accordance with my instructions
Interviewer´s signature
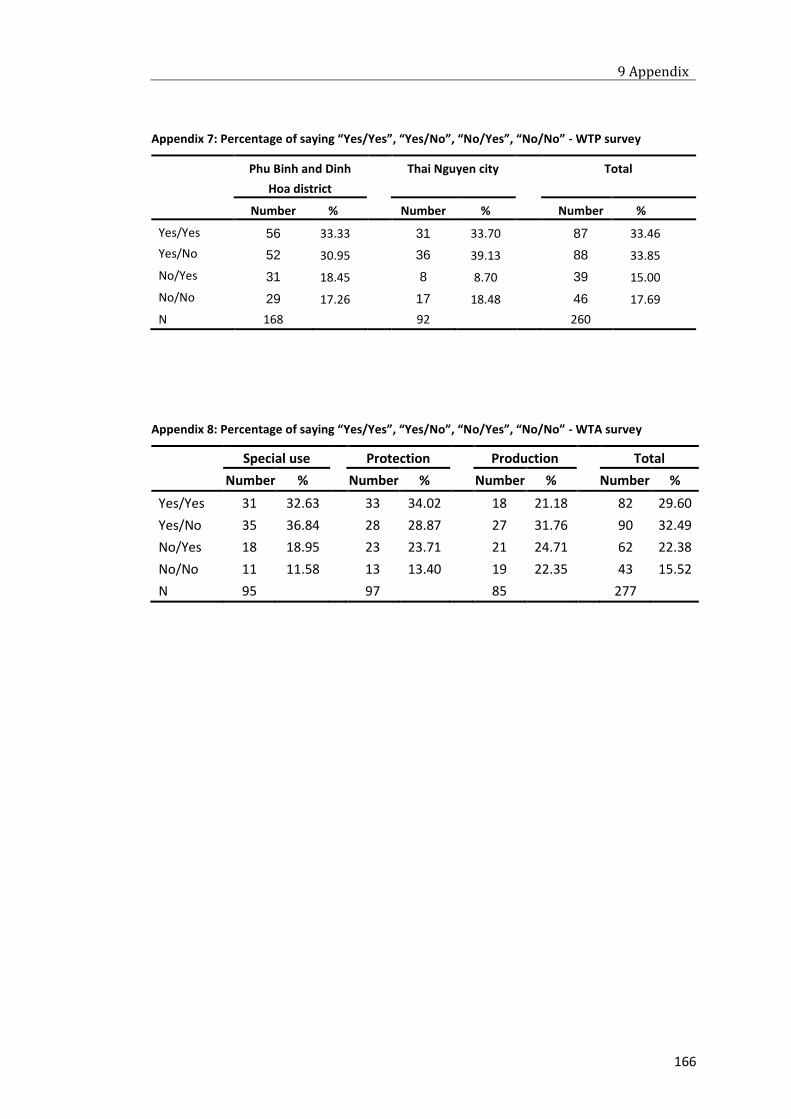
9 Appendix
166
Appendix 7: Percentage of saying “Yes/Yes”, “Yes/No”, “No/Yes”, “No/No” - WTP survey
Phu Binh and Dinh
Hoa district
Thai Nguyen city Total
Number % Number % Number %
Yes/Yes 56 33.33
31 33.70
87 33.46
Yes/No 52 30.95
36 39.13
88 33.85
No/Yes 31 18.45
8 8.70
39 15.00
No/No 29 17.26
17 18.48
46 17.69
N 168 92 260
Appendix 8: Percentage of saying “Yes/Yes”, “Yes/No”, “No/Yes”, “No/No” - WTA survey
Special use Protection Production Total
Number % Number % Number % Number %
Yes/Yes 31 32.63 33 34.02 18 21.18 82 29.60
Yes/No 35 36.84 28 28.87 27 31.76 90 32.49
No/Yes 18 18.95 23 23.71 21 24.71 62 22.38
No/No 11 11.58 13 13.40 19 22.35 43 15.52
N 95 97 85 277
10 Publication
167
Publication
Nguyen, T.T.H.; Köhl, M.; Neupane, P.R. (2015). Willingness to Accept Compensation for Forest
Protection: A case study in Dinh Hoa district, Northern Vietnam. The Fifth Congress of the East
Asian Association of Environmental and Resource Economics (EAAERE 2015), Taipei, Taiwan.
Nguyen, T.T.H. (2014). Minimum Compensation for Natural Forest Conservation in Vietnam. In Köhl,
M. et al., Approaches for the Improvement of the Economic Sustainability of Natural Forest
Management in the Tropics – including REDD+ mechanism. Berlin: Rhombos-Verl, pp 101-107.
ISBN: 987-3-944101-16-3.
Nguyen, T.T.H. (2010). Set up an Appropriate Set of Economic Criteria and Indicators for Evaluating
Sustainable Forest Management in Dinh Hoa District. Reports of Sustainable Forest
Management Project Dinh Hoa, Johann Heinrich von Thünen-Institut, Hamburg, pp 446-475.