Embed Size (px)
Citation preview
Southern Methodist University Southern Methodist University
SMU Scholar SMU Scholar
Engineering Management, Information, and Systems Research Theses and Dissertations
Engineering Management, Information, and Systems
Fall 2018
Maximizing Financial Benefit of Lean Six Sigma Projects Through Maximizing Financial Benefit of Lean Six Sigma Projects Through
Optimized Selection Criteria Optimized Selection Criteria
Colin Wasiloff Southern Methodist University, [email protected]
Follow this and additional works at: https://scholar.smu.edu/engineering_managment_etds
Part of the Industrial Engineering Commons, Military Vehicles Commons, Operational Research
Commons, Other Engineering Commons, and the Other Operations Research, Systems Engineering and
Industrial Engineering Commons
Recommended Citation Recommended Citation Wasiloff, Colin, "Maximizing Financial Benefit of Lean Six Sigma Projects Through Optimized Selection Criteria" (2018). Engineering Management, Information, and Systems Research Theses and Dissertations. 4. https://scholar.smu.edu/engineering_managment_etds/4
This Dissertation is brought to you for free and open access by the Engineering Management, Information, and Systems at SMU Scholar. It has been accepted for inclusion in Engineering Management, Information, and Systems Research Theses and Dissertations by an authorized administrator of SMU Scholar. For more information, please visit http://digitalrepository.smu.edu.
DISTRIBUTION A. Approved for public release; distribution unlimited.
DISTRIBUTION A. Approved for public release; distribution unlimited.
MAXIMIZING FINANCIAL BENEFIT OF LEAN SIX SIGMA PROJECTS THROUGH OPTIMIZED SELECTION CRITERIA
Approved by:
Dr. Eli Olinick
Dr. Richard Barr
Dr. George Chollar
Dr. Jerrell Stracener
Dr. Sebastian Karwaczynski
DISTRIBUTION A. Approved for public release; distribution unlimited.
DISTRIBUTION A. Approved for public release; distribution unlimited.
MAXIMIZING FINANCIAL BENEFIT OF LEAN SIX SIGMA PROJECTS THROUGH OPTIMIZED SELECTION CRITERIA
A Praxis Presented to the Graduate Faculty of the Bobby
B. Lyle School of Engineering
Southern Methodist
University in
Partial Fulfillment of the
Requirements for the degree of
Doctor of Engineering
with a major in
Engineering Management
by
Colin Michael Wasiloff
(B.S. Physics, Alma College, 2008) (M.S. Engineering Management, Eastern Michigan University, 2013)
December 15, 2018
DISTRIBUTION A. Approved for public release; distribution unlimited.
iii DISTRIBUTION A. Approved for public release; distribution unlimited.
ACKNOWLEDGEMENTS
I would like to sincerely thank all participants from the TACOM Lifecycle Management Command and TARDEC for their support and interest in this Praxis topic. Without your time and support this Praxis and proposed methodology would not have been possible.
I owe a great debt of gratitude to my outstanding doctoral committee: Dr. Eli Olinick, Dr. Richard Barr, Dr. George Chollar, Dr. Jerrell Stracener, and Dr. Sebastian Karwaczynski (TARDEC). Your guidance and attention to this topic and methodology has been world-class.
This work would not have been feasible if it had not been for the following TACOM and TARDEC leadership who saw this Praxis grow from infancy to institutionalization: Mr. Kirndeep Bhamra, Ms. Jennifer Davis, Mr. Ronald Meadows, Mr. David B. Taylor, Mr. Thomas Vern, Dr. David Gorsich, Dr. Paul Rogers, and MG Clark LeMasters.
Thank you also to my previous academic advisors, Dr. Bruce Cameron Reed (Alma College) and Dr. Muhammad Ahmed (Eastern Michigan University) for providing me with the foundation to remain a lifelong learner.
Finally thank you to my family, including Theresa Wasiloff, Jack Wasiloff, James Wasiloff, Deborah Wasiloff, Eric Wasiloff, Lauren Wasiloff, and Michael Whalen for your support throughout this process.
Army Strong!
DISTRIBUTION A. Approved for public release; distribution unlimited.
iv DISTRIBUTION A. Approved for public release; distribution unlimited.
Wasiloff, Colin B.S. Physics, Alma College, 2008 M.S. Engineering Management, Eastern Michigan University, 2013
Maximizing Financial Benefit of Lean Six Sigma Projects through Optimized Selection Criteria
Advisor: Professor Eli Olinick, Ph.D.
Doctor of Engineering Degree Conferred: 12/15/2018 Praxis Completed: 1/18/2018
As evolving threats across the globe keep pace with increasing budget constraints,
the US Army’s major subordinate commands and their sub-organizations are constantly
challenged to do more with less. Resources such as human capital, information
technology, facilities, and budgeted funding are stretched as thin as ever, while
requirements to serve the Warfighter remain paramount. Each dollar of financial benefit
gained through cost reduction efforts at the US Army can affect the Warfighter directly.
Budgeted money saved or avoided is reprogrammed both locally and atop the hierarchy
at the Department of Treasury to serve the Warfighter better.
Ordinal Logistic Regression was performed to analyze the selection criteria and
financial benefit results from Lean Six Sigma projects executed within the US Army’s
Tank-Automotive and Armaments Lifecycle Management Command (TACOM LCMC).
TACOM LCMC Headquarters, its depots, arsenals, Program Executive Offices, and
logistics center reported over $366,000,000 in total Continuous Performance
DISTRIBUTION A. Approved for public release; distribution unlimited.
v DISTRIBUTION A. Approved for public release; distribution unlimited.
Improvement (CPI) financial benefit in fiscal year 16. Seventeen selection criteria from
an array of scholarly articles, textbooks, and proprietary industry sources were analyzed
retroactively against TACOM’s FY16 results.
The study produced a number of organization-specific results, as well as a
modular process that can be used in any industry to analyze project selection criteria and
their effect on an ordinal output. In the case of all FY16 TACOM LCMC projects, it was
found that projects initially selected with the factors of a predicted high financial benefit
or strong internal documentation of poor performance led to the highest probability of
yielding $1M or more in financial benefit. Projects selected with factors of a three
month timeline or internal-only focus led to lower financial benefit results.
This analysis was also performed on non-gated LSS projects executed within the
TACOM LCMC’s depots and arsenals. This analysis case resulted in the significant
factors of having the right non-human capital resources in place or the prediction of a
high benefit corresponding to a positive odds ratio, and again the restriction of a three
month timeline which corresponded to a negative odds ratio with respect to achieving the
highest financial benefit.
Additionally, the Army-specific output measure of readiness was analyzed across
all projects. This study found that factors such as a predicted high financial benefit,
strong leadership buy in, external gap-focused, and the consideration of readiness yielded
a greater probability of achieving the highest levels of readiness when a given project was
complete. Factors such as stretch goals and internal gap-focused decreased the likelihood
of positively affecting readiness.

DISTRIBUTION A. Approved for public release; distribution unlimited.
vi DISTRIBUTION A. Approved for public release; distribution unlimited.
The specific results and underlying process presented in this Praxis will enable
US Army CPI leaders to make better informed decisions which will result in achieving
maximum financial benefit for the betterment of the Warfighter, the Army, Department
of Defense, and United States.
DISTRIBUTION A. Approved for public release; distribution unlimited.
vii DISTRIBUTION A. Approved for public release; distribution unlimited.
TABLE OF CONTENTS
LIST OF FIGURES
LIST OF TABLES
CHAPTER
1. INTRODUCTION…………………………………………………………….1
1.1. Overview of Army CPI……………………………………………...2
1.2. Lean Six Sigma (LSS) Training……………………………………..4
1.3. LSS Project Selection………………………………………………..7
1.4. TACOM LCMC Organization Overview……………………………9
1.5. FY16 CPI Policy Additions………………………………………...15
1.6. FY16 Completed CPI Projects……………………………………...17
1.7. Praxis Research Statement………………………………………….22
2. LITERATURE REVIEW…………………………………………………….24
2.1. Outline………………………………………………………………24
2.2. Textbook Review Methodology…………………………………….26
2.3. Article Review Methodology……………………………………….27
2.4. Organizational Review Methodology………………………………29
2.5. Selection Criteria Themes…………………………………………..30
2.5.1. Focus of Improvement Effort……………………………..32
2.5.2. Resources required for effort……………………………...34
DISTRIBUTION A. Approved for public release; distribution unlimited.
viii DISTRIBUTION A. Approved for public release; distribution unlimited.
2.5.3. Scope of improvement effort……………………………...35
2.5.4. Goals of improvement effort………………………….......37
2.5.5. Current state performance…………………………….......40
2.5.6. Perceived ease of execution…………………………….....42
2.5.7. Organizational buy-in……………………………………..43
2.6. Additional Relevant Topics found in Literature Review……………45
2.6.1. An integrated analytic approach for Six Sigma project
selection ………………………………………………………....45
2.6.2. A systematic methodology for the creation of
Six Sigma projects: A case study of semiconductor foundry……46
2.6.3. Critical success factors of Six Sigma
implementations in Italian companies…………………………...47
2.6.4. How to Identify and Select Lean Six Sigma Projects……..47
2.6.5. Six-Sigma project selection using national
quality award criteria and Delphi fuzzy multiple criteria
decision-making method…………………………………………48
2.6.6. Six Sigma Programs: An implementation model………….49
2.6.7. The role of experience in Six Sigma project success:
An empirical analysis of improvement projects………………...49
2.6.8. Critical success factors for the successful
implementation of six sigma projects in organizations…………..50
3. METHODOLOGIES OF PRAXIS……………………………………….......52
DISTRIBUTION A. Approved for public release; distribution unlimited.
ix DISTRIBUTION A. Approved for public release; distribution unlimited.
3.1. Outline……………………………………………………………….52
3.2. Praxis Process Flow…………………………………………………53
3.2.1. The DMAIC Methodology………………………………..53
3.2.2. Initial Praxis topic discussions……………………………55
3.2.3. Pugh Matrix……………………………………………….56
3.2.4. Finalization of Praxis Topic………………………………57
3.2.5. FY16 Data Pull……………………………………………58
3.2.6. Pareto Analysis……………………………………………59
3.2.7. Descriptive and Graphical Statistics………………………60
3.2.8. Literature Review…………………………………………60
3.2.9. Survey Creation……………………………………….…..62
3.2.10. Survey Question Mapping……………………………….62
3.2.11. Survey Question mockup with Likert Scale……………..64
3.2.12. Praxis Proposal…………………………………………..67
3.2.13. Survey Dissemination……………………………………68
3.2.14. Benchmarking Ordinal Logistic Regression: An
Application to Pregnancy Outcomes…………………………….68
3.2.14.1. Ordinal Logistic Regression.…………………………..71
3.2.14.2. Principal Component Analysis .………………………73
3.2.14.3. Best Subsets Multiple Regression…………………….74
3.2.15. Praxis Defense…………………………………………...75
3.2.16. Commissioning of Praxis Findings……………………...75
DISTRIBUTION A. Approved for public release; distribution unlimited.
x DISTRIBUTION A. Approved for public release; distribution unlimited.
3.3. Measurement System Analysis……………………………………..76
4. ANALYSIS RESULTS
4.1. Outline………………………………………………………………79
4.2. Survey Results………………..……………………………………..80
4.3. Assignment of Ordinal Categories: Financial Benefit…..…………..82
4.4. Ordinal Logistic Regression Summary Results…..…………………83
4.4.1. Ordinal Logistic Regression: All FY16 Results..…………86
4.4.1. Ordinal Logistic Regression: Readiness………..…………90
4.5. Multiple Regression Summary Results……………………………..94
5. DISCUSSION & SUMMARY………………………………………............97
DISTRIBUTION A. Approved for public release; distribution unlimited.
xi DISTRIBUTION A. Approved for public release; distribution unlimited.
LIST OF FIGURES
Figure 1.1. LSS Project Selection Visualization…………………………………………9
Figure 1.2. TACOM LCMC CPI Steering Committee Scope…………………………..10
Figure 1.3. Summary Report for FY16 CPI Financial Benefit………………………….18
Figure 1.4. Boxplot of FY16 CPI Financial Benefit by Program
and Project Type…………………………………………………………………19
Figure 1.5. Pareto Chart of Financial Benefit by CPI Project Type…………………….20
Figure 1.6. Pareto Chart of Completed CPI Project Type………………………………21
Figure 1.7. Summary Report for FY16 LSS Non-Gated Project
Financial Benefit…………………………………………………………………22
Figure 2.1. Pareto Chart of Selection Criteria from Textbook Review…………………27
Figure 2.2. Pareto Chart of Selection Criteria from Article Review……………………28
Figure 2.3. Pareto Chart of Selection Criteria from Organization Review……………..30
Figure 2.4. Pareto Chart of Combined Selection Criteria……………………………....31
Figure 3.1. Praxis Methodologies………………………………………………………53
Figure 3.2. Praxis Selection Matrix…………………………………………………….57
Figure 3.3. Praxis Scoping Diagram……………………………………………………58
Figure 3.4. Praxis Literature Review and Data Collection
Process Diagram…………………………………………………………………61
Figure 3.5. Survey Question to Criteria Mapping Initial Diagram……………………...63
DISTRIBUTION A. Approved for public release; distribution unlimited.
xii DISTRIBUTION A. Approved for public release; distribution unlimited.
Figure 3.6. Survey Question to Criteria Mapping Diagonal Diagram…………………..64
Figure 3.7. Link Function Descriptions….……………………………………………...73
Figure 4.1. Survey Response Summary.…………………………………………….......82
Figure 4.2. Confidence Interval Plot for Odds Ratio……………………………............90
Figure 4.3. Coefficient Plot for Significant Predictors, Readiness...……………............94
Figure 5.1. LSS Project Selection Process- Output Optimized….....…………….........100
Figure 5.2. FY18 CPI Scorecard Overview………………….….....…………….........102
Figure 5.3. Process Capability Calculation…………………..….....……………........103
DISTRIBUTION A. Approved for public release; distribution unlimited.
xiii DISTRIBUTION A. Approved for public release; distribution unlimited.
LIST OF TABLES
Table 1.1. Descriptive Statistics for FY16 CPI Programs……………………………....18
Table 2.1 Organizations Reviewed……………………………………………………..29
Table 2.2. Comparative Ranking of Selection Criteria……………………………….....32
Table 3.1. Measurement System Errors…………………………………………………78
Table 4.1. Survey Response Summary……………..……………………………..….....81
Table 4.2. Ordinal Categories for Financial Benefit.……………………………..…......83
Table 4.3. Ordinal Logistic Regression Results.……………………………..….............85
Table 4.4. Ordinal Logistic Regression Results: All 119 Projects, Financial Benefit......87
Table 4.5. Ordinal Categories for Readiness……....……………………………..…......91
Table 4.6. Ordinal Logistic Regression Results: All 119 Projects, Readiness…….........92
Table 4.7. Multiple Regression Summary Results…………………………..…….........94
Table 4.8. Multiple Regression Results –All FY16……………..…….........................106
DISTRIBUTION A. Approved for public release; distribution unlimited.
1 DISTRIBUTION A. Approved for public release; distribution unlimited.
CHAPTER 1
INTRODUCTION
On March 13, 2017, United States President Donald Trump signed an executive
order tasking federal agencies with reducing waste through reevaluation and
reorganization. According to the President at the time of signing the order, every
executive branch agency will be called upon to “identify where money can be saved and
services improved” (Katz, 2017, para. 2).
The U.S. Army uses a combination of Continuous Performance Improvement
(CPI) tools to reduce costs and remove waste from its processes and products. The tools
used are Lean Six Sigma (LSS) and Value Engineering (VE; U.S. Army Office of
Business Transformation [OBT], 2007). In this section, the background and practical
application of both tools and their governing programs will be discussed. Following this
section, practitioners’ training and methods for selecting qualified projects are presented.
Lean Six Sigma is defined as a management discipline combining the ideals of
working better (Six Sigma) and working faster (Lean; OBT, 2007). Six Sigma and its
tools focus on centering a process’ output on a target while reducing variation. Lean
tools aim to remove waste, such as transportation, inventory, motion, waiting, over-
processing, overproduction, and defects. By combining disciplines into one approach,
many Fortune 500 companies and public organizations have experienced increased
customer satisfaction and lower costs through defect and process lead-time reduction.
DISTRIBUTION A. Approved for public release; distribution unlimited.
2 DISTRIBUTION A. Approved for public release; distribution unlimited.
Value Engineering is a method used to reduce product cost through functional
analysis. Whereas LSS focuses on improving the process, VE focuses on improving the
product. Lawrence Miles (2015), the originator of the term “Value Analysis,” defines VE
as a method to assess the function of a product, facility, or process to determine ways to
provide the needed functions in a cost effective manner. Public Law 104-106 (National
Defense Authorization Act for Fiscal Year 1996) defined VE as the analysis of the
functions of a program, project, system, product, or item of equipment, building, facility,
service, or supply of an executive agency performed by qualified agency or contractor
personnel, directed at improving performance, reliability, quality, safety, and life cycle
costs.
1.1. Overview of Army CPI
VE and LSS contribute to the U.S. Army’s mission by lowering costs of processes
and products, allowing higher leadership to re-allocate or budget monetary and time
savings to serve the Warfighter better. The focus of this research is on the LSS program,
and how projects are selected by the organization.
“The goal of the Lean Six Sigma deployment, which includes civilians and
contractors as well as active duty, Army Reserve and National Guard personnel, is to
“make the business side of the Army as efficient as the war-fighting side is effective”
(Rezek as cited in Schmidt, n.d., para. 5). The U.S. Army is now examining its processes
as business transactions, even down to an individual solider. Every time a soldier is paid,
supplied, moved from point A to point B, a process has been executed and a transaction
has occurred.
DISTRIBUTION A. Approved for public release; distribution unlimited.
3 DISTRIBUTION A. Approved for public release; distribution unlimited.
In 2006 the Department of Army developed a Lean Six Sigma program that is
supported throughout all of its major commands. The Army OBT is the headquarters for
training, certification, and metrics of the program and its practitioners. Common training,
project tracking, and continuous process improvement are pillars of the program that has
seen more than 7,000 individuals’ complete forms of the training.
The Army CPI organizational hierarchy has well-defined roles. The Army’s CPI
program relies heavily on senior leaders to assume responsibility for setting the pace and
direction of the programs and projects. Senior leaders are accountable for the results of
CPI programs, and are often evaluated on their results. For example, in fiscal year (FY)
2016, the TACOM Deputy Commanding General reported over $366 million in financial
benefits resulting from CPI efforts. Senior leaders also allocate or delegate the
responsibility for resources to attend training and work projects that would not normally
be included in regular job duties.
Strategic Leadership ultimately sets the stage for Deployment Directors to arrange
resources to meet the overall need of the organization. Deployment Directors are
typically experienced CPI professionals who oversee a deployment plan for their
organization. Their responsibilities include managing resources, meeting deadlines, and
maintaining the overall CPI project portfolio. The Deployment Director ensures that
project teams are properly staffed with mentors and resource managers, who validate a
projects financial benefit claims.
The organizational hierarchy is divided into levels that are designated with
colored belts. For example, Master Black Belts (MBB) report to Deployment Directors
DISTRIBUTION A. Approved for public release; distribution unlimited.
4 DISTRIBUTION A. Approved for public release; distribution unlimited.
and can be found at various levels of an organization. They are responsible for leading
complex projects and identifying future projects. A major aspect of the MBB role is
mentoring Black and Green Belt candidates through certification. A typical workload for
an MBB can include mentoring as many as five individuals with lower-level belts, while
leading two to three projects at a time.
Black and Green Belt associates comprise the ground troop aspect of the Army’s
LSS program. These associates are deployed to solve complex issues using standardized
methods and tools. Black and Green Belt associates report to their own leadership, as
well as MBBs and other subject matter experts to accomplish tasks, leading to the
development and implementation of an improved product or process.
1.2. Lean Six Sigma Training
CPI programs rely heavily on human capital. The importance of LSS
methodology and tools training was abundant in the literature review completed for this
research. The U.S. Army LSS training program has resulted in over 600 Green Belt
associates, 500 Black Belt associates, and nearly 140 MBBs at the time of this research.
While substantially greater numbers of individuals attempt to complete training at each
belt level, less actually complete the program’s certification requirements, and fewer
remain in a LSS-relevant role. For example, 92 MBBs were active practitioners at the
time of this research. LSS training is consistent for all Army civilians and military
members; with consistent course materials, methodologies, and tools used in the
instructional process, regardless of application or location.
Green Belt training is a two-week course that provides applicants with an
DISTRIBUTION A. Approved for public release; distribution unlimited.
5 DISTRIBUTION A. Approved for public release; distribution unlimited.
understanding of LSS principles and tools, as well as project management fundamentals.
Successful graduates can become active contributors to Black Belt projects and lead
small-scope LSS projects. Topics of the training include: establishing effective
improvement teams; understanding the voice of the customer; and implementing the
Define, Measure, and Analyze, Improve, and Control (DMAIC) methodology. The
training incorporates a three-week break between the two weeks to allow candidates to
work on their assigned LSS projects.
Black Belt training is a four-week course that builds on the Green Belt course and
familiarizes students with the principles, practices, and tools of LSS to maximize cost
reductions and improve customer satisfaction. Covered topics include an overview of
LSS, as well as all aspects of traditional DMAIC methodology and tools. Associates who
successfully complete the course are expected to be able to identify non-value-added
activities and lead teams tackling larger scoped and more complex projects. The Black
Belt curriculum accommodates students with no prior LSS experience as the Green Belt
training is not a prerequisite for course attendance. A three-week break is incorporated
between each of the four weeks of training to allow candidates to work on their assigned
LSS projects.
Master Black Belt training is a three-week course that builds on the Black Belt
course. MBB training and certification provides the foundation for Army organizations
to have in-house experts to disseminate LSS policy, execute enterprise-level projects and
provide support to training. Successful MBB graduates also provide coaching and
mentoring to Strategic Leaders, Deployment Directors, Process Owners, Project
DISTRIBUTION A. Approved for public release; distribution unlimited.
6 DISTRIBUTION A. Approved for public release; distribution unlimited.
Sponsors, Black Belts and Green Belts. Topics covered in the MBB curriculum include
teaching and coaching LSS; reinforcing behavioral concepts; and LSS curriculum
―teach backs, in which students instruct their peers. All MBB candidates (MBBc) must
first be certified as an Army Black Belt to attempt the course and certification. In addition
to LSS skills and knowledge, MBBs must demonstrate leadership ability, organizational
and management abilities, good instructional techniques, group facilitation skills and
organizational change skills before being admitted into the training (Army Lean Six
Sigma Deployment Guidebook, 38). There is generally a three-week break between each
week of training so that candidates can work on their second LSS DMAIC project.
A testament to the training, in FY 16, there were 29 Green Belt, 29 Black Belt,
and 4 Master Black Belt training courses scheduled and executed. The typical class size
is around 30 students for the Green and Black Belt programs, and 10 to 15 students for
the Master Black Belt program. Two full time instructors split the workload of training
the belt candidates while a Deployment Director who is a senior MBB is typically on
hand to support as needed.
The Army Master Black Belt exam is comprehensive and includes material from
all belt-levels; the 6.5-hour test encompasses non-parametric statistics, Lean
methodologies, coaching, teaching, and extensive use of the Minitab statistical software.
Students may use only their statistics books and course notes while attempting the
proctored exam. Historically, there is a 66% pass rate for Master Black Belts sitting for
the exam, and even lower rates become full-fledged Master Black Belts. Because of their
expertise and leadership qualities, Army MBBs are often poached by outside
DISTRIBUTION A. Approved for public release; distribution unlimited.
7 DISTRIBUTION A. Approved for public release; distribution unlimited.
organizations offering lucrative career opportunities, leaving gaps in the Army’s CPI
project deployment.
Additionally, certified MBBs often use the training and certification processes, as
well as the organizational publicity, to advance to higher level positions, often leading
them outside of the CPI realm. At the time of this research, over one-third of the Army
certified MBB population were no longer involved in CPI inside the Federal
Government.
1.3. LSS Project Selection
One critical aspect of the MBB role is to facilitate the selection of LSS projects
for execution. While ultimately at the discretion of leadership, MBBs are called on to
give input towards the selection of projects for both new and experienced Belts to lead.
The Army CPI program recognizes two sub-groups of LSS projects, “gated” and “non-
gated.”
Gated projects follow the Define Measure Analyze Improve Control (DMAIC)
construct, where the term “gated” comes from the mandatory tollgate meeting between
each phase. A tollgate is intended for the process owner, champion, and other key
stakeholders to review the progress of the project team, and give a go or no-go decision
on continuing the effort. This practice allows close examination of resources and
facilitates discussion on the perceived outcomes of the effort as it progresses through the
DMAIC phases. Typical gated projects require anywhere from 6-12 months of full time
effort for a belt, or belt candidate, and are assigned MBB mentors to ensure the proper
DISTRIBUTION A. Approved for public release; distribution unlimited.
8 DISTRIBUTION A. Approved for public release; distribution unlimited.
use of the DMAIC methodology and its tools. In addition to the tollgate meetings, gated
projects are carefully monitored from their selection through completion and reporting of
operational and financial benefit by Deployment Directors by monthly or weekly sync
meetings.
Gated projects are required for all Army LSS Belts seeking certification. Every
training module within the Army’s LSS program of instruction can be linked back to
various stages of the DMAIC philosophy, providing LSS students a roadmap for linking
the proper tools together and increasing the probability of successful completion of a
project. Because of the rigorous and resource-intensive nature of gated LSS projects, the
Army has adopted a common project selection process. The formal Project Identification
and Selection Workshop (PISW) is executed by senior leaders, MBBs, and process
owners to match process improvement opportunities to Belt candidates. The selection
criteria for gated LSS projects are defined through the PISW process as relating to the
organization’s strategic, financial, customer and process-focused “value levers,” (Army
Lean Six Sigma Deployment Guidebook, 46).
After a Belt achieves certification status, he or she is immediately eligible to
complete “non-gated” style process improvement projects to be counted towards an
organization’s CPI goal. Certified Belts have demonstrated the skills and abilities to
complete a gated project, pass a rigorous project review process, and are now entrusted
with executing additional projects, some in a full-time capacity. Because there is no
formal certification sought by completing a non-gated project, the methodologies and
tools used can vary from project to project. Often, non-gated projects are smaller in
DISTRIBUTION A. Approved for public release; distribution unlimited.
9 DISTRIBUTION A. Approved for public release; distribution unlimited.
scope, requiring less resources than a gated project. A non-gated project may be ideated,
selected, initiated, and then completed with minimal oversight from leadership. The
focus of non-gated efforts center on the output results of the project itself.
The selection criteria for non-gated LSS projects in the Army are not defined nor
optimized for the greatest financial benefit. In fact, in the Army’s LSS Deployment
Guidebook, non-gated projects are only briefly mentioned and given standard template
treatments, but no selection methodology nor selection criteria are outlined.
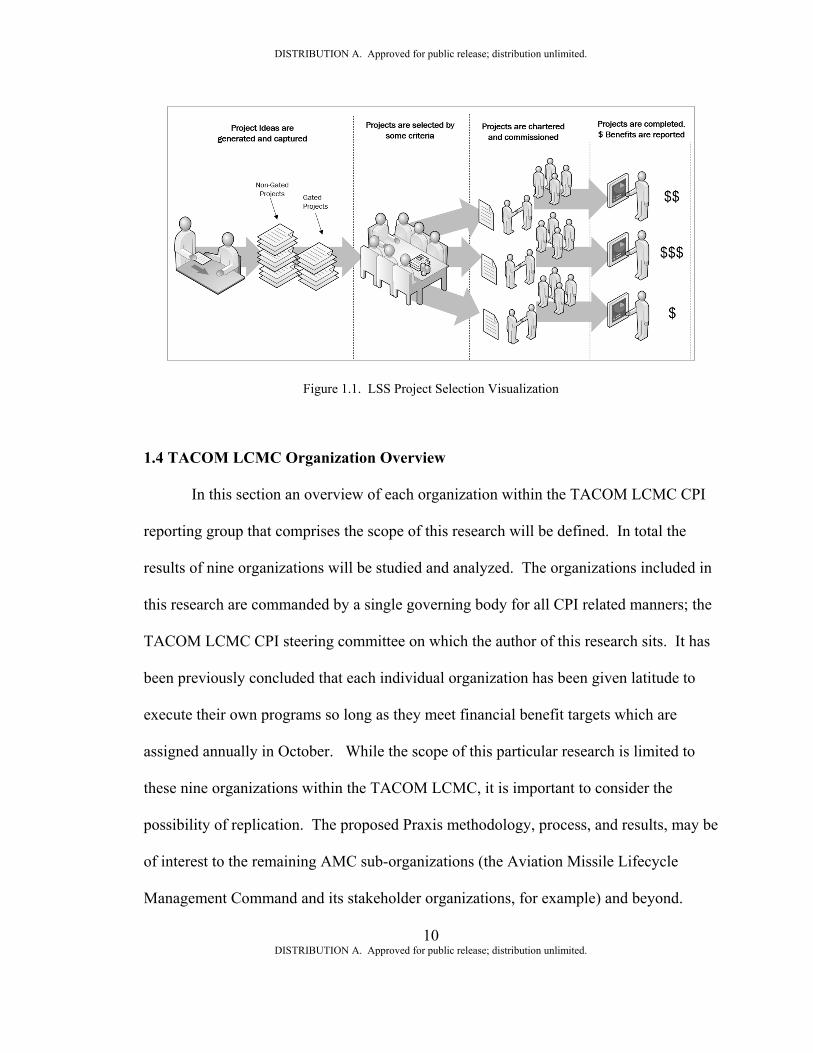
A visualization of the current CPI project selection process is displayed in Figure
1.1. Based on a number of internal stakeholder interviews, it was determined that the
LSS gated project selection process within TACOM LCMC followed a relatively
common process within each sub-organization. Project ideas are generated, captured, and
commissioned after selection. After projects are completed, the total benefits are
validated and reported. However, it was also clear during initial discussions that the
process to decide which CPI projects to pursue did not always follow the PISW process
exactly for gated projects, and non-gated projects were in most cases selected by ad-hoc
criteria at best. The table depicted in the middle of the visualization depicts the sub-
organizations CPI project selection committee.
DISTRIBUTION A. Approved for public release; distribution unlimited.
10 DISTRIBUTION A. Approved for public release; distribution unlimited.
Figure 1.1. LSS Project Selection Visualization
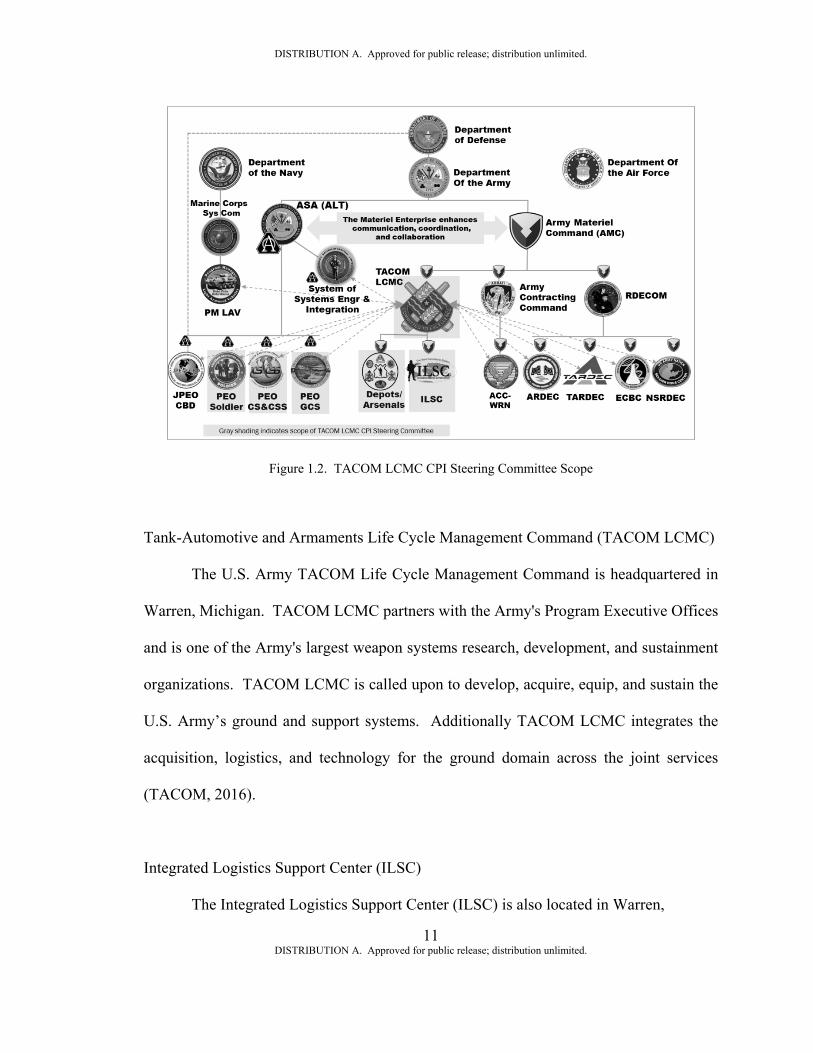
1.4 TACOM LCMC Organization Overview
In this section an overview of each organization within the TACOM LCMC CPI
reporting group that comprises the scope of this research will be defined. In total the
results of nine organizations will be studied and analyzed. The organizations included in
this research are commanded by a single governing body for all CPI related manners; the
TACOM LCMC CPI steering committee on which the author of this research sits. It has
been previously concluded that each individual organization has been given latitude to
execute their own programs so long as they meet financial benefit targets which are
assigned annually in October. While the scope of this particular research is limited to
these nine organizations within the TACOM LCMC, it is important to consider the
possibility of replication. The proposed Praxis methodology, process, and results, may be
of interest to the remaining AMC sub-organizations (the Aviation Missile Lifecycle
Management Command and its stakeholder organizations, for example) and beyond.
DISTRIBUTION A. Approved for public release; distribution unlimited.
11 DISTRIBUTION A. Approved for public release; distribution unlimited.
Figure 1.2. TACOM LCMC CPI Steering Committee Scope
Tank-Automotive and Armaments Life Cycle Management Command (TACOM LCMC)
The U.S. Army TACOM Life Cycle Management Command is headquartered in
Warren, Michigan. TACOM LCMC partners with the Army's Program Executive Offices
and is one of the Army's largest weapon systems research, development, and sustainment
organizations. TACOM LCMC is called upon to develop, acquire, equip, and sustain the
U.S. Army’s ground and support systems. Additionally TACOM LCMC integrates the
acquisition, logistics, and technology for the ground domain across the joint services
(TACOM, 2016).
Integrated Logistics Support Center (ILSC)
The Integrated Logistics Support Center (ILSC) is also located in Warren,
DISTRIBUTION A. Approved for public release; distribution unlimited.
12 DISTRIBUTION A. Approved for public release; distribution unlimited.
Michigan. The ILSC is responsible for sustaining warfighting readiness and managing a
large part of the Army’s investment in weapon systems. Nearly 3,000 weapon systems
that form the core of the Army’s war fighting capability are managed by the ILSC.
Additionally, the ILSC is responsible for the entire life cycle support of aircraft
armament, small arms, field artillery, mortars, tools and training systems, tactical
vehicles, light and heavy combat vehicles, watercraft, soldier/biological/chemical
systems and deployment/support equipment (ILSC, 2016).
Anniston Army Depot (ANAD)
Anniston Alabama’s Anniston Army Depot is the designated Center of Industrial
and Technical Excellence for the Army’s tracked and wheeled ground combat vehicles
(excluding the Bradley fighting vehicle). ANAD is also responsible for the Army’s
towed and self-propelled artillery, assault bridging systems, individual and crew served
small caliber weapons and locomotives, rail equipment and non-tactical generators.
ANAD is also responsible for performing depot-level maintenance on vehicle systems
such as the M1 Abrams tank, M88 Recovery Vehicle, Stryker, M113 M9 Ace Combat
Earthmover and the Assault Breacher Vehicle. ANAD completes overhauls on major
components of each vehicle and returns them to service (ANAD, 2016).
Rock Island Arsenal (RIA)
Located in Rock Island, IL, the Rock Island Arsenal is chartered to provide
manufacturing, logistics, and base support services for the Armed Forces. RIA is an
DISTRIBUTION A. Approved for public release; distribution unlimited.
13 DISTRIBUTION A. Approved for public release; distribution unlimited.
active U.S. Army factory, which manufactures ordnance and other equipment. Some of
the Arsenal's most successful manufactured products include the M198 and M119 Towed
Howitzers, and the M1A1 gun mount. Rock Island Arsenal is home to more than 70
Department of Defense, federal and commercial tenant organizations, including the
headquarters of three major worldwide Army organizations, four regional Army offices,
and also hosts the Rock Island site of the Defense Finance and Accounting Service
(Security, 2016).
Red River Army Depot (RRAD)
Established in Texarkana, TX, the Red River Army Depot sustains the
Warfighter’s combat power by providing ground combat and tactical systems sustainment
maintenance operations. RRAD provides maintenance and repair on the Army’s tactical
wheeled vehicles which includes the High Mobility Multipurpose Wheeled Vehicle
(HMMWV) and Mine Resistant Ambush Protected Vehicle (MRAP). In its mission
statement, RRAD claims to seek building and rebuilding the highest quality vehicles at
the lowest cost in the least amount of time (RRAD, 2016).
Sierra Army Depot (SIAD)
Located in Herlong, CA, the Sierra Army Depot is chartered for new Army
system assembly, reset, repair, rebuild, and various fielding support. Additionally, SIAD
completes New Equipment Training (NET). SIAD offers the unique capability to
receive, identify, classify, record store, and manage items while retaining the ability to
DISTRIBUTION A. Approved for public release; distribution unlimited.
14 DISTRIBUTION A. Approved for public release; distribution unlimited.
ship assets world-wide. Ground vehicle reclamation activities seek to provide a readiness
and operational value to the Army and the nation through management and assets
redistribution to meet future and urgent needs (SIAD, 2016).
Watervliet Arsenal (WVA)
Situated on the west bank of the Hudson River in New York, Watervliet Arsenal
seeks to provide the U.S. Army with manufacturing, engineering, procurement, and
quality assurance for cannons, mortars and associated materiel throughout the acquisition
life cycle. The site of the arsenal has been declared a National Historic Landmark. WVA
manufactures products that support and sustain warfighters with respect to artillery,
cannons, mortars and integration with tank and automotive platforms (WVA, 2016).
Program Executive Office for Combat Support and Combat Service Support (PEO
CS&CSS)
The Program Executive Office for Combat Support and Combat Service Support
is part of the acquisition detachment of the U.S. Army that leads an innovative,
disciplined lifecycle management team. PEO CS&CSS is located on the same campus
(Detroit Arsenal) as the TACOM headquarters and ILSC in Warren, MI.
The team seeks to enable Warfighters by unburdening Soldiers in the field and
constantly providing and improving the integrated, combat-enabling systems they need to
dominate the full spectrum of Joint and Unified Land Operations. The vision of the PEO
DISTRIBUTION A. Approved for public release; distribution unlimited.
15 DISTRIBUTION A. Approved for public release; distribution unlimited.
CS&CSS organization is to deliver effective, affordable combat-enabling capabilities
before the point of need (CS&CSS, 2016).
Program Executive Office Ground Combat Systems (PEO GCS)
Also located on Detroit Arsenal is the Program Executive Office for Ground
Combat Systems (PEO GCS). PEO GCS is responsible for providing sustainable ground
combat equipment to Warfighters. By focusing on developing advanced technologies,
PEO GCS is leading the design and development of the Army's Future Fighting Vehicle
and Armored Multi-Purpose Vehicle, the Army's highest priority combat vehicle. Foreign
Military Sales are also vital to PEO GCS’ portfolio which benefits U.S. national security
and foreign policy objectives (GCS, 2016).
Program Executive Office Soldier (PEO Soldier)
Located on Ft. Belvoir, PEO Soldier seeks to provide soldiers with the finest
equipment and protection available as quickly as possible. The organization invests in
soldiers to give them the decisive edge while also being good stewards of taxpayer
funding. The Program Management Office’s organizational structure offers the essential
platform needed to design, develop, procure and field the hundreds of pieces of
equipment used to enhance Soldiers’ performance and safety. PEO Solider oversee a
total of nine Product Management Offices and Directorates that are responsible for
managing the life cycles of virtually everything Soldiers wear or carry into combat
(Soldier, 2016).
DISTRIBUTION A. Approved for public release; distribution unlimited.
16 DISTRIBUTION A. Approved for public release; distribution unlimited.
1.5. FY16 CPI Policy Additions
For Fiscal Year 2016, AMC signed and disseminated two relevant CPI policies
and an overarching CPI plan that facilitated the completion of this research. The
existence and adoption of these policy documents allows, for the first time, a high quality
set of Army CPI data to analyze and draw conclusions from. Due to the length of time
required to write and implement these policies and plan, and the sub-organization’s
acceptance, it is unlikely that AMC’s sub-organizations will receive significant updates to
these documents in the near future.
The first policy signed into effect for FY16 ensures that financial benefits claimed
by each CPI project were reviewed and approved by an objective third-party Resource
Manager (RM). The RM is defined in the policy as a budget expert, typically from the
organization’s Resource Management organization, sometimes referred to as the G8.
Based on the new policy, an RM is now mandated to examine all financial benefit claims
for accuracy, as well as appropriately designate the budget affected by selecting a number
of tags in the CPI system of record (the PowerSteering Application which will be
discussed later). The financial tags included in the RM’s review include the Management
Decision Package (MDEP), Appropriation code (APPN), Army Program Element (APE)
and Resource Organization Code (ROC). These tags trace financial benefits back to their
original funding source. Also mandated by this policy is the inclusion of an RM approval
form to be uploaded with each completed project. This form includes the RM’s signature
indicating that the financial benefits yielded from the project were accurately calculated
DISTRIBUTION A. Approved for public release; distribution unlimited.
17 DISTRIBUTION A. Approved for public release; distribution unlimited.
and ready to be re-programmed or spent on other unfunded requests. For the first time in
the Army CPI program history there is now a policy ensuring that the financial benefit
data recorded is accurate in the eyes of the budget owner, RM and other budget
administrators.
The second AMC policy signed and adopted in FY16 concerns the reporting of
CPI projects and their results. This policy mandates that each CPI project is captured in
the authoritative reporting source known as PowerSteering. The policy also designates
the standard operating procedure used to upload and submit completed project
documentation, including approved financial benefit packages reviewed and signed by
the RM into the PowerSteering application. Additionally, the policy gives guidance to all
users on how to properly use the PowerSteering application from the initiation of a CPI
project through closure and final reporting. This policy ensures that starting in FY16
every CPI project was captured in a single data source, allowing us to pull data with both
high confidence and relative ease.
A FY16 CPI plan integrating the LSS and VE programs was also disseminated to
CPI Deployment Directors and practitioners from AMC. This plan outlined the
combination of the LSS and VE reporting structure, set financial benefit goals for both
LSS and VE programs at the organization level, and mandated that each organization
draft and approve a strategic plan for reaching those targets. The strategic plans, which
are reviewed and kept on file at AMC, include sections on program leadership and risks,
development of human capital, and program self-sufficiency. Because both LSS and VE
programs are now being reported under a single management structure, AMC is able to
DISTRIBUTION A. Approved for public release; distribution unlimited.
18 DISTRIBUTION A. Approved for public release; distribution unlimited.
view the results of both programs at various organizational levels as well as individual
projects.
1.6. FY16 Completed CPI Projects
Fiscal Year 16 resulted in $366M in financial benefit for the CPI program within
the TACOM LCMC. This figure includes both the Value Engineering and Lean Six
Sigma results, both of which can be further divided into categories of gated and non-
gated projects (gated VE projects use the “DMEDI” approach). Some projects completed
within the CPI construct are focused only on an operational benefit. Projects in this
category do not result in a financial benefit whatsoever. These projects, which are
important to the Army for purposes of improving safety, stewardship or other workplace
initiatives, are shown in the following graphical summary, descriptive statistics and
boxplot charts along with the projects resulting in financial benefits. We will be using
the entire data set for our analysis.
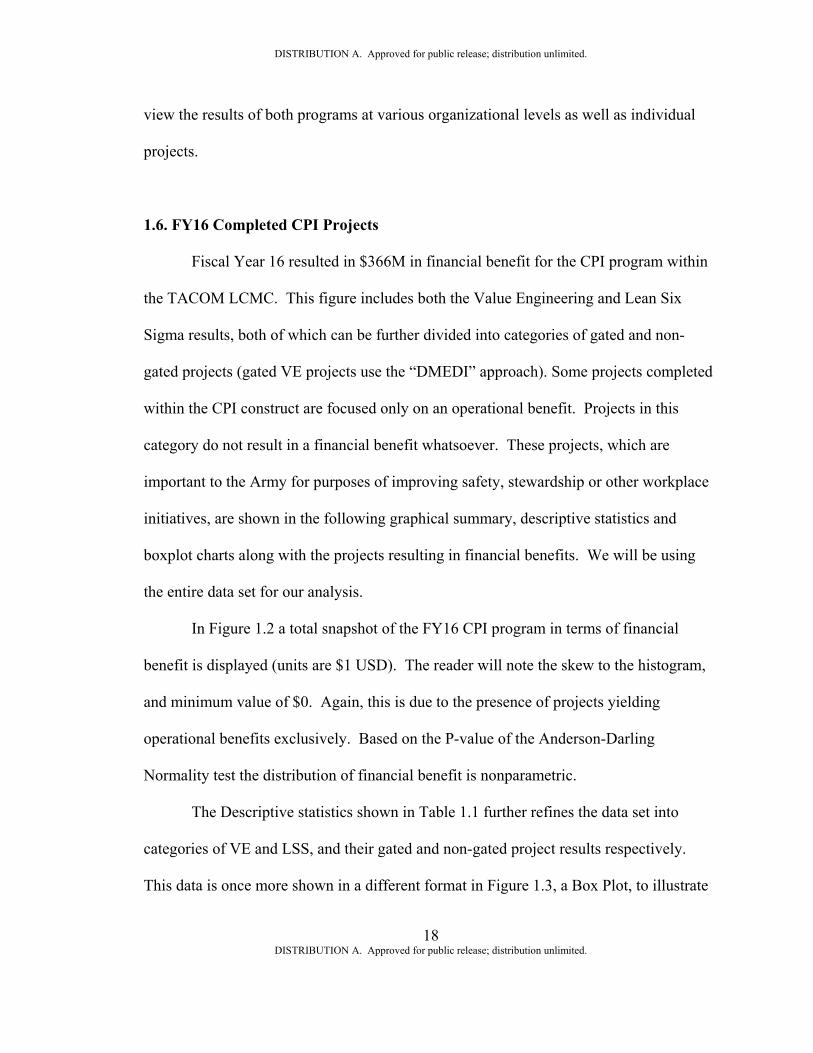
In Figure 1.2 a total snapshot of the FY16 CPI program in terms of financial
benefit is displayed (units are $1 USD). The reader will note the skew to the histogram,
and minimum value of $0. Again, this is due to the presence of projects yielding
operational benefits exclusively. Based on the P-value of the Anderson-Darling
Normality test the distribution of financial benefit is nonparametric.
The Descriptive statistics shown in Table 1.1 further refines the data set into
categories of VE and LSS, and their gated and non-gated project results respectively.
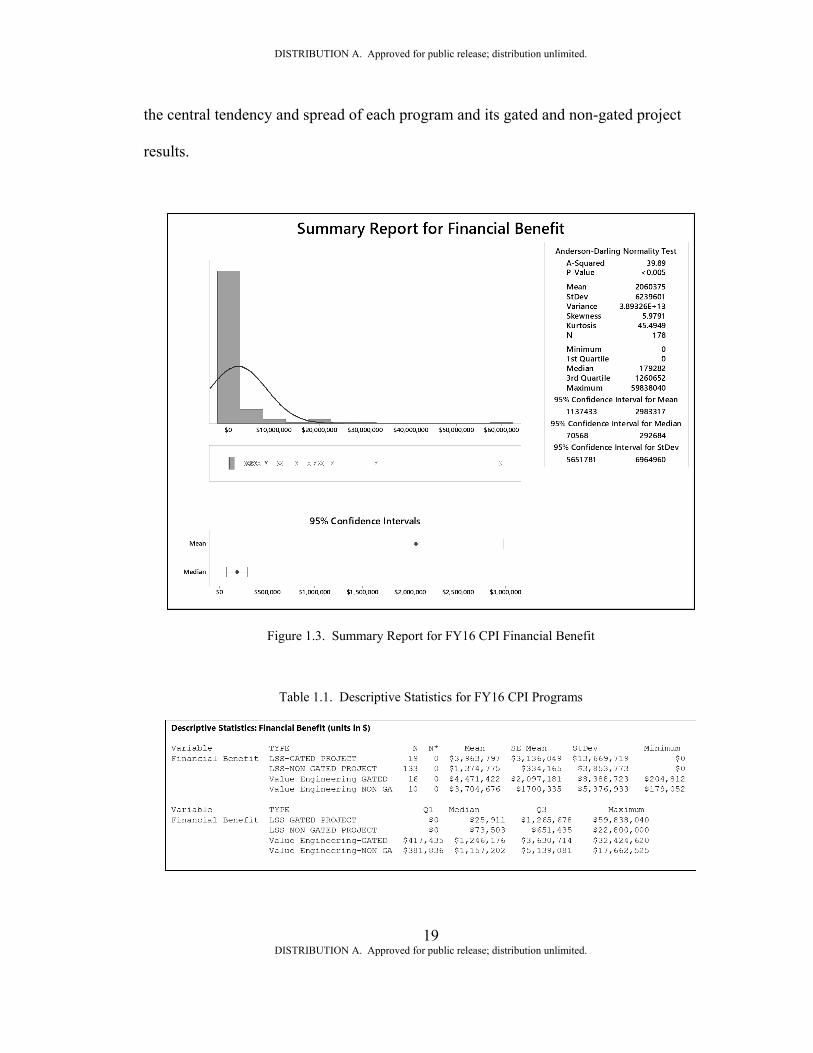
This data is once more shown in a different format in Figure 1.3, a Box Plot, to illustrate
DISTRIBUTION A. Approved for public release; distribution unlimited.
19 DISTRIBUTION A. Approved for public release; distribution unlimited.
the central tendency and spread of each program and its gated and non-gated project
results.
Figure 1.3. Summary Report for FY16 CPI Financial Benefit
Table 1.1. Descriptive Statistics for FY16 CPI Programs
DISTRIBUTION A. Approved for public release; distribution unlimited.
20 DISTRIBUTION A. Approved for public release; distribution unlimited.
Figure 1.4. Boxplot of FY16 CPI Financial Benefit by CPI Project Type
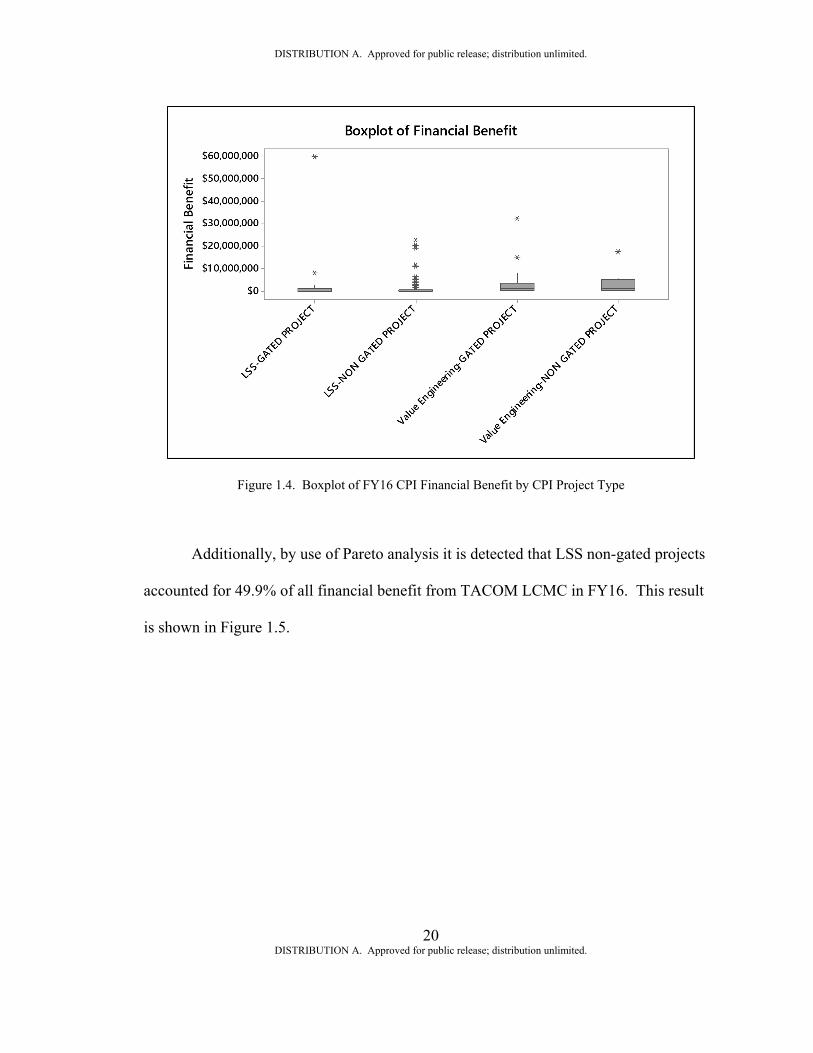
Additionally, by use of Pareto analysis it is detected that LSS non-gated projects
accounted for 49.9% of all financial benefit from TACOM LCMC in FY16. This result
is shown in Figure 1.5.
DISTRIBUTION A. Approved for public release; distribution unlimited.
21 DISTRIBUTION A. Approved for public release; distribution unlimited.
Figure 1.5. Pareto Chart of Financial Benefit by CPI Project Type
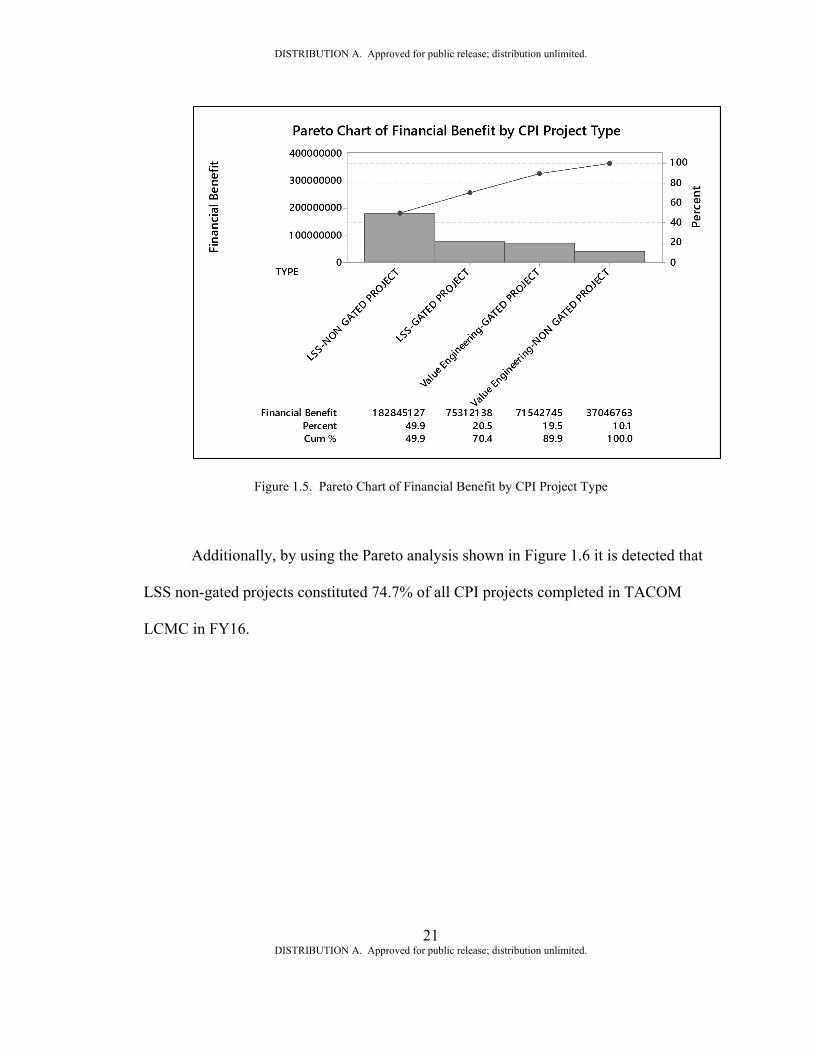
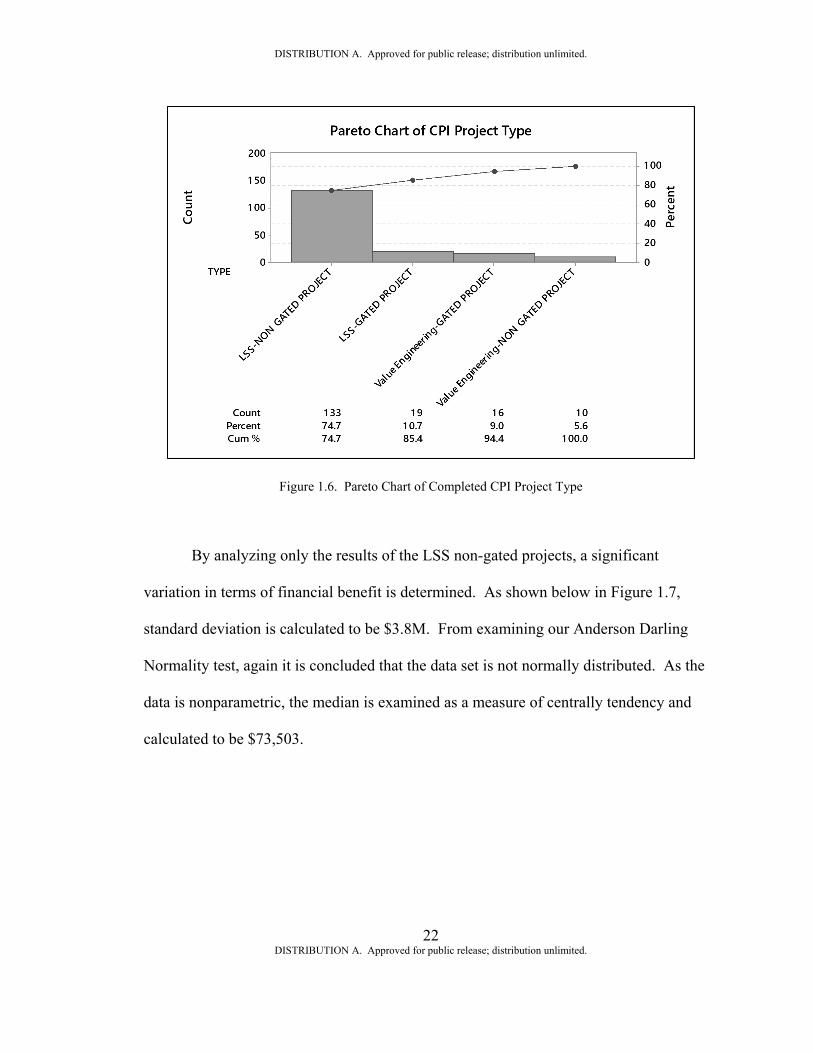
Additionally, by using the Pareto analysis shown in Figure 1.6 it is detected that
LSS non-gated projects constituted 74.7% of all CPI projects completed in TACOM
LCMC in FY16.
DISTRIBUTION A. Approved for public release; distribution unlimited.
22 DISTRIBUTION A. Approved for public release; distribution unlimited.
Figure 1.6. Pareto Chart of Completed CPI Project Type
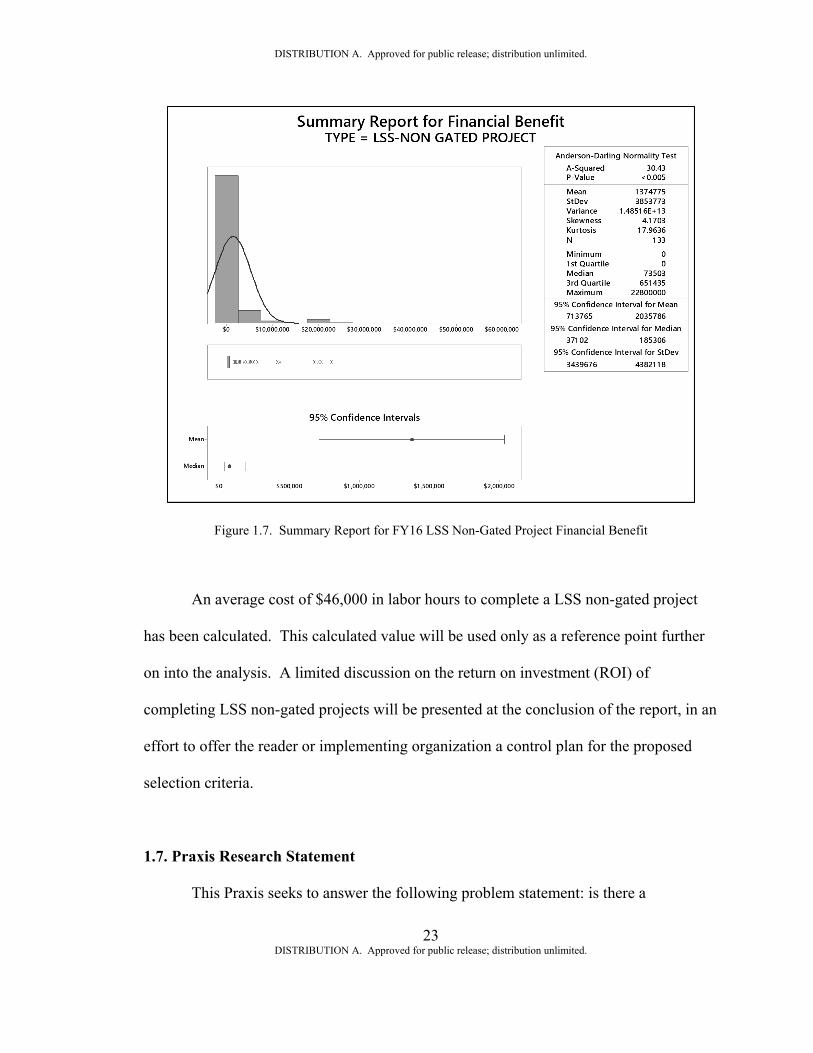
By analyzing only the results of the LSS non-gated projects, a significant
variation in terms of financial benefit is determined. As shown below in Figure 1.7,
standard deviation is calculated to be $3.8M. From examining our Anderson Darling
Normality test, again it is concluded that the data set is not normally distributed. As the
data is nonparametric, the median is examined as a measure of centrally tendency and
calculated to be $73,503.
DISTRIBUTION A. Approved for public release; distribution unlimited.
23 DISTRIBUTION A. Approved for public release; distribution unlimited.
Figure 1.7. Summary Report for FY16 LSS Non-Gated Project Financial Benefit
An average cost of $46,000 in labor hours to complete a LSS non-gated project
has been calculated. This calculated value will be used only as a reference point further
on into the analysis. A limited discussion on the return on investment (ROI) of
completing LSS non-gated projects will be presented at the conclusion of the report, in an
effort to offer the reader or implementing organization a control plan for the proposed
selection criteria.
1.7. Praxis Research Statement
This Praxis seeks to answer the following problem statement: is there a
DISTRIBUTION A. Approved for public release; distribution unlimited.
24 DISTRIBUTION A. Approved for public release; distribution unlimited.
relationship between LSS project selection criteria and financial benefit? We can
represent this practical problem as a general statistical problem with a null and alternate
hypotheses:
Ho: There is no relationship between selection criteria and LSS project’s financial
benefits for FY16 at US ARMY TACOM LCMC
Ha: There is a relationship between selection criteria and LSS project’s financial
benefits for FY16 at US ARMY TACOM LCMC
Furthermore, if this research is able to reject the null hypothesis and in fact
conclude that a relationship between selection criteria and the financial benefit of LSS
project exists, a mathematical model and optimal set of criteria will be provided as
appropriate. The output of this research will affect change at the TACOM LCMC level
and above, resulting in the ability to select projects based on maximizing financial
benefit.
The remainder of this proposal includes a literature review of CPI selection
criteria as well as a proposed methodology for capturing and analyzing data required to
answer our research statement. CPI selection criteria from textbooks, scholarly articles,
and four organizations were catalogued, analyzed, and decomposed to formulate a survey
in order to retrospectively analyze the financial benefit of FY16 TACOM LCMC LSS
non-gated projects. The analysis section of this proposal will include detail on how the
data will be analyzed, as well as provide a historical reference for the development of this

DISTRIBUTION A. Approved for public release; distribution unlimited.
25 DISTRIBUTION A. Approved for public release; distribution unlimited.
Praxis research, allowing replication and further research.
DISTRIBUTION A. Approved for public release; distribution unlimited.
26 DISTRIBUTION A. Approved for public release; distribution unlimited.
CHAPTER 2
REVIEW OF LITERATURE
2.1. Outline
Due to the large volume of literature available, this research relies on a sample of
both scholarly articles and textbooks to establish a baseline for LSS project selection
criteria. Additionally, four organizations’ proprietary LSS project selection criteria have
been obtained and will also be used in the analysis. All four organizations studied
displayed a significant LSS program at the time of this research, and as such their
respective selection criteria are expected to have been evolved over their program’s
existence. Due the proprietary nature of the organizations discussed, the individual
organizations will be described at a high level, but no formal identifiers will be used. It
should be noted that throughout the literature review phase of this Praxis, no scholarly
articles, textbooks, or organizational selection methods were found to contain selection
criteria specifically for LSS non-gated projects.
The process of decomposing lists of criteria or even paragraphs of insight from
the sources was a painstaking effort, sometimes calling for a one-to-many transfer of
information, and requiring high energy discussion between the author, stakeholders, and
subject matter experts. Each selection criteria discovered from the selected literature
sources was cataloged, analyzed, decomposed and translated into generic criteria
statements and then affinitized into common groups. The process was repeated each time
DISTRIBUTION A. Approved for public release; distribution unlimited.
27 DISTRIBUTION A. Approved for public release; distribution unlimited.
a new source was added to the analysis, and then the entire sample was affinitized again
by four groups of impartial LSS students as part of a class exercise.
To give an example of the how the decomposition process worked, the verbatim
project selection criteria from George Eckes’ book The Six Sigma Revolution, “It is
strongly recommended that the first set of criteria will be the strategic business objectives
of the organization,” was translated to the more generic criterion “Effort was strongly
linked to one or more of the organization's strategic goals at the time of selection,” to be
used in retrospective analysis. This statement was originally affinitized as an
“Organization-Focused” criterion, and upon second pass it was re-classified as an
“Improvement Focus-Internal,” criterion as the list of potential criteria grew.
This decomposition and affinitization process yielded a manageable list of
possible criteria that had redundancies removed, while retaining the original source
traceable to each criterion statement. Over 140 individual criteria from the literature
review, and a single additional implied criterion (pertaining to changes of scope), were
mapped to 17 questions that will be used to formulate a survey to be used in the data-
collection phase of this Praxis, which is outlined in the Methodology section of this
research. Through this iterative process, the literature review allowed the convergence
on a set of seven distinct selection criteria groups. The criteria groups converged on are:
Improvement Focus, Goals, Scope, Resources, Current-State Performance,
Organizational Buy-in, and Perceived Ease of Execution.
The following sections will discuss the affinitized groups of criteria, first for the
scholarly articles and text books, and then the organizations studied. Lastly, novel or
DISTRIBUTION A. Approved for public release; distribution unlimited.
28 DISTRIBUTION A. Approved for public release; distribution unlimited.
relevant concepts found throughout the literature review will be discussed at the
conclusion of this chapter.
2.2. Textbook Review Methodology
The textbooks reviewed were pulled from the author’s home LSS library, the
Army’s Tank-Automotive Research Development and Engineering Center (TARDEC)
and TACOM’s CPI offices. All of the textbooks referenced in this research are available
through online retailers such as Amazon.com or AbeBooks.com. This is noted such that
the reader will be aware that the textbooks used in this research would likely be found in
any CPI practitioner’s office or even included in Belt training material (George’s Lean
Six Sigma Pocket Toolbook, for example, is included in both the Army’s Green and
Black Belt training courses), increasing the possibility of the replication of this research.
In total eight textbooks were analyzed to produce nearly 70 unique selection criteria.
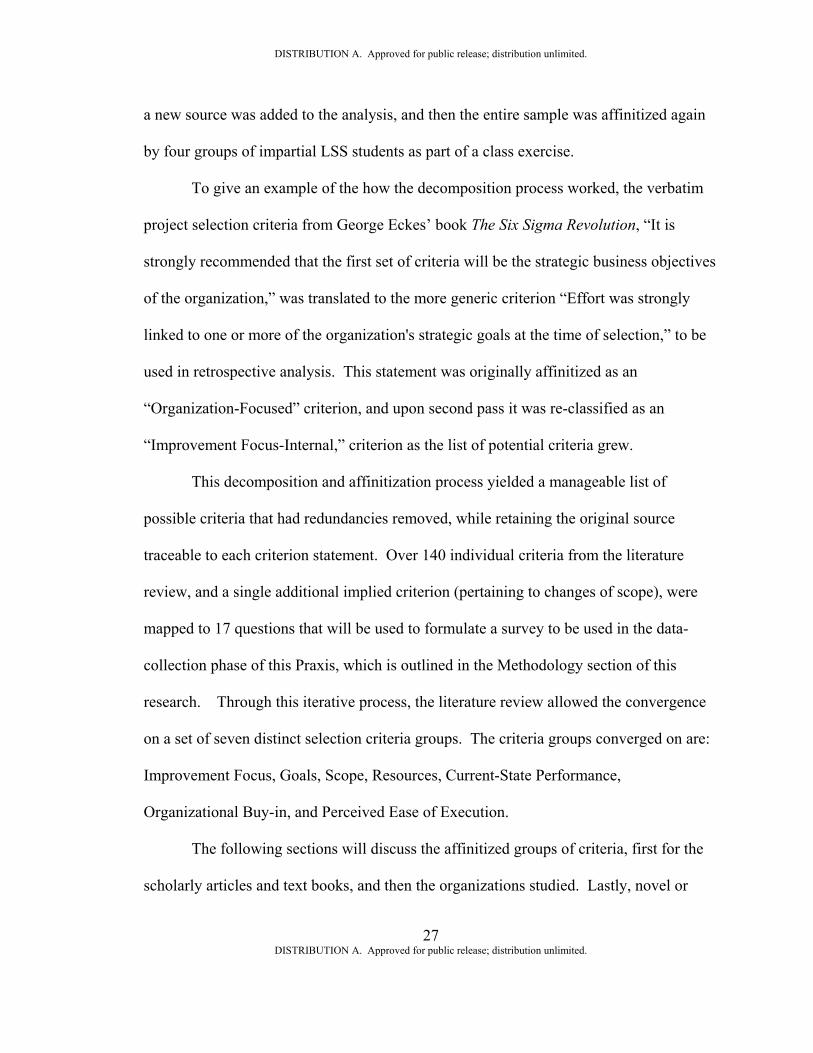
Figure 2.1 describes the tendencies of selection criteria as stated by the studied
LSS textbooks. It is evident that there was a strong focus on what was declared to be
criteria judging an effort’s focus on improvement, either internal or external. An effort’s
goals, scope, resources, and current-state performance were also heavily referenced. All
of these topics will be further discussed later in this chapter. The textbooks studied
tended to have very little emphasis on selecting potential efforts based on the
organization’s buy-in nor the perceived ease of execution.
DISTRIBUTION A. Approved for public release; distribution unlimited.
29 DISTRIBUTION A. Approved for public release; distribution unlimited.
Figure 2.1. Pareto Chart of Selection Criteria from Textbook Review
2.3. Article Review Methodology
The scholarly articles analyzed as part of this research required subscriptions to a
number of online research sites and article repositories. One strength of the articles
analyzed were the global origins of the articles and application of the research itself. For
example, LSS selection methods and criteria from numerous European countries were
documented, whereas the textbook research focused primarily on US organizations and
applications. Due to the heavy focus of culture on the successful implementation of LSS
in organizations, having an awareness of the impact of project selection in different
geographical locations is also of interest as the US Army currently operates in over 100
countries.
DISTRIBUTION A. Approved for public release; distribution unlimited.
30 DISTRIBUTION A. Approved for public release; distribution unlimited.
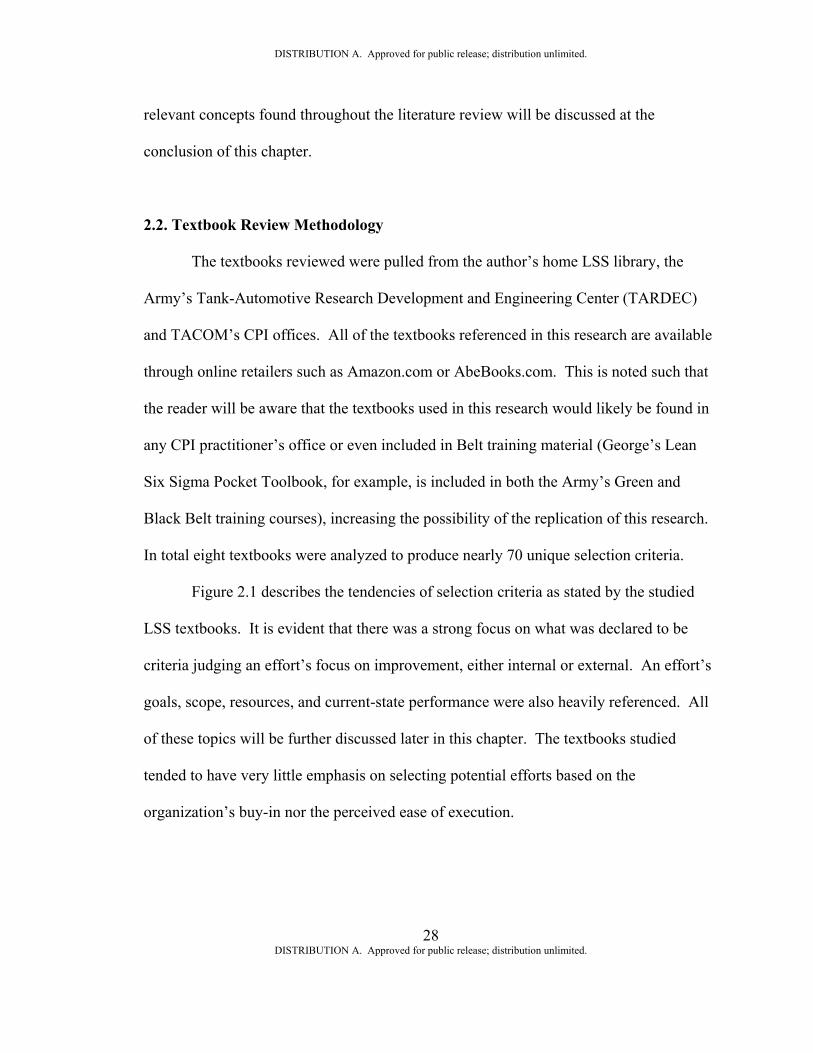
Nine scholarly articles were reviewed for this research. These articles produced
over 40 example selection criteria. The same decomposition process used for the
textbook review was employed for our scholarly articles. Figure 2.2 describes the
tendencies of selection criteria as collected from the studied LSS scholarly articles.
Figure 2.2. Pareto Chart of Selection Criteria from Article Review
Similar to the textbooks studied, the articles studied focused primarily on the
focus of the improvement, as well as resources perceived to be required. The articles
placed a higher emphasis on the process’ current state performance, as well as the
perceived ease of execution. One possible explanation is that many of the articles
referenced seek to serve as a baseline for LSS program ideation or adoption- the “quick
wins” generated by completing the so-called easy projects, or low-hanging-fruit, can give
DISTRIBUTION A. Approved for public release; distribution unlimited.
31 DISTRIBUTION A. Approved for public release; distribution unlimited.
a new organization much needed momentum and publicity. Additionally, the emphasis
on this criterion may be due to the lack of awareness of many academic CPI researchers
that the existence of data may be rare even for dramatically underperforming processes in
real life.
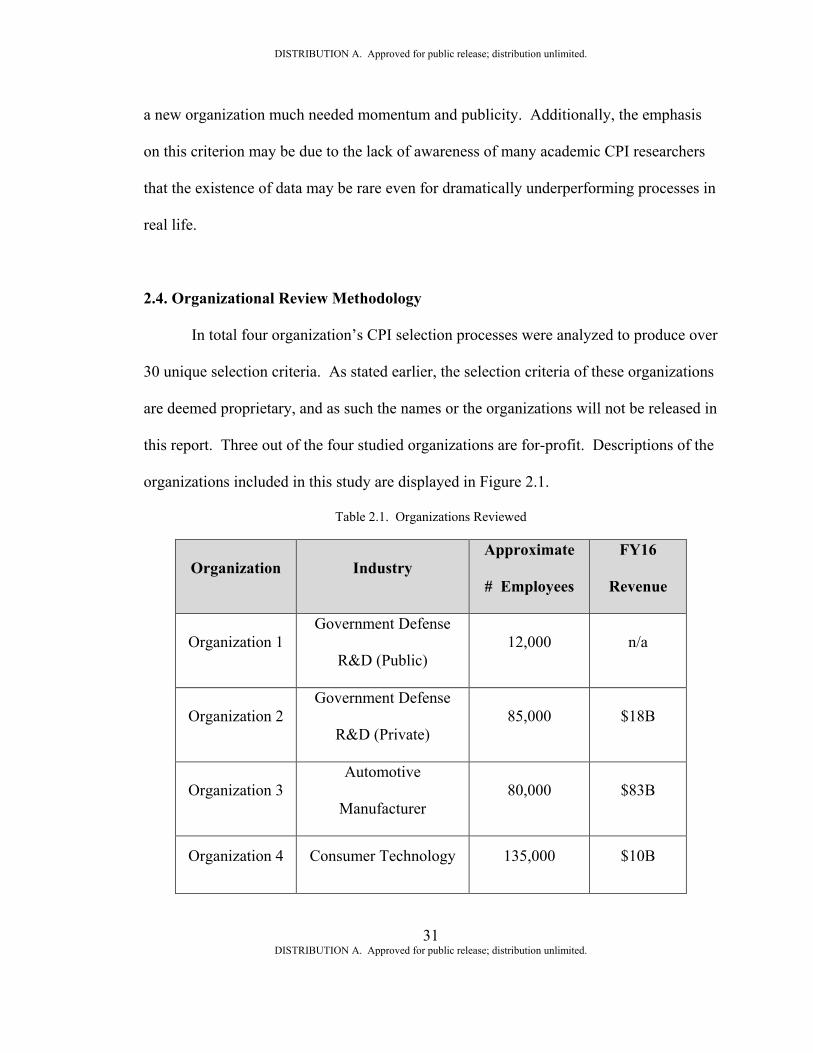
2.4. Organizational Review Methodology
In total four organization’s CPI selection processes were analyzed to produce over
30 unique selection criteria. As stated earlier, the selection criteria of these organizations
are deemed proprietary, and as such the names or the organizations will not be released in
this report. Three out of the four studied organizations are for-profit. Descriptions of the
organizations included in this study are displayed in Figure 2.1.
Table 2.1. Organizations Reviewed
Organization Industry Approximate
# Employees
FY16
Revenue
Organization 1 Government Defense
R&D (Public) 12,000 n/a
Organization 2 Government Defense
R&D (Private) 85,000 $18B
Organization 3 Automotive
Manufacturer 80,000 $83B
Organization 4 Consumer Technology 135,000 $10B
DISTRIBUTION A. Approved for public release; distribution unlimited.
32 DISTRIBUTION A. Approved for public release; distribution unlimited.
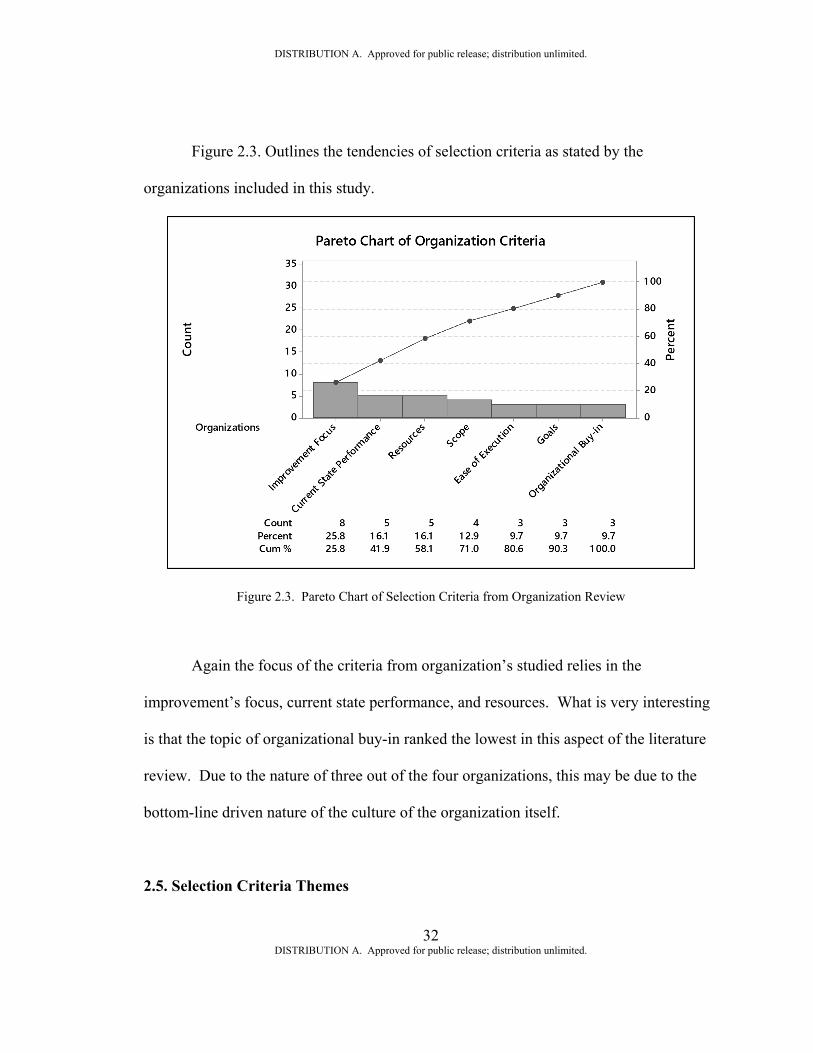
Figure 2.3. Outlines the tendencies of selection criteria as stated by the
organizations included in this study.
Figure 2.3. Pareto Chart of Selection Criteria from Organization Review
Again the focus of the criteria from organization’s studied relies in the
improvement’s focus, current state performance, and resources. What is very interesting
is that the topic of organizational buy-in ranked the lowest in this aspect of the literature
review. Due to the nature of three out of the four organizations, this may be due to the
bottom-line driven nature of the culture of the organization itself.
2.5. Selection Criteria Themes
DISTRIBUTION A. Approved for public release; distribution unlimited.
33 DISTRIBUTION A. Approved for public release; distribution unlimited.
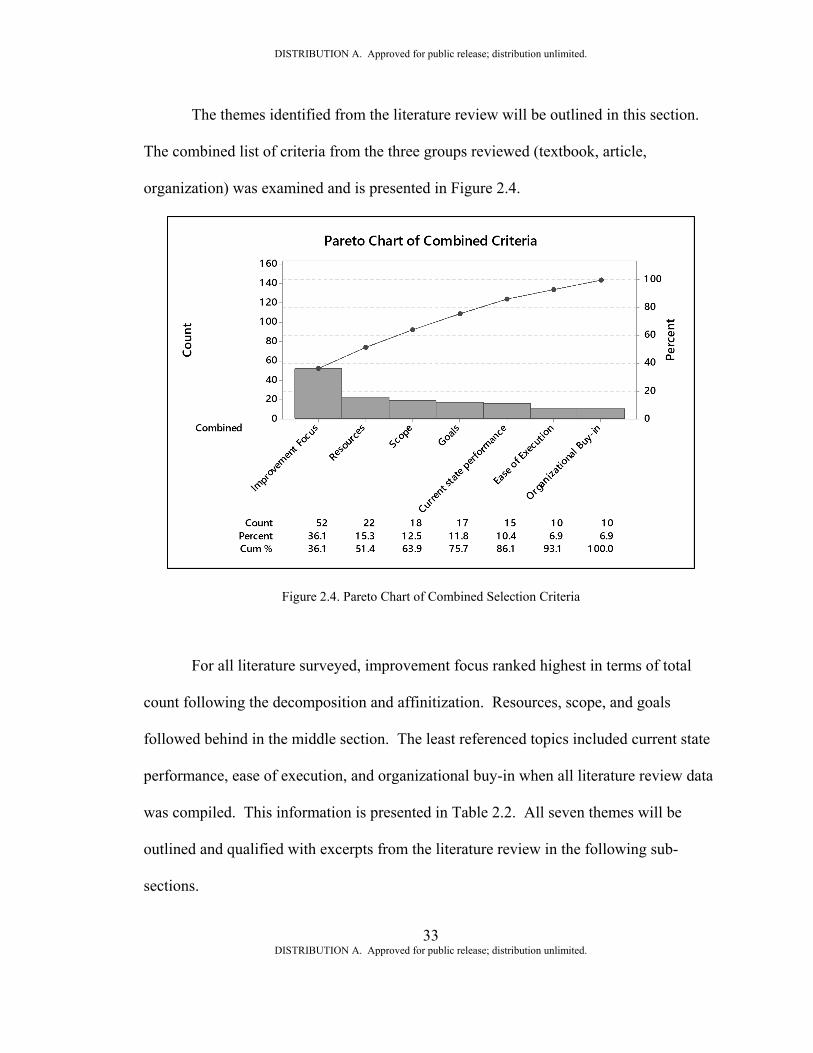
The themes identified from the literature review will be outlined in this section.
The combined list of criteria from the three groups reviewed (textbook, article,
organization) was examined and is presented in Figure 2.4.
Figure 2.4. Pareto Chart of Combined Selection Criteria
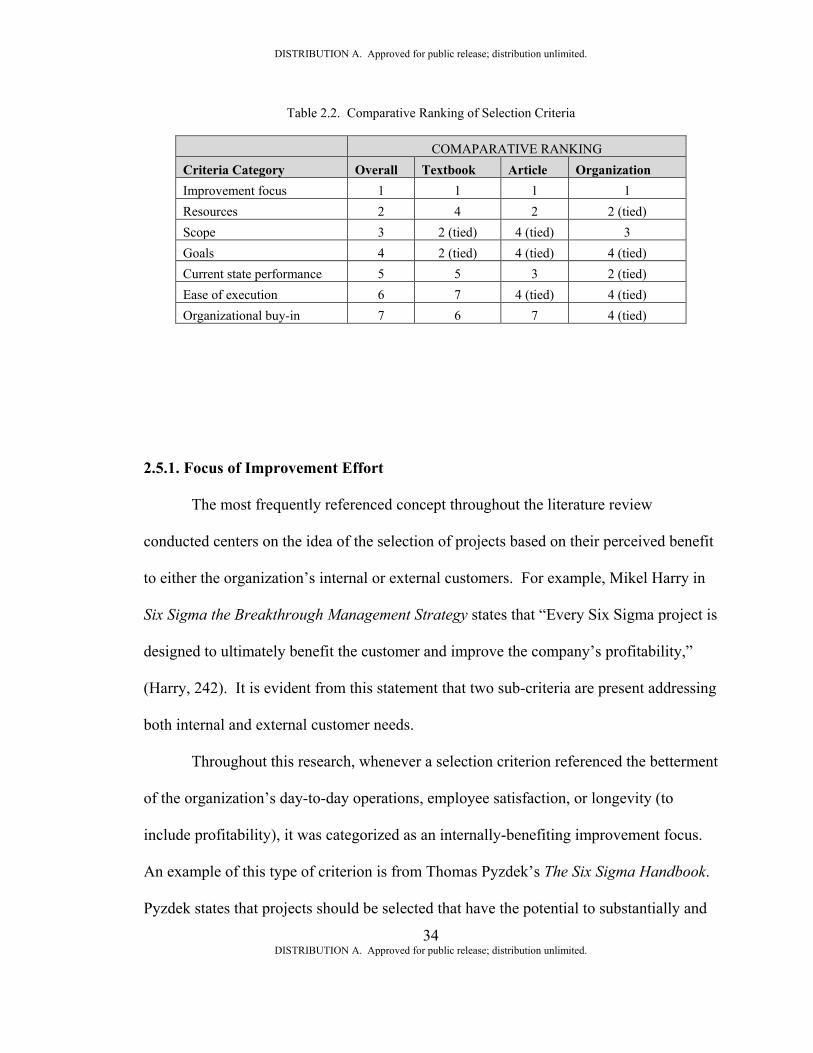
For all literature surveyed, improvement focus ranked highest in terms of total
count following the decomposition and affinitization. Resources, scope, and goals
followed behind in the middle section. The least referenced topics included current state
performance, ease of execution, and organizational buy-in when all literature review data
was compiled. This information is presented in Table 2.2. All seven themes will be
outlined and qualified with excerpts from the literature review in the following sub-
sections.
DISTRIBUTION A. Approved for public release; distribution unlimited.
34 DISTRIBUTION A. Approved for public release; distribution unlimited.
Table 2.2. Comparative Ranking of Selection Criteria
COMAPARATIVE RANKING Criteria Category Overall Textbook Article Organization Improvement focus 1 1 1 1 Resources 2 4 2 2 (tied) Scope 3 2 (tied) 4 (tied) 3 Goals 4 2 (tied) 4 (tied) 4 (tied) Current state performance 5 5 3 2 (tied) Ease of execution 6 7 4 (tied) 4 (tied) Organizational buy-in 7 6 7 4 (tied)
2.5.1. Focus of Improvement Effort
The most frequently referenced concept throughout the literature review
conducted centers on the idea of the selection of projects based on their perceived benefit
to either the organization’s internal or external customers. For example, Mikel Harry in
Six Sigma the Breakthrough Management Strategy states that “Every Six Sigma project is
designed to ultimately benefit the customer and improve the company’s profitability,”
(Harry, 242). It is evident from this statement that two sub-criteria are present addressing
both internal and external customer needs.
Throughout this research, whenever a selection criterion referenced the betterment
of the organization’s day-to-day operations, employee satisfaction, or longevity (to
include profitability), it was categorized as an internally-benefiting improvement focus.
An example of this type of criterion is from Thomas Pyzdek’s The Six Sigma Handbook.
Pyzdek states that projects should be selected that have the potential to substantially and
DISTRIBUTION A. Approved for public release; distribution unlimited.
35 DISTRIBUTION A. Approved for public release; distribution unlimited.
statistically significantly increase overall employee satisfaction (Pyzdek, 191). This
theme prevailed in nearly all textbooks, scholarly articles, and in some organizations
studied.
Additionally, a topic found in every piece of literature reviewed was the concept
of selecting projects that had an impact on the external customer. This theme permeated
the literature review in varying levels of complexity. In the article “An integrated
analytic approach for Six Sigma project selection,” Büyüközkan and Öztürkcan develop a
mathematical model for project selection based on the criteria of customer satisfaction
(Büyüközkan and Öztürkcan, 5838). Pyzdek also states that projects should be selected
that “substantially and statistically significantly increase overall customer satisfaction or
loyalty,” (Pyzdek, 191). One outside organization studied, a Government Contractor,
simply uses the criteria asking if an “effort appears to benefit the organization’s
customers.”
Also included in this category were any criteria that referenced linkage to an
organization’s strategic objectives, with the mindset being that any effort that links back
to the organization’s strategic objectives serves ultimately to better the organization or its
customers. One of the outside organizations (for-profit) studied relied so heavily on this
aspect of selection criteria that it comprised 75% of the organization’s selection criteria.
Based on the review of literature, an inquiry on the improvement focus of each
effort can be reduced to two primary statements to be used in a retrospective analysis:
A.) At the time of selection, the improvement effort chosen was intended to
DISTRIBUTION A. Approved for public release; distribution unlimited.
36 DISTRIBUTION A. Approved for public release; distribution unlimited.
positively impact external customers or stakeholders, to include closing a known
customer need or gap.
B.) At the time of selection, the improvement effort chosen was intended to
positively impact internal customers or stakeholders, to include meeting the
organization’s strategic objectives.
2.5.2. Resources required for effort
The second most frequently referenced project selection criteria theme was
focused on having the right resources in place, and ready to be allocated at the time of
project selection. Everything from the cost to execute a potential project to having the
proper skill sets on the team is referenced. As the table of selection criteria evolved, the
topic of resources as a selection criteria would further be decomposed into human and
non-human resources.
Again, this literature reviewed yielded variation in both the complexity and
emphasis of the use of resources as a selection criteria. George Eckes states that a project
worth considering for selection has the full commitment and use of resources from a
human capital perspective (Eckes, 26). Peter Pande, on the other hand, is more
concerned with the financial aspect of resources; “costs (of a potential project) can be
absorbed within the current budget,” is listed a selection criteria (Pande, 149).
One organization studied, a large-scale automotive manufacturer, listed its top
selection criterion as having the process improvement team with the right knowledge,
skills, and abilities identified and assigned at the time of selection. Another organization
DISTRIBUTION A. Approved for public release; distribution unlimited.
37 DISTRIBUTION A. Approved for public release; distribution unlimited.
studied called upon its selection committee to calculate both the total cost of the project
and the cost of the man hours before listing each project for selection discussions,
representing both aspects of resources identified in this research.
Based on the review of literature, an inquiry on the resources required for each
effort can be reduced to two primary statements to be used in a retrospective analysis:
A.) At the time of selection, the improvement effort chosen had the human
capital consisting of the right knowledge, skills, and abilities available and
assigned to work on the project team.
B.) At the time of selection, the improvement effort chosen had adequate
budgetary, information technology, and other non-human capital resources
available and ready to be assigned.
2.5.3. Scope of improvement effort
The next most referenced criteria theme was the perceived scope of effort of the
project at the time of selection. This theme encompasses two primary sub-themes: the
formally defined and communicated boundaries of the project’s efforts, as well as the
perceived ability for the project to be executed and completed by a project team in a set
amount of time.
In review of textbooks and articles there were many instances of scope being
referenced in terms of the project’s starting and ending points. Furthermore, how those
bookends were defined and communicated from top leadership was a recurring selection
DISTRIBUTION A. Approved for public release; distribution unlimited.
38 DISTRIBUTION A. Approved for public release; distribution unlimited.
theme. Pyzdek states that project selection relies on the “scope of new or improved
process, product or service to be created is clearly and completely defined,” (Pyzdek,
191).
A project charter was also commonly referenced as a way of defining and
communicating the scope of a potential project. Pyzdek states that in order for a project
to be selected, a charter must be present and accurately filled out. Further, that charter
document must present a clear link from the project’s activities to its expected
deliverables (Pyzdek, 191). A project charter is a common tool in CPI project selection
and deployment. In the Army’s CPI program, a partially completed charter may or may
not be present at the time of project selection.
Another aspect of scope that was frequently referenced in the literature review
was the estimate or perceived magnitude of effort to accomplish a prospective project.
This frequently included time, the crossing of organizational boundaries, and the
existence or presence of a known solution (making the effort more focused on
implementation). Pande and other sources converge on a short timeframe for anticipated
project completion, “a short-term window (less than 3 months) looks feasible,” (Pande,
149). Pande also posits that projects that are qualified for selection won’t duplicate or
clash with other on-going efforts, nor require significant outside support.
All organizations studied demonstrated a great amount of emphasis on the
project’s anticipated or projected schedule duration. One organization included specific
selection criteria related to scope that included the project’s timeline, the availability of
data linked to the problem statement, and the existence of a formal definition for the
DISTRIBUTION A. Approved for public release; distribution unlimited.
39 DISTRIBUTION A. Approved for public release; distribution unlimited.
defect in question. Another organization stated that only projects that met the criteria of
being narrow enough in scope with the intention that one team can work on it should be
selected. All of these topics point to an emphasis of not only formulating and
communicating a project’s scope, but also keeping it laser focused on accomplishing the
project’s goal.
Further, it was apparent both in the literature review and practical experience that
changes in a project’s scope while underway can have a dramatic effect on project
completion as well as financial and operational benefits realized. This is not something
that can be directly measured at the time of project selection – scope changes typically
occur at tollgate meetings through stakeholder suggestion or management directive. It is
less common for non-gated projects to experience scope change as they are largely
managed by the project team itself. Scope changes can be viewed as a lagging measure
or metrics and can still offer information about the FY16 non-gated projects in the data
set.
Based on the review of literature, an inquiry on the scope of each effort can be
reduced to two primary statements to be used in a retrospective analysis, including an
additional potential question regarding possible changes in the project’s scope while
underway:
A.) At the time of selection, the improvement effort chosen had a well-defined
and communicated scope.
B.) At the time of selection, the improvement effort chosen had a scope that
DISTRIBUTION A. Approved for public release; distribution unlimited.
40 DISTRIBUTION A. Approved for public release; distribution unlimited.
would allow a full-time improvement team, of average skills, experience, and
abilities, to complete its objectives in less than 3 months.
C.) During the execution of this project, the scope was significantly changed by
either the project team or the organization’s leadership.
2.5.4. Goals of improvement effort
A common theme from the literature review was the concept of goal definition
and goal-communication. This topic is closely related to the previous section on scope.
In many cases, the scope of an effort can be directly proportional to the effort’s goals.
The concept of “stretch” goals was also introduced by nearly half of the literature
reviewed, as well as selecting projects that were perceived to have a high return on
investment.
Nearly all of our literature sources, including the organizations studied, suggest
selecting projects that have goals defined in advance of their launch. Eckes recounts a
successful implementation of LSS at an organization where leadership would challenge
process owners to predict project gains 90 days from kickoff of potential projects (Eckes,
26). These financial values would then be used to further filter and refine the projects
before selection.
Easton and Rosenzweig in The role of experience in six sigma project success: An
empirical analysis of improvement projects describe taking the idea of a project goal
further by stating that a project worth selecting will have a ‘stretch’ goal (Easton, 9).
Stretch goals are meant to encourage the overmatch of the solution to the stated goal.
DISTRIBUTION A. Approved for public release; distribution unlimited.
41 DISTRIBUTION A. Approved for public release; distribution unlimited.
One organization studied used stretch goals set at 150% of the minimum acceptable
outcome to challenge teams to produce more improvement while guarding against failure.
Pande also comments that in-flight projects should be able to be tracked against
their goals. One of the selection criteria present in his literature is not only the ability for
tracking project as they progress towards their goal, but also having a team member
identified to perform the tracking and documentation of the results (Pande, 149).
Due to the bottom-line-driven nature of many organizations implementing Lean
Six Sigma, the concept of judging a project against its perceived return on investment
was common in this research. Evans and Lindsay state that prospective projects should
be analyzed for their “financial return, as measured by costs associated with quality and
process performance, and impacts on revenues and market share,” (Evans, 68). Other
sources, such as Pyzdek, report actual dollar amounts to draw conclusions from,
suggesting that projects projected to save over $500,000 should be considered “excellent
ROI” projects and selected for execution (Pyzdek, 191).
Michael George warns that projects identified and selected at lower levels in the
organization may miss this concept entirely. “The traditional approach has often allowed
Black Belts to pick projects, with input from Champions and process owners. This
seldom led to projects that were related to corporate strategy or prioritized around
ROIC,” (George, 234). This concept again ties into leadership involvement, which will
be discussed in a later section in this chapter.
Based on the review of literature, an inquiry on the stated goals, communication
of goals, and predicted benefit for each effort can be reduced to two primary statements
DISTRIBUTION A. Approved for public release; distribution unlimited.
42 DISTRIBUTION A. Approved for public release; distribution unlimited.
to be used in a retrospective analysis:
A.) At the time of selection, the improvement effort chosen had a well-defined
and communicated goal or goals.
B.) At the time of selection, the improvement effort chosen had a well-defined
and communicated “stretch” goal or goals.
C.) At the time of selection, the improvement effort chosen had a goal or goals
that were predicted by the organization’s leadership or the project team itself to
yield a high financial benefit.
2.5.5. Current state performance
The process’s current state performance was also identified as a common
selection theme. Mentioned in nearly all of the literature reviewed, it was determined that
poor current state performance is a likely catalyst for selecting and executing a project
which aims to improve its performance. Poor current state performance was further
broken into the categories of nonconformance with respect to internal and external needs.
This criteria may seem similar to the earlier topic of improvement focus, but it is
differentiated by the idea of examining the current state of an existing process itself. An
organization may in fact be aware of a process that is performing poorly before a
customer files a complaint or otherwise raises notice. An organization’s CPI department
is likely to examine processes by way of metrics or other feedback mechanisms and can
DISTRIBUTION A. Approved for public release; distribution unlimited.
43 DISTRIBUTION A. Approved for public release; distribution unlimited.
determine if it is performing well with respect to either, or both, internal and external
requirements. Often this separation of process performance and customer need is
referred to as the Voice of the Process and the Voice of the Customer.
Many literature sources reviewed in this research made generalizations on this
topic. For example, Eckes states that projects should be selected based on “current
process performance,” (Ecke, 26), and George proposes the idea of starting the project
selection process by examining current state process maps and analysis (George, 234).
Mader, in the ASQ article How to Identify and Select Lean Six Sigma Projects, uses the
term “risk” to indicate the worthiness of selecting a process improvement project based
on its current state performance (Mader, 58).
Other authors, Antony Jiju, for example, list specific current-state metrics to
examine. In order to determine if a project is a worthy candidate for selection he
proposes that cycle time or throughput yield be examined (Jiju, 7). Those processes with
a long cycle time (externally focused) or low throughput yield (internally focused) should
be prioritized and selected for improvement.
Michael George alone addresses this important point in project selection
particularly when referring to projects in the US Government. He states that projects
should also be selected if they relate to improving gaps or deficiencies in environmental,
health, or safety regulations (George, 26). As mentioned previously, projects that are
completed in the realm of TACOM CPI that do not yield much, or any, financial benefit
are typically selected based on metrics relating to safety, or environmental, stewardship.
All four organizations studied referenced the idea of starting with poorly
DISTRIBUTION A. Approved for public release; distribution unlimited.
44 DISTRIBUTION A. Approved for public release; distribution unlimited.
performing processes when selecting CPI projects. This may be due to the bottom-line or
profit-driven nature of three out of the four of these organizations, but also perhaps due to
the need to show progress and build momentum and reputation to grow an organization’s
internal CPI team in terms of headcount and mission scope. One organization had the
selection criterion of “a recurring problem” listed, while another uses the blanket criteria
of the effort addressing “key areas of process improvement.” All four organizations were
careful to mention that the current-state processes performance had to be well-
documented. Simply put, there needed to be data to back up the claims of the process
owner or customer. This element was not seen in the other literature sources.
Based on the review of the literature, an inquiry on the effort’s current state
performance can be reduced to two primary statements to be used in a retrospective
analysis:
A.) At the time of selection, the improvement effort chosen had a well-
documented or understood account or record of poor performance with respect to
meeting external customer or stakeholder needs.
B.) At the time of selection, the improvement effort chosen had a well-
documented or understood account or record of poor performance with respect to
meeting internal customer or stakeholder needs (including regulatory or safety
requirements).
2.5.6. Perceived ease of execution
Similar to the concept of scope, another common selection theme was the
DISTRIBUTION A. Approved for public release; distribution unlimited.
45 DISTRIBUTION A. Approved for public release; distribution unlimited.
perceived ease of execution and completion of a potential project. The literature review
suggests that if an organization views that a potential effort appears to have a high degree
of ease to complete, it may be a worthy project to select instead of more complex
opportunities.
Easton and Rosenzweig propose that if a prospective project presents what
appears to be a solvable problem, it should be executed (Easton, 10). Eckes goes a step
further and discusses the topics relating to the feasibility of a potential project to
complete, including the perceived degree of difficulty (Eckes, 26). Pande introduces the
idea of a known solution which the selection committee has a high degree of confidence
in, as well as commenting on the solution itself being sustainable. Pande also warns that
if a project will require significant information technology or is likely to face significant
technical obstacles, it may be wise to forgo it on selection day (Pande, 149).
Evans and Lindsay, in An Introduction to Six Sigma & Process Improvement,
bluntly state that projects with a high probability of success should be selected (Evans,
68). This topic was heavily referenced in the organizations studied, along with the idea
of a known solution being identified and ready for implementation.
All but one of the organizations studied had an element of ease of execution in
their selection plans. The one organization that did not use a form of ease of execution or
probability of success as a selection criteria was, perhaps coincidentally, the highest
revenue generating out of the group- the automotive manufacturer.
Based on the review of the literature, an inquiry on the effort’s ease of execution
and completion can be reduced to two primary statements to be used in a retrospective
DISTRIBUTION A. Approved for public release; distribution unlimited.
46 DISTRIBUTION A. Approved for public release; distribution unlimited.
analysis:
A.) At the time of selection, the improvement effort chosen had a clearly defined
or understood solution that only needed to be put into action or implemented
(little data collection, analysis or improvement idea generation would be
required).
B.) At the time of selection, the improvement effort chosen was perceived to
have a high probability of success from the organization’s leadership or project
team.
C.) At the time of selection, the improvement effort chosen was perceived to be
unlikely to require significant IT or other significant technical solutions or
investments to implement and complete.
2.5.7. Organizational buy-in
The final selection theme identified through the literature review is the
organization’s buy-in to the project or effort. Organizational buy-in can refer to an
organization’s overall interest in the project or effort, including leadership involvement or
even a visible sense of ownership. Furthermore, the identification and assignment of
Champions and Master Black Belt mentors to a given project at the time of selection was
highly referenced in the literature studied.
Taho Yang and Chiung-Hsi Hsieh qualified “Leadership” as one of their top
criteria when analyzing Six Sigma project selection with a Delphi decision-making
method (Yang, 1). Mikel Harry proposes that “The projects selected to improve business

DISTRIBUTION A. Approved for public release; distribution unlimited.
47 DISTRIBUTION A. Approved for public release; distribution unlimited.
productivity must be agreed upon by both business and operational leadership, and
someone must be assigned to "own" or be accountable for the project, as well as someone
to execute it,” (Harry, 239). Pyzdek also states that projects being selected must have
director-level sponsors identified, duties specified, and sufficient time committed and
scheduled (Pyzdek 191).
All four organizations studied made clear connections to organizational buy-in.
Identified and engaged leadership-level Champions and Master Black Belts are all
referenced as basic requirements to select a process improvement project. The
automotive organization took this selection theme further, mandating a third-party
process improvement project sponsor, different from the MBB, be to be assigned and an
active participant in the effort.
Based on the review of the literature, an inquiry on the effort’s organizational
buy-in and assignment of senior-leader level involvement can be reduced to two primary
statements to be used in a retrospective analysis:
A.) At the time of selection, the improvement effort chosen had significant
positive buy-in or ownership from one or more levels of the organization’s
leadership.
B.) At the time of selection, the improvement effort chosen had a senior leader-
level Champion and/or Master Black Belt mentor identified and assigned to it.
2.6. Additional Relevant Topics found in Literature Review
While the primary focus of the literature review in this Praxis was to generate a
DISTRIBUTION A. Approved for public release; distribution unlimited.
48 DISTRIBUTION A. Approved for public release; distribution unlimited.
list of potential LSS non-gated project selection criteria, there were some interesting
findings realized along the way. This review indicated that there is a need to better
understand and quantify selection criteria for non-gated LSS projects, as well as optimize
them for the highest financial benefit. The following subsections will outline these
discoveries and their relevance to this research. To illustrate the global presence of these
research discussions, the country of origin for each article is provided.
2.6.1. An integrated analytic approach for Six Sigma project selection
Büyüközkan and Öztürkcan propose the use of Decision Making Trial and
Evaluation Laboratory (DEMATEL) in their 2010 research titled “An integrated analytic
approach for Six Sigma project selection.” This article comes from Turkey. The authors
propose the use of DEMATEL to detect complex relationships and build relation
structure among criteria for selecting Six Sigma projects (Büyüközkan, 1).
There are two known limitations of this research with respect to this Praxis. The
first limitation is based on the definition, or lack thereof, of a Six Sigma effort. It is
unclear if the projects studied are gated or non-gated in nature. The assumption of this
Praxis is that in the US Army CPI deployment model, there is a clear difference between
gated and non-gated projects.
Secondly, the research is based off of a list of 14 criteria containing a number of
which that decidedly do not apply for analysis of a non-profit organization’s CPI results.
The criteria studied in this article are focused on revenue generation, customer loyalty,
and increased market share which are not applicable in the scope of this research
DISTRIBUTION A. Approved for public release; distribution unlimited.
49 DISTRIBUTION A. Approved for public release; distribution unlimited.
(Büyüközkan, 4). Additionally, the authors of this research are concerned with studying
aspects of Six Sigma program deployment that the US Army has previously optimized or
is simply out of scope, such as employee competency development and the cost of HR.
The remaining criteria identified by Gülçin Büyüközkan and Demet Öztürkcan were used
in forming the survey discussed later in this research.
2.6.2. A systematic methodology for the creation of Six Sigma projects: A case study
of semiconductor foundry
Chao-Ton Su and Chia-Jen Chou developed a combined approach of creating and
selecting Six Sigma projects using an analytic hierarchy process (AHP) and failure mode
effects analysis (FMEA). FMEA is presented as a method to evaluate the risk of
candidate projects and prioritize them via AHP for selection and execution. The standard
calculation for Risk Priority (RPN) is presented as means to filter and prioritize possible
project ideas. The AHP model is used to decide which projects to attack using a
numerical ranking of relative impact for the severity, occurrence, and detection criteria
output from the FMEA model (Su, 3). Rating projects against criteria on a Likert-type
scale is an important take-away from this article. There are six selection criteria
presented, two of which are related to business cash flow and revenue enhancement. In
this article the distinction between gated and non-gated projects is missed.
2.6.3. Critical success factors of Six Sigma implementations in Italian companies
In the 2002 research Alessandro Brun proposes to answer the question: is there an
DISTRIBUTION A. Approved for public release; distribution unlimited.
50 DISTRIBUTION A. Approved for public release; distribution unlimited.
“Italian way” to Six Sigma? The author utilizes an approach created by Anthony and
Banuelas in their research Key Ingredients for the effective implementation of
Six Sigma program to compare critical success factors in LSS implementation at the
organizational level. Topics such as management involvement and commitment, cultural
change, linking Six Sigma to business strategy or customer, and project prioritization and
selection are surveyed and reported out over a number of American and Italian
companies (Brun, 4-5). While particular selection criteria, and again the distinction of
gated versus non-gated, are absent, the research provides more momentum for pursuing
this Praxis.
Both American and Italian organizations ranked the topic of project prioritization
and selection towards the bottom of their respective lists on maturity. It is the intent of
this Praxis to further investigate the importance of selection criteria with respect to
project financial benefit.
2.6.4. How to Identify and Select Lean Six Sigma Projects
Douglas P. Mader outlines a step by step method to select Lean Six Sigma
projects in a July 2007 article published by the American Society for Quality (ASQ, 58).
Mader discusses the preliminary steps such as understanding the organization’s strategic
plan, alignment with the strategy, understanding the policy deployment system, and
understanding the organization’s core business processes. After those prerequisites have
been achieved, according to Mader, Champions and Master Black Belts can begin to
follow a structured method for identifying, prioritizing, and selecting LSS projects.
DISTRIBUTION A. Approved for public release; distribution unlimited.
51 DISTRIBUTION A. Approved for public release; distribution unlimited.
The criteria Mader proposes centers on risk, return, and goal analysis. After
outlining myriad potential risks, Mader proposes that many said risks can be alleviated by
having a “well-run” project identification process where priorities of the organization as
well as potential LSS projects are communicated to key stakeholders. We are not offered
any explicit selection criteria. One positive from the Mader research is his awareness that
not all LSS projects are made equal – he notes that Lean Six Sigma, Six Sigma, Design
for Six Sigma, and “their various permutations,” exist as strategic thrusts, hinting
towards, yet not defining, a discussion on gated versus non-gated efforts.
2.6.5. Six-Sigma project selection using national quality award criteria and Delphi
fuzzy multiple criteria decision-making method
This research emanating from Taiwain composed by Taho Yang and Chiung-Hsi
Hsieh uses a Delphi fuzzy multiple criteria decision-making methodology to analyze the
effectiveness of Taiwanese national quality award selection criteria. The research also
proposes a unique hierarchical criteria evaluation process. The four step process includes
determining project selection criteria, use of fuzzy group decision-making method to
determine the strategic criteria weights, use of fuzzy linguistic variables to evaluate sub-
criteria weights with respect to each project candidates, and finally ranking each project
by fuzzy “defuzzification.”
The Taiwan national quality award criteria are provided in this article which
include themes such as leadership, customer/market development, and business result
(Yang, 2). While the proposed methodology appears powerful, it again lacks the
DISTRIBUTION A. Approved for public release; distribution unlimited.
52 DISTRIBUTION A. Approved for public release; distribution unlimited.
delineation between gated and non-gated projects. Further, it assumes knowledge of an
initial set of selection criteria to rate on a subjective basis prior to selection. This Praxis
will take into account the Taiwan national award criteria, but the scope of this research is
fundamentally different.
2.6.6. Six Sigma Programs: An implementation model
Chakravorty provides a detailed approach to implementing an organized approach
to Six Sigma in this research. This research concludes that a primary reason for the
failure of a Six Sigma program, to include the execution of projects, development of
Belts, and realization of financial benefit, stems from poor implementation. Project
identification and selection is briefly mentioned in this research as part of the fourth step
in an organization’s implementation of Six Sigma (Chakravorty, 2). However,
Chakravorty only goes as far as to mention that the prioritization of projects is
determined by “many criteria,” such as cost to benefit ratio or use of the Pareto priority
index. This research does not deliver a list of applicable criteria, nor a differentiation in
the type of LSS project being selected with respect to this Praxis.
2.6.7. The role of experience in Six Sigma project success: An empirical analysis of
improvement projects
Easton and Rosenzweig compiled data over a six year time span with the intent of
understanding the relationship between improvement project team member experience
and the team’s performance. Their research concluded that the strongest predictor of
DISTRIBUTION A. Approved for public release; distribution unlimited.
53 DISTRIBUTION A. Approved for public release; distribution unlimited.
improvement-project success was the team leader’s improvement-project experience,
followed by the organization’s combined experience (Easton, 8). Additionally, the
research rejected the notion that individual team members (other than the team leader)
had an effect on the project’s outcome. The authors suggest that a well-developed and
deployed approach or structure to solving problems through Six Sigma is paramount,
while intra-team familiarity and experience has a reduced effect on performance.
This research does not mention the specifics of any selection method or criteria
deployed by the organizations studied, nor does it mention the difference between gated
and non-gated project types. However, it does conclude that team leaders may have an
effect on project selection by trending towards properly-scoped projects that seek to
target solvable problems, even if those problems involve “stretch goals.”
2.6.8. Critical success factors for the successful implementation of six sigma projects
in organizations
Ricardo Banuelas Coronado and Antony Jiju describe Critical to Success Factors
(CSF) for implementing Six Sigma projects in this article published in the Total Quality
Management (TQM) Magazine. This research was conducted in the United Kingdom
and outlines the common pitfalls of failed Six Sigma projects, and programs, based a
number of factors including the program’s linkage to the customer, linkage to the
overarching business strategy, the organization’s understanding of Six Sigma tools and
techniques, project management skills, and the prioritization and selection of induvial
DISTRIBUTION A. Approved for public release; distribution unlimited.
54 DISTRIBUTION A. Approved for public release; distribution unlimited.
projects. The authors stress that projects should be selected such that they are closely tied
to the business goals or business objectives of the organization (Jiju, 9). Further, the
authors discuss the concept that while each organization is likely to select different
measurements to judge a project’s worthiness of selection and completion, they proclaim
that every project should be selected so that it will help the company improve its
competitive advantage, business profitability, process cycle-time, or throughput yield.
The authors do not discuss non-gated projects, nor offer insight to project selection
criteria for non-profit organizations.
DISTRIBUTION A. Approved for public release; distribution unlimited.
55 DISTRIBUTION A. Approved for public release; distribution unlimited.
CHAPTER 3
METHODOLOGIES OF PRAXIS
3.1. Outline
This Praxis is the result of a culmination of a number of analysis
methodologies learned while in the SMU DEEM program linked together to identify and
solve a real-world problem. This Praxis delivers insight into the selection of LSS
projects and sought to quantify the relationship between selection criteria and financial
benefit. Selection criteria from an array of scholarly articles, textbooks, and proprietary
industry sources were analyzed in the previous chapter, and will be used to analyze FY16
TACOM LCMC results. The mathematical model and underlying process presented in
this Praxis will enable U.S. Army CPI leaders to make better-informed decisions while
selecting CPI projects which will result in achieving maximum financial benefit for the
betterment of the Warfighter, the Army, Department of Defense, and United States.
In this section, each step in the Praxis process from the ideation of the Praxis topic
to its defense will be outlined. This chapter itself will serve as a historical reference of
how the Praxis was completed, as well as give insight to why and how the individual
tools were used in conjunction with each other. It is also the intent of this Praxis for the
described process and methodology to be replicated and used by other government and
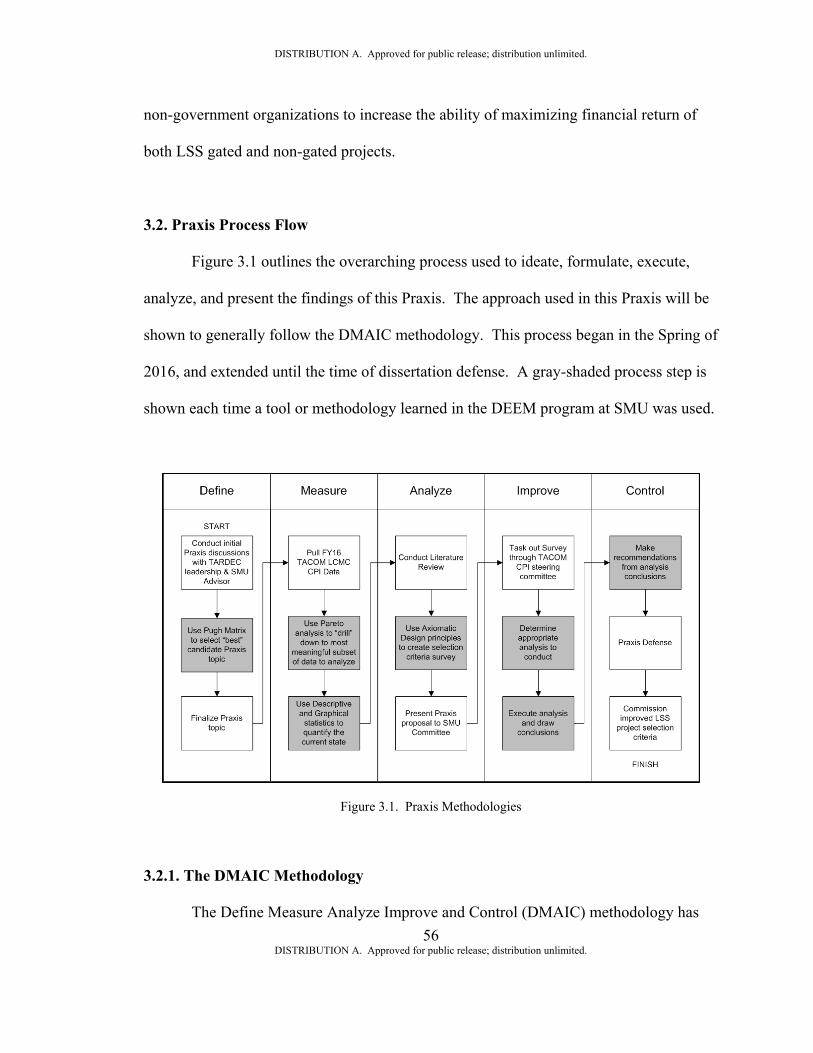
DISTRIBUTION A. Approved for public release; distribution unlimited.
56 DISTRIBUTION A. Approved for public release; distribution unlimited.
non-government organizations to increase the ability of maximizing financial return of
both LSS gated and non-gated projects.
3.2. Praxis Process Flow
Figure 3.1 outlines the overarching process used to ideate, formulate, execute,
analyze, and present the findings of this Praxis. The approach used in this Praxis will be
shown to generally follow the DMAIC methodology. This process began in the Spring of
2016, and extended until the time of dissertation defense. A gray-shaded process step is
shown each time a tool or methodology learned in the DEEM program at SMU was used.
Figure 3.1. Praxis Methodologies
3.2.1. The DMAIC Methodology
The Define Measure Analyze Improve and Control (DMAIC) methodology has
DISTRIBUTION A. Approved for public release; distribution unlimited.
57 DISTRIBUTION A. Approved for public release; distribution unlimited.
been referenced earlier in this research many times. Recall that DMAIC style projects
are also referred to as “gated” as they require a tollgate in between each phase. The
tollgate meeting is a go or no-go decision point, where the project either continues on to
the next phase or is cancelled without proceeding any further.
The Define phase often starts with a vague problem or opportunity statement and
initiates the project team who attempts to clarify the actual problem or research question
being asked. A common objective of the Define phase is to capture the Voice of the
Customer; this information is used to quantify our process’s performance in the Measure
phase. As projects tollgate out of the Define phase, they typically contain a well-defined
and scoped problem and goal statement, a list of team members, and a tentative timeline
for completing the next phases. This research conceptually reached the end of the Define
phase after the first three semester hours of Praxis study when a generalized topic had
been decomposed into a discrete research statement and scope.
The Measure phase relies heavily on collecting data from the current state of the
process in question. There are many tools used in the Measure phase to ensure the right
data is being collected, such as data collection plans and the use of measurement systems
analysis. Following the initial data collection, descriptive and graphical statistics are
often used to make judgements on the current state performance of the process in
question. Many times advanced statistical analysis, such as Control Charts or Process
Capability, will be used at this point to quantify the ability of the current state process to
meet the Voice of the Customer.
The Analyze phase builds on the data collected in the Measure phase and seeks to
DISTRIBUTION A. Approved for public release; distribution unlimited.
58 DISTRIBUTION A. Approved for public release; distribution unlimited.
understand the root causes that are preventing the process from meeting the customer’s
needs. Tools such as the Ishikawa diagram, Failure Modes and Effects Analysis
(FMEA), and other more advanced statistical methods are frequently used. In this
research, after the initial data was collected, the analysis portion started with the literature
review. The Analyze phase will continue on until all survey data has been collected and
analyzed.
The Improve phase again takes what was learned in the previous phases and
builds on it. So far the research question has been defined, data has been collected and
baseline analysis has been executed. Improvements on the current state can now be
executed. An example relating to this research is the creation of a mathematical model to
better select LSS non-gated projects. During the improve phase, a pilot of potential
solutions or improvements is conducted to ensure they will meet the customer’s needs.
The Control phase is the last phase in the DMAIC methodology. Piloted solutions
that have exhibited positive improvement are commissioned and transitioned back to the
process owner. The goal for Control phase is for the process improvement team to be
able to walk away from the process they improved and have the solution endure. The
newly improved process is handed back over to its owner, and the process improvement
team disbands. Two tools commonly used to facilitate this changeover are the transition
plan and control plan.
It is clear that the DMAIC methodology was used to structure the approach for
this research. Many DMAIC tools were used to keep the research on track and always
focused on the goal of answering the research question. The tollgate between Analyze
DISTRIBUTION A. Approved for public release; distribution unlimited.
59 DISTRIBUTION A. Approved for public release; distribution unlimited.
and Improve can be represented by the Praxis Proposal meeting, held on 25 APR 2017.
3.2.2. Initial Praxis topic discussions
Following the Preliminary Counseling Exams held in February of 2016, the
author presented the following initial, high-level, Praxis interest areas:
1. Reliability, Availability, Maintainability, and Synchronization of US ARMY TARDEC laboratories
2. Return on Investment of Process Improvement programs for the Department of Army
3. Optimization of Human Capital investments for US ARMY TARDEC 4. Design of Experiment Use and Advantages at US Army Laboratories
While the Praxis timeline and availability of resources precipitated focusing on a
single topic, it is encouraged that future studies cover the remaining topics. As the reader
will note, the scope of each of the possible Praxis varies, and can be attempted by other
Department of Army employees. A Pugh Matrix, described next, was used to decide
which topic to pursue.
3.2.3. Pugh Matrix
Interestingly, the author noted that the selection criteria for this Praxis itself was
not readily available, nor commonly accepted amongst internal leaders and stakeholders.
An ad-hoc set of selection criteria mimicking the organization’s technical project
selection process was instead used. The author, the organizations leaders, and the SMU
Praxis advisor came to agreement on a single topic through use of a Pugh Matrix. The
Pugh Matrix is a weight-based objective selection tool. The author filled in the
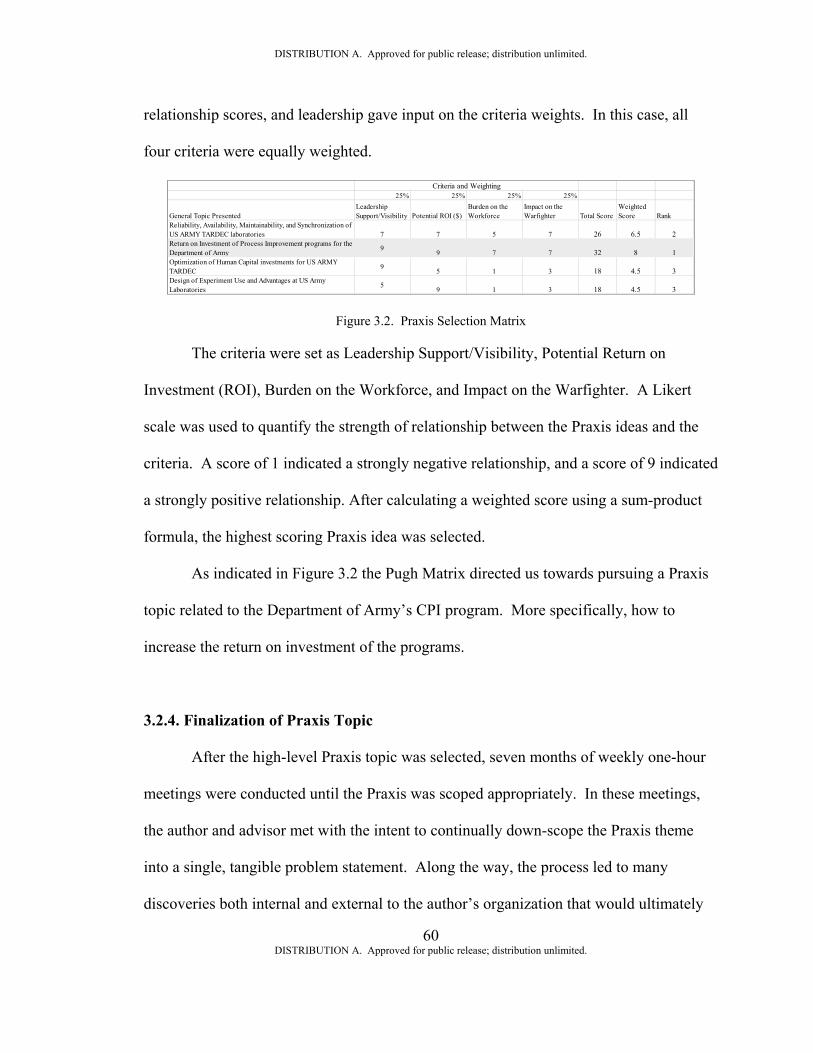
DISTRIBUTION A. Approved for public release; distribution unlimited.
60 DISTRIBUTION A. Approved for public release; distribution unlimited.
relationship scores, and leadership gave input on the criteria weights. In this case, all
four criteria were equally weighted.
Figure 3.2. Praxis Selection Matrix
The criteria were set as Leadership Support/Visibility, Potential Return on
Investment (ROI), Burden on the Workforce, and Impact on the Warfighter. A Likert
scale was used to quantify the strength of relationship between the Praxis ideas and the
criteria. A score of 1 indicated a strongly negative relationship, and a score of 9 indicated
a strongly positive relationship. After calculating a weighted score using a sum-product
formula, the highest scoring Praxis idea was selected.
As indicated in Figure 3.2 the Pugh Matrix directed us towards pursuing a Praxis
topic related to the Department of Army’s CPI program. More specifically, how to
increase the return on investment of the programs.
3.2.4. Finalization of Praxis Topic
After the high-level Praxis topic was selected, seven months of weekly one-hour
meetings were conducted until the Praxis was scoped appropriately. In these meetings,
the author and advisor met with the intent to continually down-scope the Praxis theme
into a single, tangible problem statement. Along the way, the process led to many
discoveries both internal and external to the author’s organization that would ultimately
25% 25% 25% 25%
General Topic PresentedLeadership Support/Visibility Potential ROI ($)
Burden on the Workforce
Impact on the Warfighter Total Score
Weighted Score Rank
Reliability, Availability, Maintainability, and Synchronization of US ARMY TARDEC laboratories 7 7 5 7 26 6.5 2Return on Investment of Process Improvement programs for the Department of Army 9 9 7 7 32 8 1Optimization of Human Capital investments for US ARMY TARDEC 9 5 1 3 18 4.5 3Design of Experiment Use and Advantages at US Army Laboratories 5 9 1 3 18 4.5 3
Criteria and Weighting
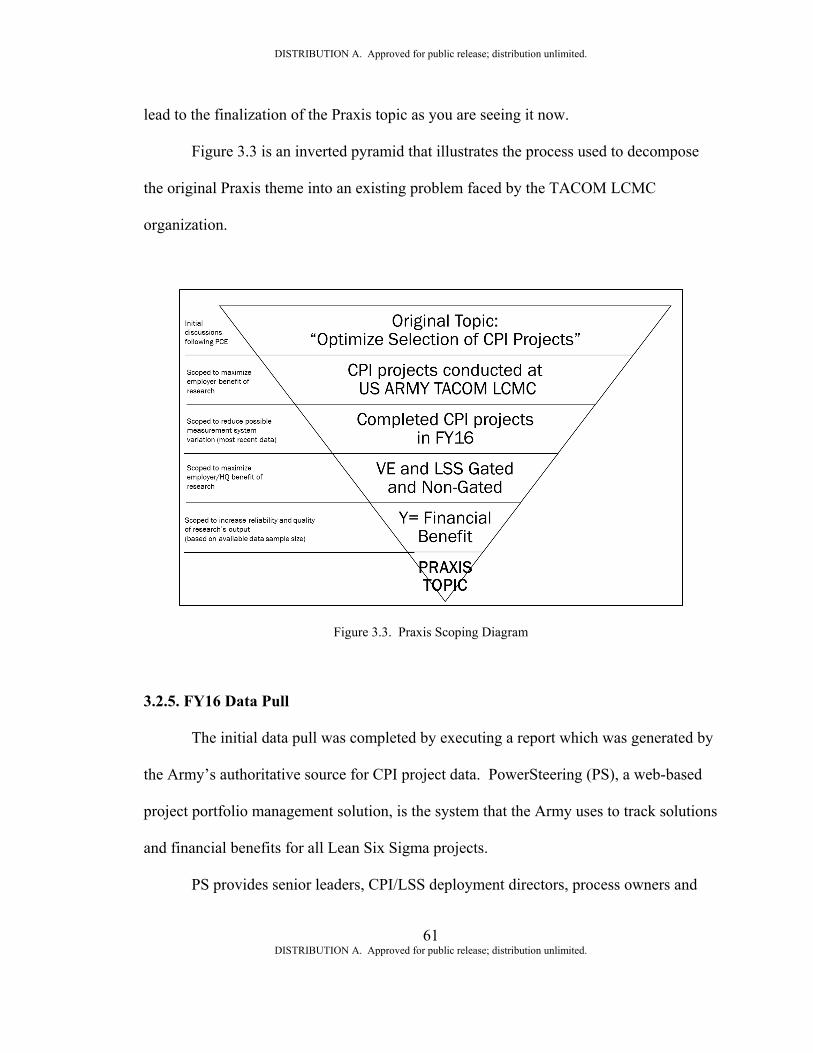
DISTRIBUTION A. Approved for public release; distribution unlimited.
61 DISTRIBUTION A. Approved for public release; distribution unlimited.
lead to the finalization of the Praxis topic as you are seeing it now.
Figure 3.3 is an inverted pyramid that illustrates the process used to decompose
the original Praxis theme into an existing problem faced by the TACOM LCMC
organization.
Figure 3.3. Praxis Scoping Diagram
3.2.5. FY16 Data Pull
The initial data pull was completed by executing a report which was generated by
the Army’s authoritative source for CPI project data. PowerSteering (PS), a web-based
project portfolio management solution, is the system that the Army uses to track solutions
and financial benefits for all Lean Six Sigma projects.
PS provides senior leaders, CPI/LSS deployment directors, process owners and
DISTRIBUTION A. Approved for public release; distribution unlimited.
62 DISTRIBUTION A. Approved for public release; distribution unlimited.
project managers a real time visibility, strategy alignment and CPI/LSS belt practitioner
effectiveness to drive strategy and accelerate results across the Army. PS is used to
manage financial benefits and support Army leaders and practitioners in tracking all CPI
projects. The ability to track and provide metrics on each project allows Army leaders to
align local and enterprise-level projects and initiatives within their strategic goals and
objectives.
By providing "line-of-sight" visibility into the portfolios, Commanders, Senior
Leaders, Deployment Directors, Process Owners and Project Managers have the
information they need to make more effective project investment decisions, reduce costs
and prioritize projects. Risks are identified and issues can be managed in real-time. The
Army also uses PowerSteering as its only source to track operational and financial
benefits derived from continuous process improvement and Lean Six Sigma projects.
3.2.6. Pareto Analysis
Pareto analysis was used during the formative stages of this Praxis. Pareto
analysis, sometimes referred to as the Pareto principle, aims to separate the vital few from
the trivial many. Pareto analysis is frequently used by CPI teams to examine large
quantities of summary data with the hope of reducing the scope of their effort on the most
influential process steps, getting the most impact for their effort. This type of analysis
allows for both continuous and discrete data to be analyzed. Many times this type of
analysis is referred to the “80-20 rule,” as it is posited that 80% of a given process’s
output can be traced back to, or described by 20% of the process’s inputs.
DISTRIBUTION A. Approved for public release; distribution unlimited.
63 DISTRIBUTION A. Approved for public release; distribution unlimited.
The 80-20 rule can be seen in a wide array of applications, such as employee
award bonuses (80% of the bonus money is allocated to 20% of the organization), athletic
events (80% of the football team’s points are scored by roughly 20% of players on the
roster) and even on Wall Street, where one of our Praxis stakeholders who was a former
stock broker had used the Pareto principle to decide which customers to focus 80% of his
time on; the 20% of his customers who had the most money invested in his firm.
3.2.7. Descriptive and Graphical Statistics
Descriptive and graphical statistics were also used frequently throughout this
Praxis. Minitab 17 was used to analyze data sets and create various plots throughout this
Praxis. The reader will note the use of descriptive statistics, graphical statistics, and
Pareto plots in Chapters 1 and 2. These basic statistical tools were used to obtain
measures of central tendency and spread, as well as examining data sets for normality. In
Chapter 4, Minitab 17 will also be used to analyze data and perform hypothesis tests. A
further description of the hypothesis tests used will be covered later in this chapter.
3.2.8. Literature Review
The literature review process is described in Chapter 2. A number of sources
were studied and their individual selection criteria were captured. The criteria underwent
a number of decomposition and affinitization steps before being mapped to a set of 17
unique questions. Figure 3.4 outlines how these steps are linked to collecting the
survey’s response as well as analyzing the resulting data set.
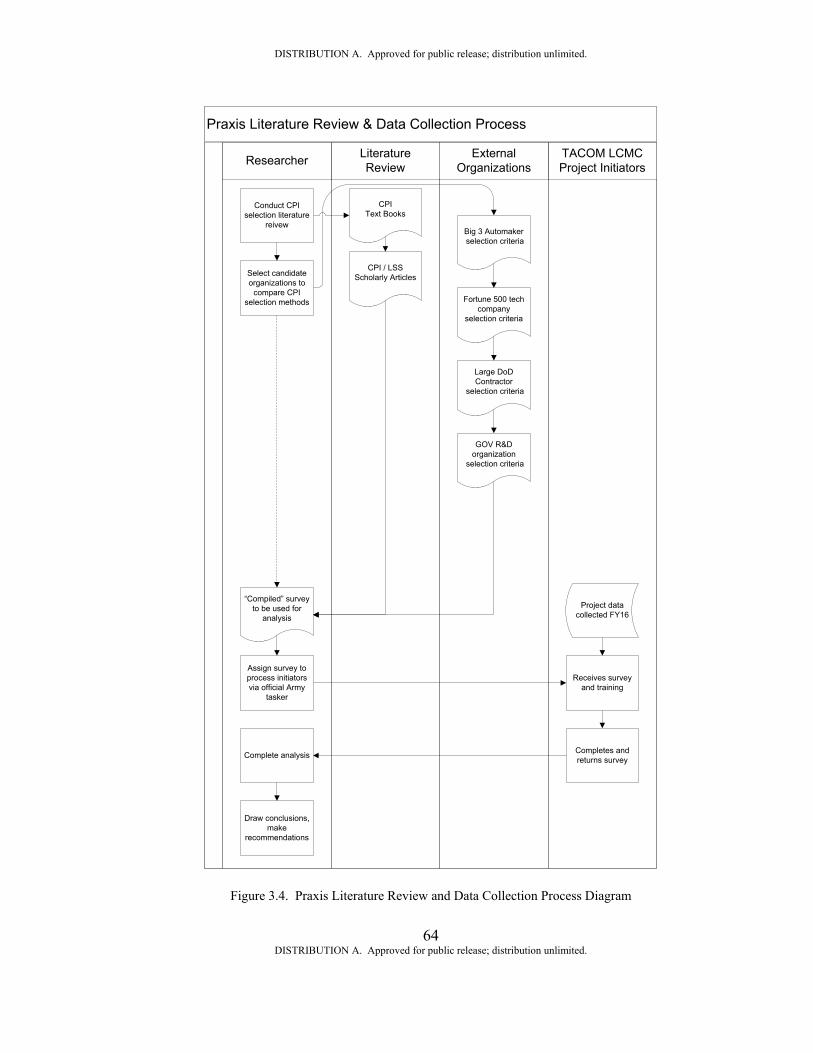
DISTRIBUTION A. Approved for public release; distribution unlimited.
64 DISTRIBUTION A. Approved for public release; distribution unlimited.
Praxis Literature Review & Data Collection Process
TACOM LCMC Project Initiators
External Organizations
Literature ReviewResearcher
Select candidate organizations to
compare CPI selection methods
Big 3 Automaker selection criteria
Fortune 500 tech company
selection criteria
Large DoD Contractor
selection criteria
GOV R&D organization
selection criteria
“Compiled” survey to be used for
analysis
Assign survey to process initiators via official Army
tasker
Complete analysis
Draw conclusions, make
recommendations
CPIText Books
CPI / LSS Scholarly Articles
Conduct CPI selection literature
reivew
Receives survey and training
Completes and returns survey
Project data collected FY16
Figure 3.4. Praxis Literature Review and Data Collection Process Diagram
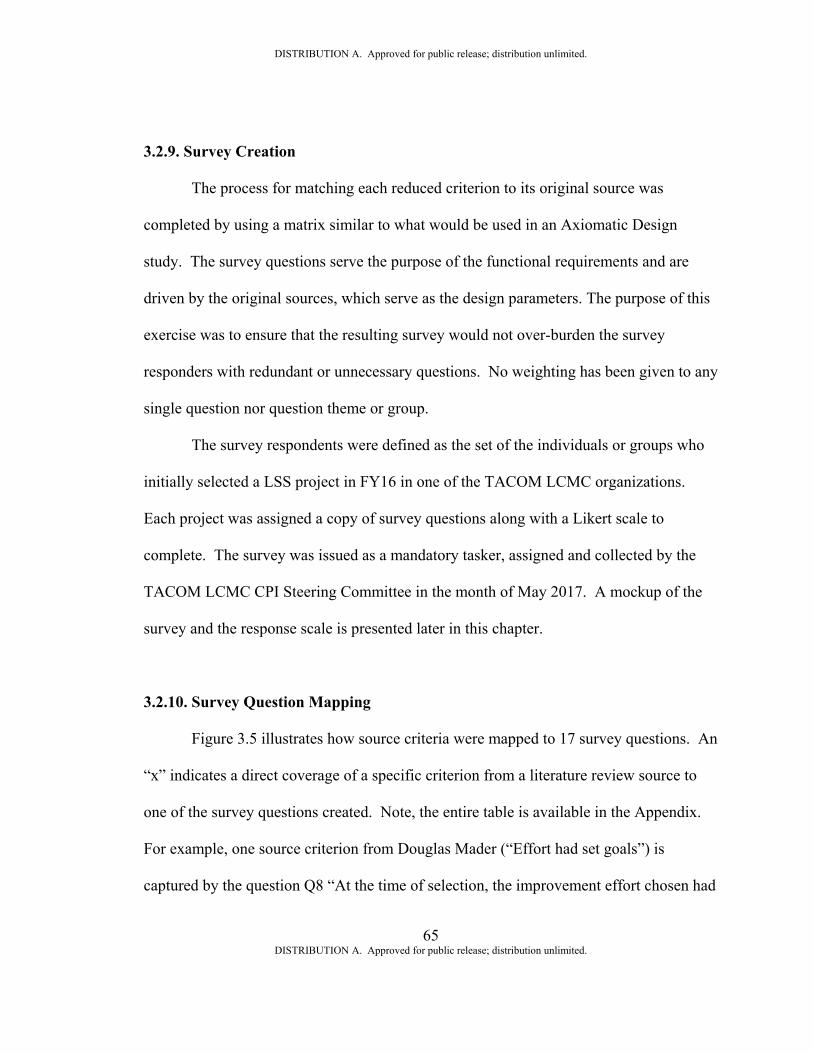
DISTRIBUTION A. Approved for public release; distribution unlimited.
65 DISTRIBUTION A. Approved for public release; distribution unlimited.
3.2.9. Survey Creation
The process for matching each reduced criterion to its original source was
completed by using a matrix similar to what would be used in an Axiomatic Design
study. The survey questions serve the purpose of the functional requirements and are
driven by the original sources, which serve as the design parameters. The purpose of this
exercise was to ensure that the resulting survey would not over-burden the survey
responders with redundant or unnecessary questions. No weighting has been given to any
single question nor question theme or group.
The survey respondents were defined as the set of the individuals or groups who
initially selected a LSS project in FY16 in one of the TACOM LCMC organizations.
Each project was assigned a copy of survey questions along with a Likert scale to
complete. The survey was issued as a mandatory tasker, assigned and collected by the
TACOM LCMC CPI Steering Committee in the month of May 2017. A mockup of the
survey and the response scale is presented later in this chapter.
3.2.10. Survey Question Mapping
Figure 3.5 illustrates how source criteria were mapped to 17 survey questions. An
“x” indicates a direct coverage of a specific criterion from a literature review source to
one of the survey questions created. Note, the entire table is available in the Appendix.
For example, one source criterion from Douglas Mader (“Effort had set goals”) is
captured by the question Q8 “At the time of selection, the improvement effort chosen had
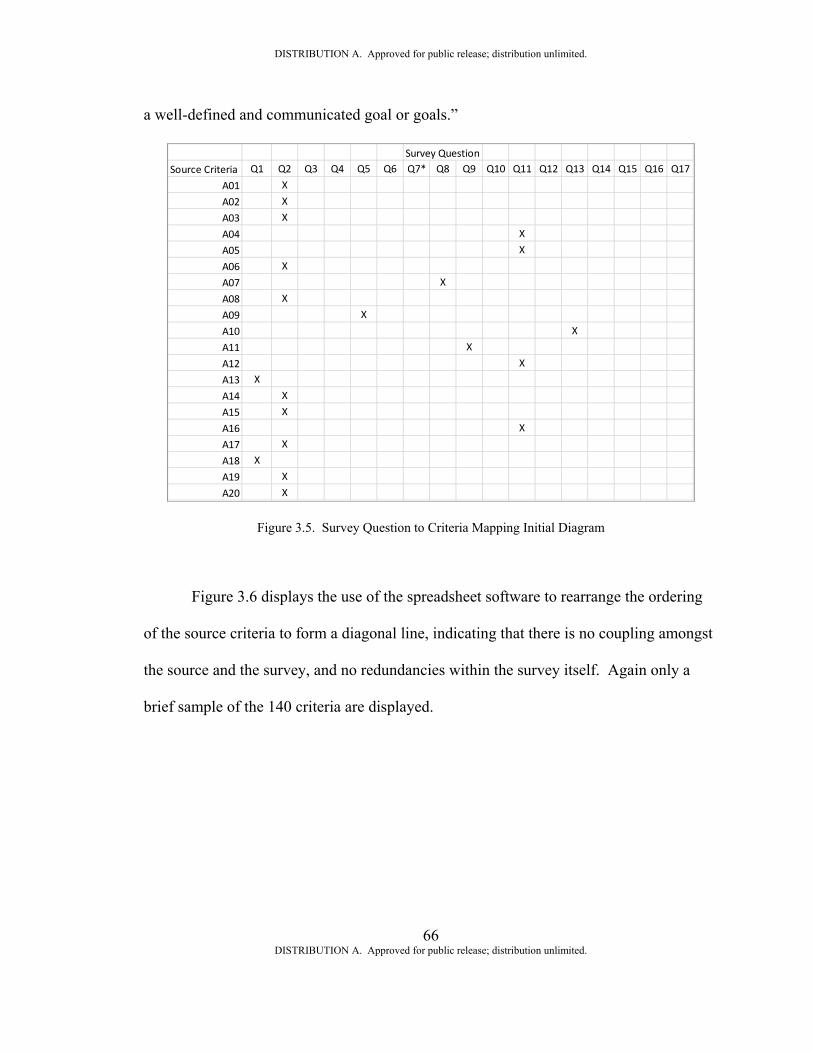
DISTRIBUTION A. Approved for public release; distribution unlimited.
66 DISTRIBUTION A. Approved for public release; distribution unlimited.
a well-defined and communicated goal or goals.”
Figure 3.5. Survey Question to Criteria Mapping Initial Diagram
Figure 3.6 displays the use of the spreadsheet software to rearrange the ordering
of the source criteria to form a diagonal line, indicating that there is no coupling amongst
the source and the survey, and no redundancies within the survey itself. Again only a
brief sample of the 140 criteria are displayed.
Survey QuestionSource Criteria Q1 Q2 Q3 Q4 Q5 Q6 Q7* Q8 Q9 Q10 Q11 Q12 Q13 Q14 Q15 Q16 Q17
A01 XA02 XA03 XA04 XA05 XA06 XA07 XA08 XA09 XA10 XA11 XA12 XA13 XA14 XA15 XA16 XA17 XA18 XA19 XA20 X
DISTRIBUTION A. Approved for public release; distribution unlimited.
67 DISTRIBUTION A. Approved for public release; distribution unlimited.
Figure 3.6. Survey Question to Criteria Mapping Diagonal Diagram
The reader will note that Question 7 does not contain a match among the surveyed
criteria. This question was defined by the author as “During the execution of this project,
the scope was significantly changed by either the project team or the organization’s
leadership”. While this criterion was not prevalent in the literature review, it was deemed
to be an important data point through discussions with CPI stakeholders when
retroactively analyzing a project portfolio. It has been placed in the seventh question slot
due to its proximity in nature to Q5 and Q6. The data collected via this question was not
used in this Praxis.
3.2.11. Survey Question mockup with Likert Scale
The following questions were derived from the literature review and was
randomized for each project studied. Additionally, two Army-specific questions
Survey QuestionSource Criteria Q1 Q2 Q3 Q4 Q5 Q6 Q7* Q8 Q9 Q10 Q11 Q12 Q13 Q14 Q15 Q16 Q17
A13 XO24 XA36 XA25 XB61 XB41 XA07 XB12 XB06 XO18 XO17 XO29 XO09 XB40 XA38 XO21 X
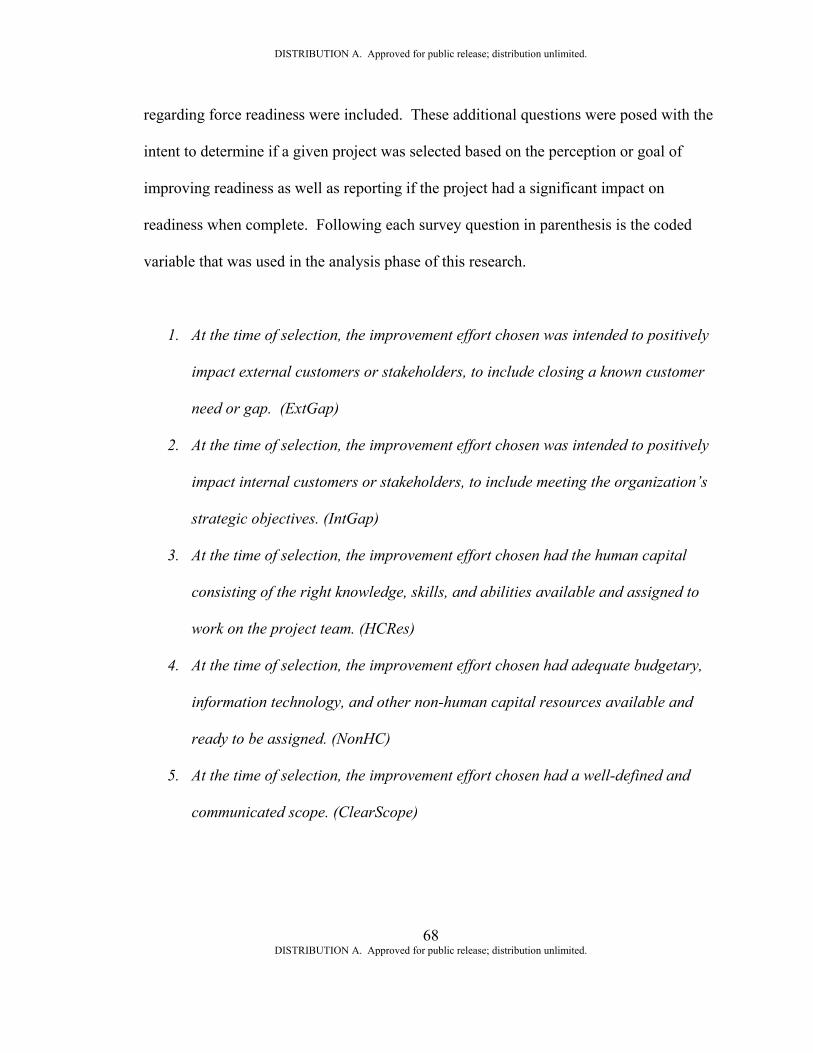
DISTRIBUTION A. Approved for public release; distribution unlimited.
68 DISTRIBUTION A. Approved for public release; distribution unlimited.
regarding force readiness were included. These additional questions were posed with the
intent to determine if a given project was selected based on the perception or goal of
improving readiness as well as reporting if the project had a significant impact on
readiness when complete. Following each survey question in parenthesis is the coded
variable that was used in the analysis phase of this research.
1. At the time of selection, the improvement effort chosen was intended to positively
impact external customers or stakeholders, to include closing a known customer
need or gap. (ExtGap)
2. At the time of selection, the improvement effort chosen was intended to positively
impact internal customers or stakeholders, to include meeting the organization’s
strategic objectives. (IntGap)
3. At the time of selection, the improvement effort chosen had the human capital
consisting of the right knowledge, skills, and abilities available and assigned to
work on the project team. (HCRes)
4. At the time of selection, the improvement effort chosen had adequate budgetary,
information technology, and other non-human capital resources available and
ready to be assigned. (NonHC)
5. At the time of selection, the improvement effort chosen had a well-defined and
communicated scope. (ClearScope)
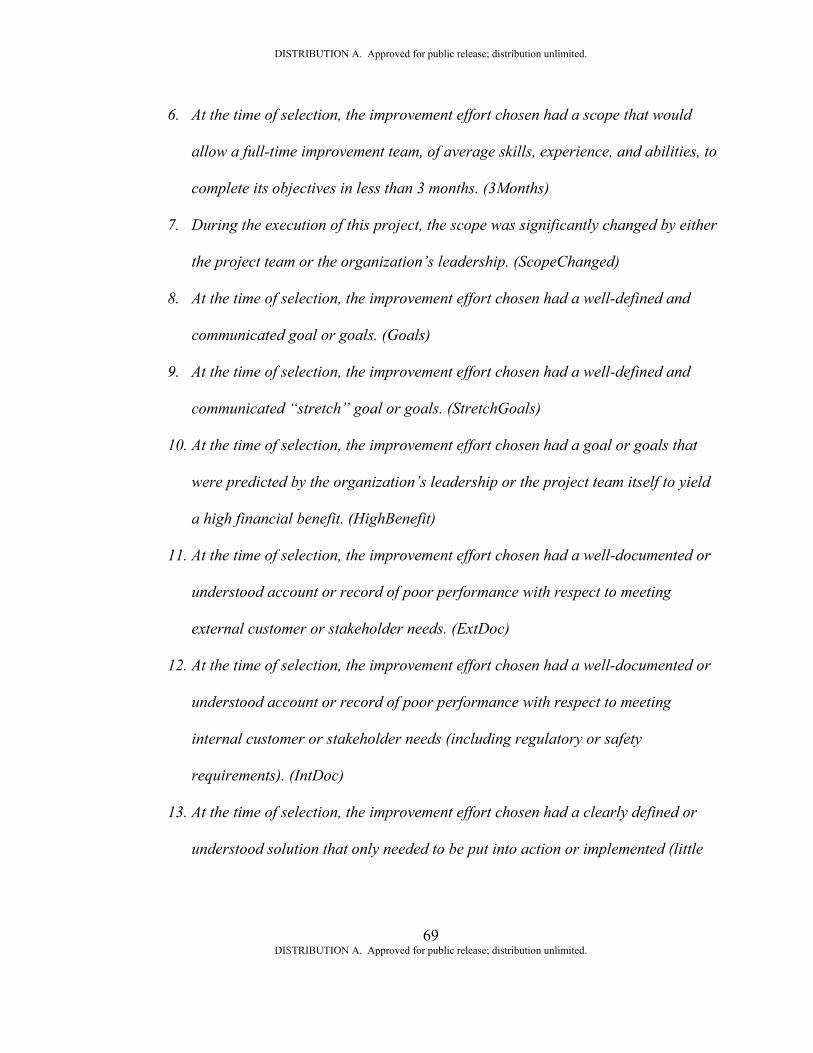
DISTRIBUTION A. Approved for public release; distribution unlimited.
69 DISTRIBUTION A. Approved for public release; distribution unlimited.
6. At the time of selection, the improvement effort chosen had a scope that would
allow a full-time improvement team, of average skills, experience, and abilities, to
complete its objectives in less than 3 months. (3Months)
7. During the execution of this project, the scope was significantly changed by either
the project team or the organization’s leadership. (ScopeChanged)
8. At the time of selection, the improvement effort chosen had a well-defined and
communicated goal or goals. (Goals)
9. At the time of selection, the improvement effort chosen had a well-defined and
communicated “stretch” goal or goals. (StretchGoals)
10. At the time of selection, the improvement effort chosen had a goal or goals that
were predicted by the organization’s leadership or the project team itself to yield
a high financial benefit. (HighBenefit)
11. At the time of selection, the improvement effort chosen had a well-documented or
understood account or record of poor performance with respect to meeting
external customer or stakeholder needs. (ExtDoc)
12. At the time of selection, the improvement effort chosen had a well-documented or
understood account or record of poor performance with respect to meeting
internal customer or stakeholder needs (including regulatory or safety
requirements). (IntDoc)
13. At the time of selection, the improvement effort chosen had a clearly defined or
understood solution that only needed to be put into action or implemented (little
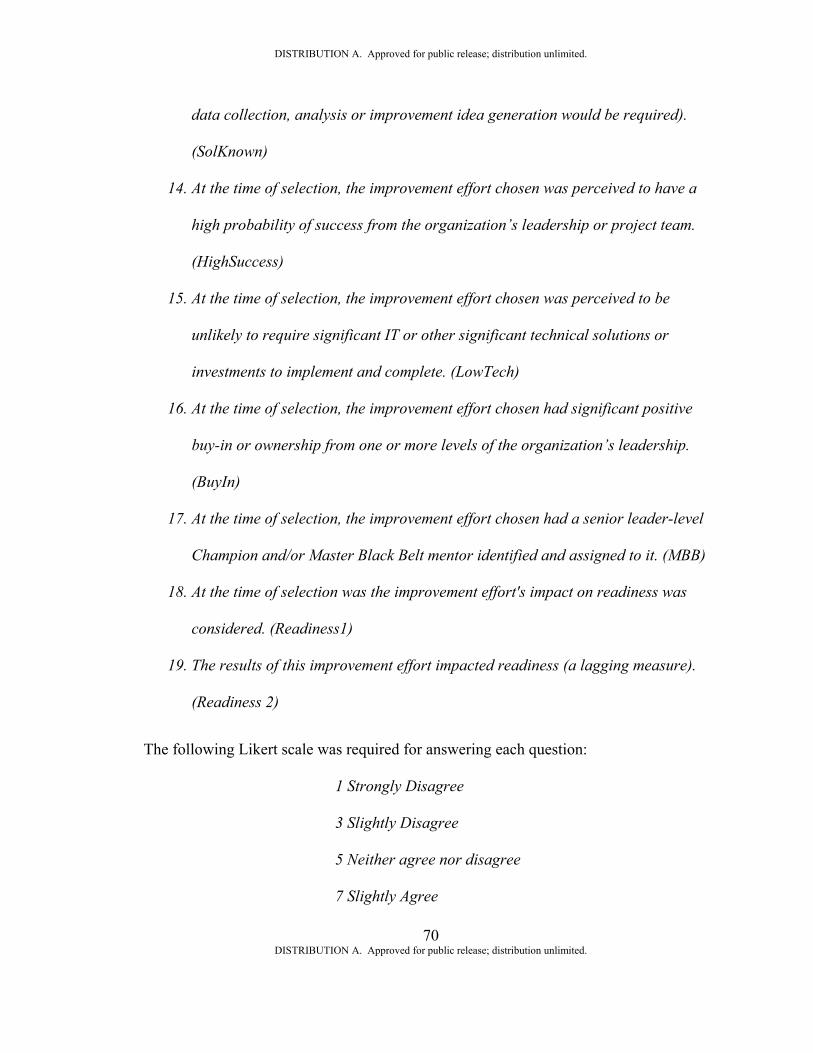
DISTRIBUTION A. Approved for public release; distribution unlimited.
70 DISTRIBUTION A. Approved for public release; distribution unlimited.
data collection, analysis or improvement idea generation would be required).
(SolKnown)
14. At the time of selection, the improvement effort chosen was perceived to have a
high probability of success from the organization’s leadership or project team.
(HighSuccess)
15. At the time of selection, the improvement effort chosen was perceived to be
unlikely to require significant IT or other significant technical solutions or
investments to implement and complete. (LowTech)
16. At the time of selection, the improvement effort chosen had significant positive
buy-in or ownership from one or more levels of the organization’s leadership.
(BuyIn)
17. At the time of selection, the improvement effort chosen had a senior leader-level
Champion and/or Master Black Belt mentor identified and assigned to it. (MBB)
18. At the time of selection was the improvement effort's impact on readiness was
considered. (Readiness1)
19. The results of this improvement effort impacted readiness (a lagging measure).
(Readiness 2)
The following Likert scale was required for answering each question:
1 Strongly Disagree
3 Slightly Disagree
5 Neither agree nor disagree
7 Slightly Agree
DISTRIBUTION A. Approved for public release; distribution unlimited.
71 DISTRIBUTION A. Approved for public release; distribution unlimited.
9 Strongly Agree
3.2.12. Praxis Proposal
The Praxis Proposal meeting was conducted on 25 April 2017. In this session, the
committee members provided feedback and determined that the Praxis topic should
proceed onto the next phases including data collection, analysis, and conclusions. The
committee agreed to include both non-gated and gated LSS projects in the analysis.
Specific analysis methods were discussed but not selected at this time.
3.2.13. Survey Dissemination
Following an initial brief and training session with all survey responders, the
survey was executed in May 2017. The data collection survey was disseminated digitally
via the TACOM internal portal, ensuring each completed survey is tracked to both the
project being analyzed as well as the person completing the survey. Responses were to
be required within 30 days of the tasker being issued, although 60 days were allowed for
those who were out of the office or unable to complete the survey in time. Non-
compliances were to be resolved by the TACOM LCMC CPI Steering Committee at the
next available monthly meeting, however, at the end of the 60 day period, a judgement
was made by the Steering and Praxis Committees that a minimum sample size had been
reached, ending the data collection period. The resulting data was immediately available
in summary tabular form as well as in an unstacked format and ready for analysis in
Minitab and SPSS.
DISTRIBUTION A. Approved for public release; distribution unlimited.
72 DISTRIBUTION A. Approved for public release; distribution unlimited.
3.2.14 Benchmarking Ordinal Logistic Regression: An Application to Pregnancy
Outcomes
While researching potential analysis approaches in the Minitab 17 software
package, a then unknown approach to the author was uncovered. Nested in the regression
analysis menu, Ordinal Logistic Regression was identified as a potential analysis
approach for this Praxis. Cursory research was conducted to gain a baseline
understanding of the approach (details presented in the following subsection), followed
by the analysis of number of relevant case studies in an effort to find a promising
benchmark for this Praxis.
The 2010 study conducted by K.A. Adeleke and A.A. Adepoju, “Ordinal Logistic
Regression: An Application to Pregnancy Outcomes,” used the methodology to model the
categorical response of pregnancy outcome to a number of patient-specific predictor
variables at a Nigerian State hospital. This case study used 100 patient records, collected
retrospectively, to analyze the probability of an ordinal categorization of pregnancy
outcomes. The predictor variables studied included environmental factors such as a
previous cesareans, hospital service availability, behavioral factors such as antenatal care
and diseases, and demographic factors such as maternal age, marital status, and weight.
The ordinal outcomes studied with these predictors, arranged in increasing category, were
abortion, still birth, and livebirth.
The authors concluded a number of findings, including the result that women
carrying a baby which had a weight less than 2.5 kg were 18.4 times more likely to have
DISTRIBUTION A. Approved for public release; distribution unlimited.
73 DISTRIBUTION A. Approved for public release; distribution unlimited.
had a livebirth than are women with history of babies greater than or equal to 2.5 kg in
the studied geographic region. This information, though somewhat limited by its sample
size, could potentially be used to inform patients and doctors in efforts to improve the
likelihood of the higher ordinal category output (livebirth). The study resulted in a
number of practical conclusions, recommendations, and methodology which may reach a
wide audience as the Journal of Mathematics and Statistics published their findings in
2010.
Adeleke and Adepoju’s research serves a solid baseline for this research for many
reasons. First, Adeleke and Adepoju’s study was conducted with a similar number of
data points, collected retrospectively. It should be noted that Ordinal Logistic Regression
(OLR) is highly dependent on sample size- their article containing 100 samples was
found sufficient in drawing practical conclusions, and to be published in a scientific
journal. This Praxis resulted in the collection of 119 data points from the previous fiscal
year.
The data in this study was regressed over an ordinal outcome, which had a logical
order. Instead of pregnancy outcomes, this Praxis will use financial benefit outcomes, in
ordinal categories: no financial benefit, low financial benefit, medium financial benefit,
and high financial benefit (defined in the following chapter). The predictor variables
studied by Adeleke and Adepoju exhibited variation in subject matter. For example,
variables relating to environmental factors contrast heavily when compared to an
individual’s previous pregnancy history. Adeleke and Adepoju’s predictor variables
clearly relied on differing data types (binary to continuous). In this Praxis a common
DISTRIBUTION A. Approved for public release; distribution unlimited.
74 DISTRIBUTION A. Approved for public release; distribution unlimited.
Likert scale for each predictor variable was captured in a single survey.
As outlined in the following subsections, Adeleke and Adepoju’s OLR study was
used in conjunction with other analysis types. Following the use of the General Linear
Model and Logit Link function, the group used Multiple Regression and Best Subsets
Regression to further refine their conclusions. The following three subsections outline
the analysis types executed in support of this Praxis, two of which were utilized by
Adeleke and Adepoju.
3.2.14.1 Ordinal Logistic Regression
Ordinal Logistic Regression is a procedure for regressing a number of predictor
variables over a range of ordinal output categories. The intent of this analysis is to
examine the relationship between the predictors and their likelihood to result in, or
predict, a given categorical response existing naturally in an ordinal fashion. The ordinal
response in this analysis is seen as a natural ordering of at least three output categories,
such as low, medium, high. If the categories had no natural ordering, nominal regression
logistic regression would be preferred.
Ordinal variables may be also exist as the independent variables in an equation.
In the case of this research we have an ordinal scale being used to collect the level of
agreement with a number of predictive survey questions, as well as the output variable of
financial benefit. According to Winship and Mare’s 1984 entry in the American
Sociological Review, ordinal independent variables may be treated as continuous
variables for analysis (Winship and Mare, 517).

DISTRIBUTION A. Approved for public release; distribution unlimited.
75 DISTRIBUTION A. Approved for public release; distribution unlimited.
In both Minitab 17 and SPSS, the Generalized Linear Model (GLM) is used in
conjunction with n-1 logit functions to execute the analysis. The GLM assumes there is a
latent continuous outcome variable that has been discretized into j-ordered groups- a
perfect match for this study (as will be shown in the following chapter, actual numerical
financial benefits from each sample will be categorized into the classifications of no
financial benefit, low financial benefit, medium, and high financial benefit) This analysis
assumes the effect of the predictor is common across all response categories.
The basic form of the GLM is given as:
where 𝛾𝛾𝑗𝑗 is the cumulative probability for the jth category, 𝜃𝜃𝑗𝑗 is the threshold for the
jth category, 𝛽𝛽1 …𝛽𝛽1𝑘𝑘 are the regression coefficients, 𝑥𝑥1 … 𝑥𝑥𝑘𝑘 are the predictor
variables, and k is the number of predictors. The numerator on the right side determines
the location of the model. The denominator of the equation specifies the scale. The
𝜏𝜏1 … 𝜏𝜏𝑚𝑚 are coefficients for the scale component and 𝑧𝑧1 … 𝑧𝑧𝑚𝑚 are m predictor variables
for the scale component (chosen from the same set of variables as the x’s).
The link function is the function of the probabilities that results in a linear model
in the parameters. It defines what goes on the left side of the equation shown above. This
function acts as the link between the random component on the left side of the equation
and the systematic component on the right. The standard GLM contains 5 Link models to
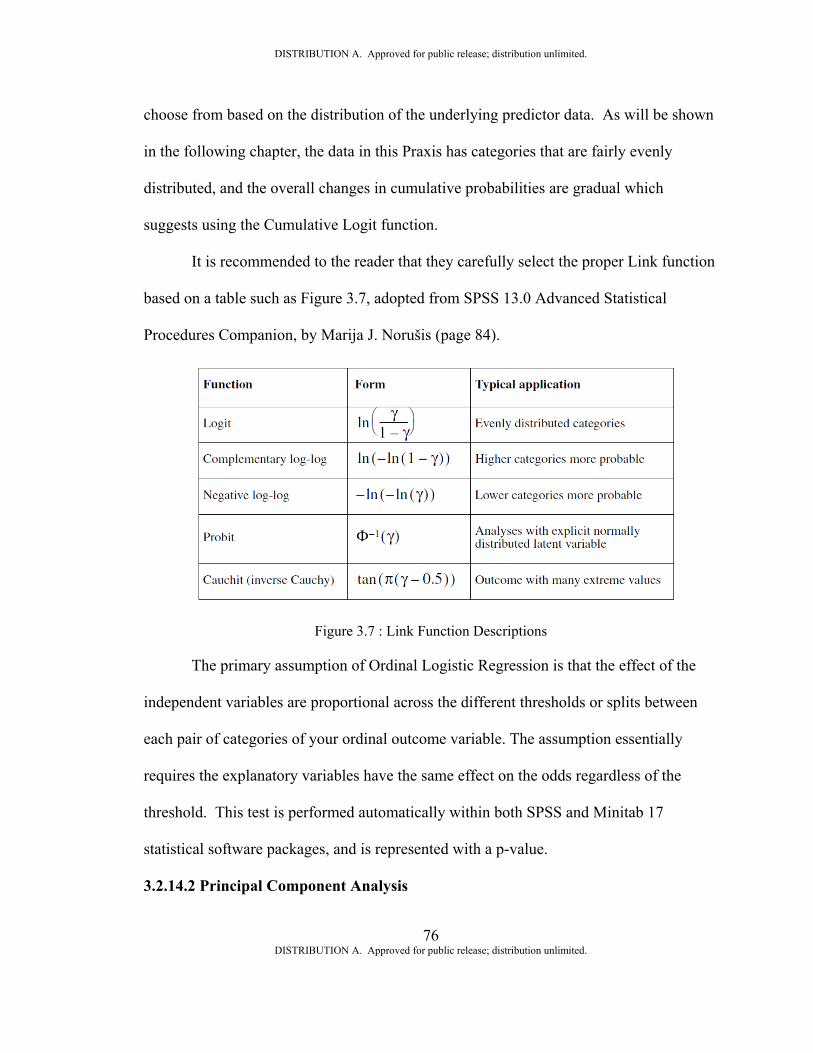
DISTRIBUTION A. Approved for public release; distribution unlimited.
76 DISTRIBUTION A. Approved for public release; distribution unlimited.
choose from based on the distribution of the underlying predictor data. As will be shown
in the following chapter, the data in this Praxis has categories that are fairly evenly
distributed, and the overall changes in cumulative probabilities are gradual which
suggests using the Cumulative Logit function.
It is recommended to the reader that they carefully select the proper Link function
based on a table such as Figure 3.7, adopted from SPSS 13.0 Advanced Statistical
Procedures Companion, by Marija J. Norušis (page 84).
Figure 3.7 : Link Function Descriptions
The primary assumption of Ordinal Logistic Regression is that the effect of the
independent variables are proportional across the different thresholds or splits between
each pair of categories of your ordinal outcome variable. The assumption essentially
requires the explanatory variables have the same effect on the odds regardless of the
threshold. This test is performed automatically within both SPSS and Minitab 17
statistical software packages, and is represented with a p-value.
3.2.14.2 Principal Component Analysis
DISTRIBUTION A. Approved for public release; distribution unlimited.
77 DISTRIBUTION A. Approved for public release; distribution unlimited.
Principal Component Analysis (PCA) is a procedure for identifying a smaller
number of uncorrelated variables (“principal components”) from a large set of data. The
goal of this type of analysis is to explain the maximum amount of variance with the
fewest number of principal components. It is unclear if Adeleke and Adepoju used this
type of analysis in their case study.
This type of analysis can be executed following the collection of the data to not
only reduce the number of variables studied, but also avoid multicollinearity among the
input variables. The value of the PCA is determining if a smaller number of uncorrelated
variables that are easier to interpret and analyze can be modeled (Principal Component
Analysis Overview).
An example of where multicollinearity may exist in this research, or its
replication, would be a project that was selected to positively impact both internal and
external customers. Additionally this analysis may suggest that the selection criteria
improvement focus and current state performance are highly correlated. A project
selected because it performed very poorly in the current state may also have a high
degree of perceived impact on the external customer. Further, that project’s selection
criteria may also be correlated with having a clearly defined scope and goals, as
leadership may be under heavy fire to solve the problem as soon as possible.
3.2.14.3 Best Subsets Multiple Regression
Best Subsets Multiple Regression could also be used to answer our primary
hypothesis statement if we do not detect multicollinearity among our predictor terms.
DISTRIBUTION A. Approved for public release; distribution unlimited.
78 DISTRIBUTION A. Approved for public release; distribution unlimited.
Adeleke and Adepoju used this analysis to conclude their study on pregnancy outcomes
at a State hospital in Nigeria.
Best subsets regression is an automated analysis that results in the best-fitting
regression model based on the data analyzed. R-squared, adjusted R-squared, predicted
R-squared, Mallows’ Cp, and s are calculated by the best subsets procedure and are used
by criteria for model comparisons. A subset of predictor variables is the result of the
analysis (Basics of best subsets regression).
In a best subsets analysis, the highest R2 model contains the largest number of
predictor terms. For example, a model with five predictor terms will always have a larger
R2 than a four term model. R2 is used for comparing models of the same size while
adjusted R2 and Mallows’ Cp is instead used to compare models with different numbers
of predictor terms. Models with lower adjusted R2 may include insignificant terms.
An alpha value of .05, or 95% confidence level will be used. As such, P values
below .05 will cause us to reject the Null Hypothesis and support the Alternative
Hypothesis.
This analysis will seek to understand which, if any, selection criteria predict the
highest financial benefit for LSS projects. This will be completed by examining both the
P values from the regression analysis, and the magnitude of each variable in the
regression equation. The regression equation will also be analyzed for its fit to the
current data set, where R2 adjusted and the normality of residuals will be documented.
Any R2 value above .7 will be reported as an indication of moderate correlation. R2
values above .9 will be reported as an indication of strong correlation.
DISTRIBUTION A. Approved for public release; distribution unlimited.
79 DISTRIBUTION A. Approved for public release; distribution unlimited.
3.2.15. Praxis Defense
The Praxis Defense will be completed following the data collection, analysis, and
conclusions or recommendation phases of this research have been completed. The Praxis
Defense will be held onsite at SMU in University Park, TX.
3.2.16. Commissioning of Praxis Findings
Following the Praxis Defense, the findings of this research will be communicated
throughout the TACOM LCMC. The results may effect change on local processes and
policies with respect to the selection of LSS non-gated projects. Additionally, the
findings from this research will be presented to the AMC CPI team in Huntsville, AL.
Further, the outline of this research project will be available to all Department of
Defense employees and contractors through the Defense Technical Information Center
(DTIC), allowing others to replicate and build on these findings. For example, an
organization in the Department of Navy may use this research process to better refine and
optimize their own criteria for selecting LSS non-gated projects, while an organization in
the Air Force may use this as a template to study their selection criteria for other CPI
program and project types such as gated VE, non-gated VE, or gated LSS projects.
3.3. Measurement System Analysis
This research relies on two sets of data to be collected. The first set of data comes
from an online database known as PowerSteering. Because of the newly implemented
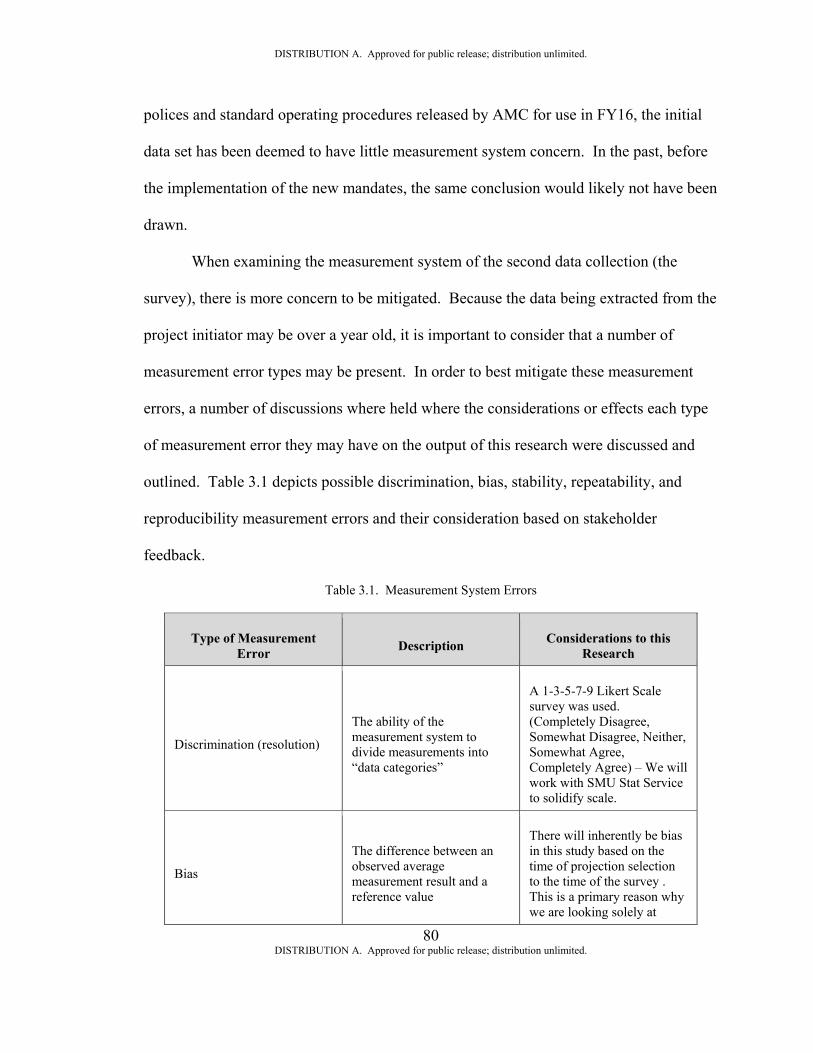
DISTRIBUTION A. Approved for public release; distribution unlimited.
80 DISTRIBUTION A. Approved for public release; distribution unlimited.
polices and standard operating procedures released by AMC for use in FY16, the initial
data set has been deemed to have little measurement system concern. In the past, before
the implementation of the new mandates, the same conclusion would likely not have been
drawn.
When examining the measurement system of the second data collection (the
survey), there is more concern to be mitigated. Because the data being extracted from the
project initiator may be over a year old, it is important to consider that a number of
measurement error types may be present. In order to best mitigate these measurement
errors, a number of discussions where held where the considerations or effects each type
of measurement error they may have on the output of this research were discussed and
outlined. Table 3.1 depicts possible discrimination, bias, stability, repeatability, and
reproducibility measurement errors and their consideration based on stakeholder
feedback.
Table 3.1. Measurement System Errors
Type of Measurement Error Description Considerations to this
Research
Discrimination (resolution) The ability of the measurement system to divide measurements into “data categories”
A 1-3-5-7-9 Likert Scale survey was used. (Completely Disagree, Somewhat Disagree, Neither, Somewhat Agree, Completely Agree) – We will work with SMU Stat Service to solidify scale.
Bias The difference between an observed average measurement result and a reference value
There will inherently be bias in this study based on the time of projection selection to the time of the survey . This is a primary reason why we are looking solely at
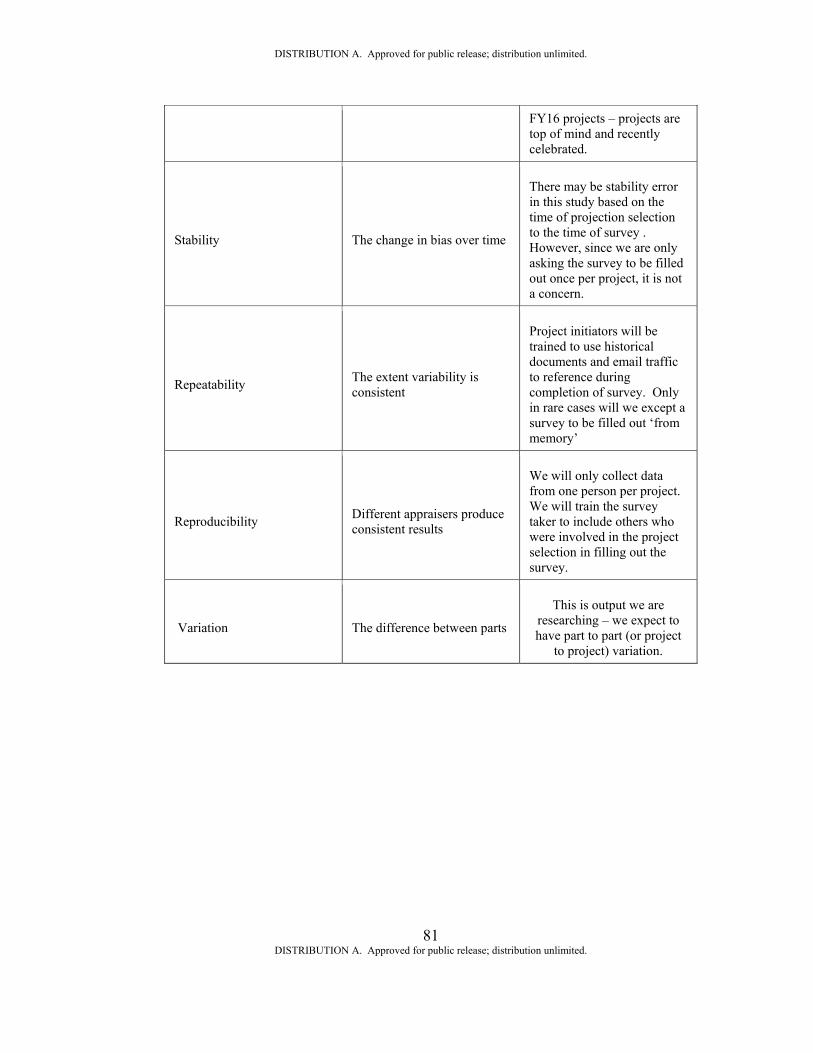
DISTRIBUTION A. Approved for public release; distribution unlimited.
81 DISTRIBUTION A. Approved for public release; distribution unlimited.
FY16 projects – projects are top of mind and recently celebrated.
Stability The change in bias over time
There may be stability error in this study based on the time of projection selection to the time of survey . However, since we are only asking the survey to be filled out once per project, it is not a concern.
Repeatability The extent variability is consistent
Project initiators will be trained to use historical documents and email traffic to reference during completion of survey. Only in rare cases will we except a survey to be filled out ‘from memory’
Reproducibility Different appraisers produce consistent results
We will only collect data from one person per project. We will train the survey taker to include others who were involved in the project selection in filling out the survey.
Variation The difference between parts This is output we are
researching – we expect to have part to part (or project
to project) variation.
DISTRIBUTION A. Approved for public release; distribution unlimited.
82 DISTRIBUTION A. Approved for public release; distribution unlimited.
CHAPTER 4
ANALYSIS RESULTS
4.1. Outline
This chapter describes the process of processing and analyzing the data collected
both from the FY16 LSS project results, obtained from PowerSteering, the Army’s
system of record for CPI project results (see Figure 1.3 and Table 1.1), as well as the
project selection survey executed in 2017. Data was collected over a period of two
months via an online survey disseminated through the TACOM LCMC CPI Steering
Committee, a governance and reporting board for all CPI financial and operational
benefiting projects.
During the early stages of the analysis phase of this Praxis, it was determined that
creating a predictive equation of sixteen or more predictors that aimed to pinpoint a
specific numeric financial benefit output was practically infeasible. If it turned out that a
strong relationship and predictive equation could be calculated, it would still be unlikely
for practical use in TACOM LCMC or other organizations. Instead, the focus shifted on
the ability to predict, based on those same predictors, a category or level of financial
benefit. Similar to the Nigerian hospital research referenced in Chapter 3, this type of
analysis could lead to important findings and recommendations for the future
performance of the CPI program; and result in the selection of LSS projects that were
most likely to yield high financial benefits (or the highest category of readiness, for
DISTRIBUTION A. Approved for public release; distribution unlimited.
83 DISTRIBUTION A. Approved for public release; distribution unlimited.
example).
Over a number of feedback sessions the steering committee provided input on the
survey itself, adding in two additional questions regarding LSS project impact to
“readiness;” which was defined both as an Army-specific predictor (was readiness
considered) and outcome (was readiness positively impacted). Readiness is a general
term used to quantify the ability of the Army’s forces to continue to execute and win in
theatre. In addition to financial benefit, each project’s effect on Readiness will be
regressed over to provide additional insight into how projects may be selected that do not
aim to maximize financial benefit.
Prior to collecting data from each FY16 project initiator, a thirty minute hands-on
training event was held to ensure the proper documentation and submission of each
survey. As outlined previously, each FY16 LSS project that was completed was assigned
a copy of the survey with the intent of having each project’s selection criteria returned to
the author. As will be discussed in the following section, while not all FY16 project data
was captured, a significant amount of project selection criteria data was successfully
documented and submitted, allowing the analysis phase to be executed and the overall
progression of this research.
4.2. Survey Results
The data collection survey resulted in 119 LSS project data points to be matched
with their corresponding financial benefit output. The survey initially aimed to collect all
152 completed LSS project selection criteria data, including 33 gated projects and 119
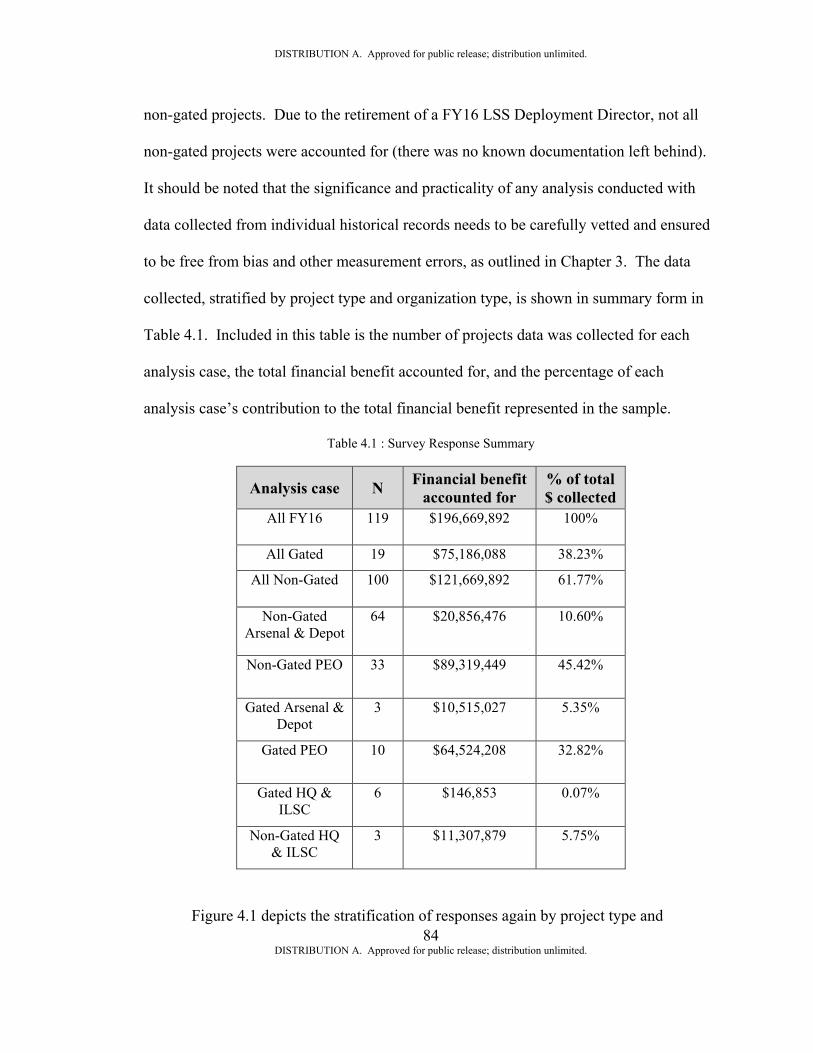
DISTRIBUTION A. Approved for public release; distribution unlimited.
84 DISTRIBUTION A. Approved for public release; distribution unlimited.
non-gated projects. Due to the retirement of a FY16 LSS Deployment Director, not all
non-gated projects were accounted for (there was no known documentation left behind).
It should be noted that the significance and practicality of any analysis conducted with
data collected from individual historical records needs to be carefully vetted and ensured
to be free from bias and other measurement errors, as outlined in Chapter 3. The data
collected, stratified by project type and organization type, is shown in summary form in
Table 4.1. Included in this table is the number of projects data was collected for each
analysis case, the total financial benefit accounted for, and the percentage of each
analysis case’s contribution to the total financial benefit represented in the sample.
Table 4.1 : Survey Response Summary
Analysis case N Financial benefit accounted for
% of total $ collected
All FY16 119 $196,669,892 100% All Gated 19 $75,186,088 38.23%
All Non-Gated 100 $121,669,892 61.77% Non-Gated
Arsenal & Depot 64 $20,856,476 10.60%
Non-Gated PEO 33 $89,319,449 45.42%
Gated Arsenal & Depot
3 $10,515,027 5.35%
Gated PEO 10 $64,524,208 32.82%
Gated HQ & ILSC
6 $146,853 0.07%
Non-Gated HQ & ILSC
3 $11,307,879 5.75%
Figure 4.1 depicts the stratification of responses again by project type and
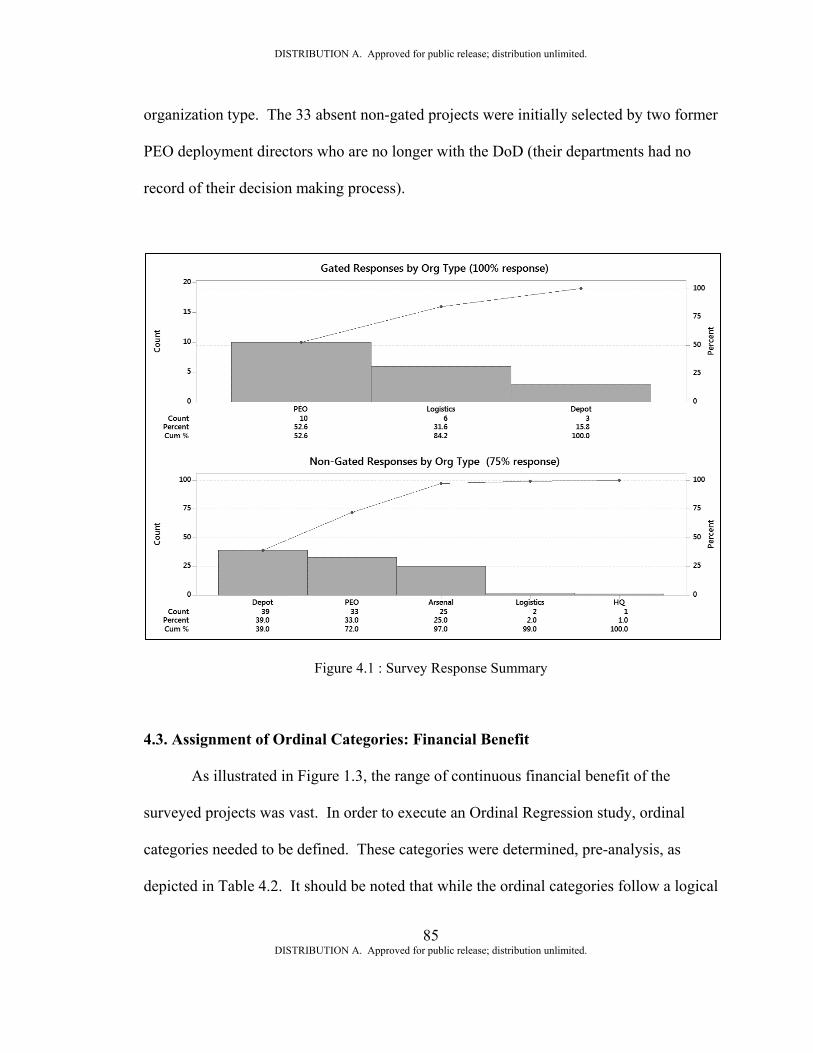
DISTRIBUTION A. Approved for public release; distribution unlimited.
85 DISTRIBUTION A. Approved for public release; distribution unlimited.
organization type. The 33 absent non-gated projects were initially selected by two former
PEO deployment directors who are no longer with the DoD (their departments had no
record of their decision making process).
Figure 4.1 : Survey Response Summary
4.3. Assignment of Ordinal Categories: Financial Benefit
As illustrated in Figure 1.3, the range of continuous financial benefit of the
surveyed projects was vast. In order to execute an Ordinal Regression study, ordinal
categories needed to be defined. These categories were determined, pre-analysis, as
depicted in Table 4.2. It should be noted that while the ordinal categories follow a logical
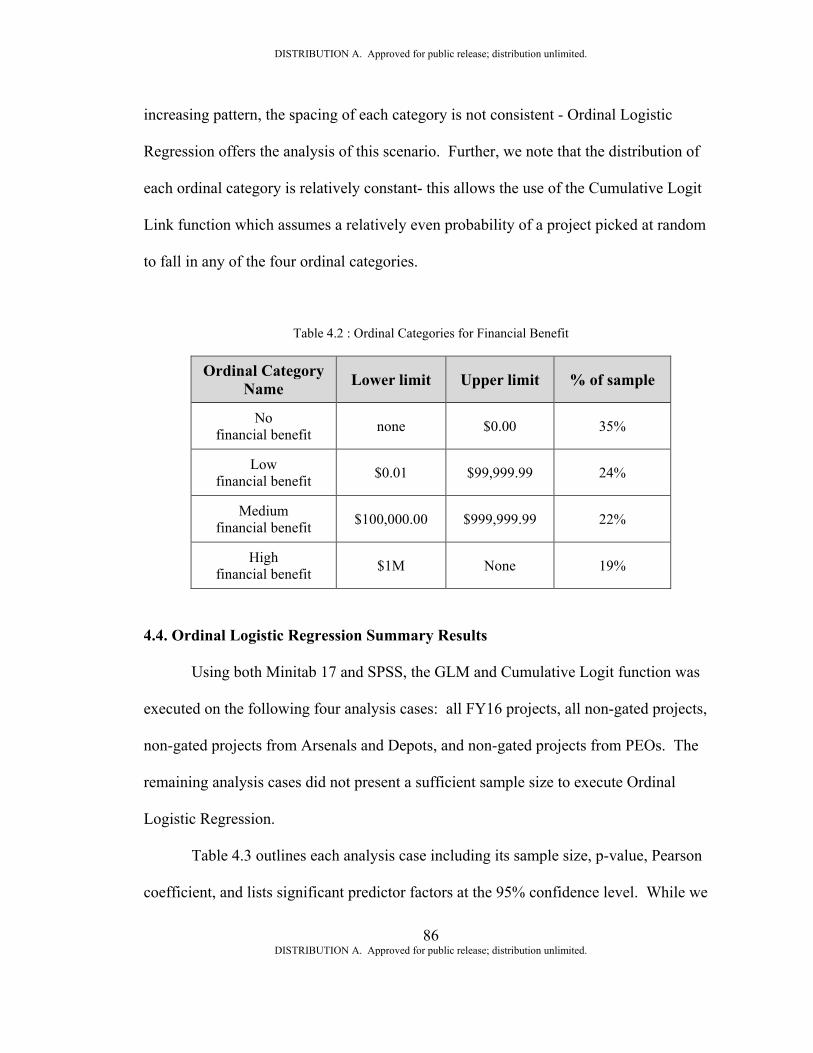
DISTRIBUTION A. Approved for public release; distribution unlimited.
86 DISTRIBUTION A. Approved for public release; distribution unlimited.
increasing pattern, the spacing of each category is not consistent - Ordinal Logistic
Regression offers the analysis of this scenario. Further, we note that the distribution of
each ordinal category is relatively constant- this allows the use of the Cumulative Logit
Link function which assumes a relatively even probability of a project picked at random
to fall in any of the four ordinal categories.
Table 4.2 : Ordinal Categories for Financial Benefit
Ordinal Category Name Lower limit Upper limit % of sample
No financial benefit none $0.00 35%
Low financial benefit $0.01 $99,999.99 24%
Medium financial benefit $100,000.00 $999,999.99 22%
High financial benefit $1M None 19%
4.4. Ordinal Logistic Regression Summary Results
Using both Minitab 17 and SPSS, the GLM and Cumulative Logit function was
executed on the following four analysis cases: all FY16 projects, all non-gated projects,
non-gated projects from Arsenals and Depots, and non-gated projects from PEOs. The
remaining analysis cases did not present a sufficient sample size to execute Ordinal
Logistic Regression.
Table 4.3 outlines each analysis case including its sample size, p-value, Pearson
coefficient, and lists significant predictor factors at the 95% confidence level. While we
DISTRIBUTION A. Approved for public release; distribution unlimited.
87 DISTRIBUTION A. Approved for public release; distribution unlimited.
stated the overarching hypothesis statements for this research in the opening chapters, it
is now appropriate to state the specific null and alternate hypothesis statements for this
particular tests. The generalized null hypothesis for this analysis can be described as
follows:
H0: There is no relationship between a unit increase in a given predictor variable
and the probability of the corresponding output variable achieving its highest ordinal
category.
Ha: There is a relationship between a unit increase in a given predictor variable
and the probability of the corresponding output variable achieving its highest ordinal
category.
Further, a Person chi-square test is executed to judge whether a particular model
fit is adequate. While we are looking for p values less than .05 (at 95% confidence), we
are looking for chi-square values whose values exceed .05 in order to proceed in
examining specific significant factors. Recall that each predictor variable emanated from
the literature review, and was surveyed for each represented project. The ordinal
category of each project was assigned after pulling the financial benefit of each from
PowerSteering. As seen in the P-value column, two of the analysis were statistically
significant: the All FY16 study and the non-gated Arsenal and Depot study. A detailed
analysis of the first analysis case, “All FY16,” is presented in the following section.
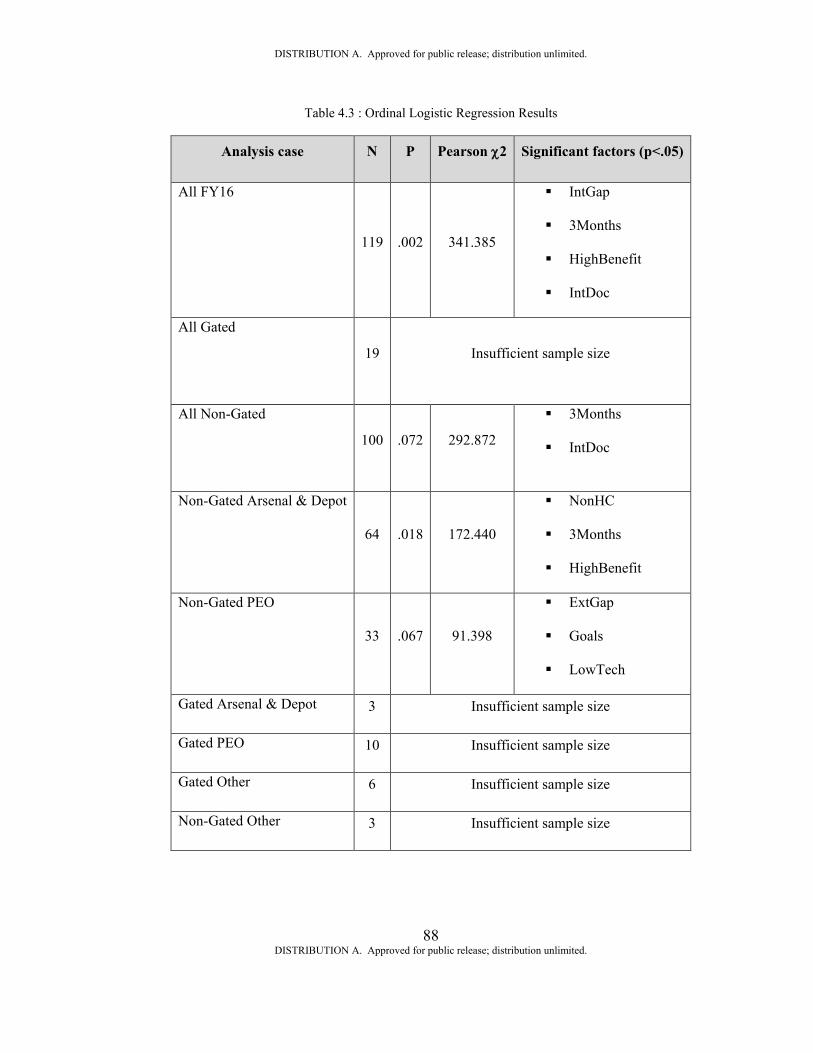
DISTRIBUTION A. Approved for public release; distribution unlimited.
88 DISTRIBUTION A. Approved for public release; distribution unlimited.
Table 4.3 : Ordinal Logistic Regression Results
Analysis case N P Pearson χ2 Significant factors (p<.05)
All FY16
119 .002 341.385
IntGap
3Months
HighBenefit
IntDoc
All Gated
19 Insufficient sample size
All Non-Gated
100 .072 292.872
3Months
IntDoc
Non-Gated Arsenal & Depot
64 .018 172.440
NonHC
3Months
HighBenefit
Non-Gated PEO
33 .067 91.398
ExtGap
Goals
LowTech
Gated Arsenal & Depot 3 Insufficient sample size
Gated PEO 10 Insufficient sample size
Gated Other 6 Insufficient sample size
Non-Gated Other 3 Insufficient sample size
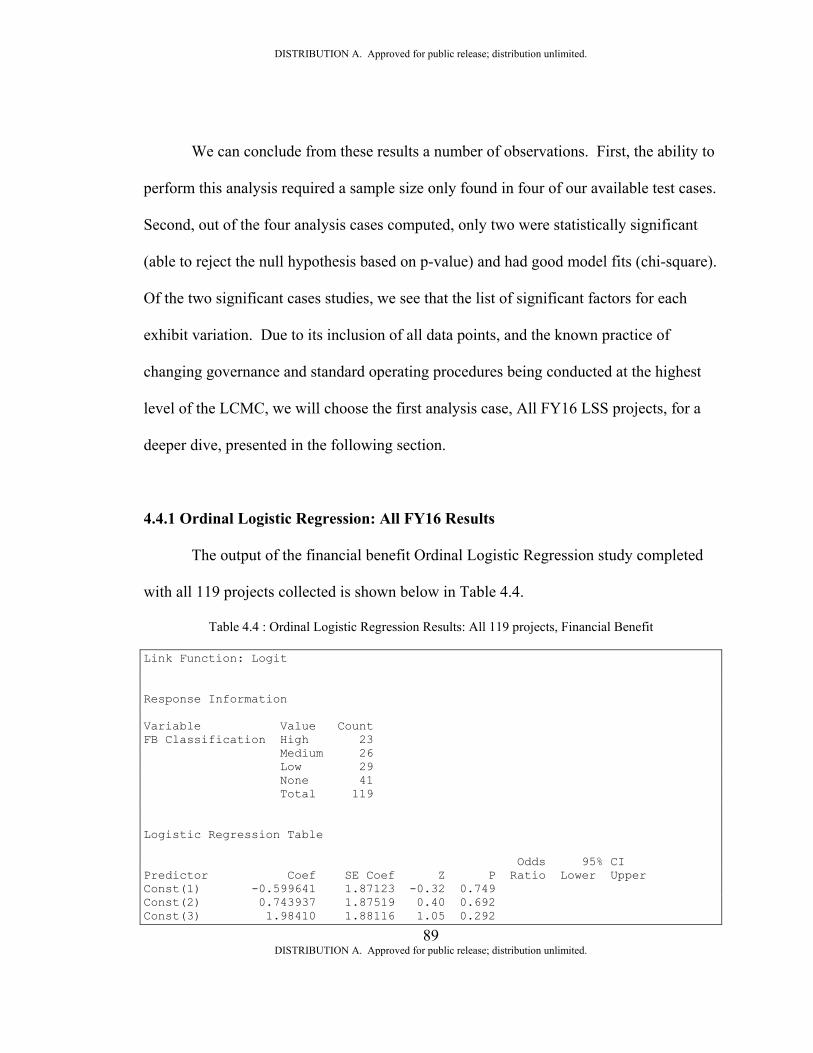
DISTRIBUTION A. Approved for public release; distribution unlimited.
89 DISTRIBUTION A. Approved for public release; distribution unlimited.
We can conclude from these results a number of observations. First, the ability to
perform this analysis required a sample size only found in four of our available test cases.
Second, out of the four analysis cases computed, only two were statistically significant
(able to reject the null hypothesis based on p-value) and had good model fits (chi-square).
Of the two significant cases studies, we see that the list of significant factors for each
exhibit variation. Due to its inclusion of all data points, and the known practice of
changing governance and standard operating procedures being conducted at the highest
level of the LCMC, we will choose the first analysis case, All FY16 LSS projects, for a
deeper dive, presented in the following section.
4.4.1 Ordinal Logistic Regression: All FY16 Results
The output of the financial benefit Ordinal Logistic Regression study completed
with all 119 projects collected is shown below in Table 4.4.
Table 4.4 : Ordinal Logistic Regression Results: All 119 projects, Financial Benefit
Link Function: Logit Response Information Variable Value Count FB Classification High 23 Medium 26 Low 29 None 41 Total 119 Logistic Regression Table Odds 95% CI Predictor Coef SE Coef Z P Ratio Lower Upper Const(1) -0.599641 1.87123 -0.32 0.749 Const(2) 0.743937 1.87519 0.40 0.692 Const(3) 1.98410 1.88116 1.05 0.292
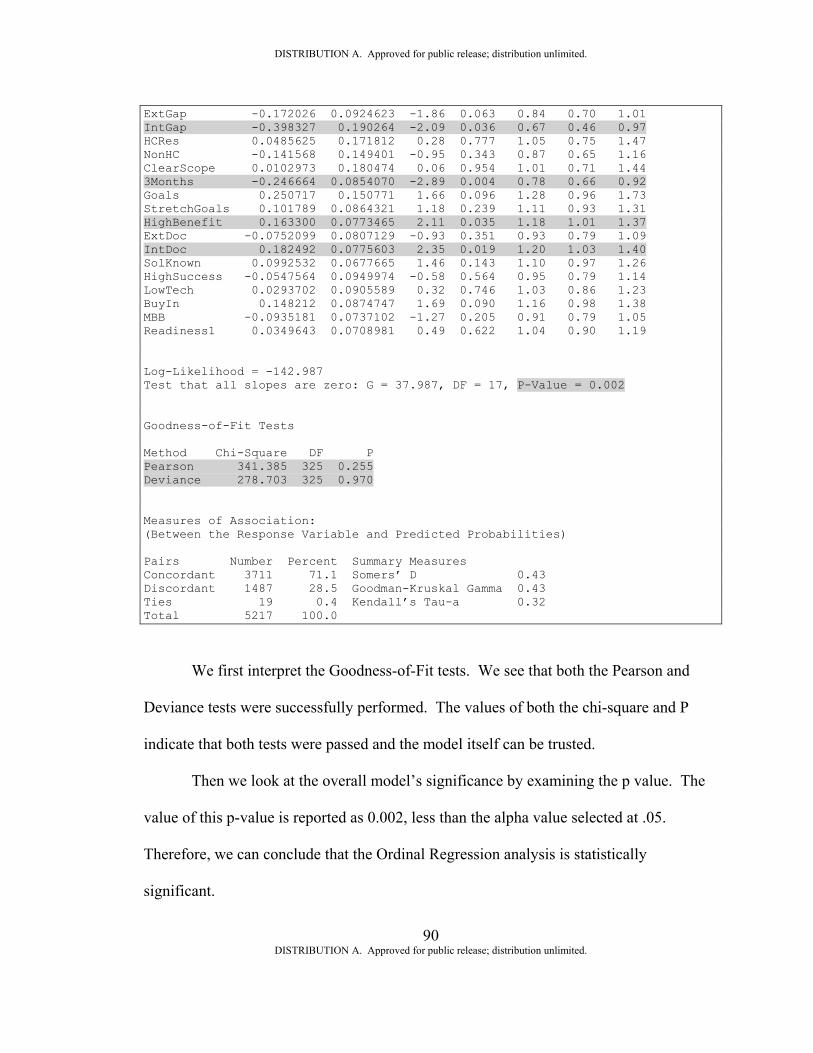
DISTRIBUTION A. Approved for public release; distribution unlimited.
90 DISTRIBUTION A. Approved for public release; distribution unlimited.
ExtGap -0.172026 0.0924623 -1.86 0.063 0.84 0.70 1.01 IntGap -0.398327 0.190264 -2.09 0.036 0.67 0.46 0.97 HCRes 0.0485625 0.171812 0.28 0.777 1.05 0.75 1.47 NonHC -0.141568 0.149401 -0.95 0.343 0.87 0.65 1.16 ClearScope 0.0102973 0.180474 0.06 0.954 1.01 0.71 1.44 3Months -0.246664 0.0854070 -2.89 0.004 0.78 0.66 0.92 Goals 0.250717 0.150771 1.66 0.096 1.28 0.96 1.73 StretchGoals 0.101789 0.0864321 1.18 0.239 1.11 0.93 1.31 HighBenefit 0.163300 0.0773465 2.11 0.035 1.18 1.01 1.37 ExtDoc -0.0752099 0.0807129 -0.93 0.351 0.93 0.79 1.09 IntDoc 0.182492 0.0775603 2.35 0.019 1.20 1.03 1.40 SolKnown 0.0992532 0.0677665 1.46 0.143 1.10 0.97 1.26 HighSuccess -0.0547564 0.0949974 -0.58 0.564 0.95 0.79 1.14 LowTech 0.0293702 0.0905589 0.32 0.746 1.03 0.86 1.23 BuyIn 0.148212 0.0874747 1.69 0.090 1.16 0.98 1.38 MBB -0.0935181 0.0737102 -1.27 0.205 0.91 0.79 1.05 Readiness1 0.0349643 0.0708981 0.49 0.622 1.04 0.90 1.19 Log-Likelihood = -142.987 Test that all slopes are zero: G = 37.987, DF = 17, P-Value = 0.002 Goodness-of-Fit Tests Method Chi-Square DF P Pearson 341.385 325 0.255 Deviance 278.703 325 0.970 Measures of Association: (Between the Response Variable and Predicted Probabilities) Pairs Number Percent Summary Measures Concordant 3711 71.1 Somers’ D 0.43 Discordant 1487 28.5 Goodman-Kruskal Gamma 0.43 Ties 19 0.4 Kendall’s Tau-a 0.32 Total 5217 100.0
We first interpret the Goodness-of-Fit tests. We see that both the Pearson and
Deviance tests were successfully performed. The values of both the chi-square and P
indicate that both tests were passed and the model itself can be trusted.
Then we look at the overall model’s significance by examining the p value. The
value of this p-value is reported as 0.002, less than the alpha value selected at .05.
Therefore, we can conclude that the Ordinal Regression analysis is statistically
significant.
DISTRIBUTION A. Approved for public release; distribution unlimited.
91 DISTRIBUTION A. Approved for public release; distribution unlimited.
Next we examine each predictor variables’ p value. Any variable p-value less
than alpha is interpreted as statistically significant. For this test, the following predictor
variables were found to be statistically significant: Internal Gap, 3 Months, High Benefit,
and Internal Documentation.
At this point, we have not made any claim to which, if any, of the significant
predictors have a positive or negative impact on the output. We can now determine the
effect of each predictor variable, which is to answer the question what is the effect of an
increase in a unit to the output’s probability of achieving its highest ordinal category.
This analysis is completed by examining the odds ratio of each predictor variable, paying
particular attention to statistically significant variables. For example, the odds ratio of
the statistically significant predictor variable “High Benefit” has a point estimate of 1.18,
and a 95% confidence interval of 1.01 to 1.37. Notice that the odds ratio does not contain
the value 1.0, whereas each non-significant predictor does. The interpretation of this
result is as follows: any single unit increase in the predictor rating of High Benefit will
increase the probability the rated project achieving the highest level of financial benefit
($1M or more) between 1% and 37%.
Conversely, if we examine a predictor variable which has been determined to be
statistically significant, and has a odds ratio interval less than 1.0, we find that single unit
increases decrease the probability of the highest financial benefit output. For example,
the predictor variable “Internal Gap,” which has an odds ratio interval from 0.67 to 0.97.
For every one unit increase in Internal Gap rating, we expect the probability of achieving
the highest level of financial benefit to decrease between 3% and 33%.
DISTRIBUTION A. Approved for public release; distribution unlimited.
92 DISTRIBUTION A. Approved for public release; distribution unlimited.
Similarly, we can examine the variable of 3 Months. It is determined that the
predictor is statistically significant due to its p-value of .004. We can then look at the
odds ratio which is stated as a point estimate of .78 – an increase in the prediction of a
project taking three months or less results in a 22% decrease in odds of having the highest
ordinal category output. The 95% confidence interval for this odds ratio is bound by .66
and .92. We can confirm this negative effect by examining the coefficient which is
reported as -.246.
Due to the large number of predictor variable studied in this Praxis, it is useful to
plot each’s odds ratio for comparison. In Figure 4.2 we have plotted all predictor
variables, including those not statistically significant, in a spider chart. This chart
includes a “-“ indicating a lower confidence interval, a “+” indicating an upper
confidence interval, and a black diamond indicating the point estimate for each
predictor’s odds ratio. The continuous dashed line represents the value 1.0. Any
confidence interval that contains 1.0, or crosses the dashed line, is insignificant, and any
confidence interval wholly on one side of 1.0 indicates a positive or negative relationship
between predictor and output ordinal category.
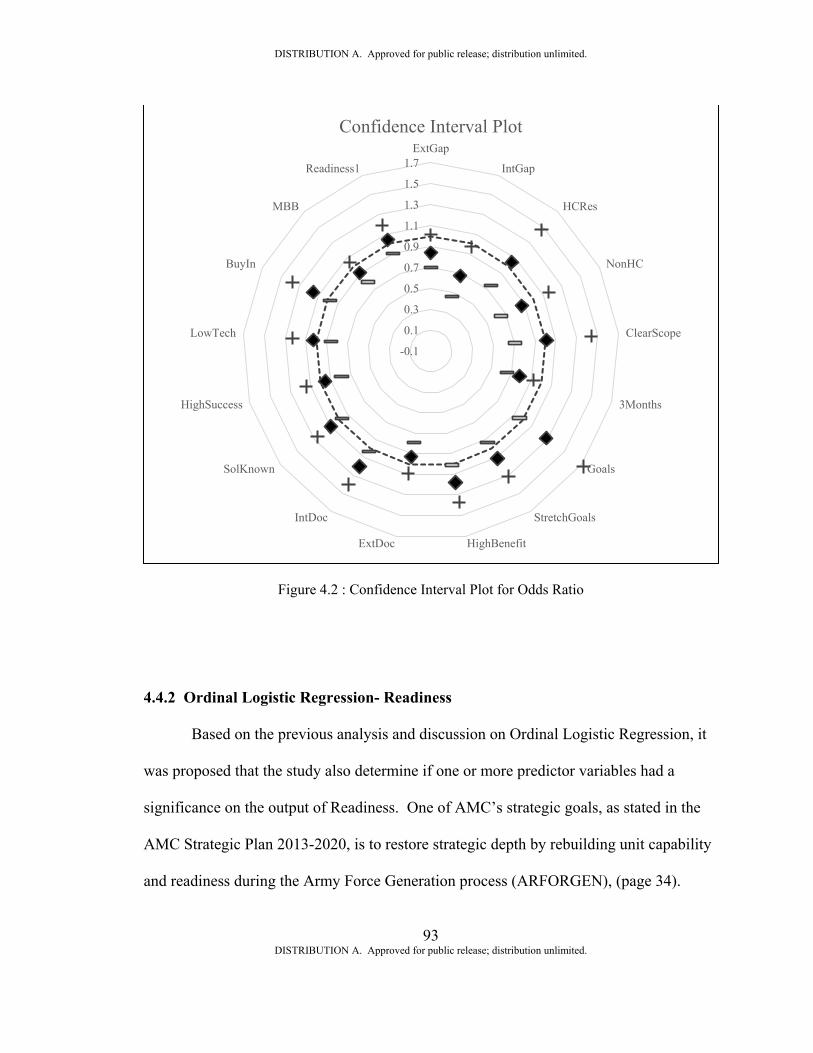
DISTRIBUTION A. Approved for public release; distribution unlimited.
93 DISTRIBUTION A. Approved for public release; distribution unlimited.
Figure 4.2 : Confidence Interval Plot for Odds Ratio
4.4.2 Ordinal Logistic Regression- Readiness
Based on the previous analysis and discussion on Ordinal Logistic Regression, it
was proposed that the study also determine if one or more predictor variables had a
significance on the output of Readiness. One of AMC’s strategic goals, as stated in the
AMC Strategic Plan 2013-2020, is to restore strategic depth by rebuilding unit capability
and readiness during the Army Force Generation process (ARFORGEN), (page 34).
-0.1
0.1
0.3
0.5
0.7
0.9
1.1
1.3
1.5
1.7ExtGap
IntGap
HCRes
NonHC
ClearScope
3Months
Goals
StretchGoals
HighBenefitExtDoc
IntDoc
SolKnown
HighSuccess
LowTech
BuyIn
MBB
Readiness1
Confidence Interval Plot
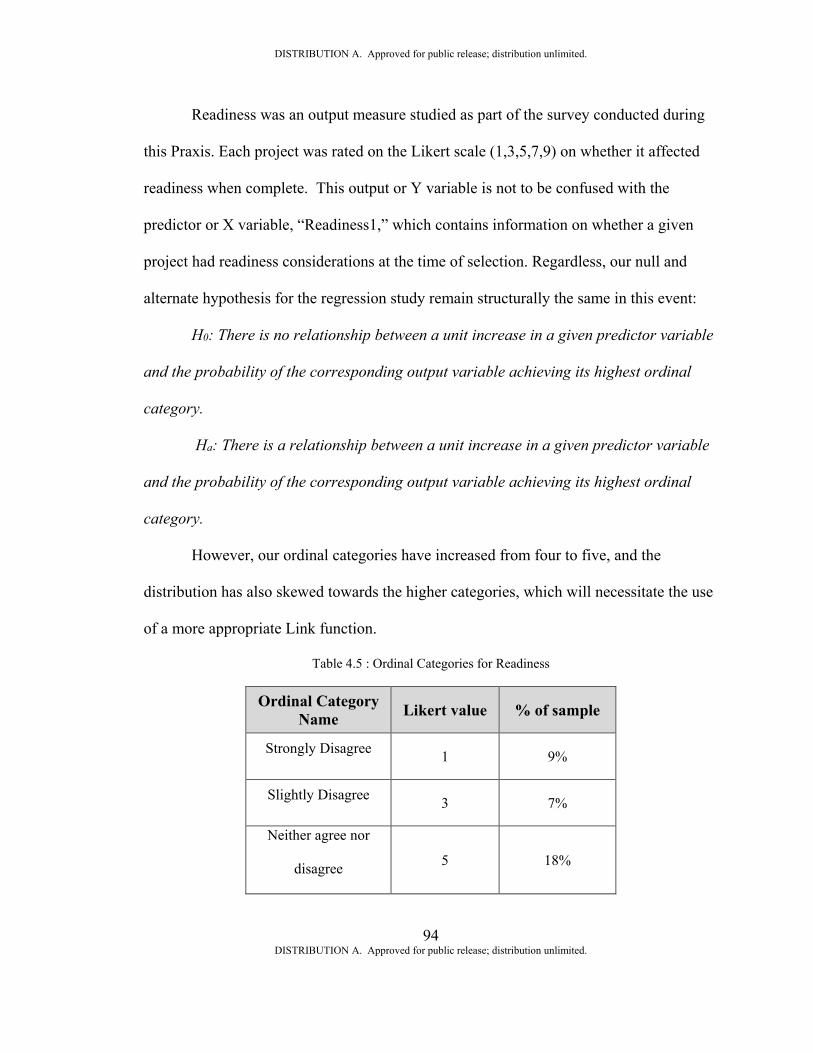
DISTRIBUTION A. Approved for public release; distribution unlimited.
94 DISTRIBUTION A. Approved for public release; distribution unlimited.
Readiness was an output measure studied as part of the survey conducted during
this Praxis. Each project was rated on the Likert scale (1,3,5,7,9) on whether it affected
readiness when complete. This output or Y variable is not to be confused with the
predictor or X variable, “Readiness1,” which contains information on whether a given
project had readiness considerations at the time of selection. Regardless, our null and
alternate hypothesis for the regression study remain structurally the same in this event:
H0: There is no relationship between a unit increase in a given predictor variable
and the probability of the corresponding output variable achieving its highest ordinal
category.
Ha: There is a relationship between a unit increase in a given predictor variable
and the probability of the corresponding output variable achieving its highest ordinal
category.
However, our ordinal categories have increased from four to five, and the
distribution has also skewed towards the higher categories, which will necessitate the use
of a more appropriate Link function.
Table 4.5 : Ordinal Categories for Readiness
Ordinal Category Name Likert value % of sample
Strongly Disagree 1 9%
Slightly Disagree 3 7%
Neither agree nor
disagree 5 18%
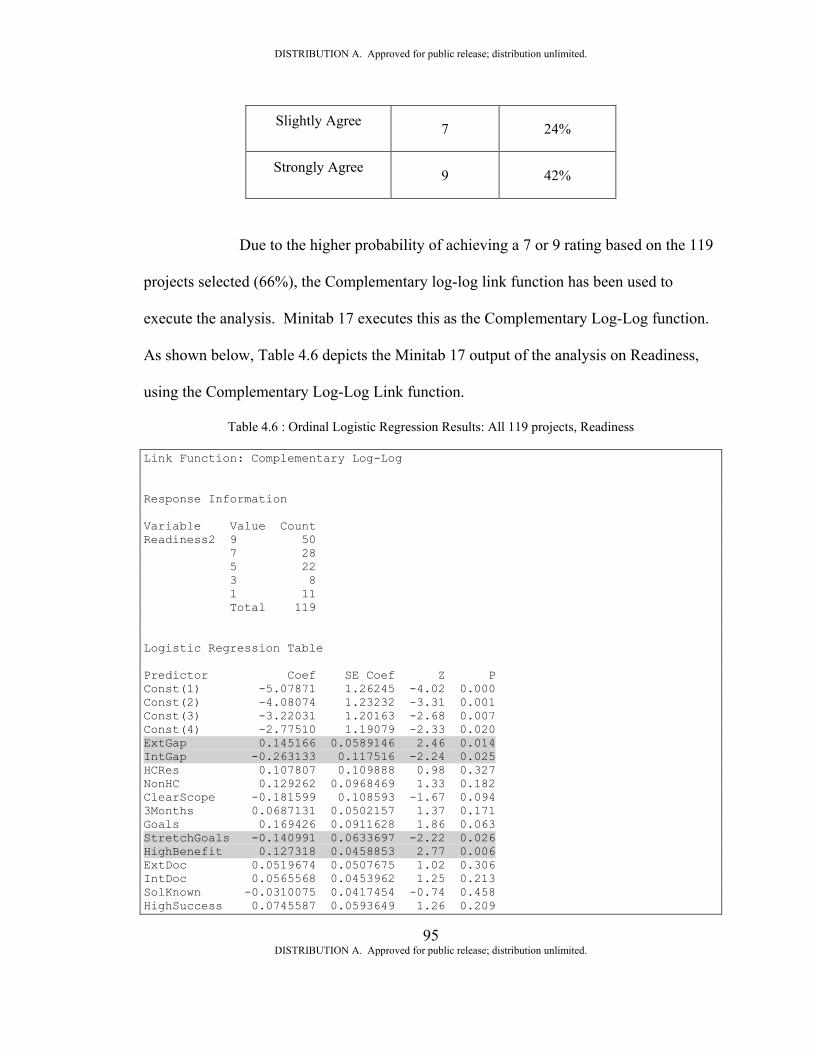
DISTRIBUTION A. Approved for public release; distribution unlimited.
95 DISTRIBUTION A. Approved for public release; distribution unlimited.
Slightly Agree 7 24%
Strongly Agree 9 42%
Due to the higher probability of achieving a 7 or 9 rating based on the 119
projects selected (66%), the Complementary log-log link function has been used to
execute the analysis. Minitab 17 executes this as the Complementary Log-Log function.
As shown below, Table 4.6 depicts the Minitab 17 output of the analysis on Readiness,
using the Complementary Log-Log Link function.
Table 4.6 : Ordinal Logistic Regression Results: All 119 projects, Readiness
Link Function: Complementary Log-Log Response Information Variable Value Count Readiness2 9 50 7 28 5 22 3 8 1 11 Total 119 Logistic Regression Table Predictor Coef SE Coef Z P Const(1) -5.07871 1.26245 -4.02 0.000 Const(2) -4.08074 1.23232 -3.31 0.001 Const(3) -3.22031 1.20163 -2.68 0.007 Const(4) -2.77510 1.19079 -2.33 0.020 ExtGap 0.145166 0.0589146 2.46 0.014 IntGap -0.263133 0.117516 -2.24 0.025 HCRes 0.107807 0.109888 0.98 0.327 NonHC 0.129262 0.0968469 1.33 0.182 ClearScope -0.181599 0.108593 -1.67 0.094 3Months 0.0687131 0.0502157 1.37 0.171 Goals 0.169426 0.0911628 1.86 0.063 StretchGoals -0.140991 0.0633697 -2.22 0.026 HighBenefit 0.127318 0.0458853 2.77 0.006 ExtDoc 0.0519674 0.0507675 1.02 0.306 IntDoc 0.0565568 0.0453962 1.25 0.213 SolKnown -0.0310075 0.0417454 -0.74 0.458 HighSuccess 0.0745587 0.0593649 1.26 0.209
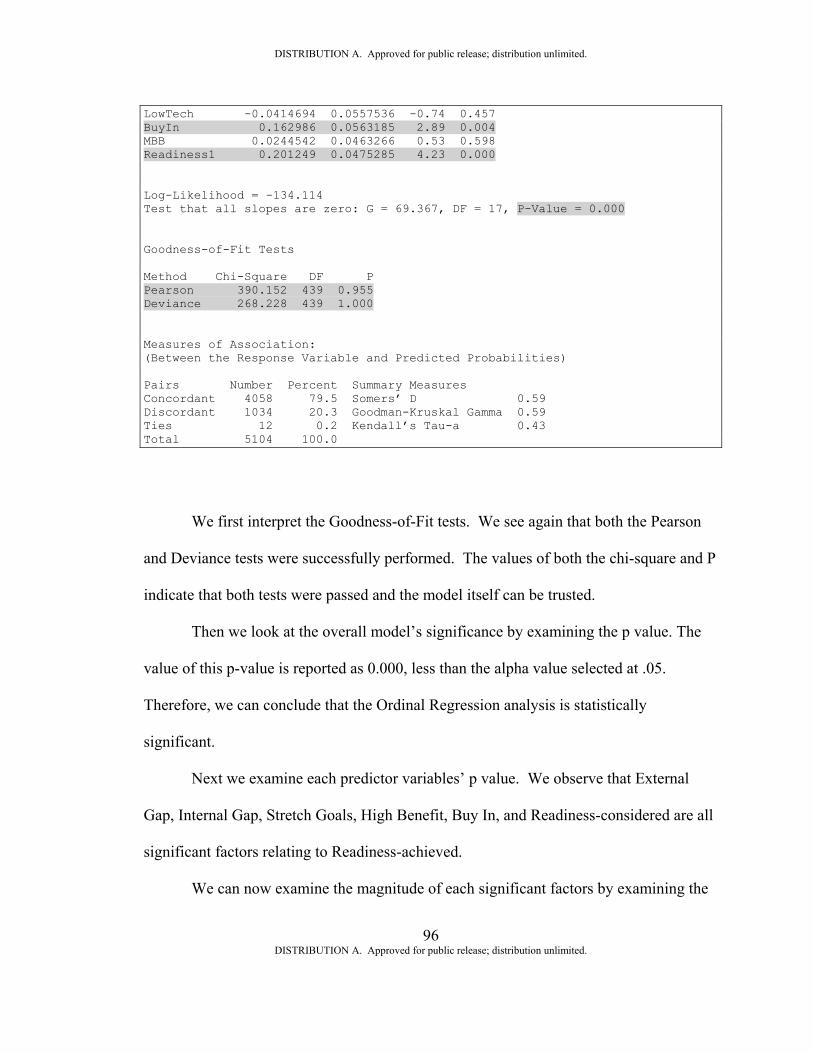
DISTRIBUTION A. Approved for public release; distribution unlimited.
96 DISTRIBUTION A. Approved for public release; distribution unlimited.
LowTech -0.0414694 0.0557536 -0.74 0.457 BuyIn 0.162986 0.0563185 2.89 0.004 MBB 0.0244542 0.0463266 0.53 0.598 Readiness1 0.201249 0.0475285 4.23 0.000 Log-Likelihood = -134.114 Test that all slopes are zero: G = 69.367, DF = 17, P-Value = 0.000 Goodness-of-Fit Tests Method Chi-Square DF P Pearson 390.152 439 0.955 Deviance 268.228 439 1.000 Measures of Association: (Between the Response Variable and Predicted Probabilities) Pairs Number Percent Summary Measures Concordant 4058 79.5 Somers’ D 0.59 Discordant 1034 20.3 Goodman-Kruskal Gamma 0.59 Ties 12 0.2 Kendall’s Tau-a 0.43 Total 5104 100.0
We first interpret the Goodness-of-Fit tests. We see again that both the Pearson
and Deviance tests were successfully performed. The values of both the chi-square and P
indicate that both tests were passed and the model itself can be trusted.
Then we look at the overall model’s significance by examining the p value. The
value of this p-value is reported as 0.000, less than the alpha value selected at .05.
Therefore, we can conclude that the Ordinal Regression analysis is statistically
significant.
Next we examine each predictor variables’ p value. We observe that External
Gap, Internal Gap, Stretch Goals, High Benefit, Buy In, and Readiness-considered are all
significant factors relating to Readiness-achieved.
We can now examine the magnitude of each significant factors by examining the
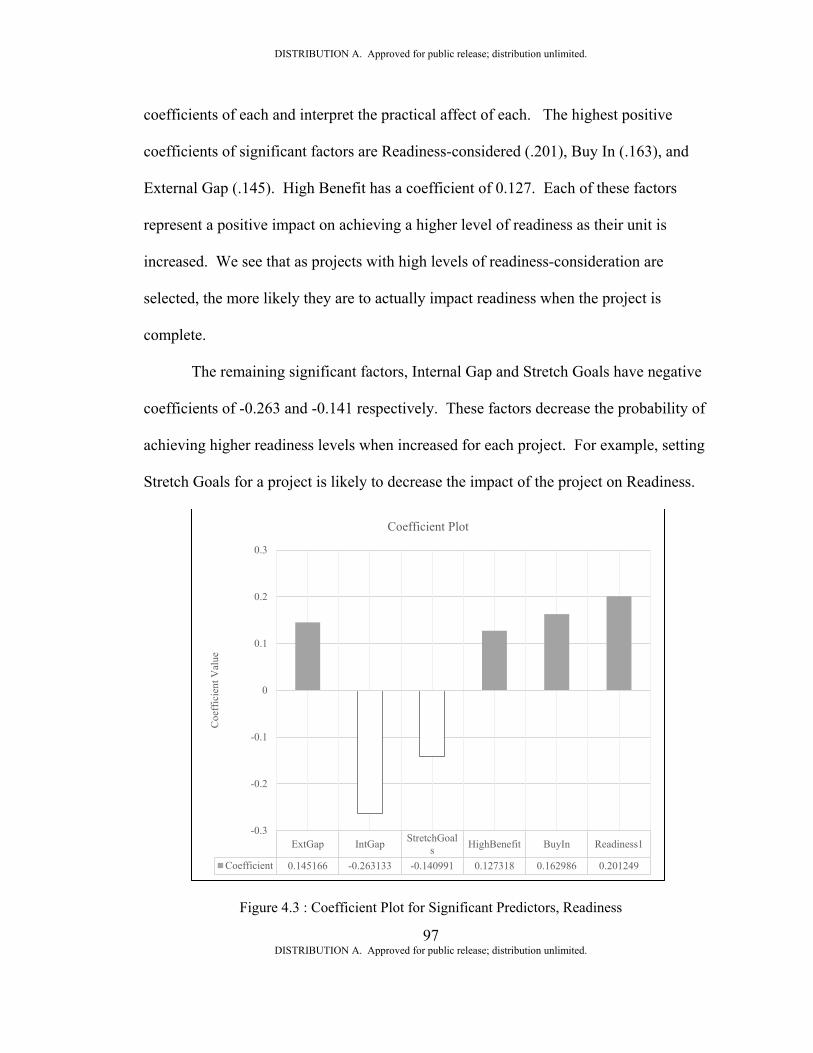
DISTRIBUTION A. Approved for public release; distribution unlimited.
97 DISTRIBUTION A. Approved for public release; distribution unlimited.
coefficients of each and interpret the practical affect of each. The highest positive
coefficients of significant factors are Readiness-considered (.201), Buy In (.163), and
External Gap (.145). High Benefit has a coefficient of 0.127. Each of these factors
represent a positive impact on achieving a higher level of readiness as their unit is
increased. We see that as projects with high levels of readiness-consideration are
selected, the more likely they are to actually impact readiness when the project is
complete.
The remaining significant factors, Internal Gap and Stretch Goals have negative
coefficients of -0.263 and -0.141 respectively. These factors decrease the probability of
achieving higher readiness levels when increased for each project. For example, setting
Stretch Goals for a project is likely to decrease the impact of the project on Readiness.
Figure 4.3 : Coefficient Plot for Significant Predictors, Readiness
ExtGap IntGap StretchGoals HighBenefit BuyIn Readiness1
Coefficient 0.145166 -0.263133 -0.140991 0.127318 0.162986 0.201249
-0.3
-0.2
-0.1
0
0.1
0.2
0.3
Coe
ffic
ient
Val
ue
Coefficient Plot
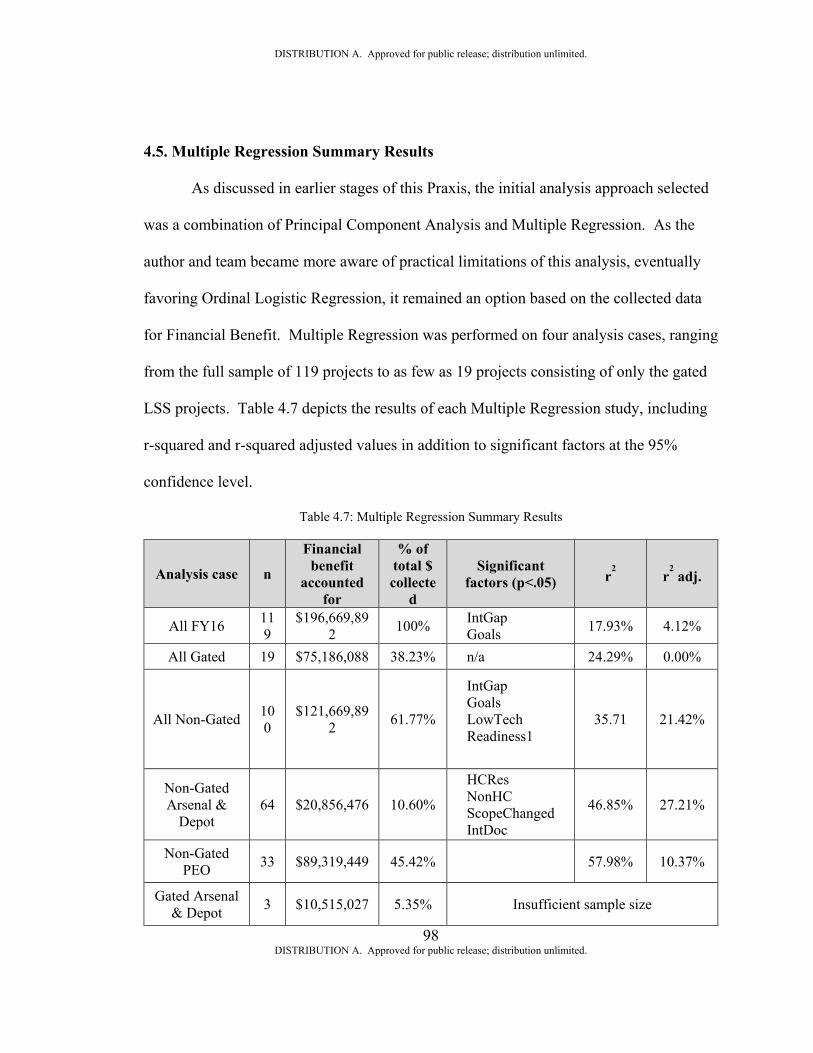
DISTRIBUTION A. Approved for public release; distribution unlimited.
98 DISTRIBUTION A. Approved for public release; distribution unlimited.
4.5. Multiple Regression Summary Results
As discussed in earlier stages of this Praxis, the initial analysis approach selected
was a combination of Principal Component Analysis and Multiple Regression. As the
author and team became more aware of practical limitations of this analysis, eventually
favoring Ordinal Logistic Regression, it remained an option based on the collected data
for Financial Benefit. Multiple Regression was performed on four analysis cases, ranging
from the full sample of 119 projects to as few as 19 projects consisting of only the gated
LSS projects. Table 4.7 depicts the results of each Multiple Regression study, including
r-squared and r-squared adjusted values in addition to significant factors at the 95%
confidence level.
Table 4.7: Multiple Regression Summary Results
Analysis case n
Financial benefit
accounted for
% of total $ collecte
d
Significant factors (p<.05) r
2 r
2 adj.
All FY16 119
$196,669,892 100% IntGap
Goals 17.93% 4.12%
All Gated 19 $75,186,088 38.23% n/a 24.29% 0.00%
All Non-Gated 100
$121,669,892 61.77%
IntGap Goals LowTech Readiness1
35.71 21.42%
Non-Gated Arsenal &
Depot 64 $20,856,476 10.60%
HCRes NonHC ScopeChanged IntDoc
46.85% 27.21%
Non-Gated PEO 33 $89,319,449 45.42% 57.98% 10.37%
Gated Arsenal & Depot 3 $10,515,027 5.35% Insufficient sample size
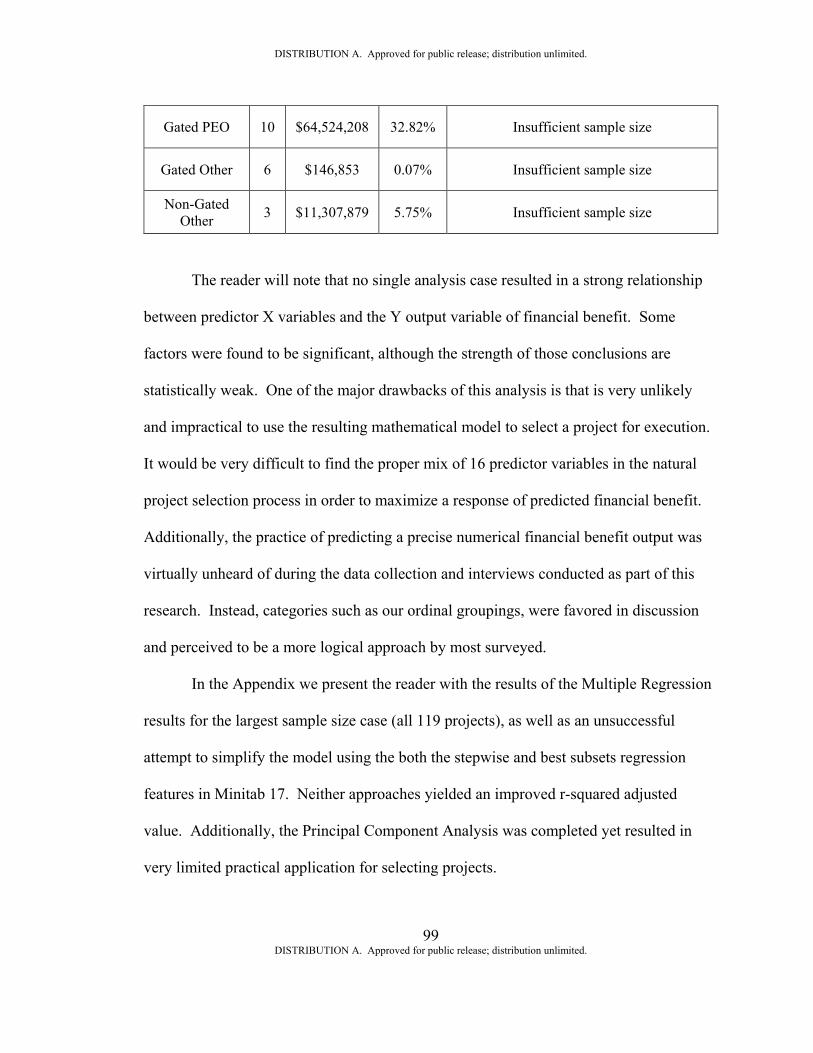
DISTRIBUTION A. Approved for public release; distribution unlimited.
99 DISTRIBUTION A. Approved for public release; distribution unlimited.
Gated PEO 10 $64,524,208 32.82% Insufficient sample size
Gated Other 6 $146,853 0.07% Insufficient sample size
Non-Gated Other 3 $11,307,879 5.75% Insufficient sample size
The reader will note that no single analysis case resulted in a strong relationship
between predictor X variables and the Y output variable of financial benefit. Some
factors were found to be significant, although the strength of those conclusions are
statistically weak. One of the major drawbacks of this analysis is that is very unlikely
and impractical to use the resulting mathematical model to select a project for execution.
It would be very difficult to find the proper mix of 16 predictor variables in the natural
project selection process in order to maximize a response of predicted financial benefit.
Additionally, the practice of predicting a precise numerical financial benefit output was
virtually unheard of during the data collection and interviews conducted as part of this
research. Instead, categories such as our ordinal groupings, were favored in discussion
and perceived to be a more logical approach by most surveyed.
In the Appendix we present the reader with the results of the Multiple Regression
results for the largest sample size case (all 119 projects), as well as an unsuccessful
attempt to simplify the model using the both the stepwise and best subsets regression
features in Minitab 17. Neither approaches yielded an improved r-squared adjusted
value. Additionally, the Principal Component Analysis was completed yet resulted in
very limited practical application for selecting projects.
DISTRIBUTION A. Approved for public release; distribution unlimited.
100 DISTRIBUTION A. Approved for public release; distribution unlimited.
CHAPTER 5
DISCUSSION & SUMMARY
This praxis’ findings and processes is useful in many ways, including individual
and organizational awareness gained by posing of the most basic question, “How do we
select LSS projects?” Answering this question retrospectively has granted us the ability
to complete the analysis outlined in this praxis and better select future projects, ultimately
impacting the Warfighter and taxpayer while increasing local command return on
investment. While a predictive model was desired, no statistically significant model
could be established based on this data set. However, a number of optimal project
selection conditions were discovered. The most immediate use may be implementing
updated LSS project selection criteria and practices locally based on the findings. These
results may provide input to policy and procedures for selecting LSS projects at the
TACOM LCMC level, to include PEOs, Depots, and Arsenals.
The initial plan for this analysis was to run a series of Multiple Regression
analyses to create a predictive model for selecting projects in the future with the highest
predicted financial benefits. Through this process we learned that Ordinal Logistic
Regression was the preferred methodology to retrospectively analyze our FY16 projects
based on predictive qualities, then relate them to the probability of achieving the highest
output, whether it be financial benefit or another variable such as Readiness.
The specific process generated by this Praxis can be used by any organization
DISTRIBUTION A. Approved for public release; distribution unlimited.
101 DISTRIBUTION A. Approved for public release; distribution unlimited.
which has a goal of driving towards the highest level of financial benefit. It is the
recommendation of this Praxis to use the Ordinal Logistic Regression model to inform
and make recommendation to the project selection criteria used. The process, in
conjunction with organizational leaders, can be summarized as follows:
I. Determine predictor variables of interest
• 16 predictor variables determined in this study
• Add organization-specific variables (“Readiness”)
II. Determine Ordinal groups for output study
• Deployment Director and COO discussion
III. Collect data from project initiators
• Establish “point of selection” record keeping
IV. Conduct Ordinal Logistic Regression
• High level (all data points) analysis
• Lower levels (gated, non-gated, non-gated PEO, e.g.) as sample size
allows
V. Use significant results to inform and refine project selection criteria and
process (take action!)
• Between & Within groups
• (Model must be statistically significant)
VI. Repeat and refine process over time
This Praxis also provides a high-level process road map to follow for any
DISTRIBUTION A. Approved for public release; distribution unlimited.
102 DISTRIBUTION A. Approved for public release; distribution unlimited.
organization attempting to optimize the results of their CPI or LSS programs based on the
selection of projects. The high-level process itself is agnostic to the output and input
measures of interest, as well as the analysis type conducted. It may be such that other
organizations can readily use the Ordinal Logistic Regression outlined in this Praxis.
This high-level process is depicted in Figure 3.8.
We can break the process proposed by this praxis into two distinct timeframes:
the initial study, and the follow-on recurring study or studies. In this process, the CPI
team receives strategic guidance from the organization’s leadership on which output
measures are of most importance for optimizing. In our examples, we used both financial
benefit and readiness. Next, the CPI team develops, or leverages a survey to determine
how projects are currently being selected. Following the return of the survey data,
analysis is conducted and the leadership is informed of recommendations. Following the
initial study, it is our recommendation that the process be executed at a regular time
interval that makes most sense for the individual organization. At this point, the process
should mature to where the CPI team can install measurement tools such that LSS project
selectors and executors can document their selection criteria in real-time, eliminating the
need for retrospective analysis and surveys, as well as improving the measurement
system itself. This data would then be constantly updated into the model and leadership
would be informed and able to readily report CPI summary and project-specific input,
and output, measures.
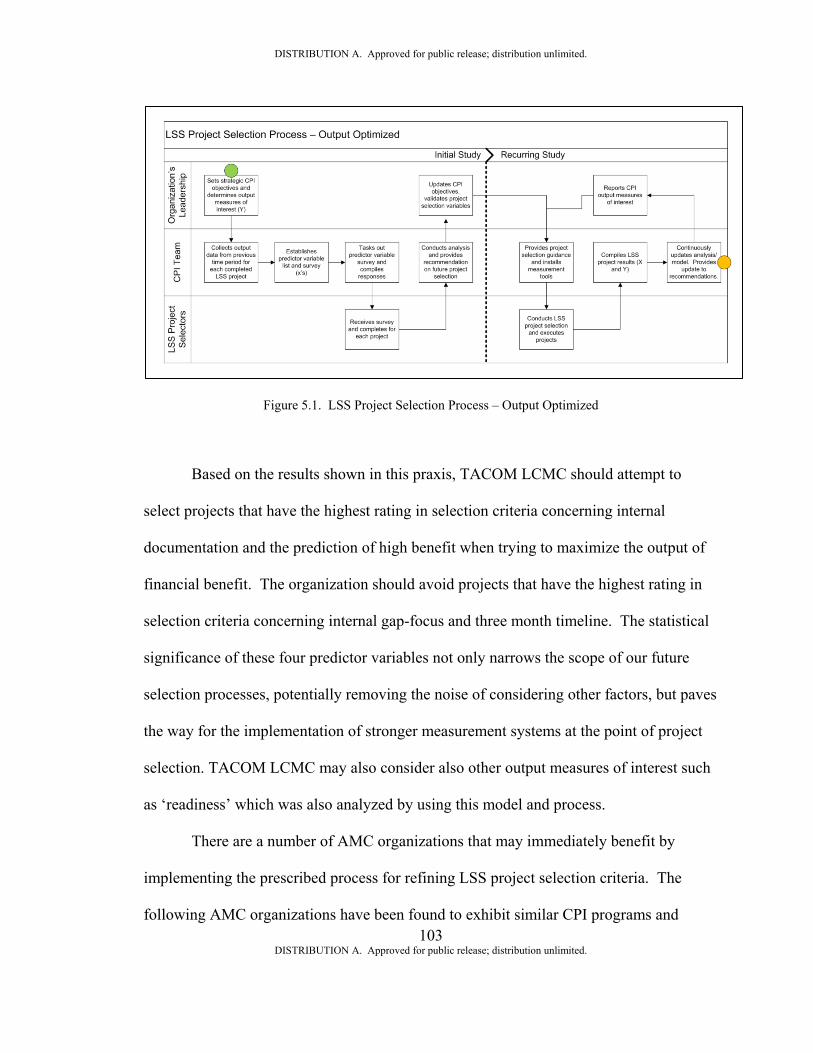
DISTRIBUTION A. Approved for public release; distribution unlimited.
103 DISTRIBUTION A. Approved for public release; distribution unlimited.
Figure 5.1. LSS Project Selection Process – Output Optimized
Based on the results shown in this praxis, TACOM LCMC should attempt to
select projects that have the highest rating in selection criteria concerning internal
documentation and the prediction of high benefit when trying to maximize the output of
financial benefit. The organization should avoid projects that have the highest rating in
selection criteria concerning internal gap-focus and three month timeline. The statistical
significance of these four predictor variables not only narrows the scope of our future
selection processes, potentially removing the noise of considering other factors, but paves
the way for the implementation of stronger measurement systems at the point of project
selection. TACOM LCMC may also consider also other output measures of interest such
as ‘readiness’ which was also analyzed by using this model and process.
There are a number of AMC organizations that may immediately benefit by
implementing the prescribed process for refining LSS project selection criteria. The
following AMC organizations have been found to exhibit similar CPI programs and
DISTRIBUTION A. Approved for public release; distribution unlimited.
104 DISTRIBUTION A. Approved for public release; distribution unlimited.
reporting structures up to HQAMC:
• Aviation Missile Life Cycle Management Command (AMCOM)
• Army Sustainment Command (ASC)
• Communications-Electronics Command Life Cycle Management
Command (CECOM)
• Joint Munitions & Lethality Life Cycle Management Command (JM&L)
• Military Surface Deployment and Distribution Command (SDDC)
While each of the above AMC organizations have clear differences in terms of
funding types, deliverables, and customers, the use of the prescribed process may not
only be used to draw inference to the similarities in how each selects LSS projects, but
also may hold the key for unlocking future improvement opportunities across the higher
command.
Shortly before the defense of this Praxis, AMC disseminated a new CPI scorecard
for immediate use by all major subordinate commands. This scorecard is to be used
throughout FY18, and provides leadership oversight of project portfolio performance
with respect to financial benefit goals, as well as mapping to other senior-leader output
measures such as supply availability, revenue, and materiel availability. A snapshot of
the FY18 scorecard is shown in Figure 3.8.
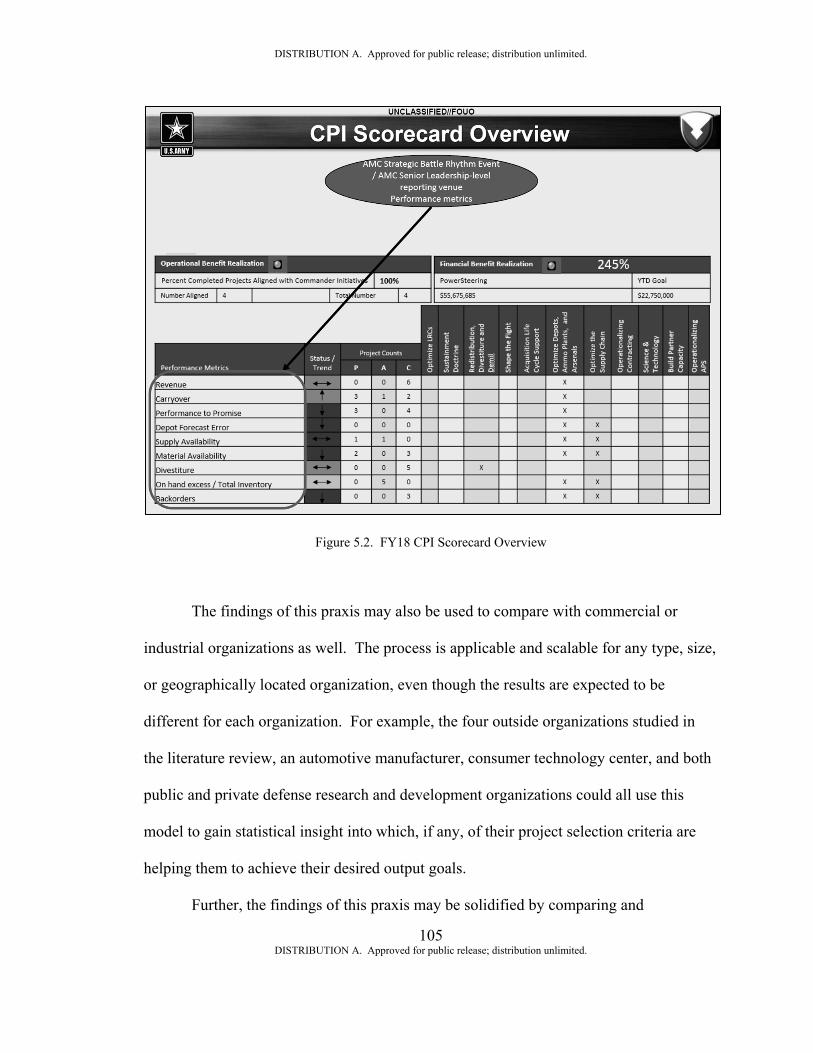
DISTRIBUTION A. Approved for public release; distribution unlimited.
105 DISTRIBUTION A. Approved for public release; distribution unlimited.
Figure 5.2. FY18 CPI Scorecard Overview
The findings of this praxis may also be used to compare with commercial or
industrial organizations as well. The process is applicable and scalable for any type, size,
or geographically located organization, even though the results are expected to be
different for each organization. For example, the four outside organizations studied in
the literature review, an automotive manufacturer, consumer technology center, and both
public and private defense research and development organizations could all use this
model to gain statistical insight into which, if any, of their project selection criteria are
helping them to achieve their desired output goals.
Further, the findings of this praxis may be solidified by comparing and
DISTRIBUTION A. Approved for public release; distribution unlimited.
106 DISTRIBUTION A. Approved for public release; distribution unlimited.
contrasting the results of analyzing TACOM LCMC FY17 LSS projects, which will be
available in Spring 2018. The model and process proposed in this praxis is hypothesized
to gain power statistically and strength in practical application as the sample size of
projects increases. Users of the model and process may find convergence on a number of
significant factors leading to higher ordinal output categories, or conversely, variation in
the model’s result over time (fiscal year to fiscal year, for example).
It may be prudent to factor in the organization’s cost of project execution when
selecting said projects. If an organization is continually selecting and executing projects
which have benefits that fall below the price of execution itself, the organization may
consider re-examining their selection process, a natural starting point for adopting and
executing the process outlined in this praxis.
The use of Process Capability to judge, retroactively, the performance of the
model for project selection is also proposed as an output of this praxis. Process
Capability is a statistical tool used in process improvement methodologies such as Lean
Six Sigma. It is a quantifiable comparison of allowed variation, which comes from the
Voice of the Customer, to the variation exhibited by the process or product itself. A
typical Process Capability study, which produces a unit-less measure
“Cp,” consists of interviewing or collecting the Voice of the Customer (expressed in
Upper and Lower Specification Limits) and analyzing the processes or product’s current
state variation.
Cp values can range from negative infinity to positive infinity. Cp values at or
above 1.33 to indicate a ‘capable’ process or product. Cp values below 1.33 are said to
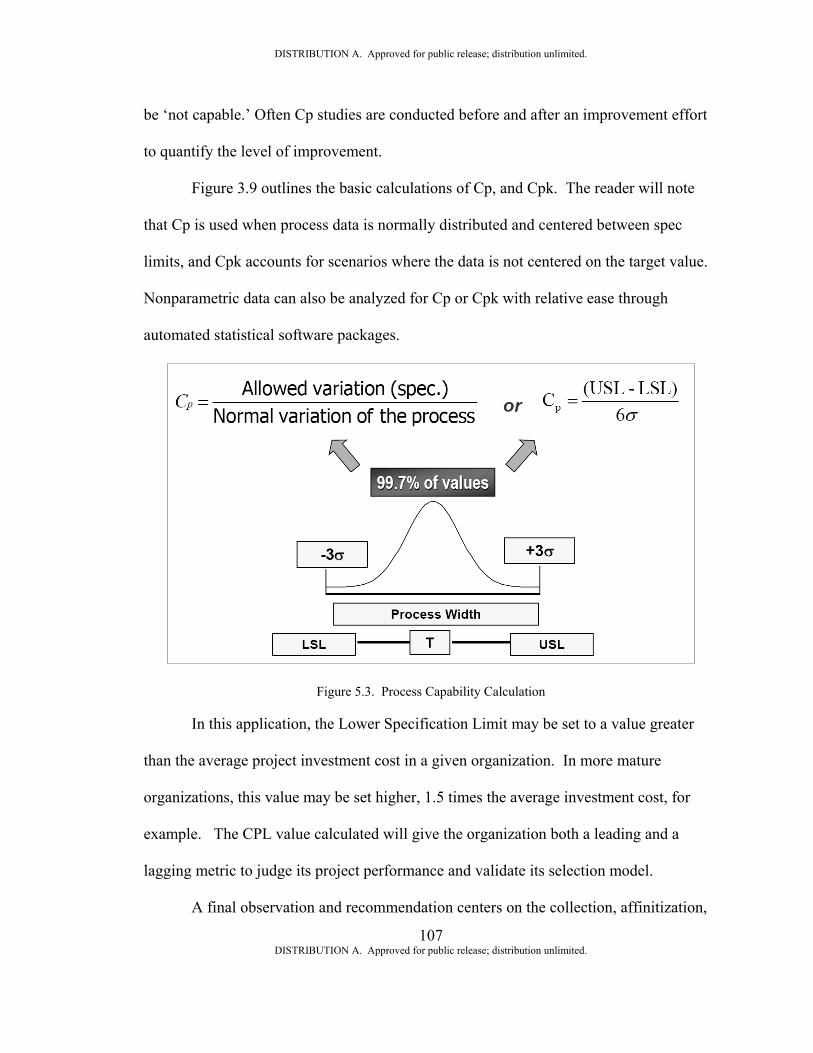
DISTRIBUTION A. Approved for public release; distribution unlimited.
107 DISTRIBUTION A. Approved for public release; distribution unlimited.
be ‘not capable.’ Often Cp studies are conducted before and after an improvement effort
to quantify the level of improvement.
Figure 3.9 outlines the basic calculations of Cp, and Cpk. The reader will note
that Cp is used when process data is normally distributed and centered between spec
limits, and Cpk accounts for scenarios where the data is not centered on the target value.
Nonparametric data can also be analyzed for Cp or Cpk with relative ease through
automated statistical software packages.
Figure 5.3. Process Capability Calculation
In this application, the Lower Specification Limit may be set to a value greater
than the average project investment cost in a given organization. In more mature
organizations, this value may be set higher, 1.5 times the average investment cost, for
example. The CPL value calculated will give the organization both a leading and a
lagging metric to judge its project performance and validate its selection model.
A final observation and recommendation centers on the collection, affinitization,
DISTRIBUTION A. Approved for public release; distribution unlimited.
108 DISTRIBUTION A. Approved for public release; distribution unlimited.
and cataloging of organization-specific predictor and output measures. An online
repository could be established such that organizations could define and share their
project selection criteria and output measures of success. For example, an Army
command may share its organization-specific predictor of “readiness,” while an
Automotive organization may share criteria related to supply chain delay, for example.
Additionally, organizations may share output measures of interest such as financial
benefit, process lead time reduction, risk reduction, readiness improvement, and other
quality improvement measures. This catalog would, over time, build the body of
knowledge on different selection criteria for LSS projects to be leveraged by all CPI and
LSS practitioners in an effort to advance the community.
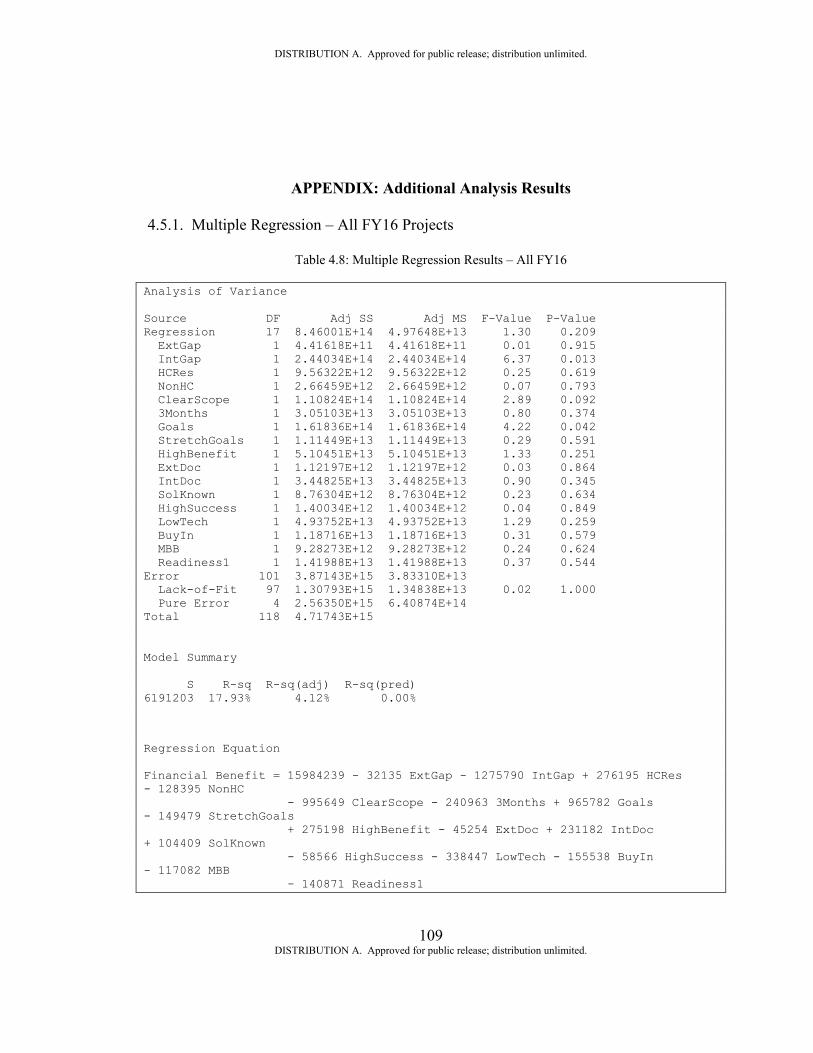
DISTRIBUTION A. Approved for public release; distribution unlimited.
109 DISTRIBUTION A. Approved for public release; distribution unlimited.
APPENDIX: Additional Analysis Results
4.5.1. Multiple Regression – All FY16 Projects
Table 4.8: Multiple Regression Results – All FY16
Analysis of Variance Source DF Adj SS Adj MS F-Value P-Value Regression 17 8.46001E+14 4.97648E+13 1.30 0.209 ExtGap 1 4.41618E+11 4.41618E+11 0.01 0.915 IntGap 1 2.44034E+14 2.44034E+14 6.37 0.013 HCRes 1 9.56322E+12 9.56322E+12 0.25 0.619 NonHC 1 2.66459E+12 2.66459E+12 0.07 0.793 ClearScope 1 1.10824E+14 1.10824E+14 2.89 0.092 3Months 1 3.05103E+13 3.05103E+13 0.80 0.374 Goals 1 1.61836E+14 1.61836E+14 4.22 0.042 StretchGoals 1 1.11449E+13 1.11449E+13 0.29 0.591 HighBenefit 1 5.10451E+13 5.10451E+13 1.33 0.251 ExtDoc 1 1.12197E+12 1.12197E+12 0.03 0.864 IntDoc 1 3.44825E+13 3.44825E+13 0.90 0.345 SolKnown 1 8.76304E+12 8.76304E+12 0.23 0.634 HighSuccess 1 1.40034E+12 1.40034E+12 0.04 0.849 LowTech 1 4.93752E+13 4.93752E+13 1.29 0.259 BuyIn 1 1.18716E+13 1.18716E+13 0.31 0.579 MBB 1 9.28273E+12 9.28273E+12 0.24 0.624 Readiness1 1 1.41988E+13 1.41988E+13 0.37 0.544 Error 101 3.87143E+15 3.83310E+13 Lack-of-Fit 97 1.30793E+15 1.34838E+13 0.02 1.000 Pure Error 4 2.56350E+15 6.40874E+14 Total 118 4.71743E+15 Model Summary S R-sq R-sq(adj) R-sq(pred) 6191203 17.93% 4.12% 0.00%
Regression Equation Financial Benefit = 15984239 - 32135 ExtGap - 1275790 IntGap + 276195 HCRes - 128395 NonHC - 995649 ClearScope - 240963 3Months + 965782 Goals - 149479 StretchGoals + 275198 HighBenefit - 45254 ExtDoc + 231182 IntDoc + 104409 SolKnown - 58566 HighSuccess - 338447 LowTech - 155538 BuyIn - 117082 MBB - 140871 Readiness1
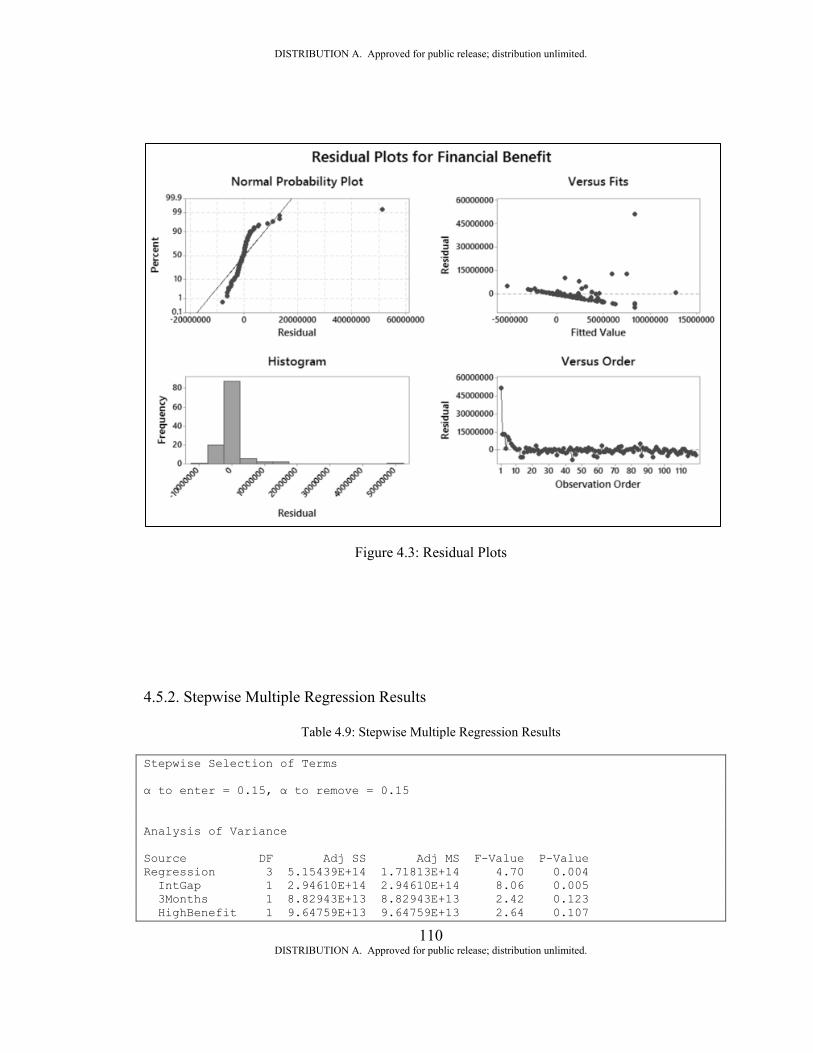
DISTRIBUTION A. Approved for public release; distribution unlimited.
110 DISTRIBUTION A. Approved for public release; distribution unlimited.
Figure 4.3: Residual Plots
4.5.2. Stepwise Multiple Regression Results
Table 4.9: Stepwise Multiple Regression Results
Stepwise Selection of Terms α to enter = 0.15, α to remove = 0.15 Analysis of Variance Source DF Adj SS Adj MS F-Value P-Value Regression 3 5.15439E+14 1.71813E+14 4.70 0.004 IntGap 1 2.94610E+14 2.94610E+14 8.06 0.005 3Months 1 8.82943E+13 8.82943E+13 2.42 0.123 HighBenefit 1 9.64759E+13 9.64759E+13 2.64 0.107
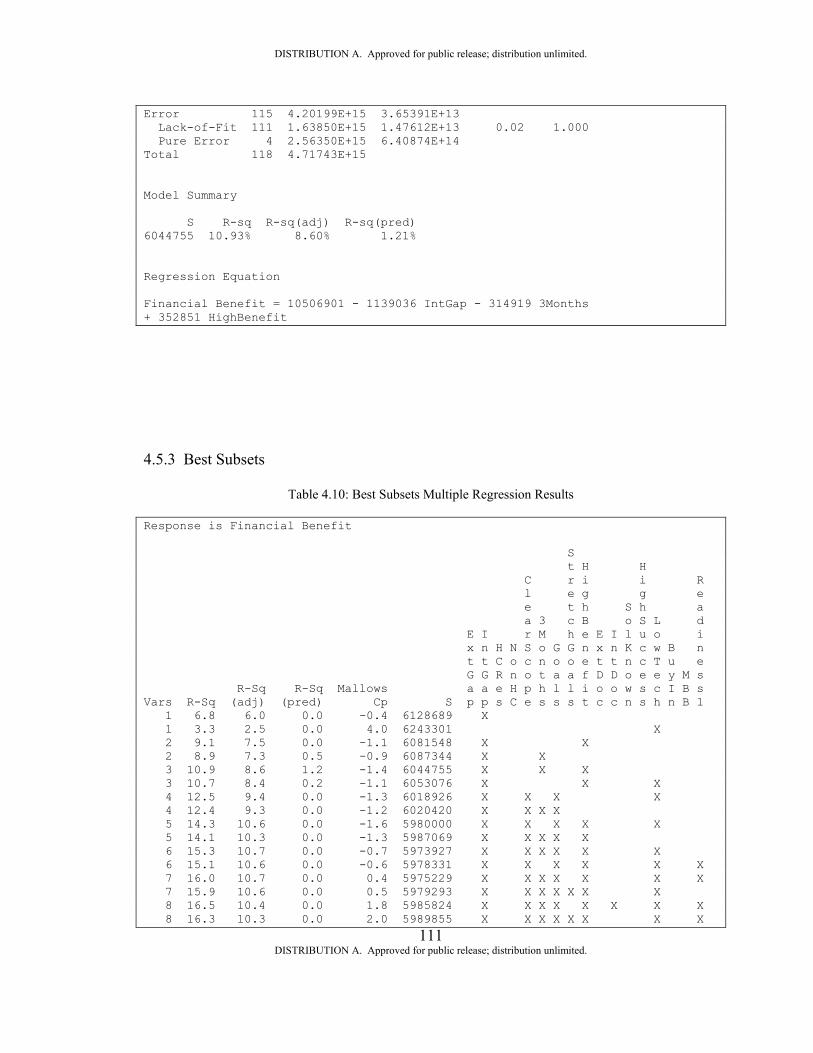
DISTRIBUTION A. Approved for public release; distribution unlimited.
111 DISTRIBUTION A. Approved for public release; distribution unlimited.
Error 115 4.20199E+15 3.65391E+13 Lack-of-Fit 111 1.63850E+15 1.47612E+13 0.02 1.000 Pure Error 4 2.56350E+15 6.40874E+14 Total 118 4.71743E+15 Model Summary S R-sq R-sq(adj) R-sq(pred) 6044755 10.93% 8.60% 1.21% Regression Equation Financial Benefit = 10506901 - 1139036 IntGap - 314919 3Months + 352851 HighBenefit
4.5.3 Best Subsets
Table 4.10: Best Subsets Multiple Regression Results
Response is Financial Benefit S t H H C r i i R l e g g e e t h S h a a 3 c B o S L d E I r M h e E I l u o i x n H N S o G G n x n K c w B n t t C o c n o o e t t n c T u e G G R n o t a a f D D o e e y M s R-Sq R-Sq Mallows a a e H p h l l i o o w s c I B s Vars R-Sq (adj) (pred) Cp S p p s C e s s s t c c n s h n B 1 1 6.8 6.0 0.0 -0.4 6128689 X 1 3.3 2.5 0.0 4.0 6243301 X 2 9.1 7.5 0.0 -1.1 6081548 X X 2 8.9 7.3 0.5 -0.9 6087344 X X 3 10.9 8.6 1.2 -1.4 6044755 X X X 3 10.7 8.4 0.2 -1.1 6053076 X X X 4 12.5 9.4 0.0 -1.3 6018926 X X X X 4 12.4 9.3 0.0 -1.2 6020420 X X X X 5 14.3 10.6 0.0 -1.6 5980000 X X X X X 5 14.1 10.3 0.0 -1.3 5987069 X X X X X 6 15.3 10.7 0.0 -0.7 5973927 X X X X X X 6 15.1 10.6 0.0 -0.6 5978331 X X X X X X 7 16.0 10.7 0.0 0.4 5975229 X X X X X X X 7 15.9 10.6 0.0 0.5 5979293 X X X X X X X 8 16.5 10.4 0.0 1.8 5985824 X X X X X X X X 8 16.3 10.3 0.0 2.0 5989855 X X X X X X X X
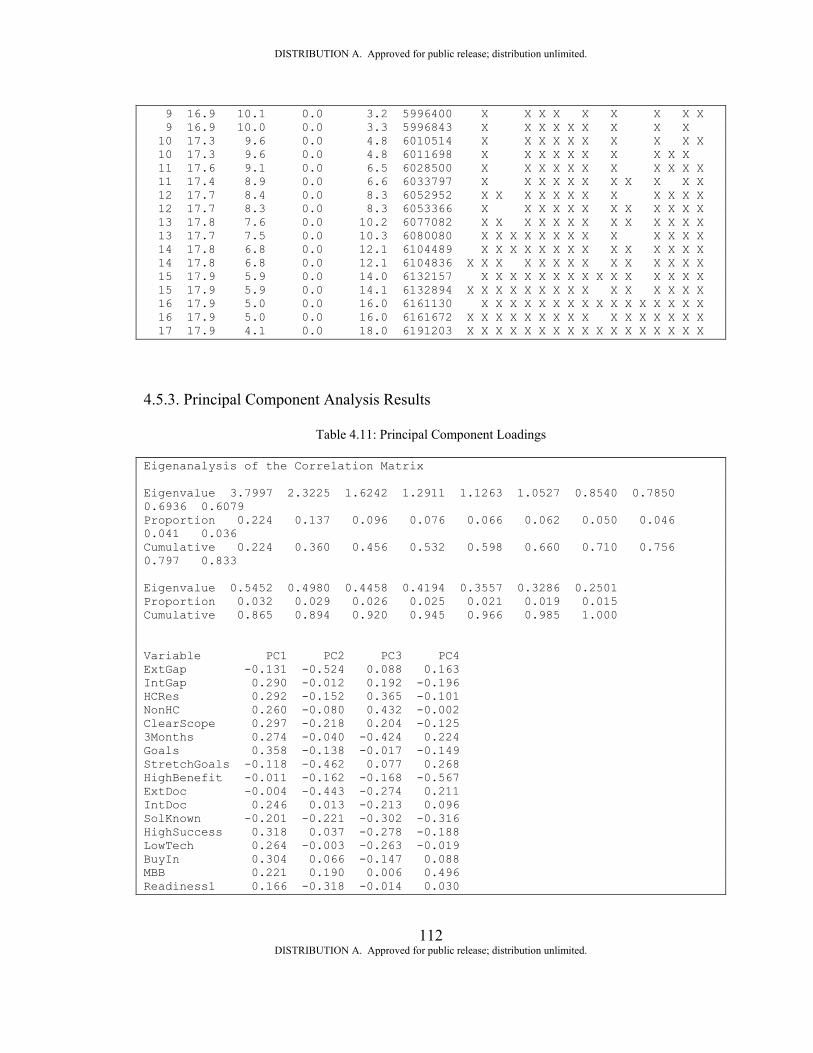
DISTRIBUTION A. Approved for public release; distribution unlimited.
112 DISTRIBUTION A. Approved for public release; distribution unlimited.
9 16.9 10.1 0.0 3.2 5996400 X X X X X X X X X 9 16.9 10.0 0.0 3.3 5996843 X X X X X X X X X 10 17.3 9.6 0.0 4.8 6010514 X X X X X X X X X X 10 17.3 9.6 0.0 4.8 6011698 X X X X X X X X X X 11 17.6 9.1 0.0 6.5 6028500 X X X X X X X X X X X 11 17.4 8.9 0.0 6.6 6033797 X X X X X X X X X X X 12 17.7 8.4 0.0 8.3 6052952 X X X X X X X X X X X X 12 17.7 8.3 0.0 8.3 6053366 X X X X X X X X X X X X 13 17.8 7.6 0.0 10.2 6077082 X X X X X X X X X X X X X 13 17.7 7.5 0.0 10.3 6080080 X X X X X X X X X X X X X 14 17.8 6.8 0.0 12.1 6104489 X X X X X X X X X X X X X X 14 17.8 6.8 0.0 12.1 6104836 X X X X X X X X X X X X X X 15 17.9 5.9 0.0 14.0 6132157 X X X X X X X X X X X X X X X 15 17.9 5.9 0.0 14.1 6132894 X X X X X X X X X X X X X X X 16 17.9 5.0 0.0 16.0 6161130 X X X X X X X X X X X X X X X X 16 17.9 5.0 0.0 16.0 6161672 X X X X X X X X X X X X X X X X 17 17.9 4.1 0.0 18.0 6191203 X X X X X X X X X X X X X X X X X
4.5.3. Principal Component Analysis Results
Table 4.11: Principal Component Loadings
Eigenanalysis of the Correlation Matrix Eigenvalue 3.7997 2.3225 1.6242 1.2911 1.1263 1.0527 0.8540 0.7850 0.6936 0.6079 Proportion 0.224 0.137 0.096 0.076 0.066 0.062 0.050 0.046 0.041 0.036 Cumulative 0.224 0.360 0.456 0.532 0.598 0.660 0.710 0.756 0.797 0.833 Eigenvalue 0.5452 0.4980 0.4458 0.4194 0.3557 0.3286 0.2501 Proportion 0.032 0.029 0.026 0.025 0.021 0.019 0.015 Cumulative 0.865 0.894 0.920 0.945 0.966 0.985 1.000 Variable PC1 PC2 PC3 PC4 ExtGap -0.131 -0.524 0.088 0.163 IntGap 0.290 -0.012 0.192 -0.196 HCRes 0.292 -0.152 0.365 -0.101 NonHC 0.260 -0.080 0.432 -0.002 ClearScope 0.297 -0.218 0.204 -0.125 3Months 0.274 -0.040 -0.424 0.224 Goals 0.358 -0.138 -0.017 -0.149 StretchGoals -0.118 -0.462 0.077 0.268 HighBenefit -0.011 -0.162 -0.168 -0.567 ExtDoc -0.004 -0.443 -0.274 0.211 IntDoc 0.246 0.013 -0.213 0.096 SolKnown -0.201 -0.221 -0.302 -0.316 HighSuccess 0.318 0.037 -0.278 -0.188 LowTech 0.264 -0.003 -0.263 -0.019 BuyIn 0.304 0.066 -0.147 0.088 MBB 0.221 0.190 0.006 0.496 Readiness1 0.166 -0.318 -0.014 0.030
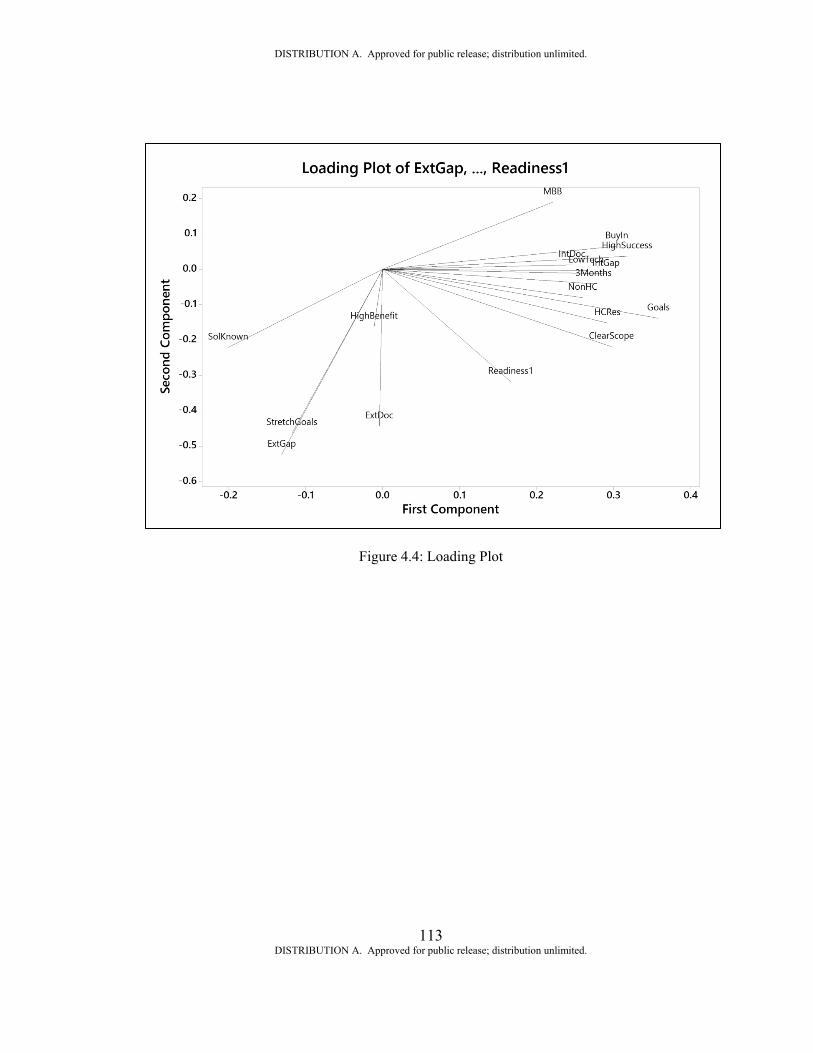
DISTRIBUTION A. Approved for public release; distribution unlimited.
113 DISTRIBUTION A. Approved for public release; distribution unlimited.
Figure 4.4: Loading Plot
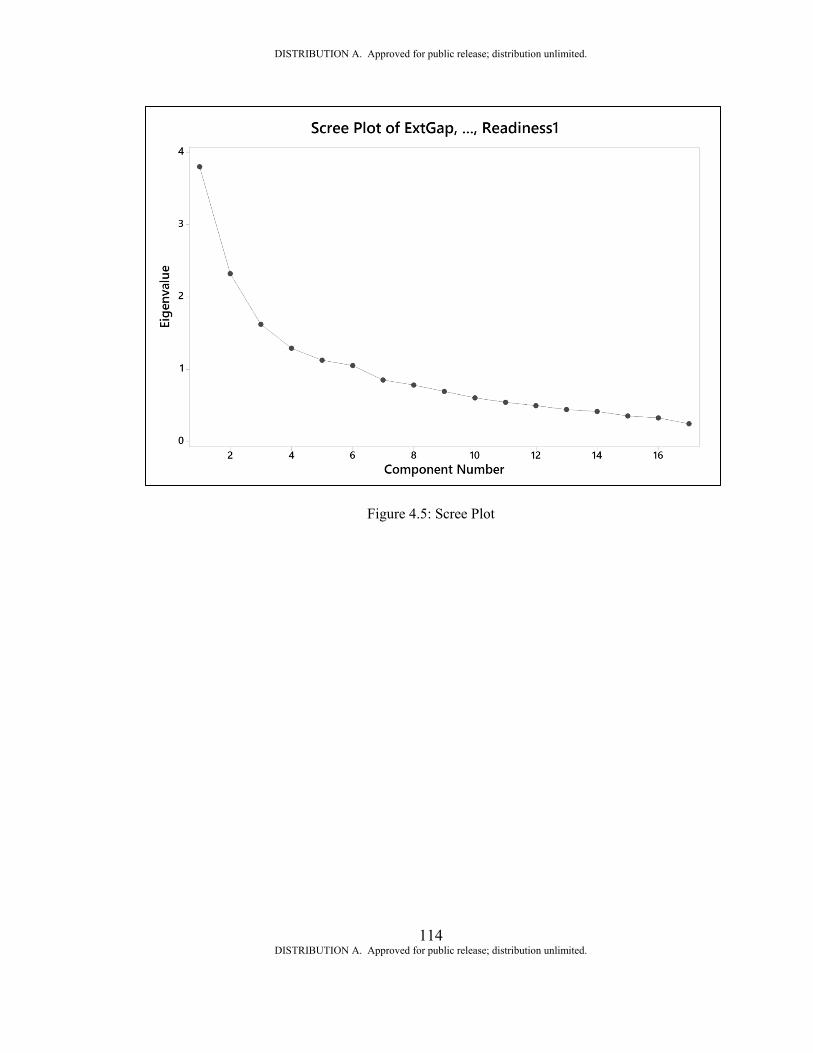
DISTRIBUTION A. Approved for public release; distribution unlimited.
114 DISTRIBUTION A. Approved for public release; distribution unlimited.
Figure 4.5: Scree Plot
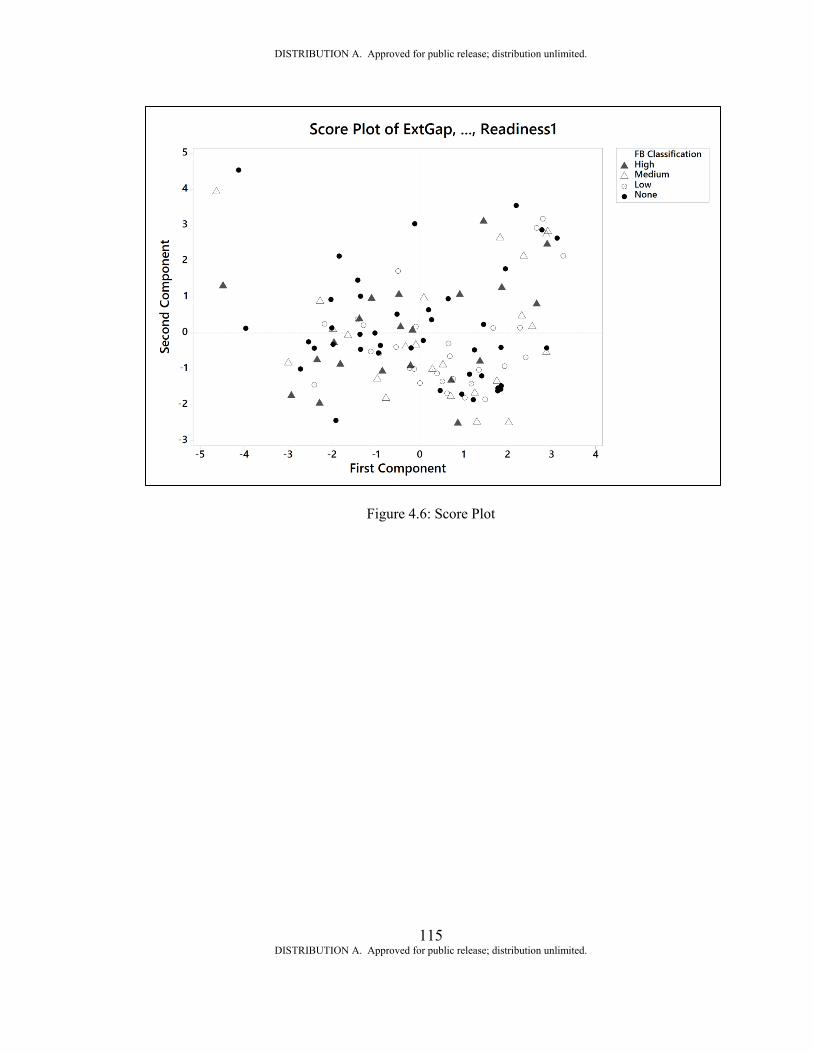
DISTRIBUTION A. Approved for public release; distribution unlimited.
115 DISTRIBUTION A. Approved for public release; distribution unlimited.
Figure 4.6: Score Plot
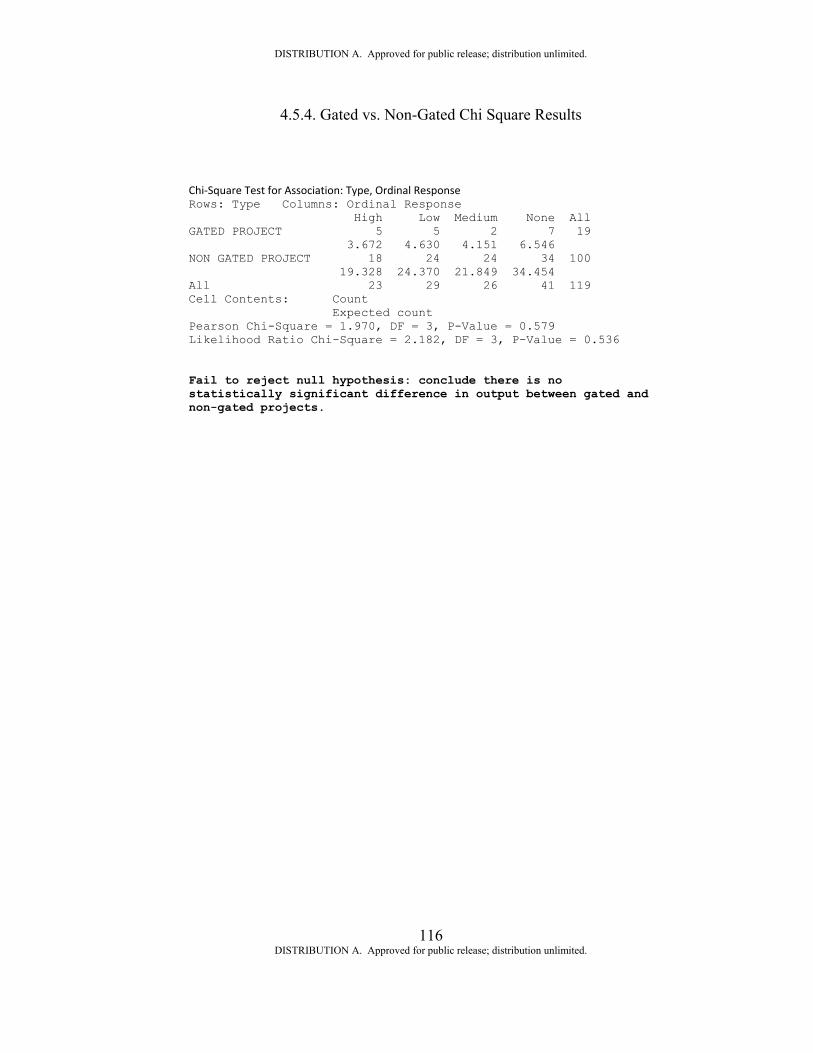
DISTRIBUTION A. Approved for public release; distribution unlimited.
116 DISTRIBUTION A. Approved for public release; distribution unlimited.
4.5.4. Gated vs. Non-Gated Chi Square Results
Chi-Square Test for Association: Type, Ordinal Response Rows: Type Columns: Ordinal Response High Low Medium None All GATED PROJECT 5 5 2 7 19 3.672 4.630 4.151 6.546 NON GATED PROJECT 18 24 24 34 100 19.328 24.370 21.849 34.454 All 23 29 26 41 119 Cell Contents: Count Expected count Pearson Chi-Square = 1.970, DF = 3, P-Value = 0.579 Likelihood Ratio Chi-Square = 2.182, DF = 3, P-Value = 0.536 Fail to reject null hypothesis: conclude there is no statistically significant difference in output between gated and non-gated projects.

DISTRIBUTION A. Approved for public release; distribution unlimited.
117 DISTRIBUTION A. Approved for public release; distribution unlimited.
REFERENCES
A systematic methodology for the creation of Six Sigma projects: A case study of
semiconductor foundry. Chao-Ton Su *, Chia-Jen Chou. Department of
Industrial Engineering and Engineering Management, National Tsing Hua
University, Hsinchu, Taiwan
An integrated analytic approach for Six Sigma project selection. Gülçin Büyüközkan
Demet Öztürkcan. Galatasaray University, Industrial Engineering Department,
34357 Istanbul, Turkey
ANAD. (2016, 11 30). ANAD: Mission. Retrieved from
https://www.anad.army.mil/missionANAD.shtml
AMC Command, A. M. (2013). AMC Strategic Plan 2013-2020. 6-36.
Basics of best subsets regression. (n.d.). Retrieved March 28, 2017, from
http://support.minitab.com/en-us/minitab/17/topic-library/modeling-
statistics/regression-and correlation/basics/basics-of-best-subsets-regression/
Chowdhury, S. Design for Six Sigma : the Revolutionary process for achieving
extraordinary profits. Chicago, IL: Dearborn Trade Pub, 2002. Print.
Critical success factors for the successful implementation of six sigma projects in
organisations Jiju Antony. The TQM Magazine, Vol. 14 Iss 2 pp. 92 - 100
Critical success factors of SixSigma implementations in Italian companies Alessandro
Brun, Department of Management,Economics and Industrial Engineering,
Politecnico di Milano Via G. Colombo ,40,20133 Milan, Italy
DISTRIBUTION A. Approved for public release; distribution unlimited.
118 DISTRIBUTION A. Approved for public release; distribution unlimited.
CS&CSS. (2016, 11 29). PEO CS&CSS Homepage. Retrieved from PEO CS&CSS
Eckes, George. The six sigma revolution : how General Electric and others turned
process into profits. New York: John Wiley, 2001. Print.
George, M. L. Lean Six Sigma for service : how to use Lean Speed and Six Sigma
Quality to improve services and transactions. New York London: McGraw-Hill,
2003. Print.
GCS. (2016, 11 30). Homepage. Retrieved from http://www.peogcs.army.mil/
George, M. L. The lean Six Sigma pocket toolbook : a quick reference guide to nearly
100 tools for improving process quality, speed, and complexity. New York
London: McGraw-Hill, 2005. Print.
How to Identify and Select Lean Six Sigma Projects Mader. Douglas P, Quality
Progress; Jul 2007; 40, 7; ProQuest
ILSC. (2016, 11 29). ILSC Hompage. Retrieved from https://www.tacom.army.mil/ilsc/
Katz, E. (2017). Trump orders agencies to eliminate waste, workforce redundancies.
Retrieved from http://www.govexec.com/management/2017/03/ new-trump-
order-ask-agencies-eliminate-waste-workforce-redundancies/136118/?oref=river
Miles, L. D. (2015). Techniques of Value Analysis and Engineering (3rd Ed.). Portland,
OR: Lawrence D. Miles Value Foundation.
Ordinal Logistic Regression: An Application to Pregnancy Outcomes. K.A. Adeleke and
A.A. Adepoju. Journal of Mathematics and Statistics 6 (3): 279-285, 2010
Pande, Peter S. The Six Sigma leader : how top executives will prevail in the 21st century.
NewYork: McGraw-Hill, 2007. Print.
DISTRIBUTION A. Approved for public release; distribution unlimited.
119 DISTRIBUTION A. Approved for public release; distribution unlimited.
PEO Soldier. (2016, 11 30). Abous Us. Retrieved from
http://www.peosoldier.army.mil/aboutus/mission.asp
Principal Component Analysis Overview. SPSS Online training document (n.d.)
Public Law 104-106 (1996). Retrieved from
https://www.dol.gov/ocfo/media/regs/ITMRA.pdf
Pyzdek, Thomas, and Paul A. Keller. The six sigma handbook. New York: McGraw-Hill
Education, 2014. Print.
RIA Overview. (2016, 11 30). Rock Island Arsenal. Retrieved from
http://www.globalsecurity.org/military/facility/rock-island.htm
RRAD. (2016, 11 30). RRAD Hompage. Retrieved from https://www.redriver.army.mil/
SIAD. (2016, 11 30). SIAD Mission (Public). Retrieved from
http://www.sierra.army.mil/Public/Mission.asp
Schmidt, E. (n.d.). Lean Six Sigma is in the army now, improving efficiency. Retrieved
from https://www.isixsigma.com/industries/government-non-profit/lean-six-
sigma-army-now-improving-efficiency/
Six Sigma programs: An implementation model. SatyaS. Chakravorty, Department of
Management and Entrepreneurship, Michael J. Coles College of Business,
Kennesaw State University,1000 ChastainRoad, Kennesaw, GA
Six-Sigma project selection using national quality award criteria and Delphi fuzzy
multiple criteria decision-making method. Taho Yang *, Chiung-Hsi Hsieh.
Institute of Manufacturing Engineering, National Cheng Kung University, No. 1
University Road, Tainan 70101, Taiwan
DISTRIBUTION A. Approved for public release; distribution unlimited.
120 DISTRIBUTION A. Approved for public release; distribution unlimited.
TACOM. (2016, 11 30). TACOM: Who We Are. Retrieved from
https://www.tacom.army.mil/main/whoweare.html
The role of experience in six sigma project success: An empirical analysis of
improvement projects. George S. Easton1,2, Eve D. Rosenzweig. Goizueta
Business School, Emory University, 1300 Clifton Road NE, Atlanta, GA 30322,
United States
U.S. Army Office of Business Transformation (OBT). (2011). Army Lean Six Sigma
Deployment Guidebook. Internal document.
WVA. (2016, 11 30). About Us. Retrieved from https://www.wva.army.mil/vision/