Embed Size (px)
Citation preview

4/30/2019
MAXIMIZING DATA'S POTENTIAL
Seagate TechnologyApril 2019 Investor Presentation
2
Safe Harbor Statement
This document contains forward-looking statements within the meaning of Section 27A of the Securities Act of 1933 and Section 21E of the Securities Exchange Act of 1934, each as
amended, including, in particular, statements about the Company’s plans, strategies and prospects, estimates of industry growth, market demand, development of technologies, and liqu idity
position, capital return and dividend issuance plans for the fiscal quarter ending June 28, 2019 and beyond. These statements identify prospective information and may include words such as
“expects,” “intends,” “plans,” “anticipates,” “believes,” “estimates,” “predicts,” “projects,” “should,” “may,” “will,” or the negative of these words, variations of these words and comparable
terminology. These forward-looking statements are based on information available to the Company as of the date of this document and are based on management’s current views and
assumptions. These forward-looking statements are conditioned upon and also involve a number of known and unknown risks, uncertainties, and other factors that could cause actual results,
performance or events to differ materially from those anticipated by these forward-looking statements. Such risks, uncertainties, and other factors may be beyond the Company’s control and
may pose a risk to the Company’s operating and financial condition. Such risks and uncertainties include, but are not limited to: items that may be identified during its financial statement
closing process that cause adjustments to the estimates included in this document; the uncertainty in global economic and political conditions; the impact of the variable demand and adverse
pricing environment for storage products; the Company’s ability to successfully qualify, manufacture and sell its storage products in increasing volumes on a cost-effective basis and with
acceptable quality; the impact of competitive product announcements; the Company’s ability to achieve projected cost savings in connection with its restructuring plans and consolidation of
manufacturing activities; possible excess industry supply with respect to particular storage products and competing alternative storage technology solutions; the impact of trade barriers, such
as import/export duties and restrictions, tariffs and quotas, imposed by the U.S. or other countries in which the Company conducts business; disruptions to its supply chain or production
capabilities; unexpected advances in competing technologies or changes in market trends; the development and introduction of products based on new technologies and expansion into new
data storage markets; the Company’s ability to comply wi th certain covenants in its credit facilities with respect to financial ratios and financial condition tests; currency fluctuations that may
impact the Company’s margins, international sales and results of operations; cyber-attacks or other data breaches that disrupt the Company’s operations or result in the dissemination of
proprietary or confidential information and cause reputational harm; cybersecurity threats and vulnerabilities associated with the Company’s infrastructure updates to i ts information
technology systems; and fluctuations in interest rates. Information concerning risks, uncertainties and other factors that could cause results to differ materially from the expectations described
in this document is contained in the Company’s Annual Report on Form 10-K filed wi th the U.S. Securities and Exchange Commission (“SEC”) on August 3, 2018, the “Risk Factors” section
of which is incorporated into this document by reference, and other documents filed with or furnished to the SEC. These forward-looking statements should not be relied upon as representing
the Company’s views as of any subsequent date and the Company undertakes no obligation to update forward-looking statements to reflect events or circumstances after the date they were
made.

3
POSITIVE
INDUSTRY DYNAMICS
COMMITMENT
TO CAPITAL RETURNS
STRONG
TECHNOLOGY PORTFOLIO
• DataSphere growing to 175 ZB by 2025
• Storage capacity demand of 22 ZB1
• ~59% of storage demand from HDD2
• Cumulative returns of $5.1B since FY163
• Repurchased 58M shares since FY16
• History of positive cash flow
• Market leader in HDDs
• 40-year track record of innovation
• Roadmap aligned to market trends
Seagate’s Compelling Investment Opportunity
1 Source IDC Nov, 2018 – Forecast storage capacity shipments from 2018 to 20252 Source IDC Nov, 2018– HDD shipments from 2018 through 2025 3 Reflects cumulative share repurchases and dividends for the period starting FQ1 2016 through FQ3 2019
ZB: Zettabytes

4Source: Data Age 2025, sponsored by Seagate w ith data from IDC Global DataSphere, Nov 2018
Global Data ExplosionThe Global DataSphere is expected to grow from 33 ZB (2018) to 175 ZB (2025)
driven by never-ending data creation and expanding ability to extract value from data
175ZBDATA CREATED
20
40
60
80
100
120
160
180
200
0
2010 2011 2012 2013 2014 2015 2016 2017 2018 2019 2020 2021 2022 2023 2024
ZE
TTA
BY
TE
S
2025
5
-
0.5
1.0
1.5
2.0
2.5
3.0
3.5
4.0
4.5
5.0
5.5
2010 2011 2012 2013 2014 2015 2016 2017 2018 2019 2020 2021 2022 2023 2024 2025
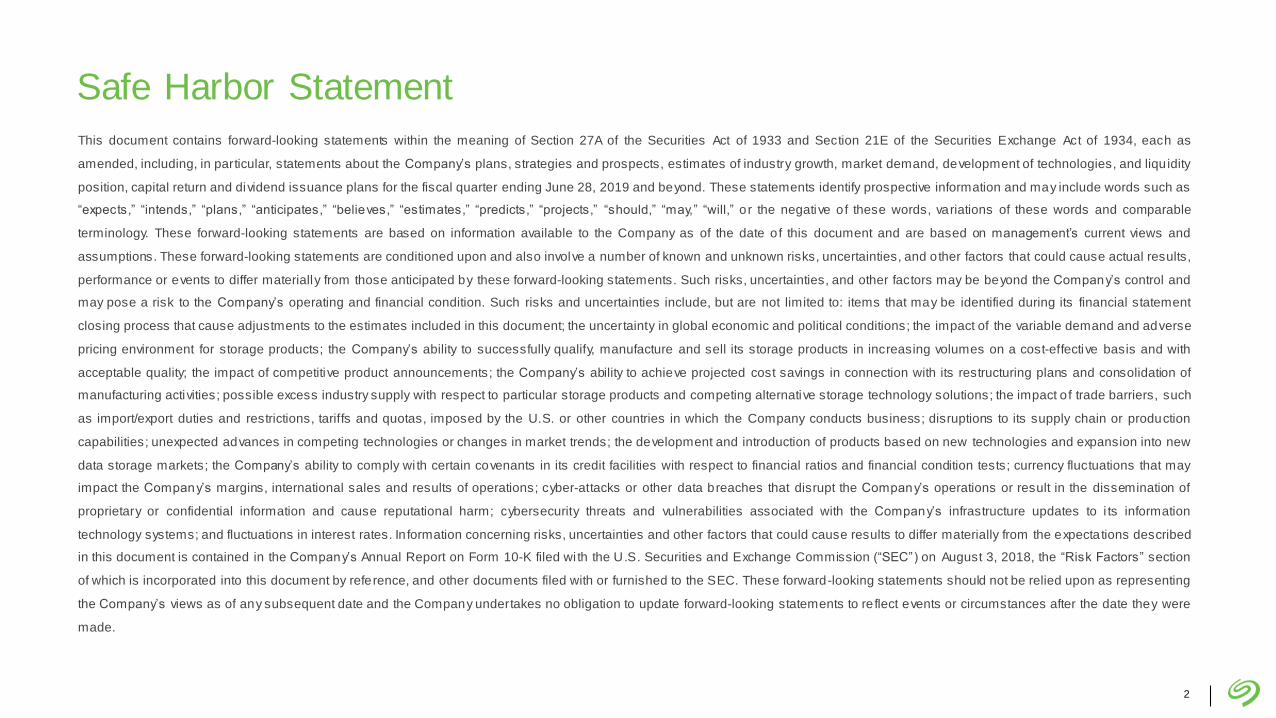
Worldwide Byte Shipments
Data Demand is Driving Massive Growth in Storage
• Storage shipments over next 4-years will exceed cumulative shipments over the past 20 years
• HDD industry to support ~59% of storage demand from 2018 - 2025
ZETT
ABY
TES
(ZB)
02010 2011 2012 2013 2014 2015 2016 2017 2018 2019 2020 2021 2022 2023 2024 2025
HDD
SSD
NVM1
Tape / Optical
1 NVM: Non-volatile Memory
Source: Data Age 2025, sponsored by Seagate w ith data from IDC Global DataSphere, Nov 2018

6
The storage market continues to experience key periods of transformation
Evolution Of The Datasphere
1960 – 1970Mainframe
Centralized10 million
users
1980 – 2000Client-Server
Distributed2 billion
users
2005 – 2020Mobile-Cloud
Centralized7 billion
users
2020 –Rise of the Edge
Distributed1+ trillion
users

7
Applications Are Driving The Edge Infrastructure
EdgeCloud building blocks for
low latency applications
EndpointsDevices and sensors in the field
CoreLeverage public cloud strategically
Decentralized
Metro Central
Office
ColocationSmall Premises
Large Premises Access Network
Centralized
Core Networks Hyperscale Regions

8
HDD & NAND Collectively Address Increasing Storage Demand

9
Seagate Efficiently Managing Data from Endpoints to Edge to Core
Portfolio of HDD and SSD Products
ENDPOINTS THE EDGE THE CORE

10
WHAT CUSTOMERS ARE LOOKING FOR LOOKING AHEAD WITH SEAGATE
Growing Exabyte Demand• Enable Storage Density
• Store Multiple Copies
Maintain SLAs With
High Performance• High Availability
• Low Response Time
Reduce TCO• CAPEX
• OPEX
Areal Density• Technology: HAMR
• Focus: 20TB by 2020
Scale IOPS With Capacity• Technology: Multi Actuator, Parallelism
• Focus: Random Read IOPS, Latency
Reduce TCO• Technology: He, SMR
• Focus: Power Consumption, $ / TB
HAMR: Heat-Assisted Magnetic Recording
He: Helium Filled HDD
SMR: Shingled Magnetic Recording
Technology Strategy to Address Customer Challenges
SLA: Service Level Agreement
TCO: Total Cost of Ow nership
IOPS: Input/Output Operations Per Second

11
Technology Strategy Aligned to Storage Demand Requirements
Capacity optimized
Traditionalhigh-capacity
SMR
Helium
HAMR
HAMR + SMR
Parallelism HDMR
HDMR
TDMR + Helium
TDMR + SMR
Performance optimized
NEARLINE
Accelerate innovation for diverse customer base
• Capacity optimized 20TB+
• Performance optimized Scale
IOPS with terabytes
MISSION CRITICAL
Maintain support for legacy business
• 15K RPM 900GB
• 10K RPM 2.4TB
10K
15K
TDMR: Tw o-Dimensional Magnetic Recording
HDMR: Heated Dot Magnetic Recording

12
Doubling Performance With the Same Capacity
• Seagate’s Mach.2 Multi Actuator technology
equips hard drives with dual actuators
• Each actuator will control half of the drive’s arms
Half the drive’s recording heads will operate
together as a unit, while the other half will
operate independently as a separate unit
• Resulting in double the performance while
maintaining the same capacity
Multi Actuator Technology

13
Q3 FY15
14.8 EB
Q1 FY17
25.7 EB
Q4 FY18
44.5 EB Q3 FY19
30.0 EB
-
5.0
10.0
15.0
20.0
25.0
30.0
35.0
40.0
45.0
50.0
39%5-yr CAGR FY13 –
FY18
NOTE: Minor changes and calculation variances to historical exabytesare due to rounding.
Nearline Demand Trend

14NOTE: Minor calculation variances are due to rounding.1 See ‘Reconciliation Tables’ in Appendix
Focused on Discipline, Efficiency, Profitability
Delivering Solid Financial Performance
$11.2 $10.8 $11.2
$8.0
$0.0
$2.0
$4.0
$6.0
$8.0
$10.0
$12.0
FY 16 FY 17 FY 18 YTD FY 19
Revenue ($B)
24.6%
30.5% 30.7%
29.3%
20%
25%
30%
35%
FY 16 FY 17 FY 18 YTD FY 19
Non-GAAP Gross Margin1
$2.26
$4.12
$5.51
$3.94
$0.00
$2.00
$4.00
$6.00
FY 16 FY 17 FY 18 YTD FY 19
Non-GAAP Diluted EPS1
$1.1
$2.5
$1.9
$1.4
$0.0
$0.5
$1.0
$1.5
$2.0
$2.5
$3.0
FY 16 FY 17 FY 18 As ofFQ3 19
Cash and Cash Equivalents ($B)
$1.7$1.9
$2.1
$1.3
$0.0
$0.5
$1.0
$1.5
$2.0
$2.5
FY 16 FY 17 FY 18 YTD FY 19
Cash Flow from Operations ($B)
234263
338
263
0
50
100
150
200
250
300
350
400
FY 16 FY 17 FY 18 YTD FY 19
HDD Capacity Shipped (Exabytes)

15
Strong Track-Record of Returning Capital to Shareholders
$1,090 $1,550
$1,911 $2,524
$727
$1,288
$2,014
$2,553
F Y2016 F Y2017 F Y2018 YTD F Y2019
Share Repurchase Dividends
Cumulative returns from FY2016 to YTD FY2019
• Cumulative share repurchases and dividends of $5.1B since FY 2016
• Repurchased ~58M shares since FY 2016
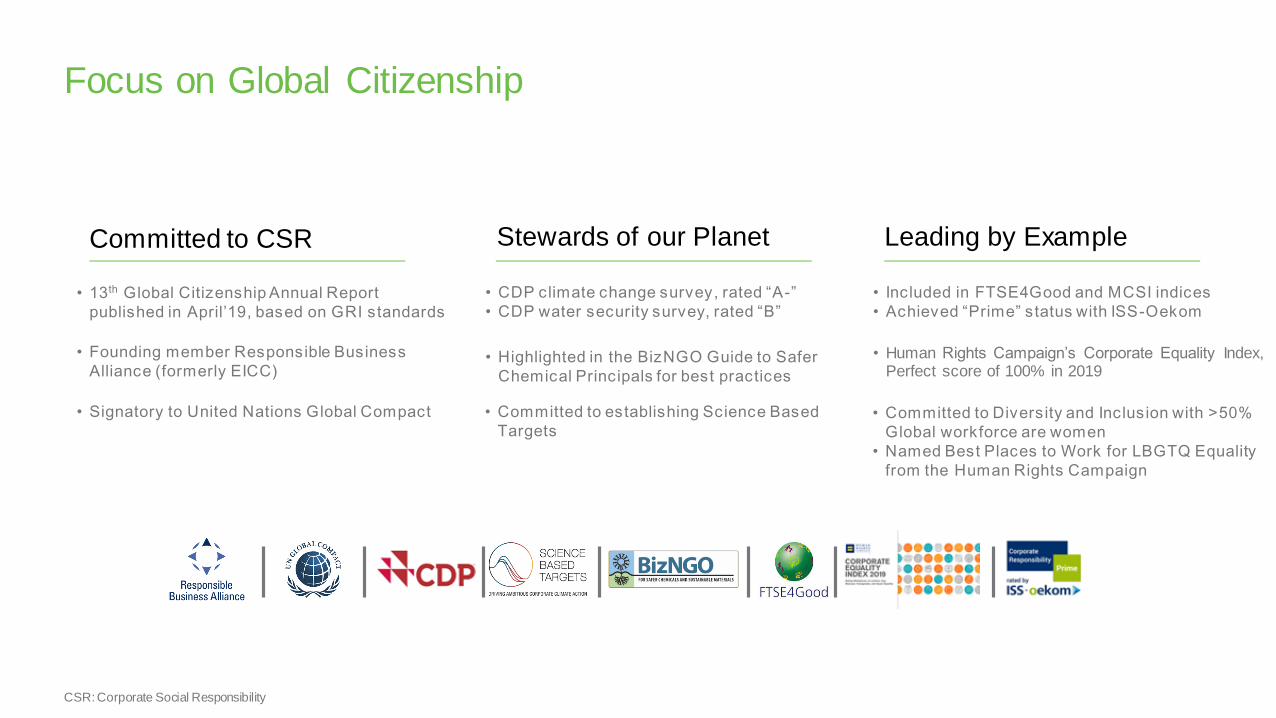
CSR: Corporate Social Responsibility
Focus on Global Citizenship
• Founding member Responsible Business
Alliance (formerly EICC)
• 13th Global Citizenship Annual Report
published in April’19, based on GRI standards
• Committed to establishing Science Based
Targets
Stewards of our Planet
• CDP climate change survey, rated “A -”
• CDP water security survey, rated “B”
• Signatory to United Nations Global Compact
Committed to CSR
• Highlighted in the BizNGO Guide to Safer
Chemical Principals for best practices
• Committed to Diversity and Inclusion with >50%
Global workforce are women
• Named Best Places to Work for LBGTQ Equality
from the Human Rights Campaign
Leading by Example
• Included in FTSE4Good and MCSI indices
• Achieved “Prime” status with ISS-Oekom
• Human Rights Campaign’s Corporate Equality Index, Perfect score of 100% in 2019

17
Our StorySEAGATE IS CRAFTING THE DATASPHERE
WITH GROUNDBREAKING TECHNOLOGY
We believe data is potential
For over 40 years, our products have played a pivotal
role in helping humanity maximize that potential by
harnessing the Datasphere, which is all around us

18
Appendix
191. See ‘Reconciliation Tables’ section for GAAP reconciliation.
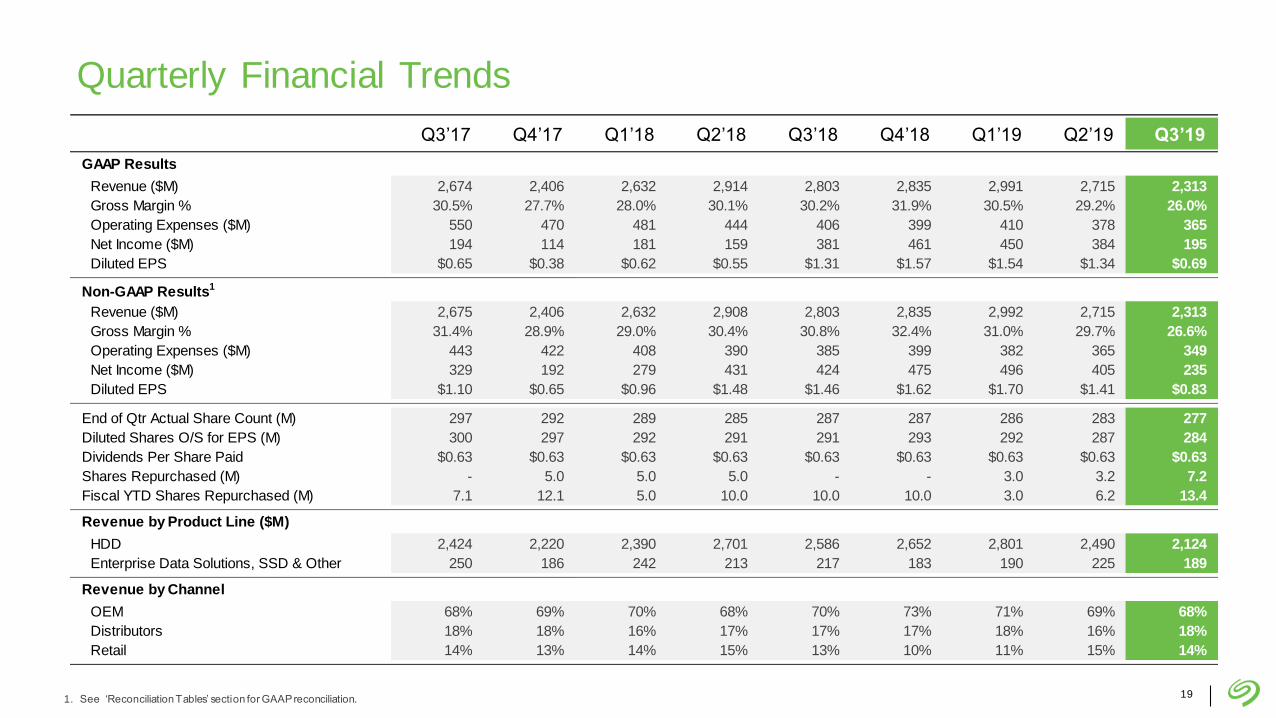
Quarterly Financial Trends
Q3’17 Q4’17 Q1’18 Q2’18 Q3’18 Q4’18 Q1’19 Q2’19 Q3’19
GAAP Results
Revenue ($M) 2,674 2,406 2,632 2,914 2,803 2,835 2,991 2,715 2,313
Gross Margin % 30.5% 27.7% 28.0% 30.1% 30.2% 31.9% 30.5% 29.2% 26.0%
Operating Expenses ($M) 550 470 481 444 406 399 410 378 365
Net Income ($M) 194 114 181 159 381 461 450 384 195
Diluted EPS $0.65 $0.38 $0.62 $0.55 $1.31 $1.57 $1.54 $1.34 $0.69
Non-GAAP Results1
Revenue ($M) 2,675 2,406 2,632 2,908 2,803 2,835 2,992 2,715 2,313
Gross Margin % 31.4% 28.9% 29.0% 30.4% 30.8% 32.4% 31.0% 29.7% 26.6%
Operating Expenses ($M) 443 422 408 390 385 399 382 365 349
Net Income ($M) 329 192 279 431 424 475 496 405 235
Diluted EPS $1.10 $0.65 $0.96 $1.48 $1.46 $1.62 $1.70 $1.41 $0.83
End of Qtr Actual Share Count (M) 297 292 289 285 287 287 286 283 277
Diluted Shares O/S for EPS (M) 300 297 292 291 291 293 292 287 284
Dividends Per Share Paid $0.63 $0.63 $0.63 $0.63 $0.63 $0.63 $0.63 $0.63 $0.63
Shares Repurchased (M) - 5.0 5.0 5.0 - - 3.0 3.2 7.2
Fiscal YTD Shares Repurchased (M) 7.1 12.1 5.0 10.0 10.0 10.0 3.0 6.2 13.4
Revenue by Product Line ($M)
HDD 2,424 2,220 2,390 2,701 2,586 2,652 2,801 2,490 2,124
Enterprise Data Solutions, SSD & Other 250 186 242 213 217 183 190 225 189
Revenue by Channel
OEM 68% 69% 70% 68% 70% 73% 71% 69% 68%
Distributors 18% 18% 16% 17% 17% 17% 18% 16% 18%
Retail 14% 13% 14% 15% 13% 10% 11% 15% 14%

20
1. Edge Non-Compute formerly known as Client Non-Compute.
2. Consumer Electronics includes exabytesfrom surveillance, DVR, NAS, and gaming.
3. Edge Compute formerly known as Client Compute.
HDD Product Mix Trends
NOTE: Minor calculation variances are due to rounding.
Q3’17 Q4’17 Q1’18 Q2’18 Q3’18 Q4’18 Q1’19 Q2’19 Q3’19
Enterprise
Capacity (EB) Mission Critical 2.3 2.2 2.1 2.4 2.5 2.6 3.0 3.4 2.9
Nearline 21.4 21.2 25.1 35.1 41.3 44.5 42.5 33.0 30.0
3.2 3.4 3.9 4.3 4.8 5.3 5.2 4.5 4.9
Capacity (EB) Consumer Electronics2 13.6 12.4 13.5 17.1 14.6 18.2 23.4 18.4 17.6
Consumer 10.8 9.5 11.1 13.8 11.6 9.5 11.2 14.2 11.6
2.0 1.9 1.9 2.2 2.2 2.2 2.2 2.4 2.4
Capacity (EB) Desktop + Notebook 17.3 16.8 18.6 19.2 17.5 18.0 18.7 18.4 14.6
1.1 1.0 1.1 1.1 1.1 1.2 1.2 1.2 1.2
65.5 62.2 70.3 87.5 87.4 92.9 98.8 87.4 76.7
1.8 1.8 1.9 2.2 2.4 2.5 2.5 2.4 2.4
36% 37% 36% 40% 44% 46% 42% 39% 39%
29% 29% 29% 30% 26% 27% 31% 31% 32%
25% 26% 26% 23% 22% 21% 20% 21% 20%
Average Capacity per Drive (TB)
Enterprise as a % of Revenue
Edge Compute as a % of Revenue
Edge Non-Compute as a % of Revenue
Average Capacity per Drive (TB)
Average Capacity per Drive (TB)
Average Capacity per Drive (TB)
Total HDD Capacity (EB)
Edge Non-Compute1
Edge Compute3
21
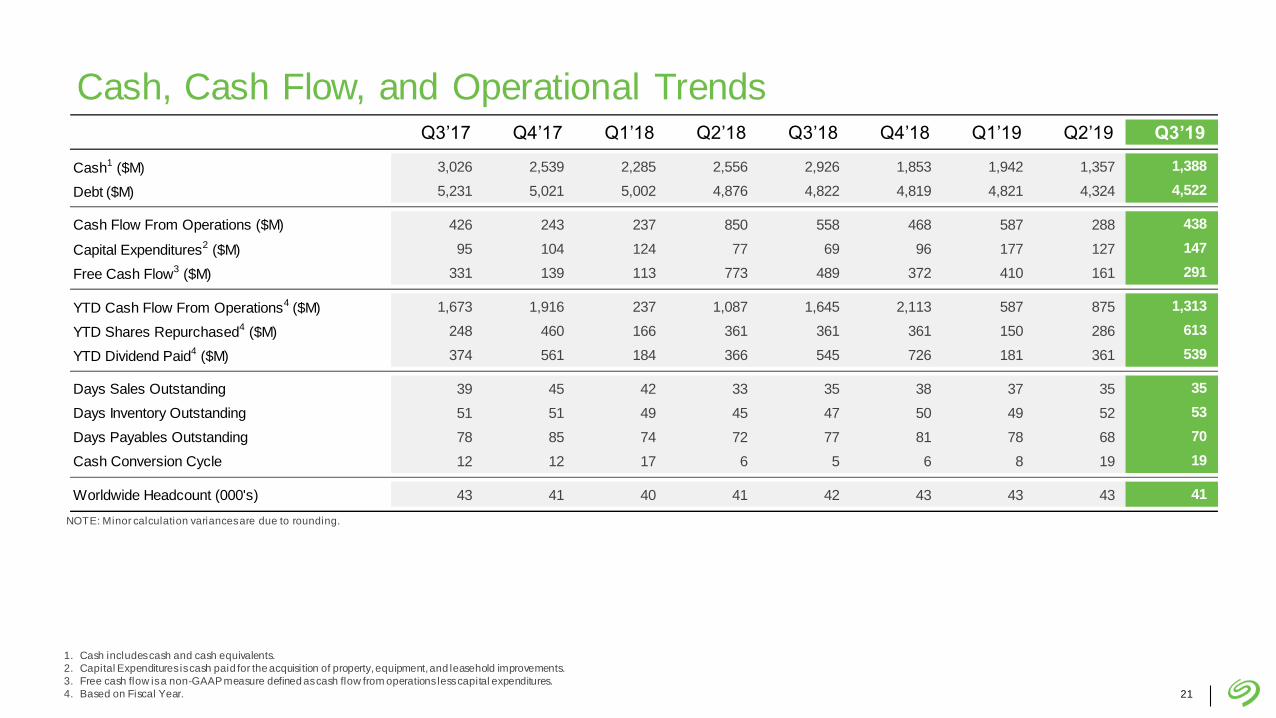
1. Cash includes cash and cash equivalents.
2. Capital Expenditures is cash paid for the acquisition of property, equipment, and leasehold improvements.
3. Free cash flow is a non-GAAP measure defined as cash flow from operations less capital expenditures.
4. Based on Fiscal Year.
Cash, Cash Flow, and Operational TrendsQ3’17 Q4’17 Q1’18 Q2’18 Q3’18 Q4’18 Q1’19 Q2’19 Q3’19
Cash1 ($M) 3,026 2,539 2,285 2,556 2,926 1,853 1,942 1,357 1,388
Debt ($M) 5,231 5,021 5,002 4,876 4,822 4,819 4,821 4,324 4,522
Cash Flow From Operations ($M) 426 243 237 850 558 468 587 288 438
Capital Expenditures2 ($M) 95 104 124 77 69 96 177 127 147
Free Cash Flow3 ($M) 331 139 113 773 489 372 410 161 291
YTD Cash Flow From Operations4 ($M) 1,673 1,916 237 1,087 1,645 2,113 587 875 1,313
YTD Shares Repurchased4 ($M) 248 460 166 361 361 361 150 286 613
YTD Dividend Paid4 ($M) 374 561 184 366 545 726 181 361 539
Days Sales Outstanding 39 45 42 33 35 38 37 35 35
Days Inventory Outstanding 51 51 49 45 47 50 49 52 53
Days Payables Outstanding 78 85 74 72 77 81 78 68 70
Cash Conversion Cycle 12 12 17 6 5 6 8 19 19
Worldwide Headcount (000's) 43 41 40 41 42 43 43 43 41
NOTE: Minor calculation variances are due to rounding.
22
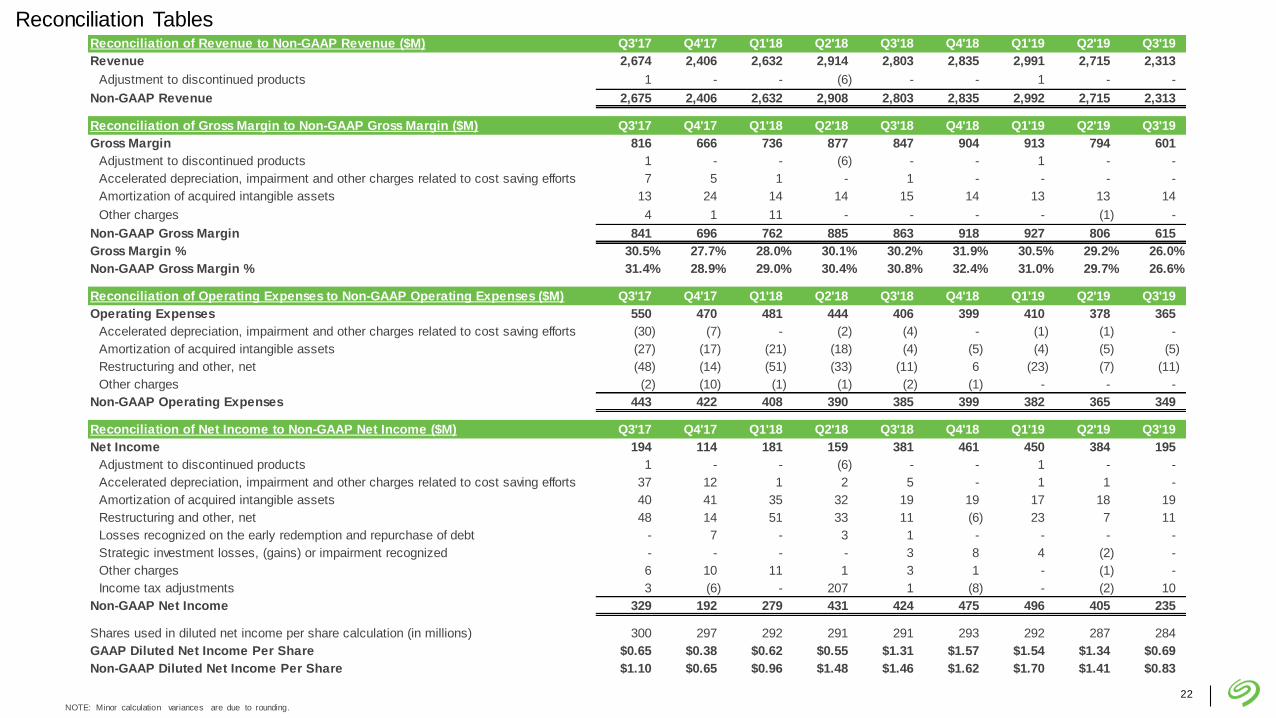
NOTE: Minor calculation variances are due to rounding.
Reconciliation of Revenue to Non-GAAP Revenue ($M) Q3'17 Q4'17 Q1'18 Q2'18 Q3'18 Q4'18 Q1'19 Q2'19 Q3'19
Revenue 2,674 2,406 2,632 2,914 2,803 2,835 2,991 2,715 2,313
Adjustment to discontinued products 1 - - (6) - - 1 - -
Non-GAAP Revenue 2,675 2,406 2,632 2,908 2,803 2,835 2,992 2,715 2,313
Reconciliation of Gross Margin to Non-GAAP Gross Margin ($M) Q3'17 Q4'17 Q1'18 Q2'18 Q3'18 Q4'18 Q1'19 Q2'19 Q3'19
Gross Margin 816 666 736 877 847 904 913 794 601
Adjustment to discontinued products 1 - - (6) - - 1 - -
Accelerated depreciation, impairment and other charges related to cost saving efforts 7 5 1 - 1 - - - -
Amortization of acquired intangible assets 13 24 14 14 15 14 13 13 14
Other charges 4 1 11 - - - - (1) -
Non-GAAP Gross Margin 841 696 762 885 863 918 927 806 615
Gross Margin % 30.5% 27.7% 28.0% 30.1% 30.2% 31.9% 30.5% 29.2% 26.0%
Non-GAAP Gross Margin % 31.4% 28.9% 29.0% 30.4% 30.8% 32.4% 31.0% 29.7% 26.6%
Reconciliation of Operating Expenses to Non-GAAP Operating Expenses ($M) Q3'17 Q4'17 Q1'18 Q2'18 Q3'18 Q4'18 Q1'19 Q2'19 Q3'19
Operating Expenses 550 470 481 444 406 399 410 378 365
Accelerated depreciation, impairment and other charges related to cost saving efforts (30) (7) - (2) (4) - (1) (1) -
Amortization of acquired intangible assets (27) (17) (21) (18) (4) (5) (4) (5) (5)
Restructuring and other, net (48) (14) (51) (33) (11) 6 (23) (7) (11)
Other charges (2) (10) (1) (1) (2) (1) - - -
Non-GAAP Operating Expenses 443 422 408 390 385 399 382 365 349
Reconciliation of Net Income to Non-GAAP Net Income ($M) Q3'17 Q4'17 Q1'18 Q2'18 Q3'18 Q4'18 Q1'19 Q2'19 Q3'19
Net Income 194 114 181 159 381 461 450 384 195
Adjustment to discontinued products 1 - - (6) - - 1 - -
Accelerated depreciation, impairment and other charges related to cost saving efforts 37 12 1 2 5 - 1 1 -
Amortization of acquired intangible assets 40 41 35 32 19 19 17 18 19
Restructuring and other, net 48 14 51 33 11 (6) 23 7 11
Losses recognized on the early redemption and repurchase of debt - 7 - 3 1 - - - -
Strategic investment losses, (gains) or impairment recognized - - - - 3 8 4 (2) -
Other charges 6 10 11 1 3 1 - (1) -
Income tax adjustments 3 (6) - 207 1 (8) - (2) 10
Non-GAAP Net Income 329 192 279 431 424 475 496 405 235
Shares used in diluted net income per share calculation (in millions) 300 297 292 291 291 293 292 287 284
GAAP Diluted Net Income Per Share $0.65 $0.38 $0.62 $0.55 $1.31 $1.57 $1.54 $1.34 $0.69
Non-GAAP Diluted Net Income Per Share $1.10 $0.65 $0.96 $1.48 $1.46 $1.62 $1.70 $1.41 $0.83
Reconciliation Tables

23
NOTE: Minor calculation variances are due to rounding.
Reconciliation of Net Income to Credit Agreement Defined EBITDA ($M) Q3'17 Q4'17 Q1'18 Q2'18 Q3'18 Q4'18 Q1'19 Q2'19 Q3'19
Net Income 194 114 181 159 381 461 450 384 195
Interest Income (5) (5) (7) (6) (10) (15) (24) (22) (21)
Interest Expense 60 62 61 61 60 54 58 56 55
Income Tax Expense 18 6 7 212 12 5 18 14 20
Depreciation and Amortization 182 176 161 157 143 137 134 138 135
EBITDA 449 353 403 583 586 642 636 570 384
Adjustment to discontinued products 1 - - (6) - - 1 - -
Impairment and other charges related to cost saving efforts 30 8 1 1 - - - - -
Losses recognized on the early redemption and repurchase of debt - 7 - 3 1 - - - -
Strategic investment losses, (gains) or impairment recognized - - - - 3 8 4 (2) -
Restructuring and other, net 48 14 51 33 11 (6) 23 7 11
Other charges 6 10 11 1 3 1 - (1) -
Adjusted EBITDA 534 392 466 615 604 645 664 574 395
Share-based Compensation 37 27 32 27 26 27 18 27 28
Credit Agreement Defined EBITDA 571 419 498 642 630 672 682 601 423
Reconciliation Tables
24
Non-GAAP measures adjusted for the following items:
Adjustment to discontinued products
These adjustments relate to sales of certain discontinued products or changes in sales provision for discontinued products. These adjustments are inconsistent in amount and frequency and are excluded in the
non-GAAP measures as these adjustments are not indicative of the underlying ongoing operating performance.
Accelerated depreciation, impairment and other charges related to cost saving efforts
These expenses are excluded in the non-GAAP measure due to its inconsistency in amount and frequency and are excluded to facilitate a more meaningful evaluation of the Company’s current operating
performance and comparison to its past periods operating performance.
Amortization of acquired intangible assets
The Company records expense from amortization of intangible assets that w ere acquired in connection w ith its business combinations over their estimated useful lives. Such charges are inconsistent in size and
are signif icantly impacted by the timing and magnitude of the Company’s acquisitions. Consequently, these expenses are excluded in the non-GAAP measures to facilitate a more meaningful evaluation of its
current operating performance and comparison to its past periods operating performance.
Restructuring and other, net
Restructuring charges and other, net are costs associated w ith restructuring plans that are primarily related to costs associated w ith reduction in the Company’s w orkforce, exiting certain facilities and other
related costs. These also exclude charges or gains from sale of properties classif ied as held-for-sale. These costs or benefits do not reflect the Company’s ongoing operating performance and consequently are
excluded from the non-GAAP measures to facilitate a more meaningful evaluation of its current operating performance and comparison to its past periods operating performance.
Losses recognized on the early redemption and repurchase of debt
From time to time, the Company incurs losses from the early redemption and repurchase of certain long-term debt instruments. These losses represent the difference betw een the reacquisition costs and the par
value of the debt extinguished and include the w rite-off of any related unamortized debt issuance costs. The amount of these charges may be inconsistent in size and varies depending on the timing of the
repurchase of debt.
Strategic investment losses, (gains) or impairment recognized
From time to time, the Company incurs losses or gains from strategic investment accounted under equity method of accounting or records impairments charges w hich are not considered as part of its ongoing
operating performance. The resulting expense or gain is inconsistent in amount and frequency and consequently are excluded from the non-GAAP measures to facilitate a more meaningful evaluation of its
current operating performance and comparison to its past periods operating performance.
Other charges
The other charges primarily include w rite-off of certain discontinued inventory and expense related to disposed business. These charges are inconsistent in amount and frequency and are excluded in the non-
GAAP measures to facilitate a more meaningful evaluation of its current operating performance and comparison to its past periods operating performance.
Income tax adjustments
Provision for income taxes represents the tax effects of non-GAAP adjustments determined using a hybrid w ith and w ithout method and effective tax rate for the applicable adjustment and jurisdiction. It also
includes a provisional tax expense (benefit) for the re-measurement of the Company's U.S. deferred tax assets at the low er 21% tax rate resulting from the U.S. Tax Cuts and Jobs Act enacted on December 22,
2017.
Free cash flow
Free cash flow is a non-GAAP measure defined as net cash provided by operating activities less acquisition of property, equipment and leasehold improvements. This non-GAAP financial measure is used by
management to assess the Company's sources of liquidity, capital structure and operating performance.