Embed Size (px)
Citation preview
University of Montana University of Montana
ScholarWorks at University of Montana ScholarWorks at University of Montana
Graduate Student Theses, Dissertations, & Professional Papers Graduate School
2015
Maximal Femoral Artery Blood Flow During Cycle Ergometry Maximal Femoral Artery Blood Flow During Cycle Ergometry
Tucker W. Squires University of Montana, Missoula
Follow this and additional works at: https://scholarworks.umt.edu/etd
Part of the Other Analytical, Diagnostic and Therapeutic Techniques and Equipment Commons, and
the Sports Sciences Commons
Let us know how access to this document benefits you.
Recommended Citation Recommended Citation Squires, Tucker W., "Maximal Femoral Artery Blood Flow During Cycle Ergometry" (2015). Graduate Student Theses, Dissertations, & Professional Papers. 4559. https://scholarworks.umt.edu/etd/4559
This Thesis is brought to you for free and open access by the Graduate School at ScholarWorks at University of Montana. It has been accepted for inclusion in Graduate Student Theses, Dissertations, & Professional Papers by an authorized administrator of ScholarWorks at University of Montana. For more information, please contact [email protected].

MAXIMAL FEMORAL ARTERY BLOOD FLOW DURING CYCLE ERGOMETRY
By
Tucker William Squires
B.S. Health and Human Performance, University of Montana Missoula, Montana 2013
Thesis
Presented in partial fulfillment of the requirements of the degree of Master of Science, Health and Human Performance
University of Montana
Missoula, MT
December 2015
Approval determined by
Dr. Sandy Ross, Dean of The Graduate School
Dr. Matt Bundle Health and Human Performance
Dr. Charles Dumke
Health and Human Performance
Dr. Reed Humphrey Dean, College of Health Professions & Biomedical Sciences
X
X
X
X
Signatures
Dr. Sandy Ross, Dean of The Graduate School
Dr. Matt Bundle (Committee Chair) Health and Human Performance
Dr. Charles Dumke Health and Human Performance
Dr. Reed Humphrey Dean, College of Health Professions & Biomedical Sciences
Dedication
I would like to dedicate this work to my family and friends who have stood by my side during my
education. Without their encouragement I would not be where I am at today.
Not a day goes by that I don’t think about the great gift of education afforded to me by the hard
work and forethought of my parents, William A. and Sherry L. Squires and my grandfather, Albert
Squires. Your kind words of encouragement will never be forgotten and your input always valued.
To my sister Ashton Ann Squires, I cannot begin to measure and describe how immensely
helpful your perspective and humor about the completion of my graduate education was. I hope one
day that I am able to encourage you to pursue your educational and career goals in the same way that
you encouraged me.
To Mariah R. Williams, I am especially grateful for your support when things seemed
insurmountable. You have always pushed me to complete the seemingly impossible and to pursue a
career path that truly makes me happy.
Thank you all for everything you have done for me. It means a great deal to me to be able to
count on you for support and encouragement.
Acknowledgements
I would like to thank my thesis committee, Dr. Matthew W. Bundle (Chair), Dr. Charles L. Dumke,
Dr. Reed Humphrey, and Dr. J.B. Alexander “Sandy” Ross, for their work on getting me to the point of
the completion of my Master of Science degree.
I would like to thank Tyler Gallo for his technical expertise with working with the Doppler
ultrasound, his steady hand and expertise made this study possible.
To Alex and Nathan, your support and alternative perspective on my writing are greatly
appreciated. Both of you pushed me to do my best during the most difficult times during my education.
Your support throughout my graduate work will never be forgotten.
To my friends and colleagues in the Undergraduate Advising Center, Office for Student Success,
and across campus at the University of Montana, I am greatly appreciative for your perspective on my
education, for allowing me the flexibility to work while completing my degree, and always being willing
to help me in any way that you could. I hope that I am able to contribute to your education and lives like
you contributed to mine.

Squires, Tucker W., M.S., Autumn 2015 Health and Human Performance MAXIMAL FEMORAL ARTERY BLOOD FLOW DURING CYCLE ERGOMETRY
Chairperson: Matthew Bundle Ph.D.
The delivery of oxygen to working muscle in order to support aerobic respiration has long been
recognized as one of the critical elements conferring endurance performance. Oxygen is transported
from the environment to the active cells by the cardiovascular system, which is classically understood to
deliver progressively greater amounts of gas to support increased levels of aerobic metabolism.
However, the vast majority of existing studies have used modes of exercise that activate relatively small
volumes of muscle and consequently have relatively small demands for oxygen delivery. We measured
blood velocity using pulsed Doppler ultrasound and simultaneous measures of femoral artery diameter
using sonography while highly fit subjects (n=5; mass: 65.25 ± 3.25 kg; VO2 max: 71.3 ± 3.4 mL O2 ·kg-
1·min-1) exercised across a range of cycling power outputs (130W - 410W) supported by aerobic
metabolism. Artery diameter was unchanged between rest (9.9 ± 1.7 mm) and exercise at all intensities
(9.9 ± 1.1mm). Blood velocity increased up to 15.9 ± 5.4 cm s-1 at the greatest common power output
completed by the subjects (370 W). Peak single artery flows were 11.4 l min-1 at 250W, at greater power
outputs (up to 370W) the measured values of flow were largely unchanged or even decreased slightly
(mean = 9.7 ± 0.6 l min-1). Our results are 12.3% greater than the previously highest measures known to
science and indicate the importance of the structural and functional factors within the respiratory
system necessary to supply sufficient oxygen in order to sustain strenuous exercise.

Table of Contents
CHAPTER ONE: INTRODUCTION 1
INTRODUCTION 1 PROBLEM 6 SIGNIFICANCE 6 GOALS AND RESEARCH QUESTIONS 7 LIMITATIONS 7 DELIMITATIONS 8 DEFINITION OF TERMS 8
CHAPTER TWO: REVIEW OF LITERATURE 9
CHAPTER THREE: METHODOLOGY 13
PARTICIPANTS 13 AEROBIC METABOLISM 13 CYCLE ERGOMETERY 13 FEMORAL ARTERY BLOOD VELOCITY 14 ARTERIAL DIAMETER 15 ARTERIAL BLOOD FLOW 16 ANALYSIS 17
CHAPTER FOUR: RESULTS 18
AEROBIC METABOLISM 18 CYCLE ERGOMETER 18 FEMORAL ARTERY BLOOD VELOCITY 19 ARTERIAL DIAMETER 20 ARTERIAL BLOOD FLOW 21
CHAPTER FIVE: DISCUSSION 21
VASCULATURE REQUIREMENTS FOR HIGH RATES OF AEROBIC METABOLISM 23 ARTERIAL DIAMETER 25 ARTERIAL BLOOD FLOW 25 LIMITATIONS AND OTHER CONSIDERATIONS 26
REFERENCES 28
1
Chapter One: Introduction
Introduction
The delivery of oxygen to working muscle to support an aerobic respiration has long been
recognized as one of the critical elements conferring endurance performance (Hill & Lupton 1923).
Oxygen is delivered from the environment to muscle through a respiratory cascade that begins at the
air-body interface of the lung and descends to the mitochondria. The flux rates throughout the cascade
are dependent upon pulmonary ventilation, cardiac output, blood carrying capacity, and mitochondrial
density volume within the exercising tissue (Taylor 1996 Weibel 1984). The process of supplying
sufficient oxygen for aerobic metabolism across each of these steps is accomplished by the movement
and transportation of oxygen across the membranes of the individual structures and steps in the oxygen
cascade. Thus, greater rates of oxygen delivery depend on the size and quantities of the diffusive
pressure differences and membrane thickness present in the anatomical differences found between
individuals (Liguzinski & Korzeniewski 2007 Saltin 1985 Taylor 1996 Weibel 1981, 1992).
For oxygen to descend to the mitochondria it must diffuse across progressively thinner
membranes while being transported to the working muscle, such that larger surface areas generally
provide for higher conductance while thicker tissue membranes lessen conductance (Maina & West
2005). The thickest membranes are found in the lungs and are approximately 1 µm thick while the
mitochondria have the thinnest membranes (Weibel 1984 Brooks et al., 2005 Maina & West 2005 Roy &
Secomb 2014). Rates of oxygen transport depend on diffusion from the alveolar tissues in the lungs to
the blood, transport by the blood to the cells, and diffusion from the blood to the mitochondria, leading
to the creation of a driving force for oxygen transportation through tissues according to the
concentration gradient due to the partial pressure of oxygen being lower within the body than the
2
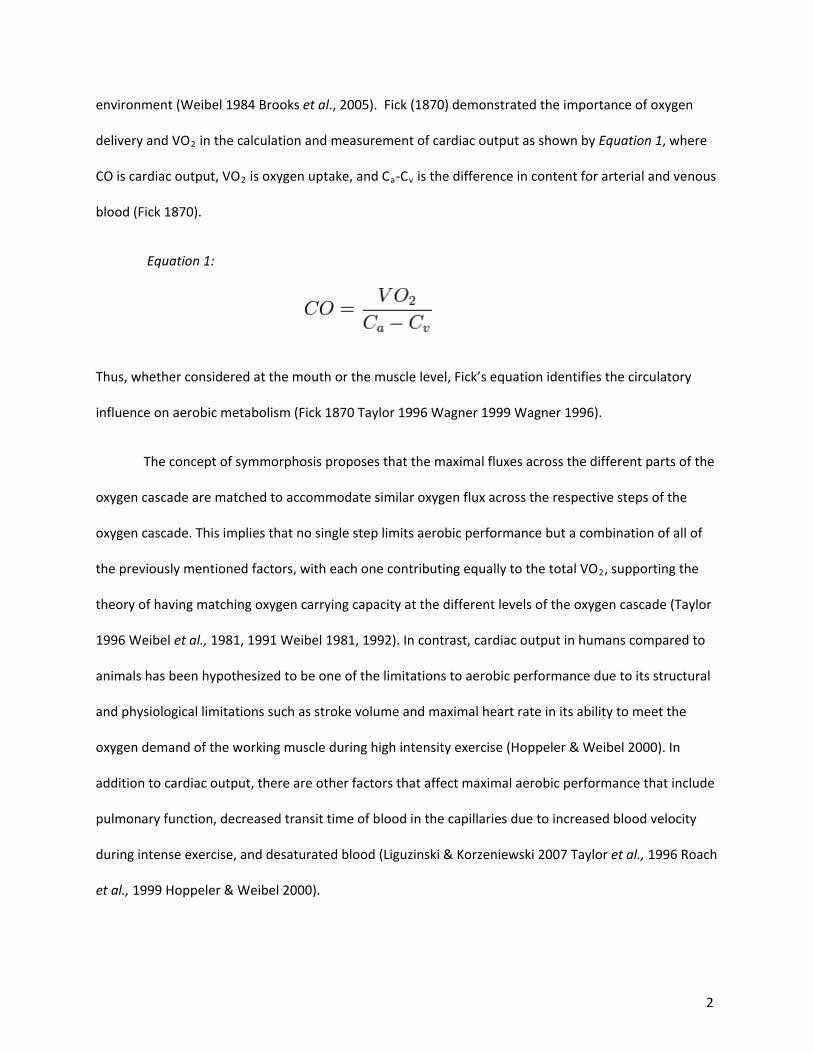
environment (Weibel 1984 Brooks et al., 2005). Fick (1870) demonstrated the importance of oxygen
delivery and VO2 in the calculation and measurement of cardiac output as shown by Equation 1, where
CO is cardiac output, VO2 is oxygen uptake, and Ca-Cv is the difference in content for arterial and venous
blood (Fick 1870).
Equation 1:
Thus, whether considered at the mouth or the muscle level, Fick’s equation identifies the circulatory
influence on aerobic metabolism (Fick 1870 Taylor 1996 Wagner 1999 Wagner 1996).
The concept of symmorphosis proposes that the maximal fluxes across the different parts of the
oxygen cascade are matched to accommodate similar oxygen flux across the respective steps of the
oxygen cascade. This implies that no single step limits aerobic performance but a combination of all of
the previously mentioned factors, with each one contributing equally to the total VO2, supporting the
theory of having matching oxygen carrying capacity at the different levels of the oxygen cascade (Taylor
1996 Weibel et al., 1981, 1991 Weibel 1981, 1992). In contrast, cardiac output in humans compared to
animals has been hypothesized to be one of the limitations to aerobic performance due to its structural
and physiological limitations such as stroke volume and maximal heart rate in its ability to meet the
oxygen demand of the working muscle during high intensity exercise (Hoppeler & Weibel 2000). In
addition to cardiac output, there are other factors that affect maximal aerobic performance that include
pulmonary function, decreased transit time of blood in the capillaries due to increased blood velocity
during intense exercise, and desaturated blood (Liguzinski & Korzeniewski 2007 Taylor et al., 1996 Roach
et al., 1999 Hoppeler & Weibel 2000).
3
Due to the inherent limitations of the cardiovascular system, exact measures of blood flow and
delivery to working tissues at higher oxygen consumptions such as cycling are unclear. The available
literature indicates great variability in expected flows during similar activities and a general lack of
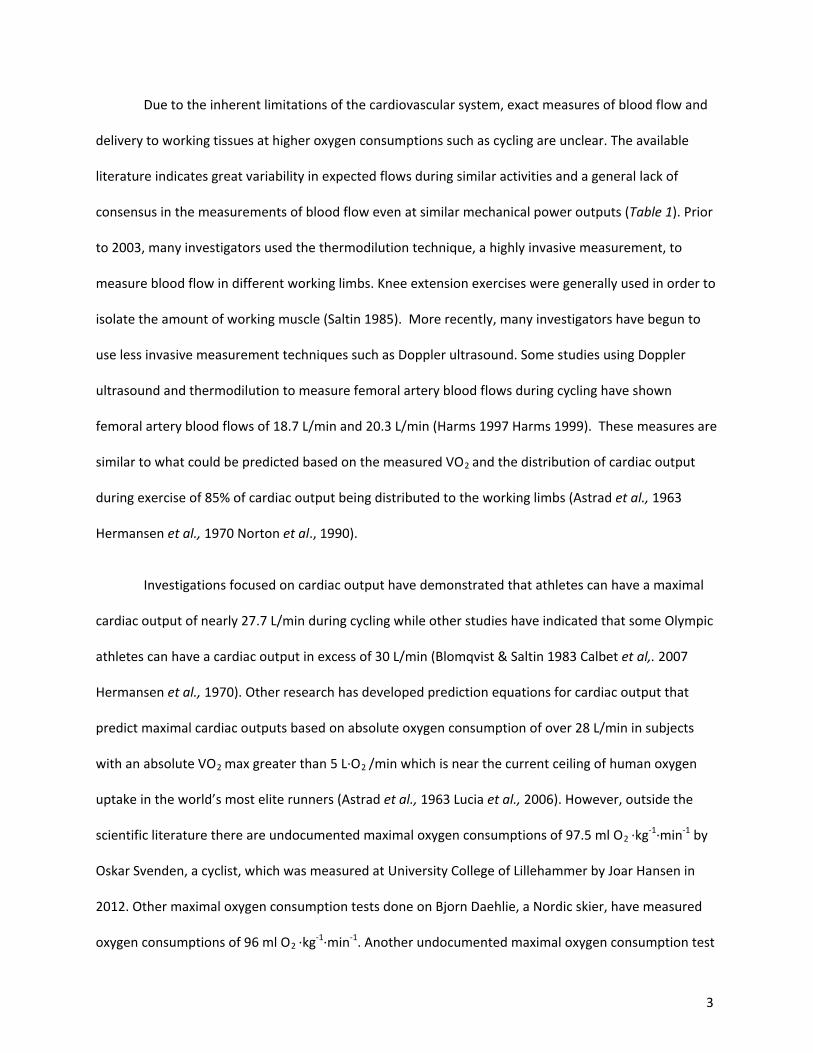
consensus in the measurements of blood flow even at similar mechanical power outputs (Table 1). Prior
to 2003, many investigators used the thermodilution technique, a highly invasive measurement, to
measure blood flow in different working limbs. Knee extension exercises were generally used in order to
isolate the amount of working muscle (Saltin 1985). More recently, many investigators have begun to
use less invasive measurement techniques such as Doppler ultrasound. Some studies using Doppler
ultrasound and thermodilution to measure femoral artery blood flows during cycling have shown
femoral artery blood flows of 18.7 L/min and 20.3 L/min (Harms 1997 Harms 1999). These measures are
similar to what could be predicted based on the measured VO2 and the distribution of cardiac output
during exercise of 85% of cardiac output being distributed to the working limbs (Astrad et al., 1963
Hermansen et al., 1970 Norton et al., 1990).
Investigations focused on cardiac output have demonstrated that athletes can have a maximal
cardiac output of nearly 27.7 L/min during cycling while other studies have indicated that some Olympic
athletes can have a cardiac output in excess of 30 L/min (Blomqvist & Saltin 1983 Calbet et al,. 2007
Hermansen et al., 1970). Other research has developed prediction equations for cardiac output that
predict maximal cardiac outputs based on absolute oxygen consumption of over 28 L/min in subjects
with an absolute VO2 max greater than 5 L·O2 /min which is near the current ceiling of human oxygen
uptake in the world’s most elite runners (Astrad et al., 1963 Lucia et al., 2006). However, outside the
scientific literature there are undocumented maximal oxygen consumptions of 97.5 ml O2 ·kg-1·min-1 by
Oskar Svenden, a cyclist, which was measured at University College of Lillehammer by Joar Hansen in
2012. Other maximal oxygen consumption tests done on Bjorn Daehlie, a Nordic skier, have measured
oxygen consumptions of 96 ml O2 ·kg-1·min-1. Another undocumented maximal oxygen consumption test
4
put Espen Harald Bjerke, another Nordic skier, at a maximal oxygen consumption of 96 ml O2 ·kg-1·min-
1 and an absolute VO2 of 7.3 L/min leading to a predicted cardiac output in excess of 45L/min (Astrad et
al., 1963). With over 85% of cardiac output being put towards lower limb blood flow during exercise it is
possible to have femoral artery blood flows of nearly 15 L/min in highly fit athletes and potentially
closer to 23 L/min in some of the world’s most fit individuals (Norton et al., 1990). Currently there are
only a few studies that demonstrate femoral artery blood flows similar to what can be predicted, see
Table 1.
In order to address this uncertainty and the large degree of variability in the current body of
literature it is our goal to measure both the oxygen consumption and blood flow simultaneously that is
necessary to support high intensity cycling. Our method allows for a more precise calculation of blood
flow than has previously been possible. Finally, the subjects that were recruited for this study are able to
achieve higher oxygen consumptions compared to other exercise modalities, such as knee extension,
that typically activate much less than half of the body’s aerobic capacity. Using highly fit subjects will
also allow for measurements of flow at the high oxygen uptakes that they can attain and maintain. We
anticipate being able to measure some of the highest femoral artery blood flows with the highest
degree of accuracy possible.

5
Author YearMeasurement
TechniqueExercise Mode
Anatomical Location
VO2 MaxPeak Mechanical
Power Output
Saltin 1988 Thermodilution Knee Extension Femoral 6.8 L·min-1 -
Bangsbo 1992 Thermodilution Knee Extension Femoral 5.16 L·min-1 -
Radegran 1997Doppler &
ThermodilutionKnee Extension Femoral 2.85 L·min-1 50 W
Radegran and Saltin 1998 Doppler Knee extension Femoral 8.53 L·min-1 70 WSaltin et. al ,. 1998 Thermodilution Knee Extension Femoral 10 L·min-1 -Saltin et. al,. 1999 Doppler Knee Extension Femoral 10 L·min-1 -
Bangsbo 2000 Thermodilution Knee Extension Femoral 5.39 L·min-1 65.3 W
Radegran and Saltin 2000 Thermodilution Knee Extension Femoral 6.06 L·min-1 5.03 LO2·min-1 68 W
Hoelting et. al,. 2001 Doppler Knee Extension Femoral 2.16 L·min-1 3.43 LO2·min-1 16.2 W
Krustrup et.al, 2001 Thermodilution Knee Extension Femoral 4.32 L·min-1 65 WOsada and Radegran 2009 Doppler Knee Extension Femoral 6.4 L·min-1 40 W
Ridout et. al,. 2010 Doppler Knee Extension Femoral 2.1 L·min-1 3.19 LO2·min-1 40.4 W
Christensen 2013 Thermodilution Knee Extension Femoral 5 L·min-1 60 W
Garten et. al,. 2014 Doppler Knee Extension Femoral 4 L·min-1 3.65 LO2·min-1 25 W
Voliantis and Secher 2002 Thermodilution Arm Cycling Brachial 3 L·min-1 4.04 LO2·min-1 153 W
Gonzales et. al, 2007 DopplerHand Grip Ergometry
Brachial 0.1 L·min-1 4.2 W
Harms et. al,. 1997 Thermodilution Cycle Ergometer Femoral 18.7 L·min-1 4.4 LO2·min-1 150 W
Harms 1999 Doppler Cycle Ergometer Femoral 20.3 L·min-1 4.4 LO2·min-1 -
Wetter 1999 Thermodilution Cycle Ergometer Femoral 16.87 L·min-1 4.52 LO2·min-1 170 W
Proctor 2001 Thermodilution Cycle Ergometer Femoral 9.4 L·min-1 2.06 LO2·min-1 140 W
Alonso & Calbet 2003 Doppler Cycle Ergometer Femoral 2.6 L·min-1 4.7 LO2·min-1 -
Proctor et. al,. 2003 Doppler Cycle Ergometer Femoral 5.9 L·min-1 100 W
Murias et. al,. 2013 Near Infared Cycle Ergometer Femoral 14.6 L·min-1 4.2 LO2·min-1 -
Spectroscopy
Table 1 demonstrates previous research and different techniques of blood flow measurement across a number of intensities and modalities of exercise from hand grip exercises, knee extension exercises, along with high intensity cycling.
* indicates VO2 Max measured during experimental exercise
Peak Blood Flow
-
-
----
--
-
-
-
-
6
Problem
Currently, the body of knowledge of blood flow to the lower extremities is limited during
dynamic whole body exercise, such as cycling. Due to the previous limitations of the thermodilution
technique it has been impractical to continuously measure blood flow for an extended period of time.
Due to the limited body of knowledge along with the limitations previously encountered, it is necessary
to explore and quantify blood flow during high intensity exercise that recruits a larger muscle mass than
previous studies. It is also currently unknown what the interactions between the mechanical aspects of
cycling are with the limitations of the cardiovascular system.
This experiment could also demonstrate whether the mechanical interactions between the
body and the cycle ergometer or the limitations of the cardiovascular system are a greater contributor
to the changes in blood flow across a wide array of intensities. These data could allow for further
discovery leading to new knowledge of the limitations of blood flow and oxygen delivery on cycling
performance to resolve issues not yet reported in the scientific literature.
Significance
Findings from this study would contribute to the body of knowledge to allow future research on
blood flow during whole body high intensity exercise and potentially lead to new estimations of blood
flow based on workload during cycling. This study could also demonstrate the highest femoral artery
blood flows know in the currently available scientific literature that are closer to what could be
theoretically predicted based on previous research. In addition, this study allows for the evaluation of
some of the existing hypotheses that are used to describe the mechanisms associated with exercise
induced hyperemia.
7
Goals and Research Questions
1) What are the highest flows through the femoral artery during high intensity whole body
exercise?
2) Does the relationship of blood flow and work rate remain linear during higher intensity
exercise as it does during lower intensity knee extension exercises?
3) To observe and quantify blood flow through the femoral artery at varying intensities up to
the aerobic limit while simultaneously measuring oxygen uptake and the forces applied to
the external environment in order to determine possible mechanisms of fatigue, such as
blood occlusion.
Limitations
1) Convenience sampling was used to recruit subjects from a previously known pool of
highly trained cyclists in western Montana.
2) Synchronization of data from multiple sources and sampled at different frequencies
could lead to inconsistencies due to human error. All synchronization was done by one
person who was trained to ensure consistency.
3) Subjects’ lifestyles were not controlled for including training volume, fatigue, or amount
of exercise the day prior to testing.
4) Subjects were allowed exogenous carbohydrate intake along with water ad libidum
throughout their exercise bouts. Some subjects elected to ingest carbohydrate and
water while others did not.
8
Delimitations
1) All subjects that participated were highly trained competitive male endurance athletes.
Definition of Terms
• Thermodilution: A technique that uses a catheter to inject an iced saline solution into the
femoral artery in order to achieve a 1 degree Celsius drop in temperature to measure blood
flow. Previous studies have used differing amounts of the saline solution to achieve the needed
temperature drop. Generally between 90-180 ml/minute were injected for up to 1.5 seconds for
a one time measurement at the end of a trial (Andersen & Saltin 1984).
• Inert Gas Clearance Method (133 Xe): The 133Xe clearance technique involves injecting Xe133
that was dissolved in saline into the belly of the active muscle and determining the rate of
clearance using a scintillation crystal detector (Grimby et al., 1966).
• Doppler Effect/Doppler Shift: Using phase shift in the sound waves that are returned as an
object moves and provides data that can be converted to fluid velocity (Gill 1979, 1979 Herr et
al., 2010).

9
Chapter Two: Review of Literature
At the onset of exercise, the cardiovascular system increases cardiac output almost immediately
while simultaneously constricting vessels to non-contracting tissues such as organs and organ systems
like the gastrointestinal system (Radegran 1997, Saltin et al., 1985 Andersen & Saltin 1984). The
increase in blood flow to the exercising muscles, also known as exercise induced hyperaemia, begins
within 2-10 seconds after the onset of exercise (Saltin et al., 1998). Highly fit subjects have
demonstrated an increased ability to dilate their blood vessels in order to meet the demands of the
working muscles (Calbet et al., 2006 Walther et al., 2008). Some Olympic level athletes can have a
maximal cardiac output of over 30 L/min that can be predicted by examining the increases in absolute
VO2 while exercising; for every 1 L/minute increase in VO2 there is an expected increase of 5 L/minute in
cardiac output. Olympic athletes exercising at an average VO2 of 5.38 LO2 /min lead to a cardiac output
of 30.4 L/minute (Blomqvist & Saltin 1983 Saltin 1988). During cycling, cardiac output increases linearly
along with total oxygen delivery until 80% of peak power. After 80% of peak power there is a plateau in
cardiac output due to decreases in stroke volume due to the Frank-Starling mechanism. The demand for
blood is met by increases in heart rate to maintain cardiac output. Despite the changes in cardiac
output, both heart rate and oxygen consumption increase linearly until exercise can no longer be
maintained. Maximal oxygen delivery and blood flow occurred between 73-88% of maximal power
output during cycling (Brooks et al., 2005 Mortensen et al., 2005).
Previous research has been done that suggests that when a subject approaches their maximal
work capacity, blood flow is limited to the exercising muscles due to the demands of the chest muscles
and other muscles used in breathing. Oxygen demand of the breathing muscles can be around 10% of
total oxygen demand but up to 15% of total oxygen demand in highly fit athletes at a given work
intensity. When the work of breathing was either decreased or increased there were resulting changes
10
in the blood flow to the exercising limb. A 50% change in the work of breathing (Wb) lead to a change of
2 L/min of blood flow which is approximately 11% of the normal value. A drop in work of breathing also
allowed for a subject to work at a lower VO2 by 9.3% while performing the same task. These decreases
in the work of breathing also improved performance in time to exhaustion experiments done on a cycle
ergometer (Harms 1997 Harms 2000 Wetter 1999).
Previous studies have measured femoral artery blood flow of up to 9.1 L/min using knee
extension exercises up to 100 watts with VO2 measurements of up to 1.42 L O2 /min using a
thermodilution technique ( Andersen & Saltin 1984 Rowell et al., 1986 Richardson et al., 1993 Radegran
1999). Previous studies using knee extension exercises were able to achieve an absolute VO2 between .8
L/min and 1.42 L/min (Radegran 1999). Since VO2 and blood flow appear to be related it is important to
explore femoral artery blood flow at oxygen uptakes greater than 2 L/min. This increase in blood flow is
demonstrated by a 33 fold increase in absolute flow from approximately .3L/min at rest to up to 10
L/min to the working limb at the femoral artery at VO2 peak for knee extensor exercises. However, with
these large flows during knee extension exercises it is possible that if these results were generalized to
other modalities of exercise such as cycling, the demand for blood flow would exceed the heart’s ability
to produce the required cardiac output since cardiac output is relatively fixed (Richardson et al., 1995
Savard et al., 1989). This rise in blood flow is directly proportional with power output during knee
extension exercise up to maximal flows of 6-10 L/min at about 80% of the subject’s maximal oxygen
uptake (Rowell 1988 Saltin et al., 1998). Previous studies using a knee extension ergometer and
thermodilution culminated in a workload of 99 Watts and yielded flows through the femoral artery of up
to 10 L/min (Radegran 1999). These near instant adaptations to exercise work to meet the oxygen
demand of the exercise bout that the body has undertaken.

11
Historically, there have been many different attempts and techniques used to measure blood
flow in mammals and humans. These techniques all have inherent limitations that affect the accuracy of
their measurements. Some early attempts at measuring blood flows in mammals involved letting blood
from the subject. One of these early attempts was in 1887 in the levator labii superioris muscles of the
lip of a horse. While the horse was chewing oats, researchers collected blood without anesthesia
directly from the levator labii superioris muscles to measure blood flow (Chauveau & Kaufmann 1887).
In exercising humans, knee extension exercise has been the mode of choice for the study of blood flow
due to the ability to restrict movement in the leg and to isolate the amount of muscle mass that is active
during exercise. Knee extension exercise was coupled with the thermodilution technique to measure
blood flow at different work rates during exercise. This technique uses a catheter to inject an iced saline
solution into the femoral artery in order to achieve a 1 degree Celsius drop in temperature to measure
blood flow. Previous studies have used differing amounts of the saline solution to achieve the needed
temperature drop. Generally between 90-180 ml/minute, were injected for up to 1.5 seconds for a one
time measurement at the end of a trial (Andersen & Saltin 1984).
The thermodilution technique is limited in whole body exercise, such as cycling, due to subject
comfort with the catheter that must be placed into the subjects’ blood vessel. This technique is also
limited by it not being able to collect continuous date owing to the need to inject cooled saline into the
circulatory system. In order for this technique to continuously measure flow during exercise such a large
volume of saline would need to be introduced into the circulatory system that there is the potential for
oxygen carrying capacity of the blood to be changed and the potential for hypovolemia. Other
techniques have measured the clearance rates of inert isotopes of 133 Xenon (133Xe) from the belly of
working muscles. This technique has been shown to underestimate the blood flow when compared to
the thermodilution technique (Radegran 1999). The 133Xe method was potentially limited by the rate of
diffusion being lower than expected at higher intensity exercise out of the muscle belly leading to its

12
underestimation of blood flow (Bonde-Petersen 1975). Due to the limitations of the thermodilution and
Xe133 techniques, using ultrasound to measure blood flow was suggested in the late 1970s as a less
invasive alternative (Gill 1979, 1979 Grimby et al., 1966).
Using the Doppler Effect, calculation of blood velocity is possible so long as the angle of
approach of the Doppler probe is known or can be estimated (Gill 1985). Early studies using Doppler
ultrasound had RMS error rates of 14% and maximal random errors of 32% due to under and
overestimating the angle of insonation and artery diameter (Gill 1979, 1985). Flow is calculated by
determining the diameter of the artery based on the ultrasound videos collected from each trial along
with the blood flow velocities from each trial. Collection of blood velocity data along with acquiring
images of the artery has proven difficult over long periods when multiple ultrasound machines were
needed for both imagining and non-imaging data. Using a device to convert Doppler signal to an analog
signal via Fast Fourier transform (FFT) it is possible to collect data on any number of data acquisition
platforms. Having this technique available allows for real time data collection as opposed to using
multiple probes, multiple modes, or even multiple machines to collect data on blood flow during
exercise. This device was validated using a cornstarch solution that resembled blood cells on the
ultrasound machine. This solution was run through a loop of Tygon tubing and the known flow from the
pump was measured using the signal converter and Doppler ultrasound (Herr et al,. 2010).
13
Chapter Three: Methodology
Participants
Five male subjects (mean ± SD; Age: 33.2 ± 2.7 years; Mass: 65.25 ± 3.25 kg; VO2 max: 71.3 ± 3.4
mL O2 ·kg-1·min-1) who were currently training actively and competing as endurance athletes
volunteered and provided written informed consent in accordance with guidelines set by the
Institutional Review Board at the University of Montana.
Aerobic Metabolism
Rates of oxygen uptake (ml O2 ·kg-1·min-1) were determined by indirect calorimetry, using the
fractional and volumetric analysis of the subjects’ expired gases. The expired gas was collected and an
aliquot of expired gas was analyzed by a computerized metabolic system (TrueOne 2400, ParvoMedics,
Sandy Utah). Reported means from expired gases were determined from the measures obtained in the
final 2 minutes of each trial. Data are from the final 2 minutes of a 5 minute bout. Maximal rates of
oxygen uptake were determined from the greatest 30 second average obtained during the testing
procedures.
Cycle Ergometery
Subjects undertook a progressive discontinuous test to VO2 max test on a cycle ergometer
(Velotron, Racermate, Seattle, Washington). The subjects performed all testing at a constant cadence of
80 revolutions per minute, using pedal cranks of 0.165 m and completed 5 minute bouts of exercise until
they were unable to complete the bout despite putting forth a maximal effort. The test was initiated at a
power output of 130 watts and increased by an increment of 40 watts until the point of failure. Visual
feedback for cadence was provided to the subjects with a computer monitor connected to and mounted
within their field of view to ensure adherence to the prescribed cadence. Subjects were allowed as
much rest between trials as they needed to feel fully recovered and generally took 5 minutes between
14
trails at lesser power outputs and 15 minutes or more between higher power output trials. The
measurements of power output and cadence were obtained at 10 Hz using the Velotron package
software. Average pedal forces applied were estimated using the method described by Bundle &
Weyand 2011.
Equation 2:
ω•=
rPowerFpedal
Where Fpedal is the average force applied throughout a revolution, r is the ergometer crank arm and ω is
the angular velocity in units of radians per second.
Femoral Artery Blood Velocity
Pulsed Doppler ultrasound was used to insonate the right common femoral artery between the
bifurcation of the deep femoral artery and the inguinal ligament with a linear array transducer due to its
accuracy when measuring blood velocity in medium depth arteries (Acuson 8L5 Probe, 8.0 MHz,
Washington D.C. USA & Siemens Acuson Sequoia 512). The Doppler frequency spectrum data was
converted to a mean arterial velocity using the Fast Fourier transform (FFT) and a previously established
calibration relationship (Gallo 2014). The FFT and an analog transformation were performed with a
custom designed electronic device (DAT) described by Herr et al, 2010. The analog signals from the DAT
were recorded to a computer using an A/D board (Digidata 1330, Molecular Devices, California, USA)
that sampled at 3012 Hz.
The video record of the arterial sonogram was used to provide real-time feedback to the
researcher performing the insonation. This permitted more rapid replacement of the probe during
periods when the movement of the leg caused the probe to be focused on the adjacent tissues. Each
video record was also captured to a computer (Canopus ADVC-55, Quebec Canada), and used to exclude
portions of the data wherein the probe was not properly aligned with the femoral artery.
15
Arterial Diameter
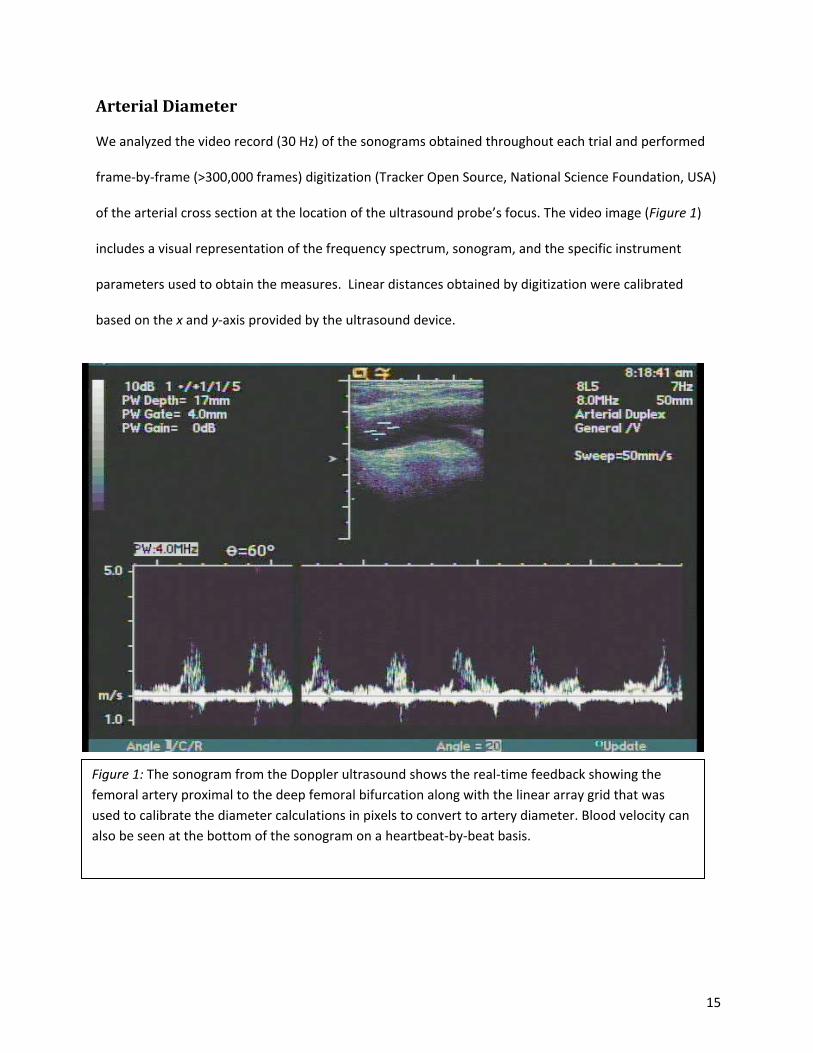
We analyzed the video record (30 Hz) of the sonograms obtained throughout each trial and performed
frame-by-frame (>300,000 frames) digitization (Tracker Open Source, National Science Foundation, USA)
of the arterial cross section at the location of the ultrasound probe’s focus. The video image (Figure 1)
includes a visual representation of the frequency spectrum, sonogram, and the specific instrument
parameters used to obtain the measures. Linear distances obtained by digitization were calibrated
based on the x and y-axis provided by the ultrasound device.
Figure 1: The sonogram from the Doppler ultrasound shows the real-time feedback showing the femoral artery proximal to the deep femoral bifurcation along with the linear array grid that was used to calibrate the diameter calculations in pixels to convert to artery diameter. Blood velocity can also be seen at the bottom of the sonogram on a heartbeat-by-beat basis.

16
We excluded from further analysis the regions of data where the video record indicated that the
ultrasound probe’s insonation focus was not within the lumen of the common femoral artery. In this
study the subjects completed a total of 176.5 minutes of cycling of which 37.36 minutes, or 21.2%, of
the video record was excluded from further analysis. We assessed the extent of exercise induced artery
dilation by comparing the artery diameters obtained at rest, prior to the initiation of the cycling bout, to
the mean value obtained throughout the effort. To evaluate the possibility of greater numbers of
excluded frames occurring during higher vs lower power output trials, we tallied the number of frames
excluded in the three least powerful vs three most powerful trials administered to the subjects. Of the
total number of frames 51% occurred in the lesser power trials whereas 49% in the trials with greater
power output.
Arterial Blood Flow
The artery diameter data obtained from the video record was synchronized to the blood velocity
data to obtain instantaneous measures of artery diameter and blood flow throughout each administered
bout of cycle ergometry. Single leg femoral artery blood flow was calculated as the product of artery
cross sectional area and the velocity of the blood traveling through this space in accordance with
Equation 3:
BVADFlowBlood •
=
2
2_ π
Where AD is the arterial diameter in centimeters and BV is blood velocity measured in cm·s-1. This
treatment considers the cross-sectional shape of the artery as a circle. Total blood flow to the legs was
considered to be twice the single leg value.
17
Analysis
The blood velocity, arterial diameter and blood flow data, were synchronized, conditioned and analyzed
on a revolution-by-revolution basis in a using a custom written software package (Igor Pro 6.37,
Wavemetrics, Oregon USA).
Data are presented as means with their respective standard deviations. Statistical comparisons (Paired
Samples T-Test) were performed with an a priori significance level of α =0.05.
18
Chapter Four: Results
Aerobic Metabolism
VO2 increased linearly with power output up to max for all subjects (slope: 0.7746 ± .429,
intercept: 0.13327 ± .63236, R2: 0.98 ± .02). VO2 max across subjects was 71.31 ± 1.1 mL O2 / kg·min-
1 and 4.64 ± .17 L O2 · min-1. Two subjects were unable to achieve the desired maximal oxygen uptake of
70 mL O2 / kg·min-1 (minimum VO2: 67.97 mL O2 / kg·min-1 and 4.53 L O2 · min-1). Respiratory Exchange
Ratios (RER) were 1.10 ± 0.01 (minimum: 1.053 maximum: 1.12) across subjects indicating reliable
measures of VO2 max in the discontinuous power incremented cycling protocol.
Cycle Ergometer
Participants undertook the incremental protocol with all of the subjects completing the following bouts:
130W, 170 W, 210W, 250W, 290W and 330W. Three of the subjects reached the point of failure during
the 370W trial and the remaining two were unable to complete the 410W bout. From the measured
maximal oxygen uptakes and the highly linear relationships of VO2 and mechanical power output we
interpolated the minimum wattage necessary to elicit each subject’s VO2 max (370 ± 21 W). The power
outputs, obtained during the constant cadence trials, were achieved with average forces applied against
the pedals of the cycle ergometer of 94 N, 123 N, 152 N, 181 N, 210 N, 239 N, 268 N, and 297 N,
respectively.

19
Femoral Artery Blood Velocity
The per trial means of arterial blood velocity generally increased in relation to trial power
output and the greater metabolic demand of the working tissue (Figure 2). Mean trial velocities were
the least at 170 W with a velocity of 11.5 ± 5.3 cm s-1 and reached 15.9 ± 5.4 cm s-1 at the greatest
common power output. The greatest mean velocity measure obtained in the study was obtained with
an intermediate power output of 250 W.
Figure 2: Single leg femoral artery blood velocity at varying power outputs for all subjects. Part A shows a single subjects’ blood velocity (130W, 170W, 210W, 250W, 290W, 330W, 370W, and 410W) while Part B shows group averages of blood velocity at all common power outputs (130W, 170W, 210W, 250W, 290W, 330W, and 370W).
20
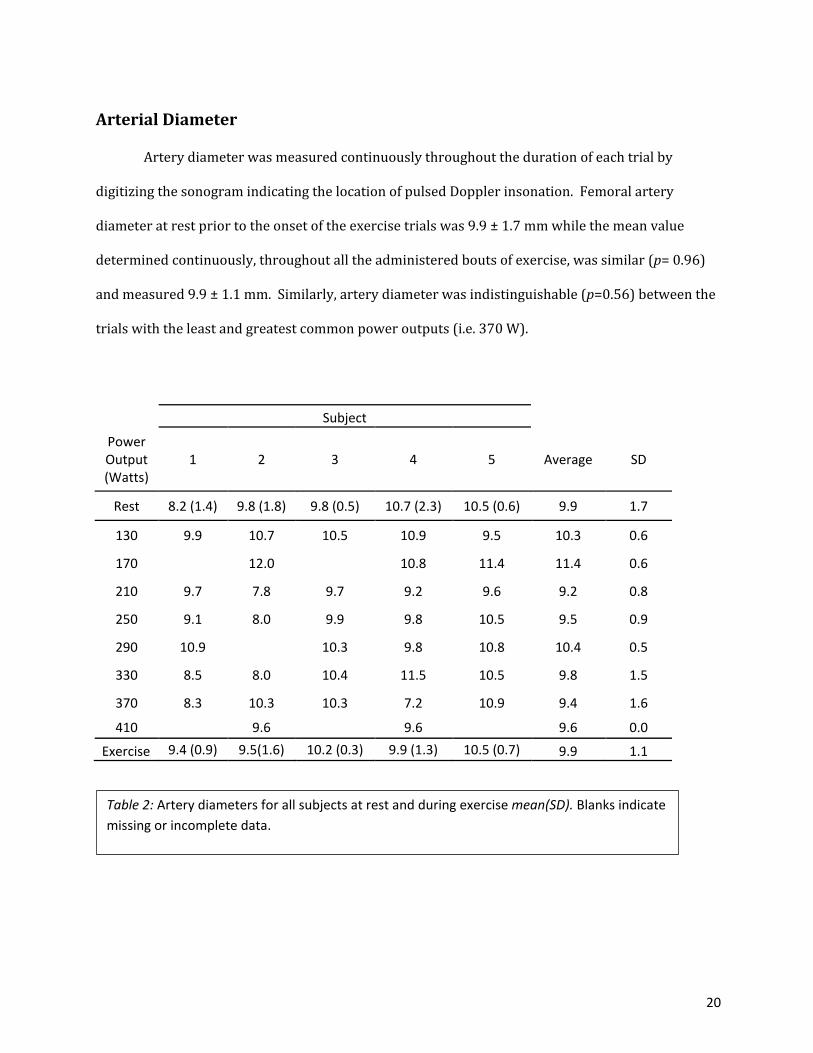
Arterial Diameter
Artery diameter was measured continuously throughout the duration of each trial by
digitizing the sonogram indicating the location of pulsed Doppler insonation. Femoral artery
diameter at rest prior to the onset of the exercise trials was 9.9 ± 1.7 mm while the mean value
determined continuously, throughout all the administered bouts of exercise, was similar (p= 0.96)
and measured 9.9 ± 1.1 mm. Similarly, artery diameter was indistinguishable (p=0.56) between the
trials with the least and greatest common power outputs (i.e. 370 W).
Subject
Power Output (Watts)
1 2 3 4 5 Average SD
Rest 8.2 (1.4) 9.8 (1.8) 9.8 (0.5) 10.7 (2.3) 10.5 (0.6) 9.9 1.7
130 9.9 10.7 10.5 10.9 9.5 10.3 0.6
170 12.0 10.8 11.4 11.4 0.6
210 9.7 7.8 9.7 9.2 9.6 9.2 0.8
250 9.1 8.0 9.9 9.8 10.5 9.5 0.9
290 10.9 10.3 9.8 10.8 10.4 0.5
330 8.5 8.0 10.4 11.5 10.5 9.8 1.5
370 8.3 10.3 10.3 7.2 10.9 9.4 1.6
410 9.6 9.6 9.6 0.0
Exercise 9.4 (0.9) 9.5(1.6) 10.2 (0.3) 9.9 (1.3) 10.5 (0.7) 9.9 1.1
Table 2: Artery diameters for all subjects at rest and during exercise mean(SD). Blanks indicate missing or incomplete data.

21
Arterial Blood Flow
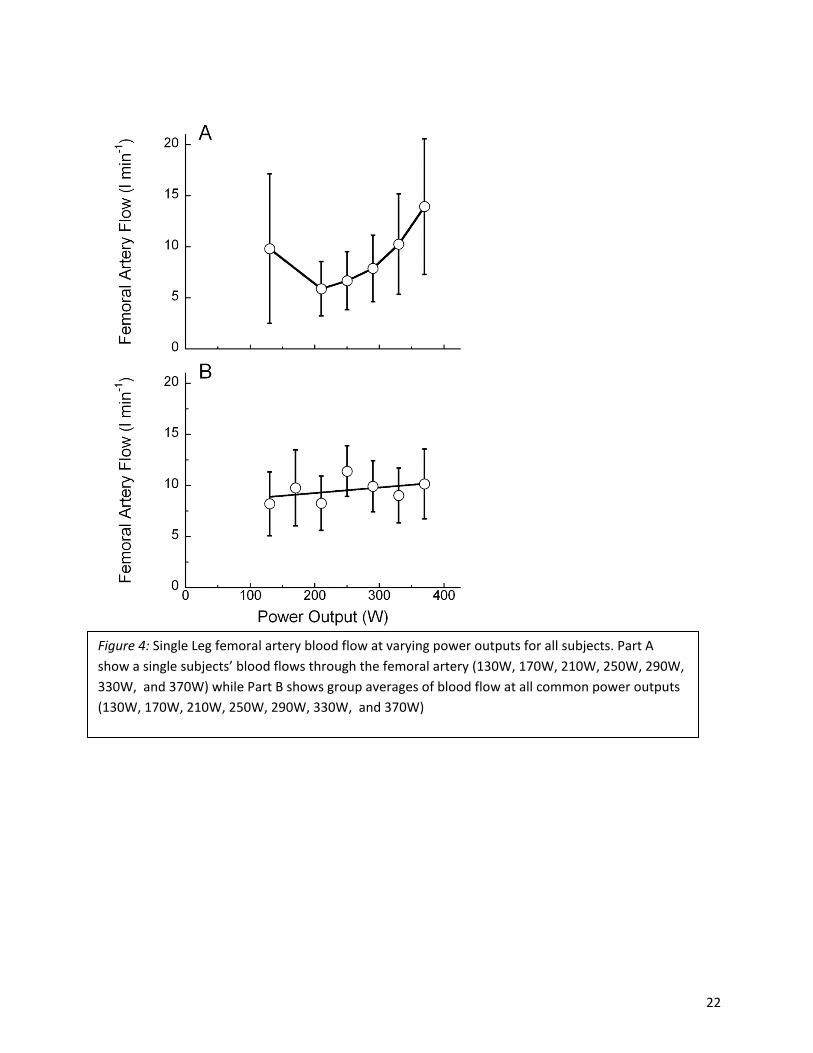
The per trial means of single leg arterial blood flow increased with trial power output up to the level
eliciting the maximum blood velocity, i.e. 250 W and were 11.4 l min-1(Fig. 3 & Fig. 4). At greater power
outputs the measured values of flow were largely unchanged or even decreased slightly. Specifically,
flow values averaged 9.7 ± 0.6 l min-1 across the three greatest common power outputs administered.
Thus the greater rates of oxygen uptake were achieved with relatively lesser volumes of femoral artery
blood flow during the most demanding trials that the subjects completed. The single leg values
presented indicate that up to 22.8 l min-1 was delivered to both legs during the cycle ergometry trials
administered.
Figure 3: Single leg femoral artery blood flow fluctuations across the length of a 5 minute bout of cycling for one subject.
22
Figure 4: Single Leg femoral artery blood flow at varying power outputs for all subjects. Part A show a single subjects’ blood flows through the femoral artery (130W, 170W, 210W, 250W, 290W, 330W, and 370W) while Part B shows group averages of blood flow at all common power outputs (130W, 170W, 210W, 250W, 290W, 330W, and 370W)
23
Chapter Five: Discussion
The goal of this study was to obtain femoral artery blood flow measures in highly fit subjects
during exercise intensities representing the upper limit of cardiovascular and respiratory function. Here
we were largely successful. We obtained continuous, simultaneous, and direct measures of the two
contributing components of blood flow, blood velocity and femoral artery diameter, during cycle
ergometry at varying power outputs from 130 to 410 Watts. The incremental protocol used permitted
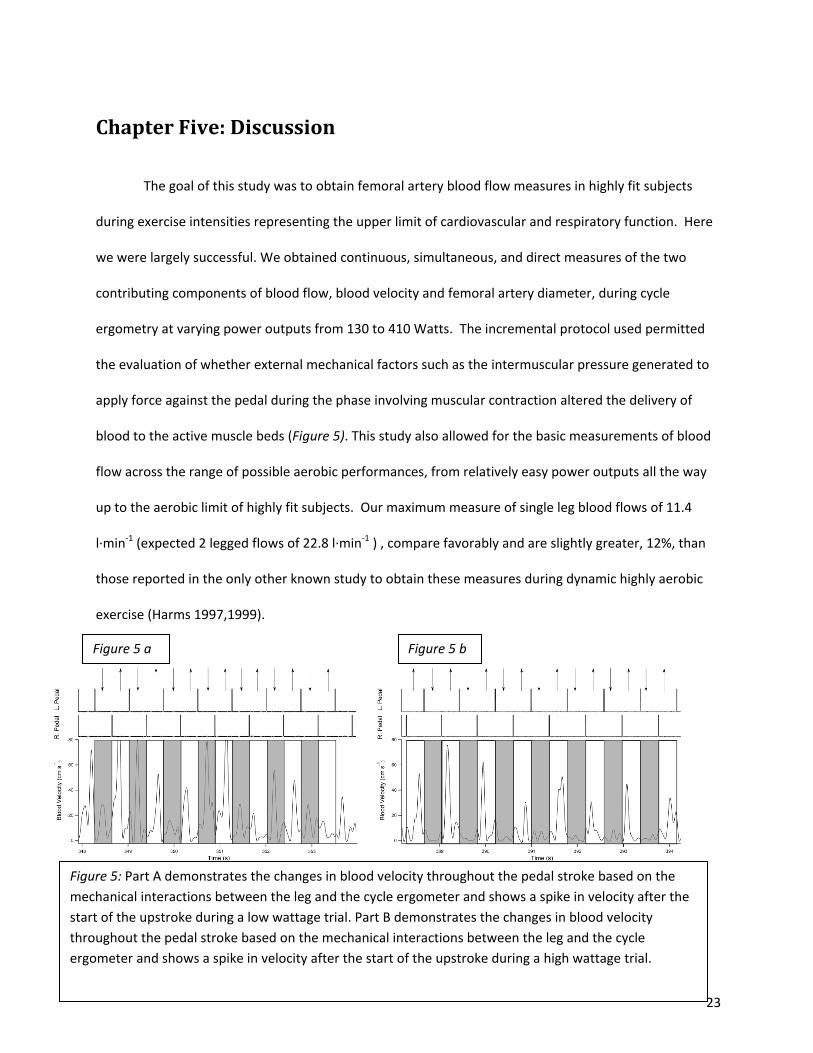
the evaluation of whether external mechanical factors such as the intermuscular pressure generated to
apply force against the pedal during the phase involving muscular contraction altered the delivery of
blood to the active muscle beds (Figure 5). This study also allowed for the basic measurements of blood
flow across the range of possible aerobic performances, from relatively easy power outputs all the way
up to the aerobic limit of highly fit subjects. Our maximum measure of single leg blood flows of 11.4
l·min-1 (expected 2 legged flows of 22.8 l·min-1 ) , compare favorably and are slightly greater, 12%, than
those reported in the only other known study to obtain these measures during dynamic highly aerobic
exercise (Harms 1997,1999).
Figure 5 a Figure 5 b
Figure 5: Part A demonstrates the changes in blood velocity throughout the pedal stroke based on the mechanical interactions between the leg and the cycle ergometer and shows a spike in velocity after the start of the upstroke during a low wattage trial. Part B demonstrates the changes in blood velocity throughout the pedal stroke based on the mechanical interactions between the leg and the cycle ergometer and shows a spike in velocity after the start of the upstroke during a high wattage trial.

24
Vasculature Requirements for High Rates of Aerobic Metabolism:
For subjects to meet the high metabolic demands of strenuous aerobic exercise there are two
main options available to increase the delivery of oxygen to mitochondria, either increase the flow of
oxygen or increase the extraction of oxygen from the blood in the working tissue beds. The measured
oxygen consumption rates of 4.64 ± 0.17 LO 2 ·min-1 support a predicted cardiac output of greater than
30 l·min-1 , further suggesting blood flows up to 15 l min-1 occurring in the femoral artery of each leg
(Astrad et al., 1963 Hermansen et al., 1970). Our observation of similar levels of femoral artery blood
flow within the 3 greatest common power outputs, Figure 2, suggests that during the trials administered
the cardio-respiratory system of these subjects utilized both strategies, primarily relying on increased
delivery at low and modest intensity efforts and extracting greater fractions of oxygen during the trials
requiring the greatest metabolic rates. The measured velocity data further inform the circulatory flow
patterns used by the subjects during these trials. The generally increasing trial average blood velocities,
Figure 2, used to support higher power outputs produced similar arterial flow rates within the
contraction cycle. The most likely explanation for these results is the peak velocities necessary to
elevate the trial average velocity values occurred during lesser fractions of the contraction cycle during
greater vs lesser power outputs. These data suggest applied pedal forces of 181 N and greater are
sufficient to alter the periods within the cycling revolution when blood is able to reach the muscular
beds.
25
Arterial Diameter:
The data indicate that the femoral artery diameter changes little with the onset of exercise nor
does this artery appear to dilate during intense aerobic exercise. Here we measured arterial diameter
continuously throughout the bouts of exercise. These measures suggest the long held practice of many
laboratory groups of using a single arterial sonogram obtained at rest either prior or subsequent to
exercise provides a reliable estimate of lumen size for the common femoral artery (Hoelting et al., 2001
Osada & Radegran 2009). Using a representative femoral artery diameter at the onset of exercise would
help to eliminate a significant amount of data analysis and artery digitization due to the lack of change in
diameter during exercise. This is especially useful during dynamic tasks similar to the cycle ergometry
used here because of the generally slow refresh rate of the sonogram imagery which lessens the quality
of the video record and contributes to the inability to fully automate this analysis step. Previous
research indicates an average femoral artery diameter of 10. ± 1.0 mm in healthy and active males with
similar ages to the subjects in this study (Sandgren et al., 1999).
Arterial Blood Flow:
Following the onset of an exercise workload, arterial flow progressively increased for the first
35-40 s before reaching the steady state level maintained throughout the remainder of the effort. The
increases seen at the beginning of each trial followed a similar time course to the increases in oxygen
uptake occurring during this same period (Krustrup et al., 2009). Blood flow increased 5-fold during the
initial period and varied by as much as 6.6-fold between the onset of exercise and the peak flow
measured in the 370W trial illustrated in Figure 4. While our data represent the greatest blood flows yet
measured during exercise, we did not observe the same highly-linear trends as observed by Saltin and
colleagues and many others during knee extension exercises (Table 1) (Saltin et al., 1985). Moreover,
their observed blood flows of up to 9 l·min-1 obtained during single leg knee extension exercise, and
those of many studies presented in Table 1, are by comparison surprisingly large, given our greatest

26
measure was only 25.5% higher than these, but was elicited from an activity that uses roughly 2-fold
more muscle and rates of oxygen uptake that are similarly 2-fold greater (Sundberg & Bundle 2015).
Previous reports of femoral artery blood flow during cycling reported flows in excess of 20 l·min-1 for
two legged flows whereas our numbers are reported as single leg values as we only measured one leg
during cycling. While flows in both femoral arteries should be roughly equal during cycling we are
unable to directly verify this based on our methodology (Harms 1997 Harms 1999).
Limitations and other considerations:
Due to the methods used in this study our measures of blood flow are conservative because we
eliminated portions of the data set during which time the ultrasound probe was not focused in the
center of the femoral artery, we used a filtering routine to remove spurious short duration spikes in
velocity, and we reported the trial means as 20-second averages obtained during the final two minutes
of the trial to most appropriately compare these measures with the steady state rates of oxygen uptake
we also obtained from these trials. Additional limitations with the method used caused the Doppler
ultrasound probe to not be on the artery for the full trial due to the modality of exercise involving rapid
leg movement which resulted in the probe occasionally being on the femoral vein or other adjacent
tissue.
With our current methods there are also limitations in our ability to measure artery diameter
with the same precision as blood velocity. Using the Digidata and A/D board we were able to sample
data at 3012 Hz whereas the artery diameter was measured from 30Hz video. However, the refresh rate
of the sonogram image was essentially 10Hz, and occasionally several consecutive frames of data
needed to be omitted from the digitizing procedure because no clear image was visible in the sonogram,
despite accurate measures from the pulsed Doppler portion of the equipment. This discrepancy in
sampling frequency could lead to a lower precision in blood flow measurements owing to the need for

27
interpolation of data points needed in order to successfully analyze the data that was collected.
Additional work on analysis methods and further modification of equipment is required in order to have
a more similar refresh and sampling rate between the Doppler ultrasound sonogram and the blood
velocity data that is recorded digitally.
While this study provides significant insight into the changes in femoral artery blood flow across
a wide range of power outputs and blood flow fluctuations during exercise, there is still work that
remains to further the understanding of femoral artery blood flow during cycling. In these experiments
we observed the highest femoral artery blood flows known to science.
28
References
Andersen, P., & Saltin, B. (1985). Maximal perfusion of skeletal muscle in man. The Journal of
Physiology, 366(1), 233-249. doi:10.1113/jphysiol.1985.sp015794
Bangsbo, J., Gonzalez-Alonso, J., Boushel, R., Krustrup, P., & Saltin, B. (2000). Muscle oxygen kinetics at
onset of intense dynamic exercise in humans. The American Journal of Physiology, 279(3), R899
Bangsbo, J., Graham, T. E., Kiens, B., & Saltin, B. (1992). Elevated muscle glycogen and anaerobic energy
production during exhaustive exercise in man. The Journal of Physiology, 451(1), 205-227
doi:10.1113/jphysiol.1992.sp019161
Bonde-Petersen, F., Henriksson, J., & Lundin, B. R. (1975). Blood flow in thigh muscle during bicycling
exercise at varying work rates.European Journal of Applied Physiology and Occupational
Physiology, 34(1), 191-197. doi:10.1007/BF00999932
Brian D. Hoelting, Barry W. Scheuermann, & Thomas J. Barstow. (2001). Effect of contraction frequency
on leg blood flow during knee extension exercise in humans. Journal of Applied Physiology, 91(2),
671-679. Retrieved from http://jap.physiology.org/content/91/2/671
Brooks, G. A., Baldwin, K., & Fahey, T. D. (2005). Exercise physiology human bioenergetics and its
applications (4. ed. ed.). Boston [u.a.]: McGraw-Hill

29
Calbet, J. A. L., Lundby, C., Sander, M., Robach, P., Saltin, B., & Boushel, R. (2006). Effects of ATP-induced
leg vasodilation on VO2 peak and leg O2 extraction during maximal exercise in humans. AJP -
Regulatory, Integrative and Comparative Physiology, 291(2), R453.
doi:10.1152/ajpregu.00746.2005
Cardiovascular adaptationsto physical training (1983). Ann. Rev. Physiol.
Chauveau, M. A., & Kaufmann, M. (1887). Experiences pour la determination du coefficient de l'activite
nutritive et respiratoire des muscles en respos et en travail. C.R. Acad. Scie., Paris, (104), 1125-1131
Craig A. Harms, Mark A. Babcock, Steven R. McClaran, David F. Pegelow, Glenn A. Nickele, William B.
Nelson, & Jerome A. Dempsey. (1997). Respiratory muscle work compromises leg blood flow during
maximal exercise. Journal of Applied Physiology, 82(5), 1573-1583. Retrieved
from http://jap.physiology.org/content/82/5/1573
Craig A. Harms, Thomas J. Wetter, Claudette M. St. Croix, David F. Pegelow, & Jerome A. Dempsey.
(2000). Effects of respiratory muscle work on exercise performance. Journal of Applied
Physiology, 89(1), 131-138. Retrieved from http://jap.physiology.org/content/89/1/131
Craig A. Harms, Thomas J. Wetter, Steven R. McClaran, David F. Pegelow, Glenn A. Nickele, William B.
Nelson, . . . Jerome A. Dempsey. (1998). Effects of respiratory muscle work on cardiac output and
its distribution during maximal exercise. Journal of Applied Physiology, 85(2), 609-618. Retrieved
from http://jap.physiology.org/content/85/2/609
30
David N. Proctor, Sean C. Newcomer, Dennis W. Koch, Khoi U. Le, David A. MacLean, & Urs A.
Leuenberger. (2003). Leg blood flow during submaximal cycle ergometry is not reduced in healthy
older normally active men. Journal of Applied Physiology, 94(5), 1859-1869.
doi:10.1152/japplphysiol.00898.2002
Fick, A. (1870). Ueber die messugn de blutquantums in der herzenventrikeln. Sitzugn Der. Phys Med
Gesell Zu Warburg, (36)
G. K. Savard, B. Nielsen, J. Laszczynska, B. E. Larsen, & B. Saltin. (1988). Muscle blood flow is not reduced
in humans during moderate exercise and heat stress. Journal of Applied Physiology, 64(2), 649-657.
Retrieved from http://jap.physiology.org/content/64/2/649
G. Rådegran. (1997). Ultrasound doppler estimates of femoral artery blood flow during dynamic knee
extensor exercise in humans. Journal of Applied Physiology, 83(4), 1383-1388. Retrieved
from http://jap.physiology.org/content/83/4/1383
G. Rådegran, & B. Saltin. (1999). Nitric oxide in the regulation of vasomotor tone in human skeletal
muscle. American Journal of Physiology - Heart and Circulatory Physiology, 276(6), 1951-1960.
Retrieved from http://ajpheart.physiology.org/content/276/6/H1951
G. Rådegran, & B. Saltin. (2000). Human femoral artery diameter in relation to knee extensor muscle
mass, peak blood flow, and oxygen uptake. American Journal of Physiology - Heart and Circulatory
Physiology, 278(1), 162-167. Retrieved from http://ajpheart.physiology.org/content/278/1/H162
G. Rådegran, E. Blomstrand, & B. Saltin. (1999). Peak muscle perfusion and oxygen uptake in humans:
Importance of precise estimates of muscle mass. Journal of Applied Physiology, 87(6), 2375-2380.
Retrieved from http://jap.physiology.org/content/87/6/2375

31
Gallo, T. L. (2014). Continuous measures of muscle blood flow during all-out dynamic exercise. Retrieved
from http://scholarworks.umt.edu/etd/4292
Garten, R. S., Groot, H. J., Rossman, M. J., Gifford, J. R., & Richardson, R. S. (2014). The role of muscle
mass in exercise-induced hyperemia. Journal of Applied Physiology (Bethesda, Md. : 1985), 116(9),
1204-1209. doi:10.1152/japplphysiol.00103.2014
Gill, R. W. (1979a). Performance of the mean frequency doppler modulator. Ultrasound in Medicine &
Biology, 5(3), 245,247. doi:10.1016/0301-5629(79)90015-2
Gill, R. W. (1979b). Measurement of blood flow by ultrasound: Accuracy and sources of erro Ultrasound
in Med & Biol.
Gonzalez-Alonso, J., & Calbet, J. A. L. (2003). Reductions in systemic and skeletal muscle blood flow and
oxygen delivery limit maximal aerobic capacity in humans. Circulation, 107(6), 824-830.
doi:10.1161/01.CIR.0000049746.29175.3F
Grimby, G., Häggendal, E., & Saltin, B. (1967). Local xenon 133 clearance from the quadriceps muscle
during exercise in man. Journal of Applied Physiology, 22(2), 305. Retrieved
from http://www.ncbi.nlm.nih.gov/pubmed/6017900
Hill, A. V., & Lupton, H. (1923). Muscular exercise, lactic acid, and the supply and utilization of
oxygen. Q.J.M, , 135
Hoppeler, H., & Weibel, E. R. (1998). Limits for oxygen and substrate transport in mammals. Journal of
Experimental Biology, 201(8), 1051. Retrieved
from http://jeb.biologists.org/cgi/content/abstract/201/8/1051
Hoppeler, H., & Weibel, E. R. (2000). Structural and functional limits for oxygen supply to muscle. Acta
Physiologica, 168(4), 445-456. doi:10.1046/j.1365-201x.2000.00696.x
32
Jens Bangsbo, Peter Krustrup, José González-Alonso, & Bengt Saltin. (2001). ATP production and
efficiency of human skeletal muscle during intense exercise: Effect of previous exercise. American
Journal of Physiology - Endocrinology and Metabolism, 280(6), 956-964. Retrieved
from http://ajpendo.physiology.org/content/280/6/E956
Joaquin U. Gonzales, Benjamin C. Thompson, John R. Thistlethwaite, Allison J. Harper, & Barry W.
Scheuermann. (2007). Forearm blood flow follows work rate during submaximal dynamic forearm
exercise independent of sex. Journal of Applied Physiology, 103(6), 1950-1957.
doi:10.1152/japplphysiol.00452.2007
John N. Maina, & John B. West. (2005). Thin and strong! the bioengineering dilemma in the structural
and functional design of the blood-gas barrier. Physiological Reviews, 85(3), 811-844.
doi:10.1152/physrev.00022.2004
Jose A. L. Calbet, Jose Gonzalez-Alonso, Jörn W. Helge, Hans Søndergaard, Thor Munch-Andersen,
Robert Boushel, & Bengt Saltin. (2007). Cardiac output and leg and arm blood flow during
incremental exercise to exhaustion on the cycle ergometer. Journal of Applied Physiology, 103(3),
969-978. doi:10.1152/japplphysiol.01281.2006
Juan M. Murias, Matthew D. Spencer, Daniel A. Keir, & Donald H. Paterson. (2013). Systemic and vastus
lateralis muscle blood flow and O2 extraction during ramp incremental cycle exercise. American
Journal of Physiology - Regulatory, Integrative and Comparative Physiology, 304(9), 720-725.
doi:10.1152/ajpregu.00016.2013
K. I. Norton, M. D. Delp, C. Duan, J. A. Warren, & R. B. Armstrong. (1990). Hemodynamic responses
during exercise at and above VO2max in swine. Journal of Applied Physiology, 69(5), 1587-1593.
Retrieved from http://jap.physiology.org/content/69/5/1587
33
Liguzinski, P., & Korzeniewski, B. (2007). Oxygen delivery by blood determines the maximal VO2 and
work rate during whole body exercise in humans: In silico studies. American Journal of Physiology
[H.W. Wilson - GS], 293(1), H343. Retrieved from http://search.proquest.com/docview/201278703
Matthew W. Bundle, Carrie L. Ernst, Matthew J. Bellizzi, Seth Wright, & Peter G. Weyand. (2006). A
metabolic basis for impaired muscle force production and neuromuscular compensation during
sprint cycling. American Journal of Physiology - Regulatory, Integrative and Comparative
Physiology, 291(5), 1457-1464. doi:10.1152/ajpregu.00108.2006
Michael D. Herr, Cynthia S. Hogeman, Dennis W. Koch, Anandi Krishnan, Afsana Momen, & Urs A.
Leuenberger. (2010). A real-time device for converting doppler ultrasound audio signals into fluid
flow velocity. American Journal of Physiology - Heart and Circulatory Physiology, 298(5), 1626-1632.
doi:10.1152/ajpheart.00713.2009
Osada, T., & Radegran, G. (2009). Femoral artery blood flow and its relationship to spontaneous
fluctuations in rhythmic thigh muscle workload. Clinical Physiology and Functional Imaging, 29(4),
277-292. doi:10.1111/j.1475-097X.2009.00868.x
Peter D. Wagner (1993). Algebraic analysis of the determinants of V02,max
Peter G. Weyand, Cherie S. Lee, Ricardo Martinez-Ruiz, Matthew W. Bundle, Matthew J. Bellizzi, & Seth
Wright. (1999). High-speed running performance is largely unaffected by hypoxic reductions in
aerobic power. Journal of Applied Physiology, 86(6), 2059-2064. Retrieved
from http://jap.physiology.org/content/86/6/2059
Peter Krustrup, José González-Alonso, Bjørn Quistorff, & Jens Bangsbo. (2001). Muscle heat
production and anaerobic energy turnover during repeated intense dynamic exercise in
humans. The Journal of Physiology, 536(3), 947-956. doi:10.1111/j.1469-7793.2001.00947.x

34
R. S. Richardson, D. C. Poole, D. R. Knight, S. S. Kurdak, M. C. Hogan, B. Grassi, . . . P. D. Wagner. (1993).
High muscle blood flow in man: Is maximal O2 extraction compromised? Journal of Applied
Physiology, 75(4), 1911-1916. Retrieved from http://jap.physiology.org/content/75/4/1911
Radegran, G., & Saltin, B.Muscle blood flow at onset of dynamic exercise
Richardson, R. S., Kennedy, B., Knight, D. R., & Wagner, P. D. (1995). High muscle blood flows are not
attenuated by recruitment of additional muscle mass. AJP - Heart and Circulatory
Physiology, 269(5), H1545. Retrieved
from http://ajpheart.physiology.org/cgi/content/abstract/269/5/H1545
Ridout, S., Parker, B., Smithmyer, S., Gonzales, J., Beck, K., & Proctor, D. (2009). Age and sex influence
the balance between maximal cardiac output 5 and peripheral vascular
reserve doi:10.1152/japplphysiol.00985.2009
Roach, R. C., Koskolou, M. D., Calbet, J. A. L., & Saltin, B. (1999). Arterial O2 content and tension in
regulation of cardiac output and leg blood flow during exercise in humans. Retrieved
from http://hdl.handle.net/10553/6527
Rowell, L. B., Saltin, B., Kiens, B., & Christensen, N. J. (1986). Is peak quadriceps blood flow in humans
even higher during exercise with hypoxemia? AJP - Heart and Circulatory Physiology, 251(5), H1038.
Retrieved from http://ajpheart.physiology.org/cgi/content/abstract/251/5/H1038
Rowell, L. (2005). Maximal muscle blood flow during contractions, in situ compared to in vivo Medicine
and Science In Sports and Exercise
Roy, T. K., & Secomb, T. W. (2014). Theoretical analysis of the determinants of lung oxygen diffusing
capacity. Journal of Theoretical Biology, 351, 1-8. doi:10.1016/j.jtbi.2014.02.009

35
S Volianitis, & N H Secher. (2002). Arm blood flow and metabolism during arm and combined arm and
leg exercise in humans. The Journal of Physiology, 544(3), 977-984.
doi:10.1113/jphysiol.2002.023556
Saltin MD, B. (1985). Hemodynamic adaptations to exercise Am J Cardiol.
Saltin, B., Radegran, G., Koskolou, M. D., & Roach, R. C. (1998). Skeletal muscle blood flow in humans
and its regulation during exercise. Acta Physiologica, 162(3), 421-436. doi:10.1046/j.1365-
201X.1998.0293e.x
Sandgren, T., Sonesson, B., Ahlgren, Å R., & Länne, T. (1999). The diameter of the common femoral
artery in healthy human: Influence of sex, age, and body size. Journal of Vascular Surgery, 29(3),
503-510. doi:10.1016/S0741-5214(99)70279-X
Siebenmann, C., Rasmussen, P., Sørensen, H., Zaar, M., Hvidtfeldt, M., Pichon, A., . . . Lundby, C. (2015).
Cardiac output during exercise: A comparison of four methods. Scandinavian Journal of Medicine &
Science in Sports, 25(1), e27. doi:10.1111/sms.12201
Sjogaard, G., Savard, G., & Juel, C. (1988). Muscle blood flow during isometric activity and its relation to
muscle fatigue
Stefan P Mortensen, Ellen A Dawson, Chie C Yoshiga, Mads K Dalsgaard, Rasmus Damsgaard, Niels H
Secher, & José González-Alonso. (2005). Limitations to systemic and locomotor limb muscle
oxygen delivery and uptake during maximal exercise in humans. The Journal of Physiology, 566(1),
273-285. doi:10.1113/jphysiol.2005.086025
Sundberg, C. W., & Bundle, M. W. (2015). Influence of duty cycle on the time course of muscle fatigue
and the onset of neuromuscular compensation during exhaustive dynamic isolated limb
36
exercise. American Journal of Physiology. Regulatory, Integrative and Comparative
Physiology, 309(1), R51. doi:10.1152/ajpregu.00356.2014
Taylor, C. R., Weibel, E. R., Weber, J. M., Vock, R., Hoppeler, H., Roberts, T. J., & Brichon, G. (1996).
Design of the oxygen and substrate pathways. I. model and strategy to test symmorphosis in a
network structure. Journal of Experimental Biology, 199(8), 1643. Retrieved
from http://jeb.biologists.org/cgi/content/abstract/199/8/1643
Wagner, P. D. (1996). Determinants of maximal oxygen transport and utilization. Annual Review of
Physiology, 58(1), 21-50. doi:10.1146/annurev.ph.58.030196.000321
Wagner, P. D. (2000). Diffusive resistance to O2 transport in muscle. Acta Physiologica, 168(4), 609-614.
doi:10.1046/j.1365-201x.2000.00712.x
Walther, G., Nottin, S., Karpoff, L., Perez-Martin, A., Dauzat, M., & Obert, P. (2008). Flow-mediated
dilation and exercise-induced hyperaemia in highly trained athletes: Comparison of the upper and
lower limb vasculature. Acta Physiologica, 193(2), 139-150. doi:10.1111/j.1748-1716.2008.01834.x
Weibel M.D., E. (1984). The pathway for oxygen structure and function in the mammalian respiratory
system Harvard University Press
Weibel, E. R., Taylor, C. R., Weber, J. M., Vock, R., Roberts, T. J., & Hoppeler, H. (1996). Design of the
oxygen and substrate pathways. VII. different structural limits for oxygen and substrate supply to
muscle mitochondria. Journal of Experimental Biology, 199(8), 1699. Retrieved
from http://jeb.biologists.org/cgi/content/abstract/199/8/1699
37
Weibel, E. R., Richard Taylor, C., & Hoppeler, H. (1992). Variations in function and design: Testing
symmorphosis in the respiratory system. Respiration Physiology, 87(3), 325-348. doi:10.1016/0034-
5687(92)90015-O
Wetter, T. J., Harms, C. A., Nelson, W. B., Pegelow, D. F., & Dempsey, J. A. (1999). Influence of
respiratory muscle work on VO2 and leg blood flow during submaximal exercise. Journal of Applied
Physiology, 87(2), 643. Retrieved from http://jap.physiology.org/cgi/content/abstract/87/2/643


![FEMORAL IMPACT RESPONSE AND FRACTURE USA · mechanisms of femoral fracture [2,8], 3) femoral fracture tolerance [8-16], and 4) methods of laboratory evaluation of femoral fracture](https://img.pdfslide.us/doc/110x75/5eb7edd6b932f93c7837f9c5/femoral-impact-response-and-fracture-mechanisms-of-femoral-fracture-28-3-femoral.jpg)