Embed Size (px)
Citation preview
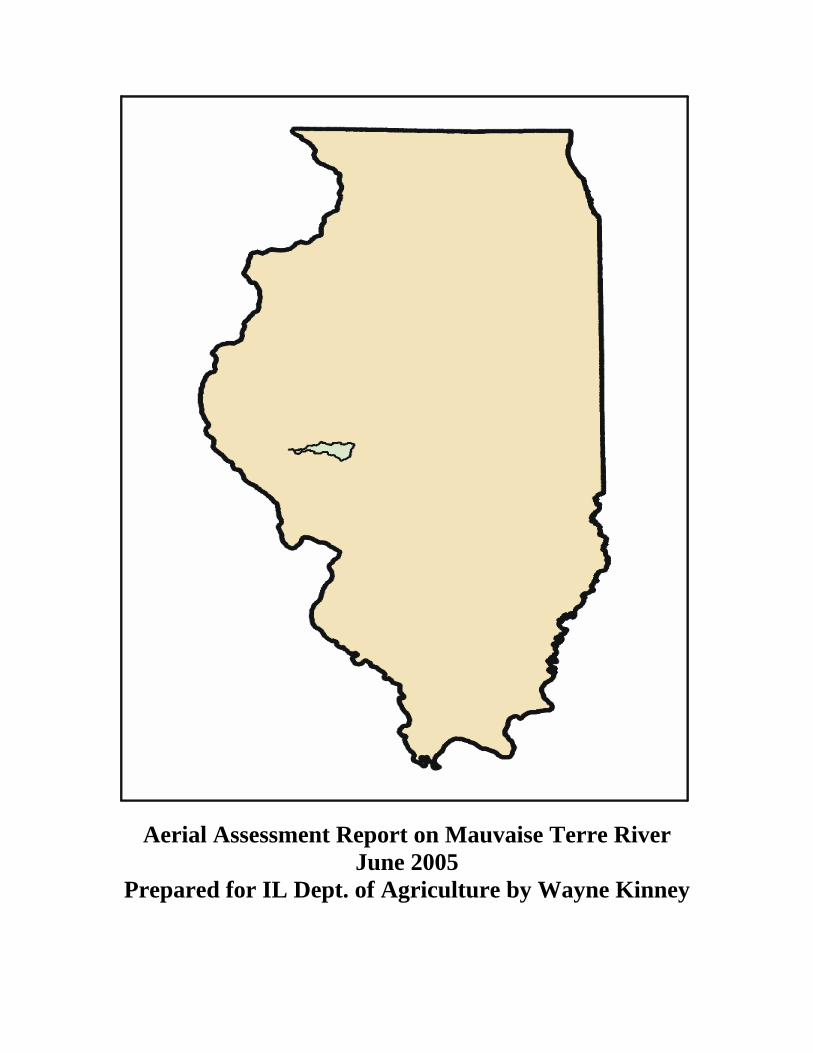
Aerial Assessment Report on Mauvaise Terre River June 2005
Prepared for IL Dept. of Agriculture by Wayne Kinney
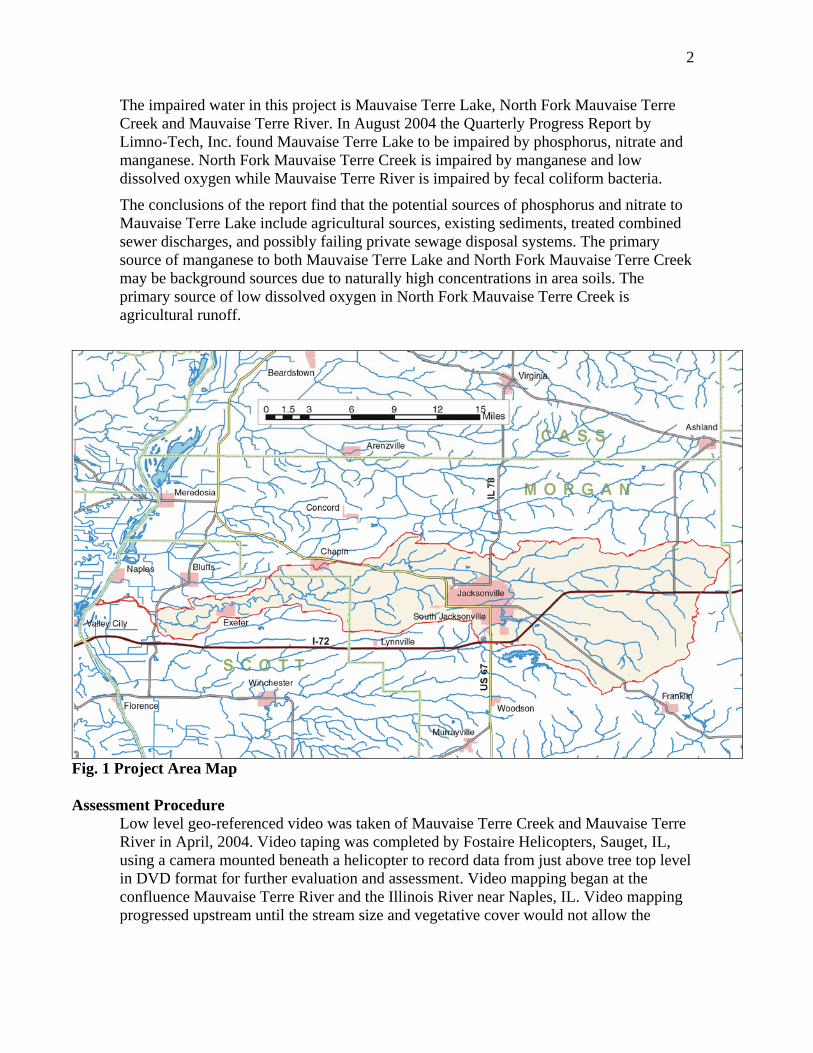
2
The impaired water in this project is Mauvaise Terre Lake, North Fork Mauvaise Terre Creek and Mauvaise Terre River. In August 2004 the Quarterly Progress Report by Limno-Tech, Inc. found Mauvaise Terre Lake to be impaired by phosphorus, nitrate and manganese. North Fork Mauvaise Terre Creek is impaired by manganese and low dissolved oxygen while Mauvaise Terre River is impaired by fecal coliform bacteria.
The conclusions of the report find that the potential sources of phosphorus and nitrate to Mauvaise Terre Lake include agricultural sources, existing sediments, treated combined sewer discharges, and possibly failing private sewage disposal systems. The primary source of manganese to both Mauvaise Terre Lake and North Fork Mauvaise Terre Creek may be background sources due to naturally high concentrations in area soils. The primary source of low dissolved oxygen in North Fork Mauvaise Terre Creek is agricultural runoff.
Fig. 1 Project Area Map Assessment Procedure
Low level geo-referenced video was taken of Mauvaise Terre Creek and Mauvaise Terre River in April, 2004. Video taping was completed by Fostaire Helicopters, Sauget, IL, using a camera mounted beneath a helicopter to record data from just above tree top level in DVD format for further evaluation and assessment. Video mapping began at the confluence Mauvaise Terre River and the Illinois River near Naples, IL. Video mapping progressed upstream until the stream size and vegetative cover would not allow the
3
capture of useful video images near Interstate 72 just east of Jacksonville, IL. Aerial video of tributaries was not part of the project, regardless of the stream size or vegetation.
After videotaping the stream, the DVD tapes were processed by USGS to produce a geo-referenced DVD showing flight data and location. Next, USGS identified features from the video and created shapefiles containing the GPS location, type of feature identified, and the time on the DVD to allow cross referencing. The shape-files along with the DVD were then used to identify and locate the points where ground investigations were needed to verify aerial assessment assumptions and gather additional data.
Ground investigations or “ground truthing” was then completed for IDOA to accomplish two primary functions. First, it provides those viewing videos the opportunity to verify the correct interpretation of the video. Second, the video allows the user to identify and gather field data at the most appropriate locations to more closely represent the entire study portion of the stream.
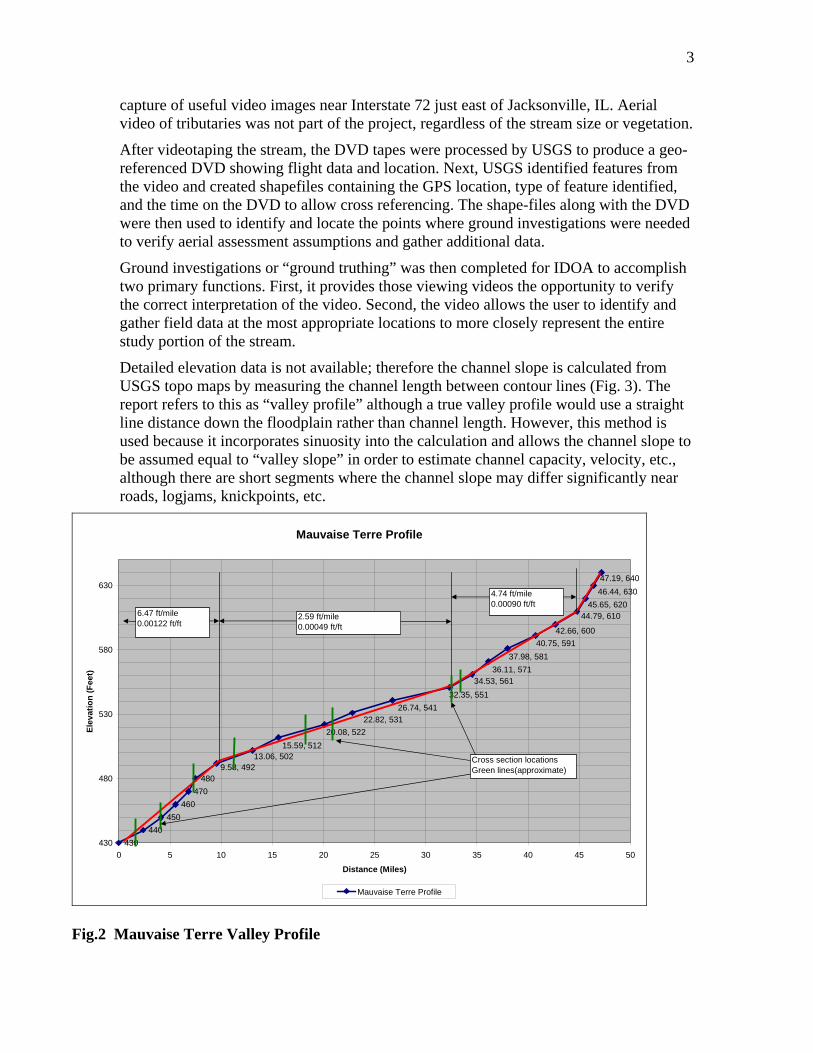
Detailed elevation data is not available; therefore the channel slope is calculated from USGS topo maps by measuring the channel length between contour lines (Fig. 3). The report refers to this as “valley profile” although a true valley profile would use a straight line distance down the floodplain rather than channel length. However, this method is used because it incorporates sinuosity into the calculation and allows the channel slope to be assumed equal to “valley slope” in order to estimate channel capacity, velocity, etc., although there are short segments where the channel slope may differ significantly near roads, logjams, knickpoints, etc.
Mauvaise Terre Profile
430440
450460
470480
9.58, 49213.06, 502
15.59, 51220.08, 522
22.82, 53126.74, 541
32.35, 55134.53, 561
36.11, 57137.98, 581
40.75, 59142.66, 600
44.79, 61045.65, 620
46.44, 63047.19, 640
430
480
530
580
630
0 5 10 15 20 25 30 35 40 45 50
Distance (Miles)
Elev
atio
n (F
eet)
Mauvaise Terre Profile
6.47 ft/mile0.00122 ft/ft
2.59 ft/mile0.00049 ft/ft
4.74 ft/mile0.00090 ft/ft
Cross section locations Green lines(approximate)
Fig.2 Mauvaise Terre Valley Profile
4
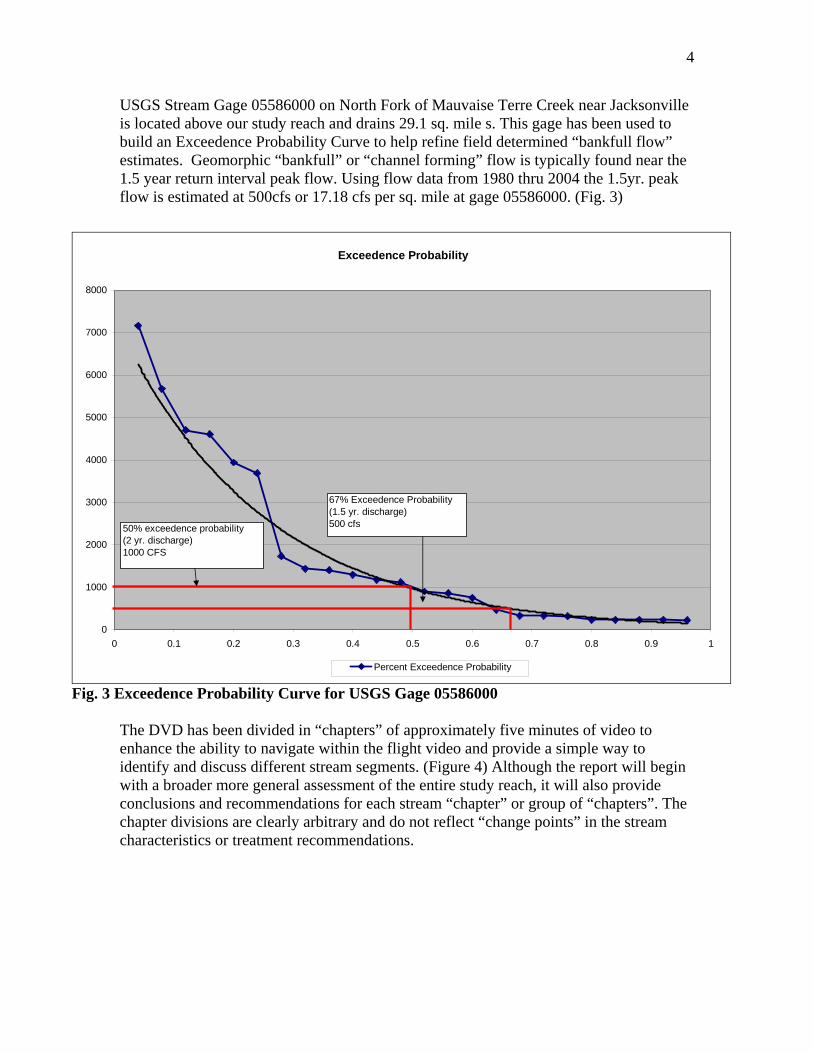
USGS Stream Gage 05586000 on North Fork of Mauvaise Terre Creek near Jacksonville is located above our study reach and drains 29.1 sq. mile s. This gage has been used to build an Exceedence Probability Curve to help refine field determined “bankfull flow” estimates. Geomorphic “bankfull” or “channel forming” flow is typically found near the 1.5 year return interval peak flow. Using flow data from 1980 thru 2004 the 1.5yr. peak flow is estimated at 500cfs or 17.18 cfs per sq. mile at gage 05586000. (Fig. 3)
Exceedence Probability
0
1000
2000
3000
4000
5000
6000
7000
8000
0 0.1 0.2 0.3 0.4 0.5 0.6 0.7 0.8 0.9 1
Percent Exceedence Probability
50% exceedence probability(2 yr. discharge)1000 CFS
67% Exceedence Probability(1.5 yr. discharge)500 cfs
Fig. 3 Exceedence Probability Curve for USGS Gage 05586000
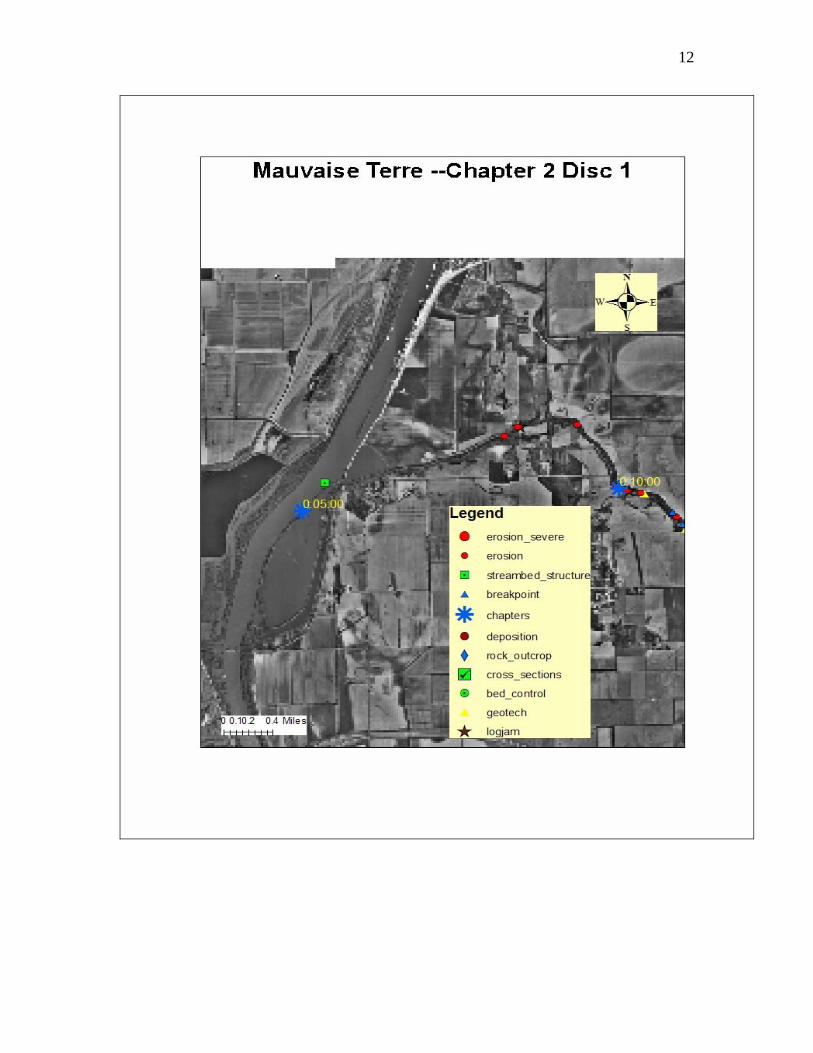
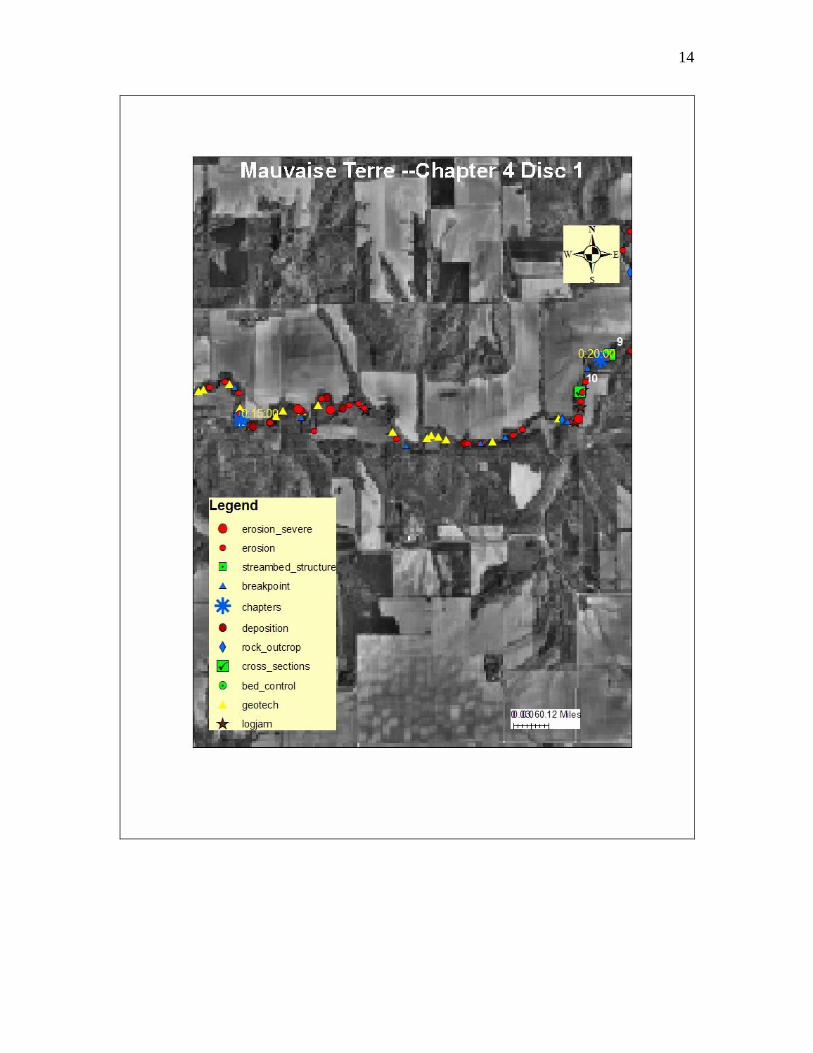
The DVD has been divided in “chapters” of approximately five minutes of video to enhance the ability to navigate within the flight video and provide a simple way to identify and discuss different stream segments. (Figure 4) Although the report will begin with a broader more general assessment of the entire study reach, it will also provide conclusions and recommendations for each stream “chapter” or group of “chapters”. The chapter divisions are clearly arbitrary and do not reflect “change points” in the stream characteristics or treatment recommendations.

5
Fig. 4 Chapter Divisions on DVD
Features Identified by ChapterChapterNo. Erosion Breakpoint Deposition Logjam Geotech Bed ControlDisc 1 2 4 0 0 1 0 0
3 16 8 0 2 11 14 17 6 4 1 10 05 19 17 1 1 1 06 10 15 4 0 2 07 15 4 2 1 2 08 15 6 5 3 2 19 16 2 3 2 4 1
10 8 0 0 0 0 0
Disc 2 2 20 4 0 0 1 03 19 2 3 3 2 04 14 1 0 4 0 05 19 1 2 5 0 06 8 0 1 6 0 07 24 0 0 8 0 18 20 1 0 4 0 49 18 4 0 8 0 1
10 9 0 0 2 0 1TOTAL 271 71 25 51 35 10 Table 1. Features Identified on Aerial DVD
6
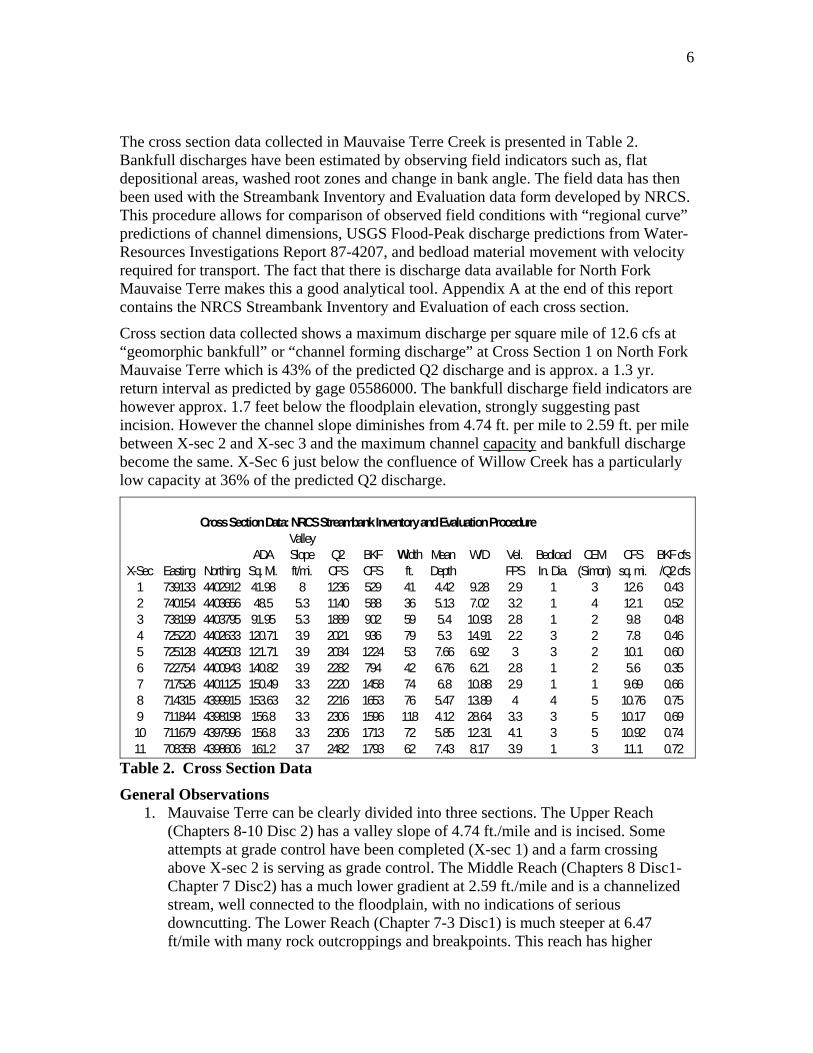
The cross section data collected in Mauvaise Terre Creek is presented in Table 2. Bankfull discharges have been estimated by observing field indicators such as, flat depositional areas, washed root zones and change in bank angle. The field data has then been used with the Streambank Inventory and Evaluation data form developed by NRCS. This procedure allows for comparison of observed field conditions with “regional curve” predictions of channel dimensions, USGS Flood-Peak discharge predictions from Water-Resources Investigations Report 87-4207, and bedload material movement with velocity required for transport. The fact that there is discharge data available for North Fork Mauvaise Terre makes this a good analytical tool. Appendix A at the end of this report contains the NRCS Streambank Inventory and Evaluation of each cross section.
Cross section data collected shows a maximum discharge per square mile of 12.6 cfs at “geomorphic bankfull” or “channel forming discharge” at Cross Section 1 on North Fork Mauvaise Terre which is 43% of the predicted Q2 discharge and is approx. a 1.3 yr. return interval as predicted by gage 05586000. The bankfull discharge field indicators are however approx. 1.7 feet below the floodplain elevation, strongly suggesting past incision. However the channel slope diminishes from 4.74 ft. per mile to 2.59 ft. per mile between X-sec 2 and X-sec 3 and the maximum channel capacity and bankfull discharge become the same. X-Sec 6 just below the confluence of Willow Creek has a particularly low capacity at 36% of the predicted Q2 discharge.
ValleyADA Slope Q2 BKF Width Mean W/D Vel. Bedload CEM CFS BKF cfs
X-Sec Easting Northing Sq. Mi. ft/mi. CFS CFS ft. Depth FPS In. Dia. (Simon) sq. mi. /Q2 cfs1 739133 4402912 41.98 8 1236 529 41 4.42 9.28 2.9 1 3 12.6 0.432 740154 4403656 48.5 5.3 1140 588 36 5.13 7.02 3.2 1 4 12.1 0.523 738199 4403795 91.95 5.3 1889 902 59 5.4 10.93 2.8 1 2 9.8 0.484 725220 4402633 120.71 3.9 2021 936 79 5.3 14.91 2.2 3 2 7.8 0.465 725128 4402503 121.71 3.9 2034 1224 53 7.66 6.92 3 3 2 10.1 0.606 722754 4400943 140.82 3.9 2282 794 42 6.76 6.21 2.8 1 2 5.6 0.357 717526 4401125 150.49 3.3 2220 1458 74 6.8 10.88 2.9 1 1 9.69 0.668 714315 4399915 153.63 3.2 2216 1653 76 5.47 13.89 4 4 5 10.76 0.759 711844 4398198 156.8 3.3 2306 1596 118 4.12 28.64 3.3 3 5 10.17 0.6910 711679 4397996 156.8 3.3 2306 1713 72 5.85 12.31 4.1 3 5 10.92 0.7411 708358 4398606 161.2 3.7 2482 1793 62 7.43 8.17 3.9 1 3 11.1 0.72
Cross Section Data: NRCS Streambank Inventory and Evaluation Procedure
Table 2. Cross Section Data
General Observations 1. Mauvaise Terre can be clearly divided into three sections. The Upper Reach
(Chapters 8-10 Disc 2) has a valley slope of 4.74 ft./mile and is incised. Some attempts at grade control have been completed (X-sec 1) and a farm crossing above X-sec 2 is serving as grade control. The Middle Reach (Chapters 8 Disc1-Chapter 7 Disc2) has a much lower gradient at 2.59 ft./mile and is a channelized stream, well connected to the floodplain, with no indications of serious downcutting. The Lower Reach (Chapter 7-3 Disc1) is much steeper at 6.47 ft/mile with many rock outcroppings and breakpoints. This reach has higher
7
velocities, larger bedload transport capability and has a generally stable bed due to the rock substrate.
2. Bankfull calculations in the middle reach are at the very top bank and carry approx. 45-50% of the predicted Q2, which is slightly less than the 1.5 yr. R.I. discharge. The bankfull calculations in the upper reach compare well in discharge, however the bankfull depths determined in the field investigation are well below the top of the bank. In other words the upper reach is somewhat incised and not well connected with the floodplain. The lower reach bankfull discharge is somewhat higher at over 70% of the predicted Q2, but is incised even more than the upper reach with bankfull flows 3 ft. or more below the top of the bank.
3. A ten mile section from approximately Elev. 550 to Elev. 530 was found to have very deep standing water with no breakpoints or riffles. No cross sections were taken in this area due to the water depth. (Chapter 5-7 Disc 2)
4. The North Fork of Mauvaise Terre Creek and Mauvaise Terre River above the confluence with North Fork Mauvaise Terre Creek would benefit from Rock Riffle Grade Controls for stability and would also benefit the Low DO impairment on North Fork. (Upper Reach)
5. The Middle reach needs only lateral migration treatment. Recommendations
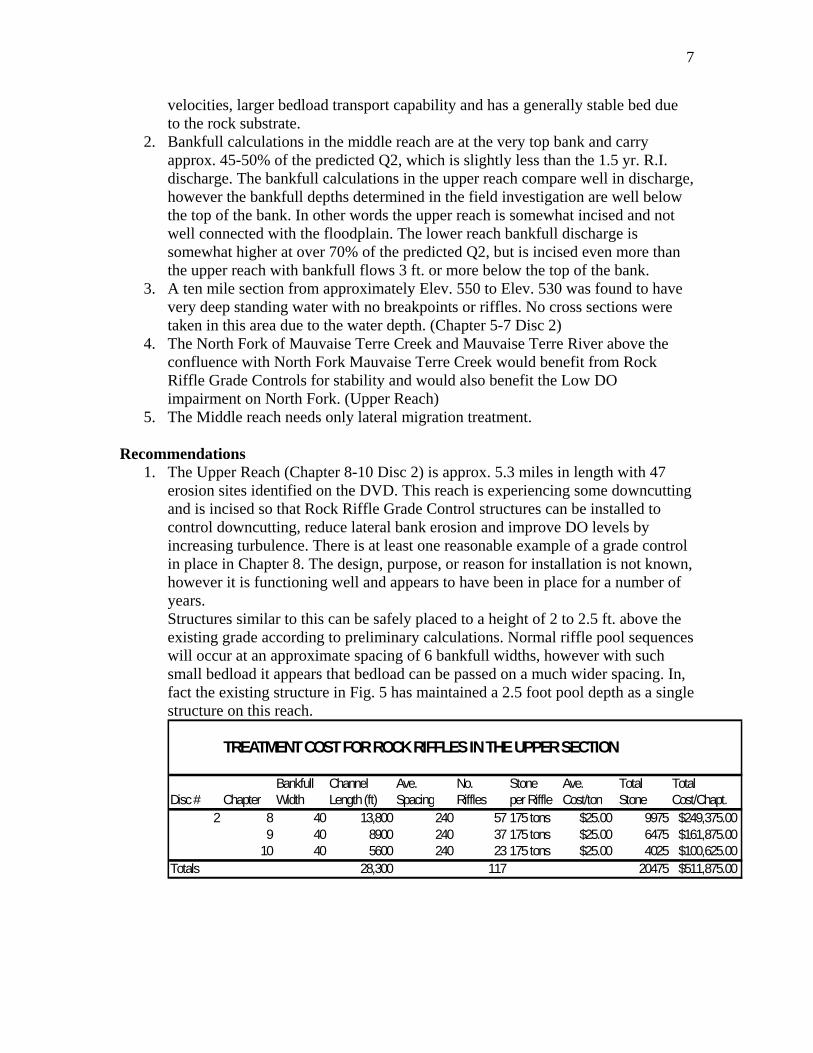
1. The Upper Reach (Chapter 8-10 Disc 2) is approx. 5.3 miles in length with 47 erosion sites identified on the DVD. This reach is experiencing some downcutting and is incised so that Rock Riffle Grade Control structures can be installed to control downcutting, reduce lateral bank erosion and improve DO levels by increasing turbulence. There is at least one reasonable example of a grade control in place in Chapter 8. The design, purpose, or reason for installation is not known, however it is functioning well and appears to have been in place for a number of years. Structures similar to this can be safely placed to a height of 2 to 2.5 ft. above the existing grade according to preliminary calculations. Normal riffle pool sequences will occur at an approximate spacing of 6 bankfull widths, however with such small bedload it appears that bedload can be passed on a much wider spacing. In, fact the existing structure in Fig. 5 has maintained a 2.5 foot pool depth as a single structure on this reach.
TREATMENT COST FOR ROCK RIFFLES IN THE UPPER SECTION
Bankfull Channel Ave. No. Stone Ave. Total Total Disc # Chapter Width Length (ft) Spacing Riffles per Riffle Cost/ton Stone Cost/Chapt.
2 8 40 13,800 240 57 175 tons $25.00 9975 $249,375.009 40 8900 240 37 175 tons $25.00 6475 $161,875.00
10 40 5600 240 23 175 tons $25.00 4025 $100,625.00Totals 28,300 117 20475 $511,875.00

8
Fig. 5 Existing Rock Riffle—Mauvaise Terre River In addition to the Rock Riffles it is typical that 50% of the lateral bank migration will be dramatically slowed so that treatment is not needed. However the remaining 50% will likely need to have Stone Toe Protection or similar treatment. The following table shows an estimate by chapter in the upper reach that may need lateral bank treatment even after riffles are installed.
TREATMENT COST FOR STONE TOE PROTECTION-UPPER SECTION
Bankfull Ave. Erosion STP Stone Ave. Total No. Sites Total Disc # Chapter Width Length Rate (ton/ft) Required Cost/ton Cost/site Cost/Chapt.Disc 2 8 40 200 0.5 100 $25 $2,500.00 10 $25,000.00
9 40 200 0.5 100 $25 $2,500.00 9 $22,500.0010 40 200 0.5 100 $25 $2,500.00 5 $12,500.00
TOTAL 600 300 24 $60,000.00 2. The Middle Reach (Chapt. 8 disc 1-Chapt 7 Disc 2) is approx. 16 miles in length
with 143 erosion sites identified from the DVD. This reach is a lower gradient with fine bedload and no point bar accumulations. Therefore the treatment recommended for this entire reach is to use a hard toe protection to stabilize the banks and prevent lateral migration. Stone Toe Protection (STP) is the preferred
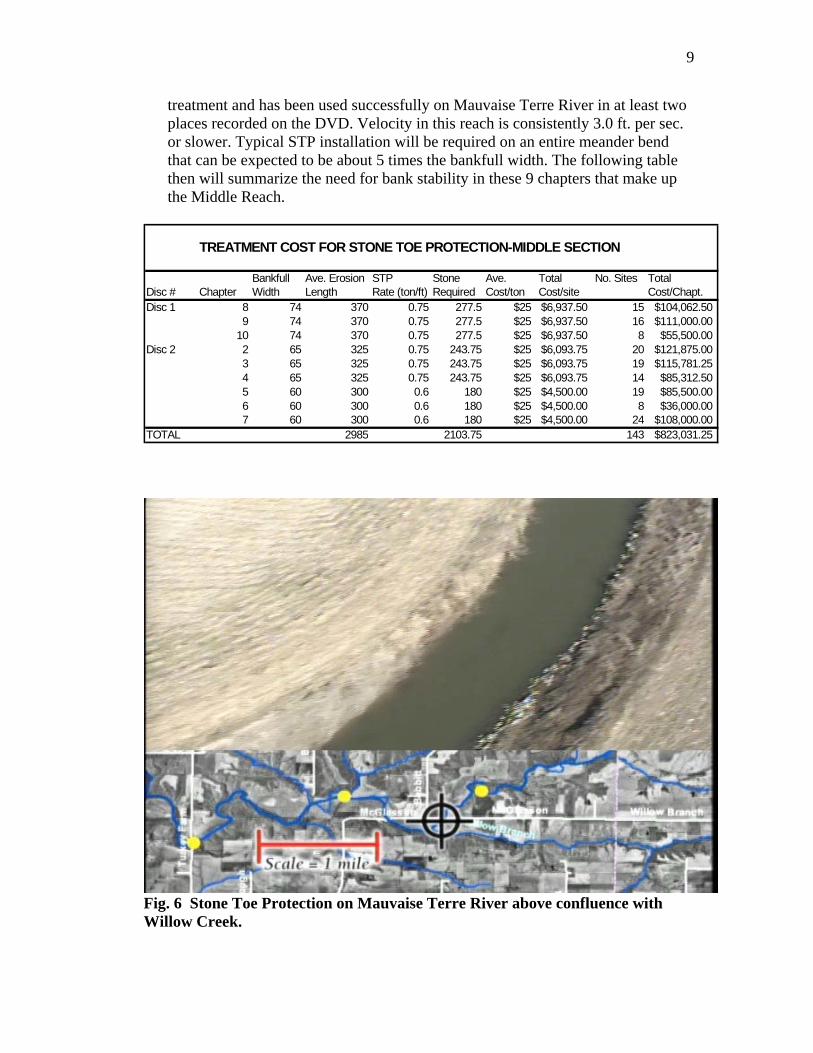
9
treatment and has been used successfully on Mauvaise Terre River in at least two places recorded on the DVD. Velocity in this reach is consistently 3.0 ft. per sec. or slower. Typical STP installation will be required on an entire meander bend that can be expected to be about 5 times the bankfull width. The following table then will summarize the need for bank stability in these 9 chapters that make up the Middle Reach.
TREATMENT COST FOR STONE TOE PROTECTION-MIDDLE SECTION
Bankfull Ave. Erosion STP Stone Ave. Total No. Sites Total Disc # Chapter Width Length Rate (ton/ft) Required Cost/ton Cost/site Cost/Chapt.Disc 1 8 74 370 0.75 277.5 $25 $6,937.50 15 $104,062.50
9 74 370 0.75 277.5 $25 $6,937.50 16 $111,000.0010 74 370 0.75 277.5 $25 $6,937.50 8 $55,500.00
Disc 2 2 65 325 0.75 243.75 $25 $6,093.75 20 $121,875.003 65 325 0.75 243.75 $25 $6,093.75 19 $115,781.254 65 325 0.75 243.75 $25 $6,093.75 14 $85,312.505 60 300 0.6 180 $25 $4,500.00 19 $85,500.006 60 300 0.6 180 $25 $4,500.00 8 $36,000.007 60 300 0.6 180 $25 $4,500.00 24 $108,000.00
TOTAL 2985 2103.75 143 $823,031.25
Fig. 6 Stone Toe Protection on Mauvaise Terre River above confluence with Willow Creek.
10
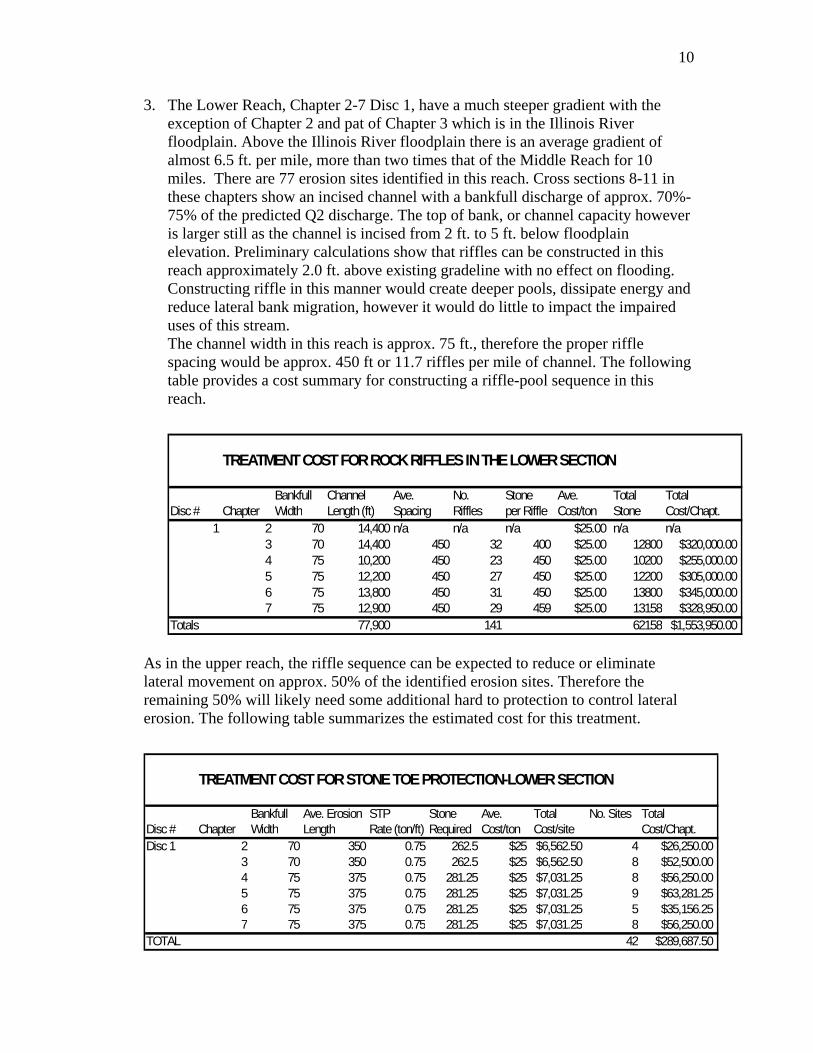
3. The Lower Reach, Chapter 2-7 Disc 1, have a much steeper gradient with the exception of Chapter 2 and pat of Chapter 3 which is in the Illinois River floodplain. Above the Illinois River floodplain there is an average gradient of almost 6.5 ft. per mile, more than two times that of the Middle Reach for 10 miles. There are 77 erosion sites identified in this reach. Cross sections 8-11 in these chapters show an incised channel with a bankfull discharge of approx. 70%-75% of the predicted Q2 discharge. The top of bank, or channel capacity however is larger still as the channel is incised from 2 ft. to 5 ft. below floodplain elevation. Preliminary calculations show that riffles can be constructed in this reach approximately 2.0 ft. above existing gradeline with no effect on flooding. Constructing riffle in this manner would create deeper pools, dissipate energy and reduce lateral bank migration, however it would do little to impact the impaired uses of this stream. The channel width in this reach is approx. 75 ft., therefore the proper riffle spacing would be approx. 450 ft or 11.7 riffles per mile of channel. The following table provides a cost summary for constructing a riffle-pool sequence in this reach.
TREATMENT COST FOR ROCK RIFFLES IN THE LOWER SECTION
Bankfull Channel Ave. No. Stone Ave. Total Total Disc # Chapter Width Length (ft) Spacing Riffles per Riffle Cost/ton Stone Cost/Chapt.
1 2 70 14,400 n/a n/a n/a $25.00 n/a n/a3 70 14,400 450 32 400 $25.00 12800 $320,000.004 75 10,200 450 23 450 $25.00 10200 $255,000.005 75 12,200 450 27 450 $25.00 12200 $305,000.006 75 13,800 450 31 450 $25.00 13800 $345,000.007 75 12,900 450 29 459 $25.00 13158 $328,950.00
Totals 77,900 141 62158 $1,553,950.00
As in the upper reach, the riffle sequence can be expected to reduce or eliminate lateral movement on approx. 50% of the identified erosion sites. Therefore the remaining 50% will likely need some additional hard to protection to control lateral erosion. The following table summarizes the estimated cost for this treatment.
TREATMENT COST FOR STONE TOE PROTECTION-LOWER SECTION
Bankfull Ave. Erosion STP Stone Ave. Total No. Sites Total Disc # Chapter Width Length Rate (ton/ft) Required Cost/ton Cost/site Cost/Chapt.Disc 1 2 70 350 0.75 262.5 $25 $6,562.50 4 $26,250.00
3 70 350 0.75 262.5 $25 $6,562.50 8 $52,500.004 75 375 0.75 281.25 $25 $7,031.25 8 $56,250.005 75 375 0.75 281.25 $25 $7,031.25 9 $63,281.256 75 375 0.75 281.25 $25 $7,031.25 5 $35,156.257 75 375 0.75 281.25 $25 $7,031.25 8 $56,250.00
TOTAL 42 $289,687.50

11
AERIAL MAPS OF STUDY AREA
BY CHAPTER
12

13
14

15
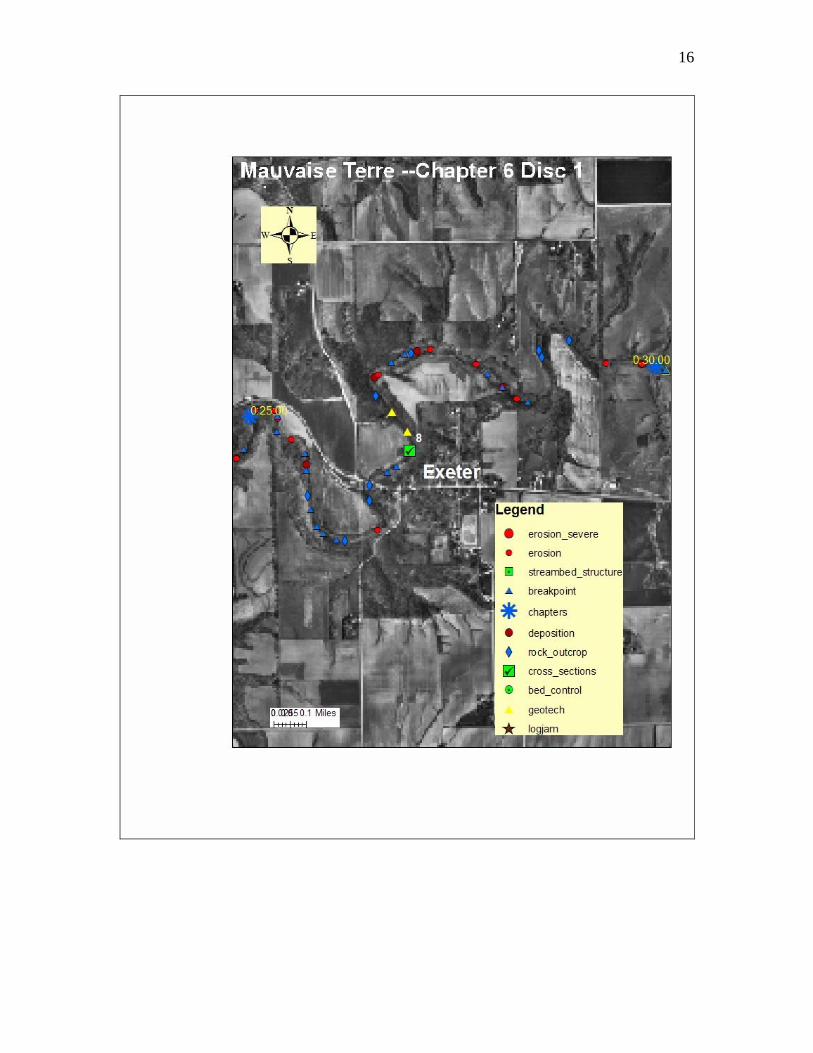
16

17
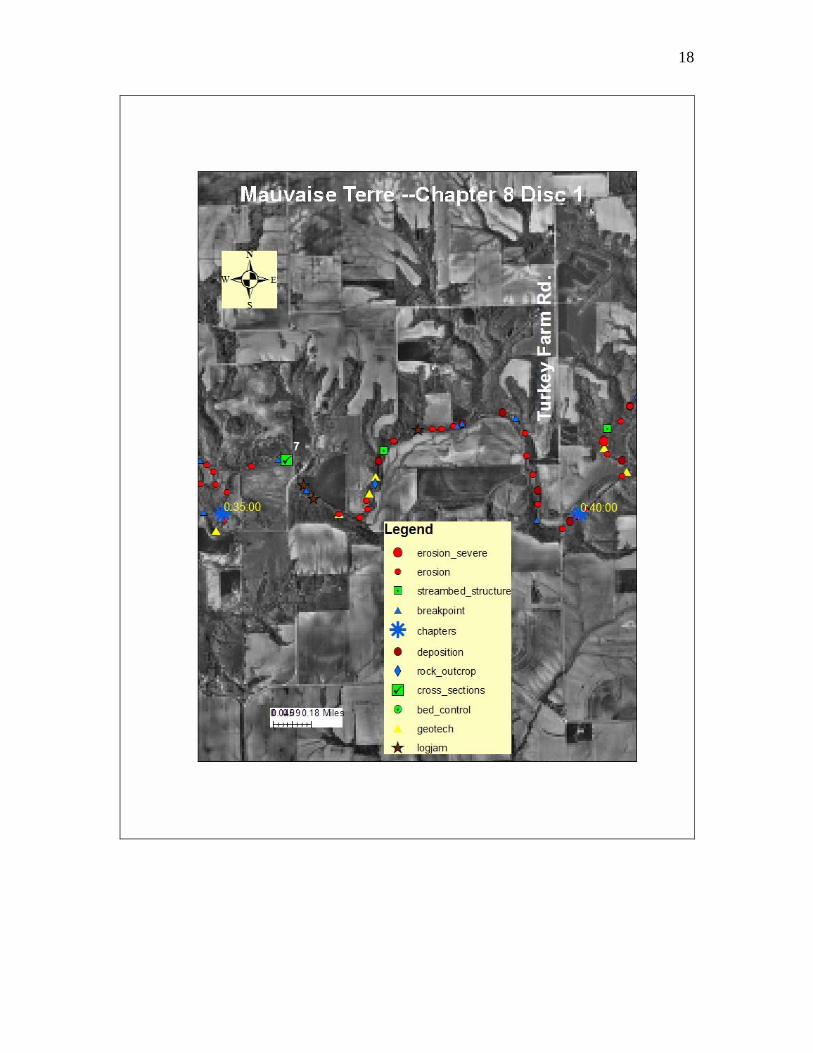
18

19
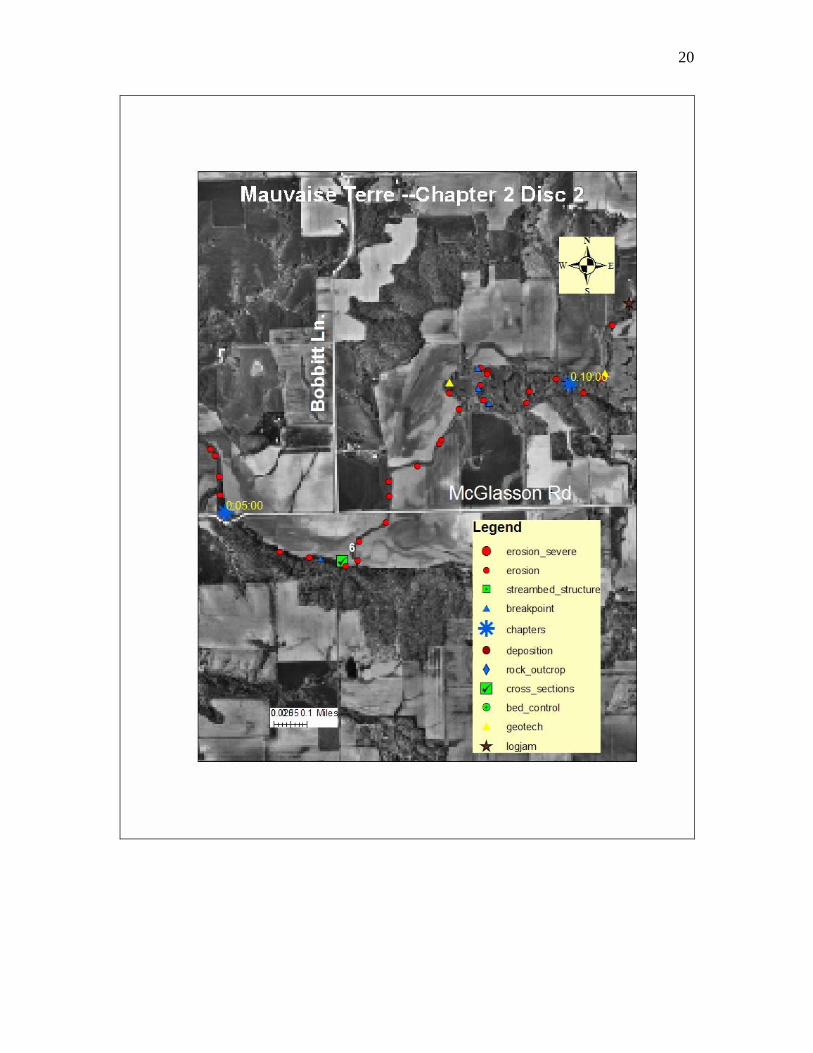
20

21

22
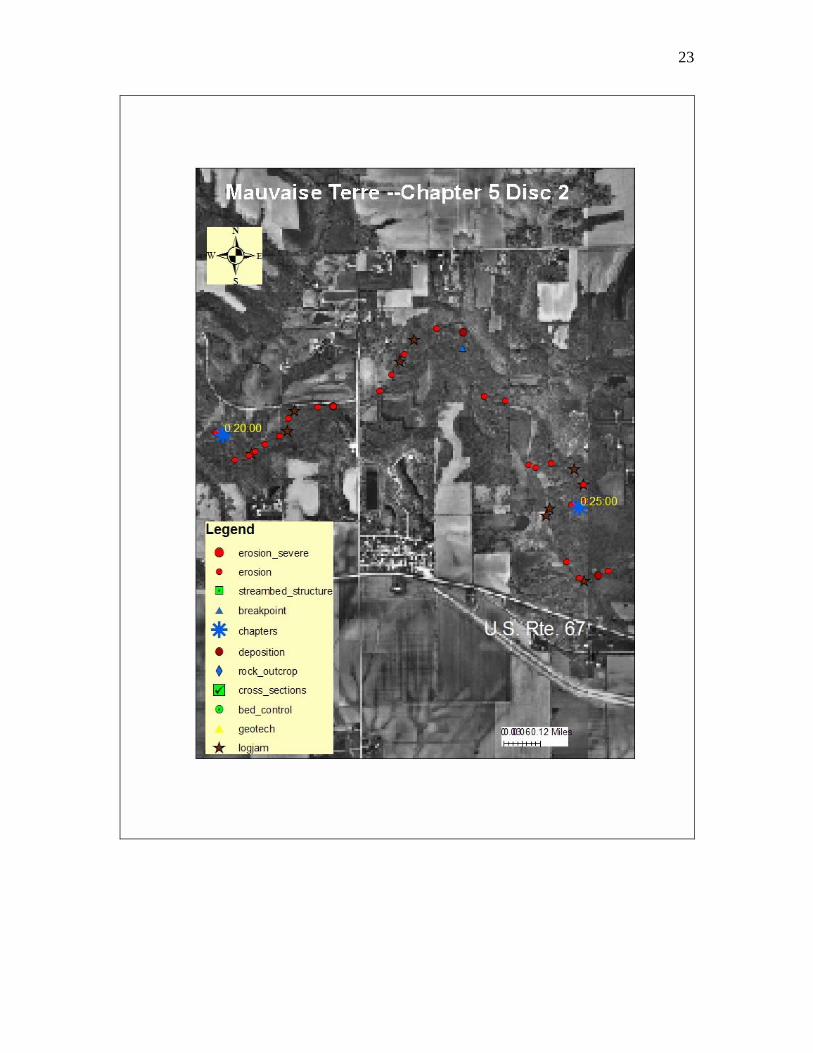
23
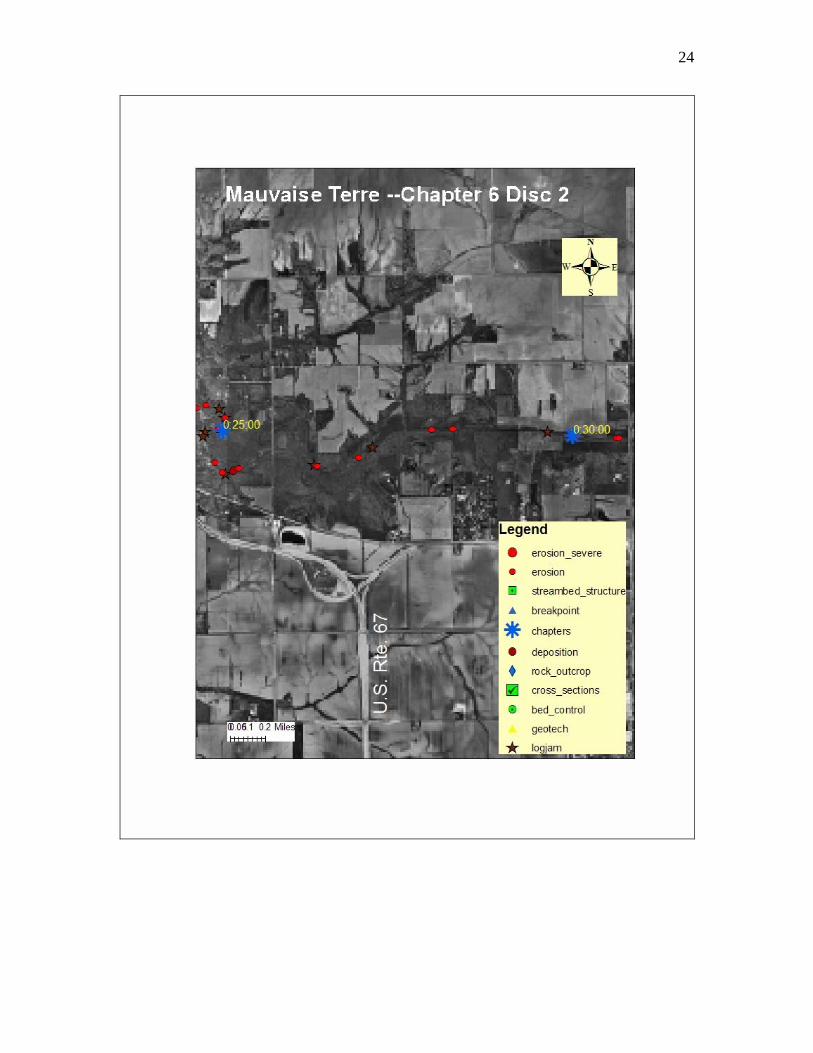
24
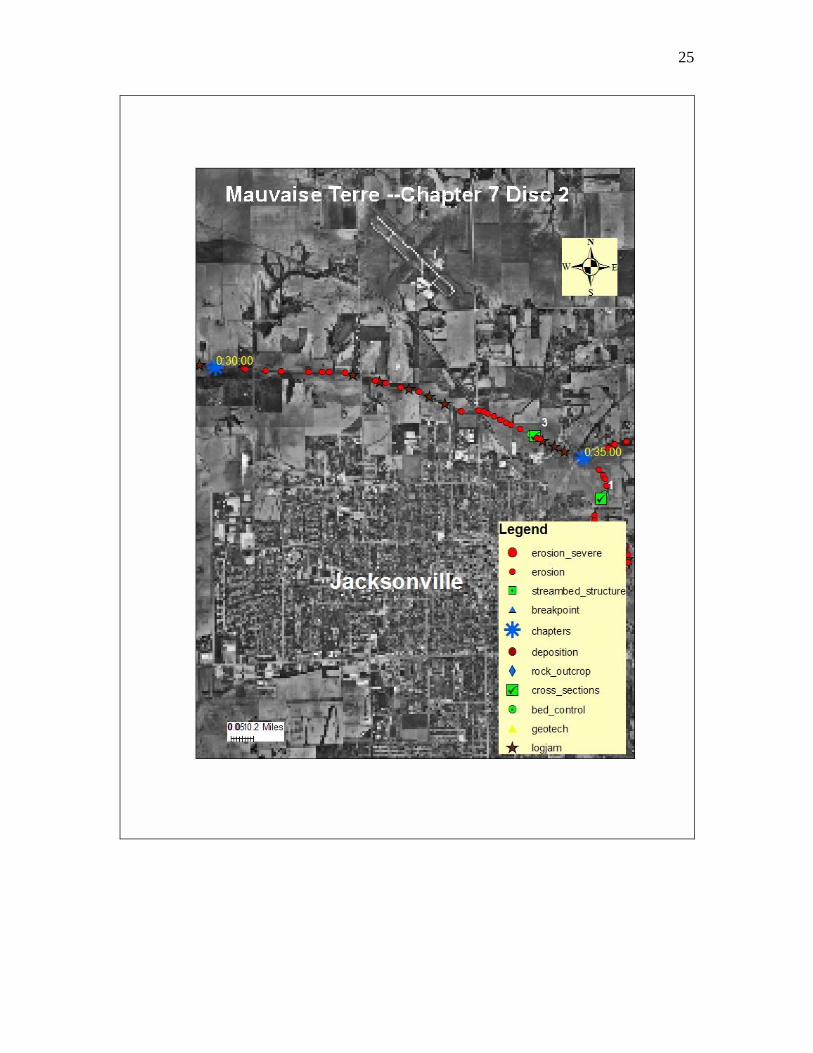
25

26

27

28
29
APPENDIX “A”
CROSS SECTION DATA


![Mise à la terre / Terre de fondation [3.4 MB]](https://img.pdfslide.us/doc/110x75/586e0fb51a28ab3f228b6cb2/mise-a-la-terre-terre-de-fondation-34-mb.jpg)