Embed Size (px)
Citation preview

11
Society of Petroleum EngineersSociety of Petroleum Engineers
Mature Based for New SolutionsConference
Visegrád, 21 November 2013

Production increase for low pressure gas Production increase for low pressure gas wells with liquid loading problemswells with liquid loading problems
A Case StudyA Case Study
Zoltan Turzo, PhD. UoM
Mihaly Gyukics, Andras Filip, Sandor Puskas MOL NyRt.(and many others)

Recognition of fluid loadRecognition of fluid load
20
00
/01
20
00
/08
20
01
/04
20
02
/02
20
02
/09
20
03
/04
20
03
/11
20
04
/06
20
05
/01
20
05
/08
20
06
/03
20
06
/10
20
07
/05
20
07
/12
20
08
/07
20
09
/02
20
09
/09
20
10
/04
20
10
/11
20
11
/06
20
12
/01
Qg
as
, P
r Q
l
Well# - EN-87
Qgas
Pr
Ql

Recognition of fluid loadRecognition of fluid load
DateDepth
[m]Pressure
[Mpa]∆∆∆∆l
[m]∆∆∆∆p
[Mpa]Density
[kg/m3]
4/9/2009 10 6.6411500 7.572 1490 0.931 62.51800 7.866 300 0.294 98.01955 8.793 155 0.927 598.1
31/08/2010 10 4.4111500 5.009 1490 0.598 40.11800 6.789 300 1.78 593.31955 8.172 155 1.383 892.3
Recognition of fluid loadRecognition of fluid load
Pre
ssu
re, D
en
sity
Depth
Pressure
Density
Recognition of fluid loadRecognition of fluid load
20
00
/01
20
00
/07
20
01
/01
20
01
/07
20
02
/01
20
02
/07
20
03
/04
20
03
/10
20
04
/04
20
04
/10
20
05
/04
20
05
/10
20
06
/04
20
06
/10
20
07
/04
20
07
/10
20
08
/04
20
08
/10
20
09
/04
20
09
/10
20
10
/04
20
10
/10
20
11
/04
20
11
/10
20
12
/04
Qg
as,
Pr,
Ql
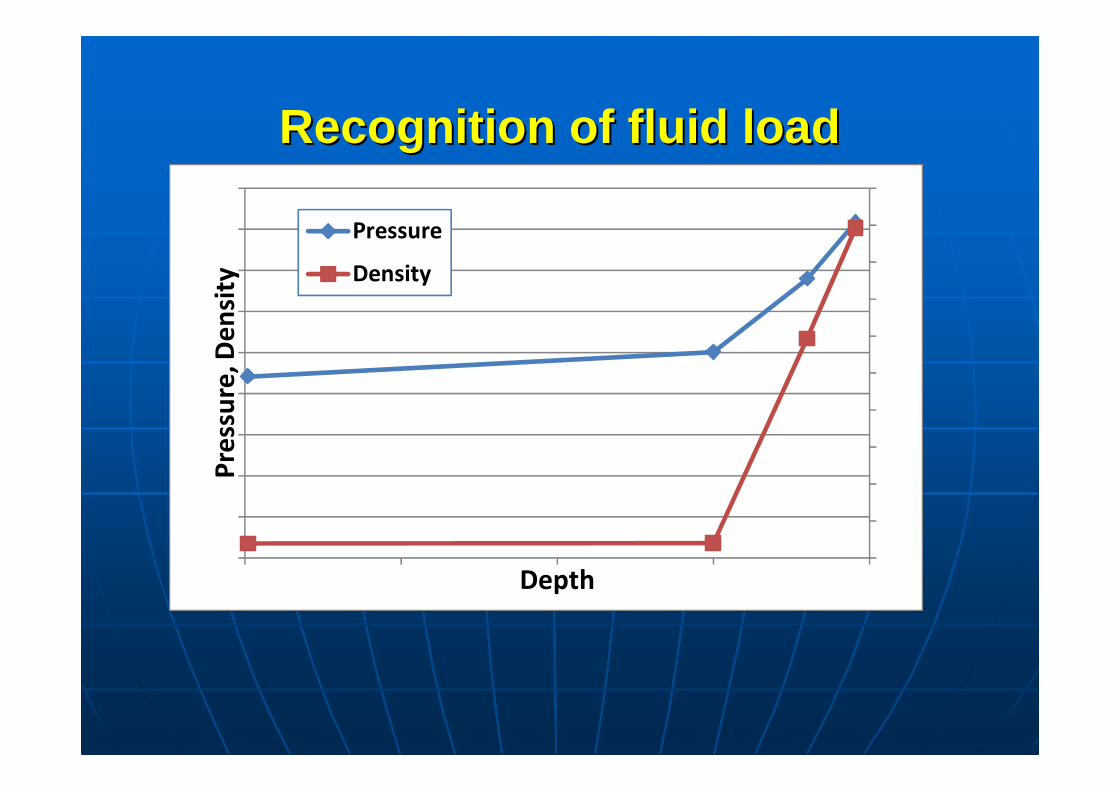
Well# - EN-E - 14
Qgas
Pr
Ql

Recognition of fluid loadRecognition of fluid load
DateDepth
[m]Pressure [Mpa]
∆∆∆∆l [m]
∆∆∆∆p [Mpa]
Density
[kg/m3]1/9/2010 10 4.405
1000 4.796 990 0.391 40.31900 5.107 900 0.311 35.22060 5.17 160 0.063 40.1
28/09/2011 10 3.9961000 4.332 990 0.336 34.61900 4.617 900 0.285 32.32060 4.673 160 0.056 35.7
Recognition of fluid loadRecognition of fluid load
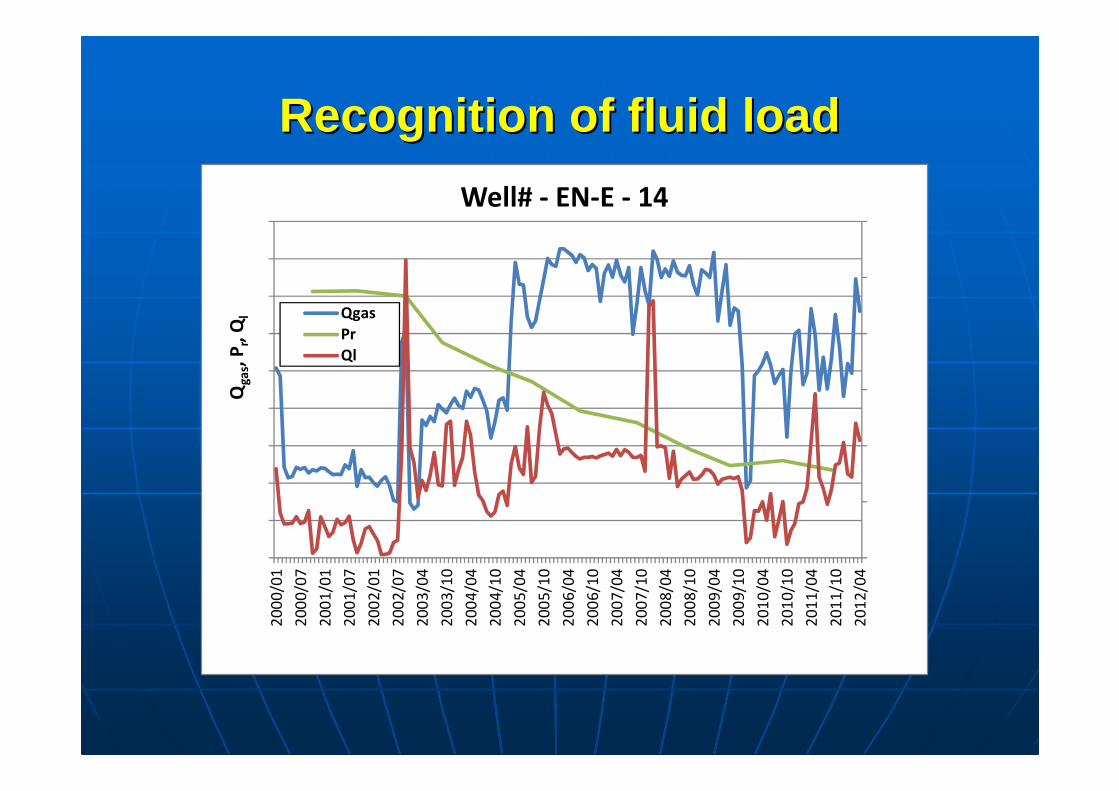
Well #
[bar] [bar] [oC] [bar]En-É-14 26 11 29 33 Intermittent 2-3 daysEn-É-18 27 10 25 14 Intermittent 2-3 daysEn-87 20 6 19 0 Continuous cont.En-88 20 7 16 0 Continuous cont.En-61 24 6 16 14 Intermittent sensible for WHPEn-67 20 8 12 8 Intermittent sensible for WHPEn-84 48 8 42 0 Intermittent 1-2 monthesEn-25 26 7 11 0 Intermittent sensible for WHP
Producing timeProducing WHP
WHT CHP Production type
Closed WHP

Gradient measurementsGradient measurements
0
20
40
60
80
100
120
140
0
500
1000
1500
2000
2500
3000
3500
4000
0 500 1000 1500 2000 2500 3000 3500 4000
Tem
pe
ratu
re,
oC
Pre
ssu
re,
kP
a
Well# - EN-E-14 (1 closed, 2 producing)
PressureTemperature

Gradient measurementsGradient measurements
0
20
40
60
80
100
120
140
3000
3100
3200
3300
3400
3500
3600
3700
0 500 1000 1500 2000 2500
Tem
pe
ratu
re,
oC
Pre
ssu
re,
kP
a
Depth, m
Well# - EN-E-14, closed gradient
Pressuer
Temperature

Gradient measurementsGradient measurements
0
20
40
60
80
100
120
140
0
200
400
600
800
1000
1200
1400
1600
1800
2000
0 500 1000 1500 2000 2500
Tem
pe
ratu
re,
oC
Pre
ssu
re,
kP
a
Depth, m
Well# - EN-E-14, 1st producing gradient
Pressure
Temperature

Gradient measurementsGradient measurements
0
20
40
60
80
100
120
140
0
200
400
600
800
1000
1200
1400
1600
1800
2000
0 500 1000 1500 2000 2500
Tem
pe
ratu
re,
oC
Pre
ssu
re,
kP
a
Depth, m
Well# - EN-E-14, 2nd producing gradient
Pressure
Temperature

Gradient measurementsGradient measurements
20
21
22
23
24
25
26
27
28
29
30
0
2
4
6
8
10
12
14
16
18
0 500 1000 1500
Ca
lcu
late
d D
en
sity
, k
g/m
3
Pre
ssu
re, k
Pa
Depth, m
Well# - EN-E-14, 2nd producing gradient
Pcalc Pmeas. Calc. Dens.
Gradient measurementsGradient measurements
0
20
40
60
80
100
120
0
200
400
600
800
1000
1200
1400
1600
0 500 1000 1500 2000 2500
Tem
pe
ratu
re,
oC
Pre
ssu
re,
kP
a
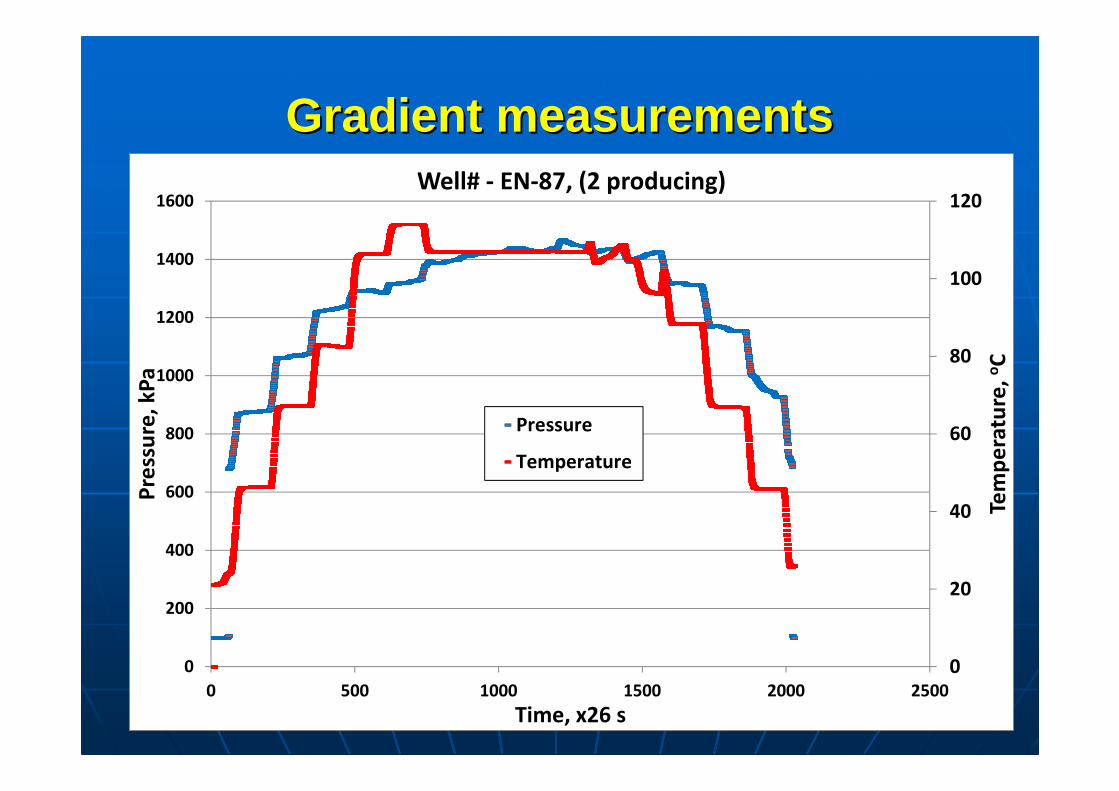
Time, x26 s
Well# - EN-87, (2 producing)
Pressure
Temperature

Gradient measurementsGradient measurements
0
20
40
60
80
100
120
0
200
400
600
800
1000
1200
1400
1600
0 500 1000 1500 2000 2500
Tem
pe
ratu
re,
oC
Pre
ssu
re, k
Pa
Depth, m
Well# - EN-87, 1st producing gradient
Pressure
Temperature

Gradient measurementsGradient measurements
0
20
40
60
80
100
120
0
200
400
600
800
1000
1200
1400
1600
0 500 1000 1500 2000 2500
Tem
pe
ratu
re,
oC
Pre
ssu
re,
kP
a
Depth, m
Well# - EN-87, 2nd producing gradient
Pressure
Temperature
Gradient measurementsGradient measurements
20
21
22
23
24
25
26
27
28
29
30
0
2
4
6
8
10
12
14
16
18
0 200 400 600 800 1000 1200 1400
Ca
lcu
late
d d
en
sity
, k
g/m
3
Pre
ssu
re,
kP
a
Depth, m
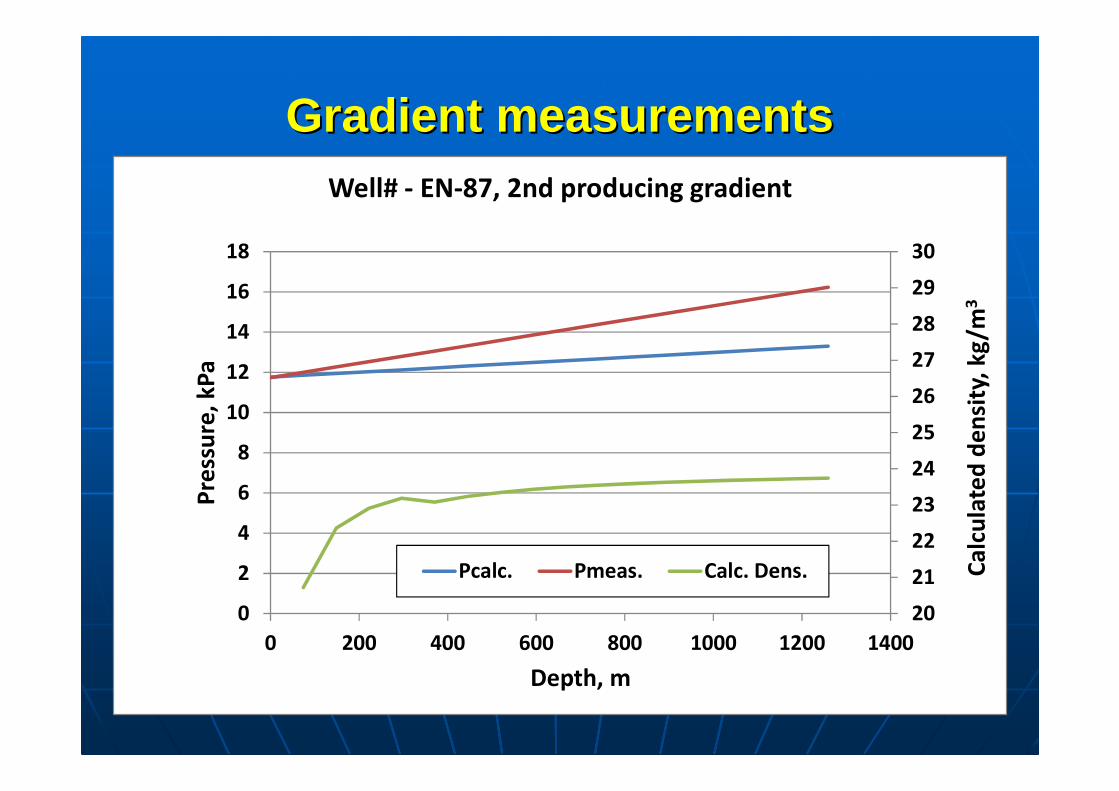
Well# - EN-87, 2nd producing gradient
Pcalc. Pmeas. Calc. Dens.
0
5
10
15
20
25
30
35
40
45
50
0 50 100 150
Pre
ssu
re, b
ar
Temperature, oC
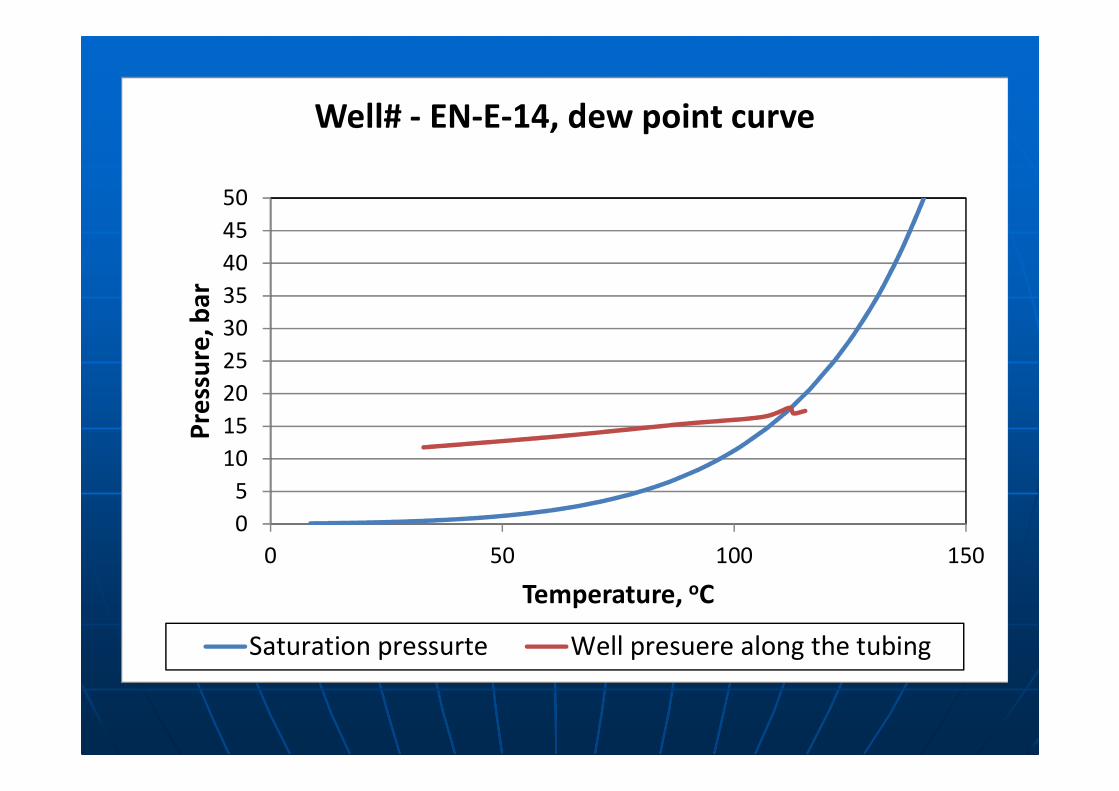
Well# - EN-E-14, dew point curve
Saturation pressurte Well presuere along the tubing

0
5
10
15
20
25
30
35
40
45
50
0 50 100 150
Pre
ssu
re,
ba
r
Temperature, oC
Well# - EN-87, dew point curve
Saturation pressure Well pressure along the tubing

Well# -EN-E-14, water content
corrected wellstream composition
Well-EN-87, water content corrected
wellstream composition
Component mol%
C1 78.509C2 3.328C3 1.713
i-C4 0.65n-C4 0.522i-C5 0.253n-C5 0.186C6 0.193C7 0.135C8 0.067
CO2 3.313N2 (+O2) 1.343
H2O 9.788
Total: 100.000
Component mol%
C1 75.669C2 4.358C3 2.122
i-C4 0.76n-C4 0.635i-C5 0.283n-C5 0.207C6 0.184C7 0.111C8 0.053
CO2 3.418N2 (+O2) 2.8
H2O 9.4
Total: 100.000
Well# Well# -- ENEN--EE--14 k14 kúútt
0
500
1000
1500
2000
2500
0 5 10 15 20
De
pth
, m
Pressure, bar
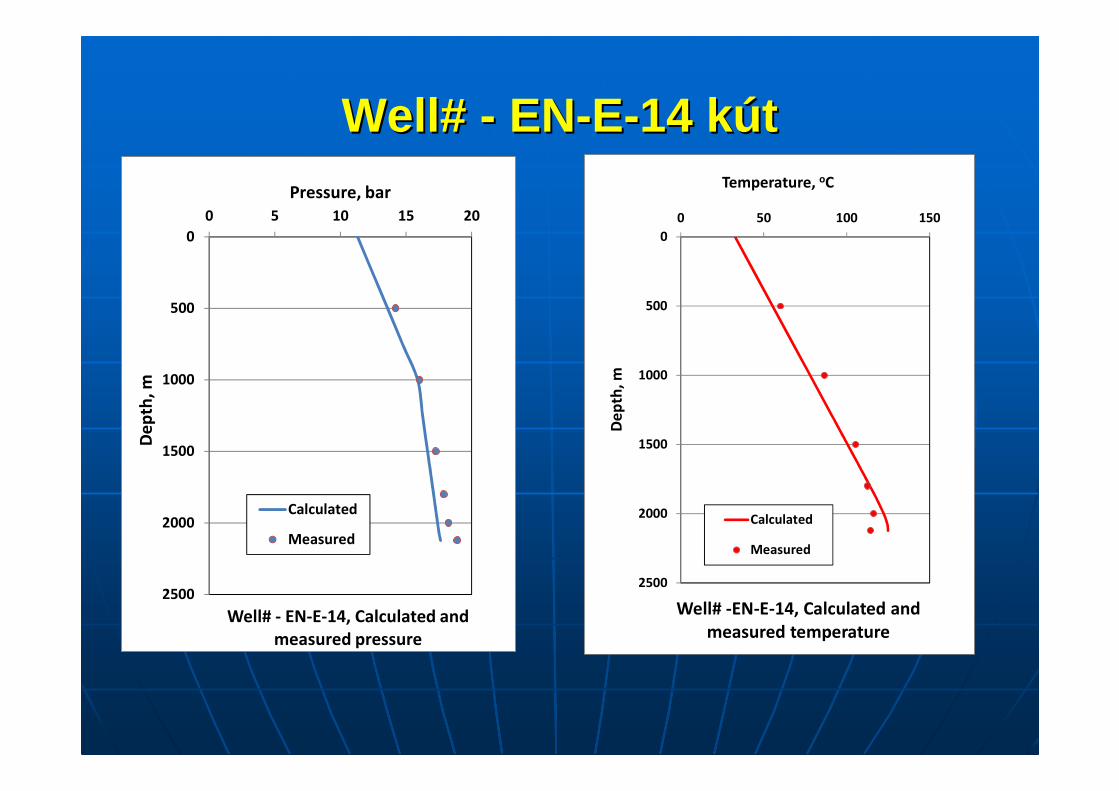
Well# - EN-E-14, Calculated and
measured pressure
Calculated
Measured
0
500
1000
1500
2000
2500
0 50 100 150
De
pth
, m
Temperature, oC
Well# -EN-E-14, Calculated and
measured temperature
Calculated
Measured

Well# ENWell# EN --8787
0
500
1000
1500
2000
2500
0 5 10 15
De
pth
, m
Pressure, bar
Well# EN-87, Calculated and measured
pressure
Calculated
Measured
0
500
1000
1500
2000
2500
0 50 100 150
De
pth
, m
Temperature, oC
Well# EN-87, Calculated and measured
temperature
Calculated
Measured
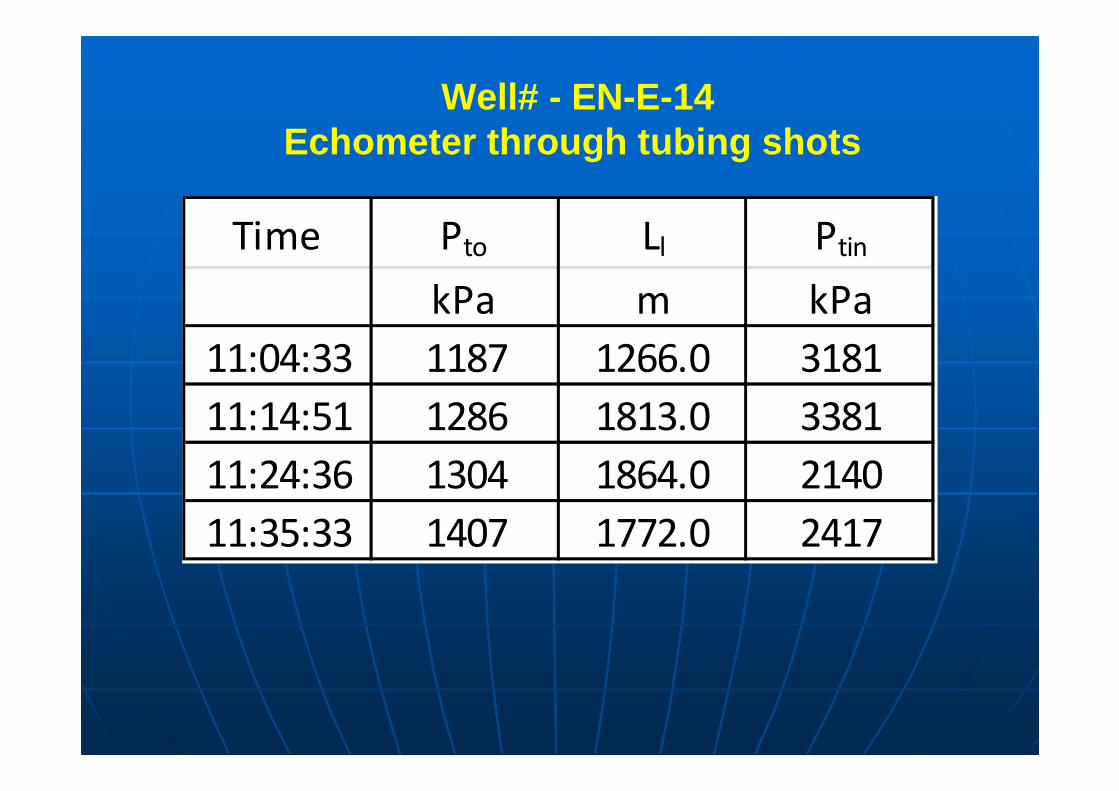
Well# - EN-E-14Echometer through tubing shots
Time Pto Ll Ptin
kPa m kPa
11:04:33 1187 1266.0 3181
11:14:51 1286 1813.0 3381
11:24:36 1304 1864.0 2140
11:35:33 1407 1772.0 2417
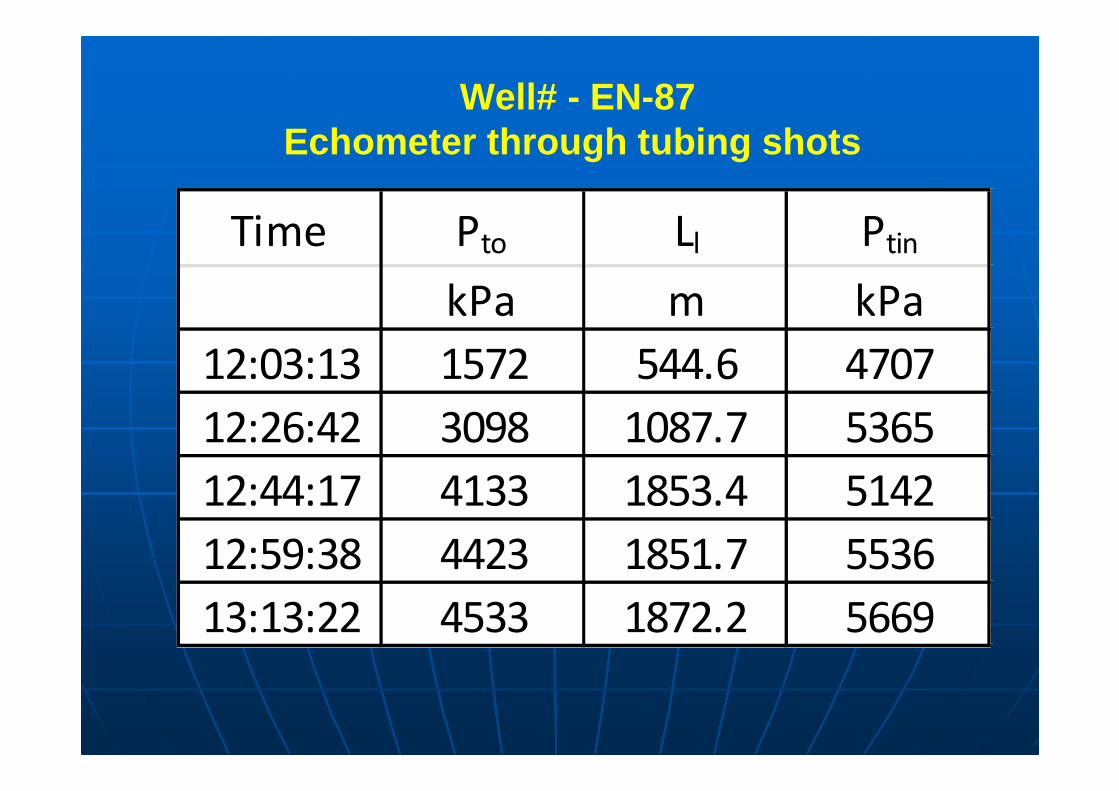
Well# - EN-87Echometer through tubing shots
Time Pto Ll Ptin
kPa m kPa
12:03:13 1572 544.6 4707
12:26:42 3098 1087.7 5365
12:44:17 4133 1853.4 5142
12:59:38 4423 1851.7 5536
13:13:22 4533 1872.2 5669
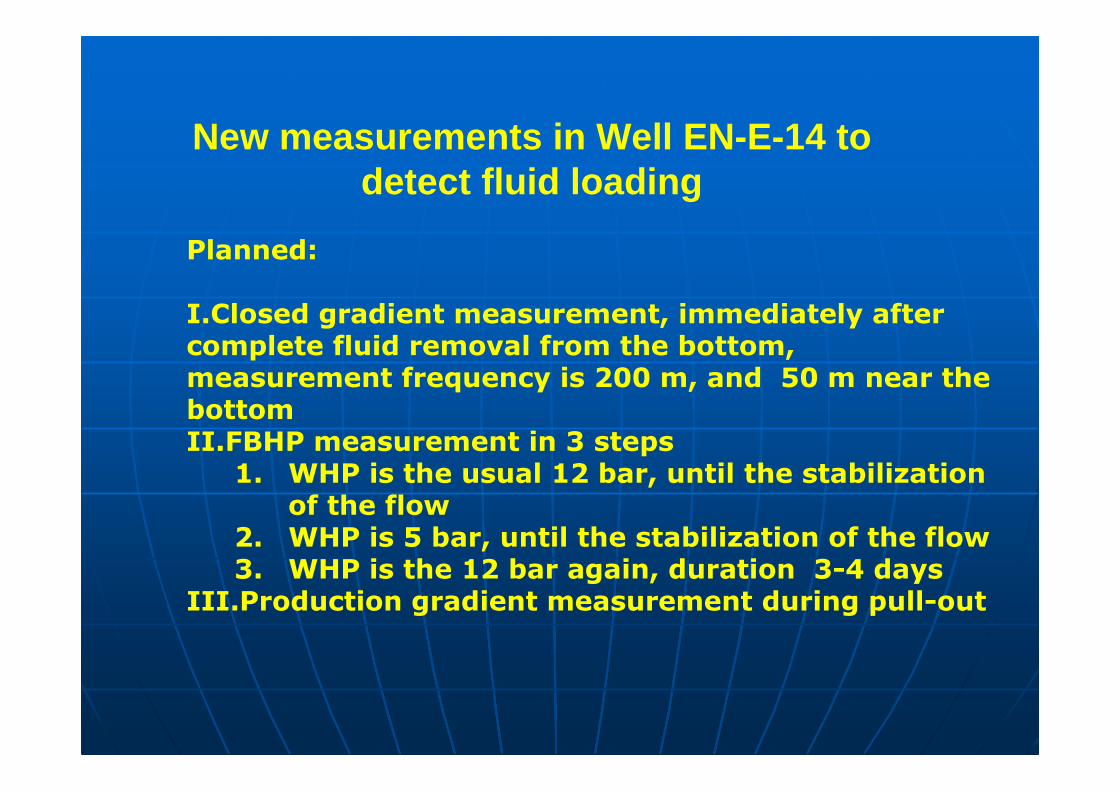
New measurements in Well EN-E-14 to detect fluid loading
Planned:
I.Closed gradient measurement, immediately after complete fluid removal from the bottom, measurement frequency is 200 m, and 50 m near the bottomII.FBHP measurement in 3 steps
1. WHP is the usual 12 bar, until the stabilization of the flow
2. WHP is 5 bar, until the stabilization of the flow3. WHP is the 12 bar again, duration 3-4 days
III.Production gradient measurement during pull-out

New measurements in Well EN-E-14 to detect fluid loading
Performed:(started:2012. 12. 04. 07:30)I.Closed gradient measurement, immediately after complete fluid removal from the bottom, measurement frequency is 200 m, and 50 m near the bottomII.FBHP measurement in 3 steps
1. WHP is the usual 12 bar, until the stabilization of the flow
2. WHP is 5 bar, until the stabilization of the flow3. WHP is 5 bar, duration hours
III.Production gradient measurement during pull-out(Finished: 2012. 12. 06. 12:30)

-10
10
30
50
70
90
110
130
150
20
25
30
35
40
45
0 500 1000 1500 2000 2500
Tem
pe
ratu
re,
oC
Pre
ssu
re,
kP
a,
De
nsi
ty,
kg
/m3
Depth, m
Well# EN-E-14, closed gradient
Pressure
Density
Temperature

115
117
119
121
123
125
127
129
2000
2200
2400
2600
2800
3000
3200
3400
3600
3800
4000
4 9 14 19 24
Tem
pe
ratu
re,
oC
Pre
ssu
re,
kP
a
Time, hour
Well# - EN-E-14, FBHP measurement, WHP: 10-12 bar
Pressure
Temperature
0
5
10
15
20
25
30
35
40
0
20
40
60
80
100
120
140
160
0.00 5.00 10.00 15.00 20.00
Pre
ssu
re
Flo
w r
ate
s
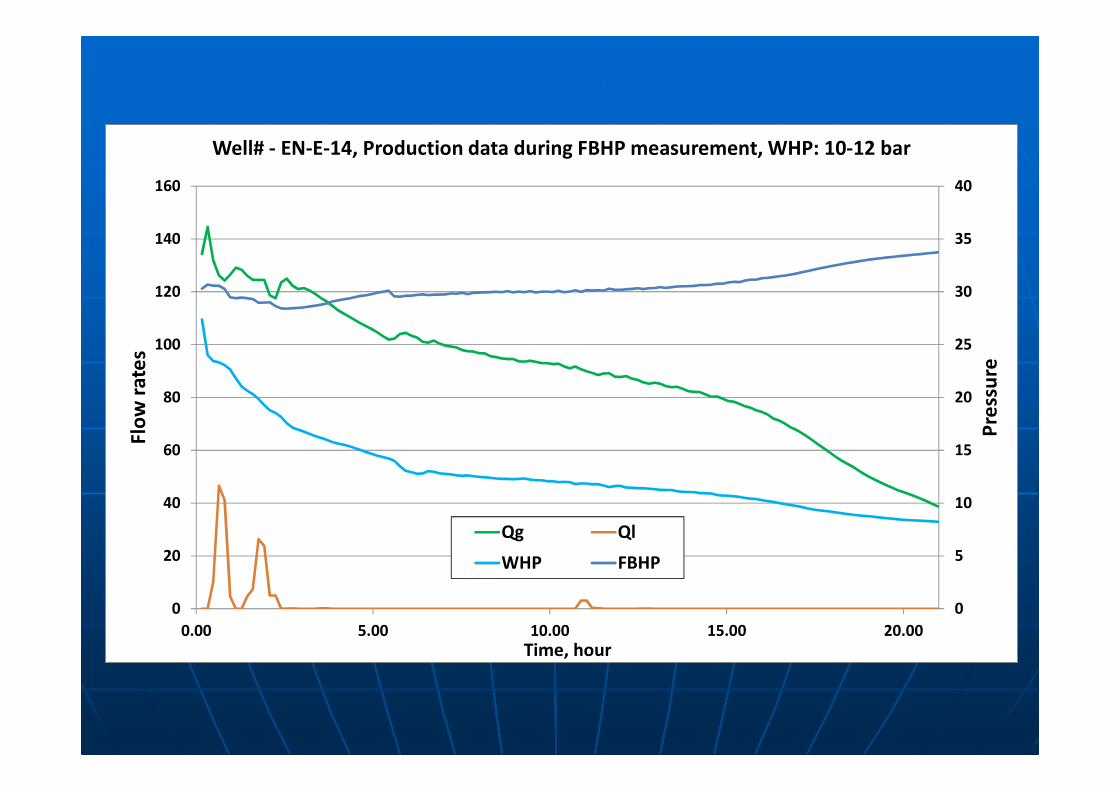
Time, hour
Well# - EN-E-14, Production data during FBHP measurement, WHP: 10-12 bar
Qg Ql
WHP FBHP
110
112
114
116
118
120
122
124
126
128
130
0
500
1000
1500
2000
2500
3000
3500
4000
25 30 35 40 45 50
Tem
pe
ratu
re,
oC
Pre
ssu
re,
kP
a
Time, hour
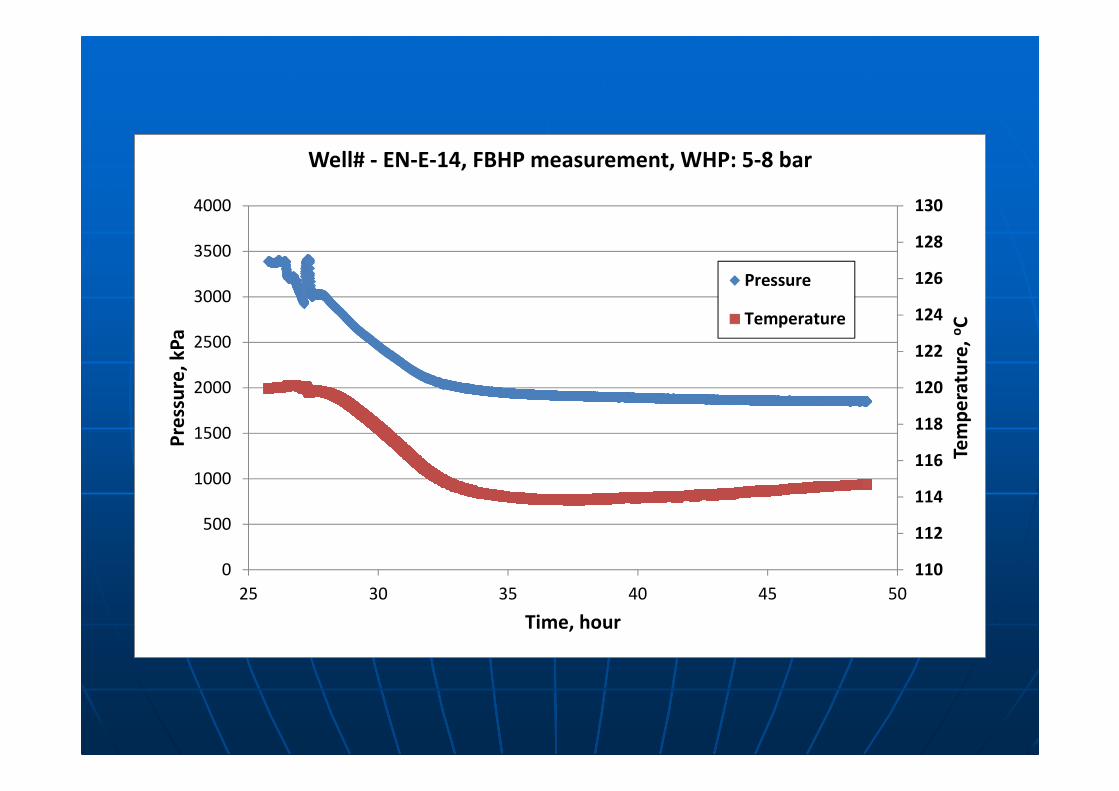
Well# - EN-E-14, FBHP measurement, WHP: 5-8 bar
Pressure
Temperature

0
5
10
15
20
25
30
35
40
0
20
40
60
80
100
120
140
0.00 5.00 10.00 15.00 20.00
Pre
ssu
re
Flo
w r
ate
Time, hour
Well# - EN-E-14, Production data during FBHP measurement, WHP: 5-8 bar
Qg Ql
WHP FBHP

0
20
40
60
80
100
120
140
160
180
200
0
200
400
600
800
1000
1200
1400
1600
1800
2000
0 500 1000 1500 2000 2500
Tem
pe
ratu
re,
oC
Pre
ssu
re,
kP
a
Depth, m
Well# -EN-E-14, flowing gradient
Pressure
Temperature

0
10
20
30
40
50
60
0 5 10 15 20 25 30
FB
HP,
ba
r
Gas flow rate, 1000 m3/day
IPR for Well# EN-E-14
IPR
Test
C=18.76 m3/day/bar2
n=0.9458

0 1 103× 2 10
3×0
2
4
6
8
10
0
50
100
150
200
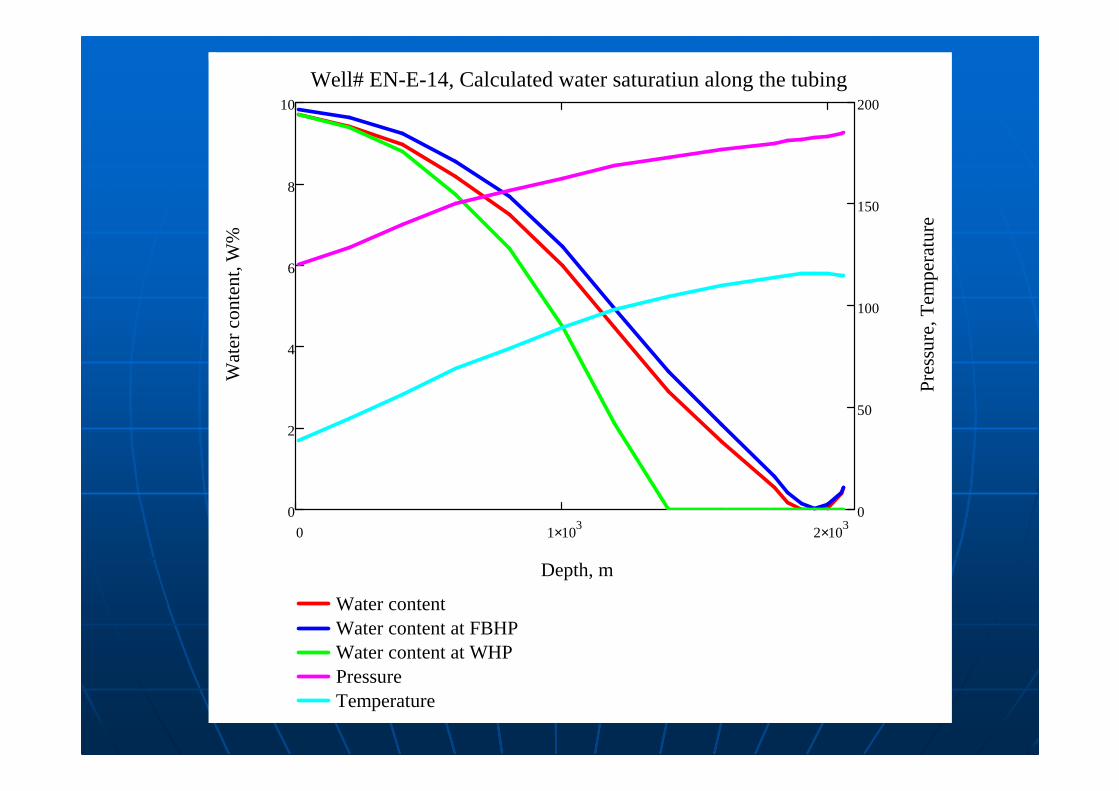
Water contentWater content at FBHPWater content at WHPPressureTemperature
Well# EN-E-14, Calculated water saturatiun along the tubing
Depth, m
Wat
er c
onte
nt, W
%
Pre
ssur
e, T
empe
ratu
re

1.Closed gradient2.Flowing gradient #13.Continuous FBHP measurement#1:4.Flowing gradient#21.Continuous FBHP measurement#2
Until ceasing production or stabilisation of a minimal flow rate
5.Closed gradient
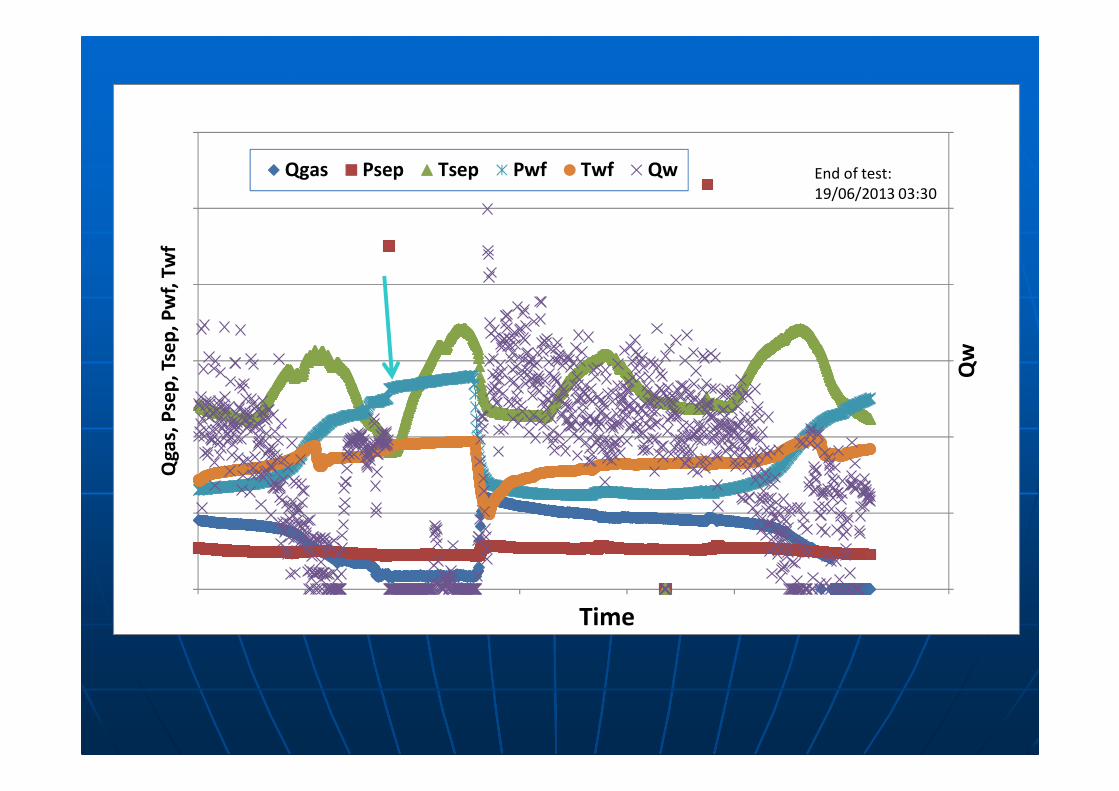
New program to show the water at the bottom

Qw
Qg
as,
Pse
p,
Tse
p,
Pw
f, T
wf
Time
Qgas Psep Tsep Pwf Twf Qw End of test:
19/06/2013 03:30
0
20
40
60
80
100
120
140
2000
2100
2200
2300
2400
2500
2600
2700
0 500 1000 1500 2000
Tem
pe
ratu
re,
C
Pre
ssu
re,
kP
a
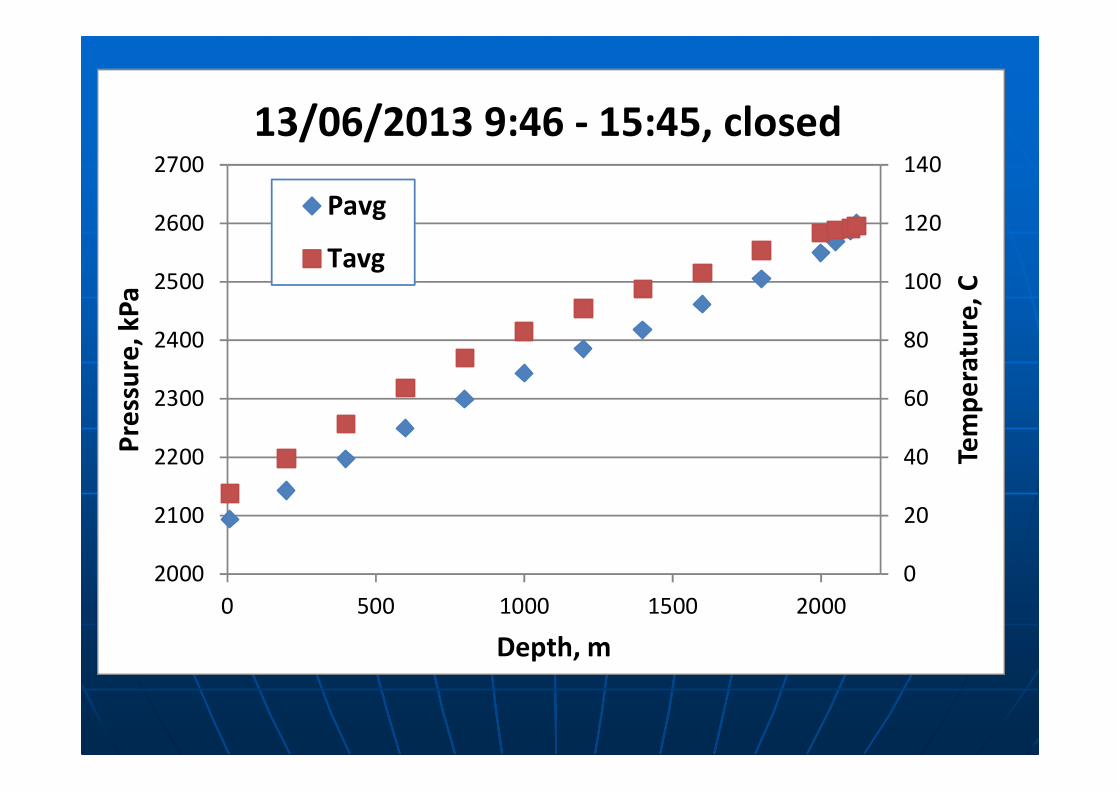
Depth, m
13/06/2013 9:46 - 15:45, closed
Pavg
Tavg
0
20
40
60
80
100
120
140
0
200
400
600
800
1000
1200
1400
0 500 1000 1500 2000 2500
Tem
pe
ratu
re,
C
Pre
ssu
re,
kP
a
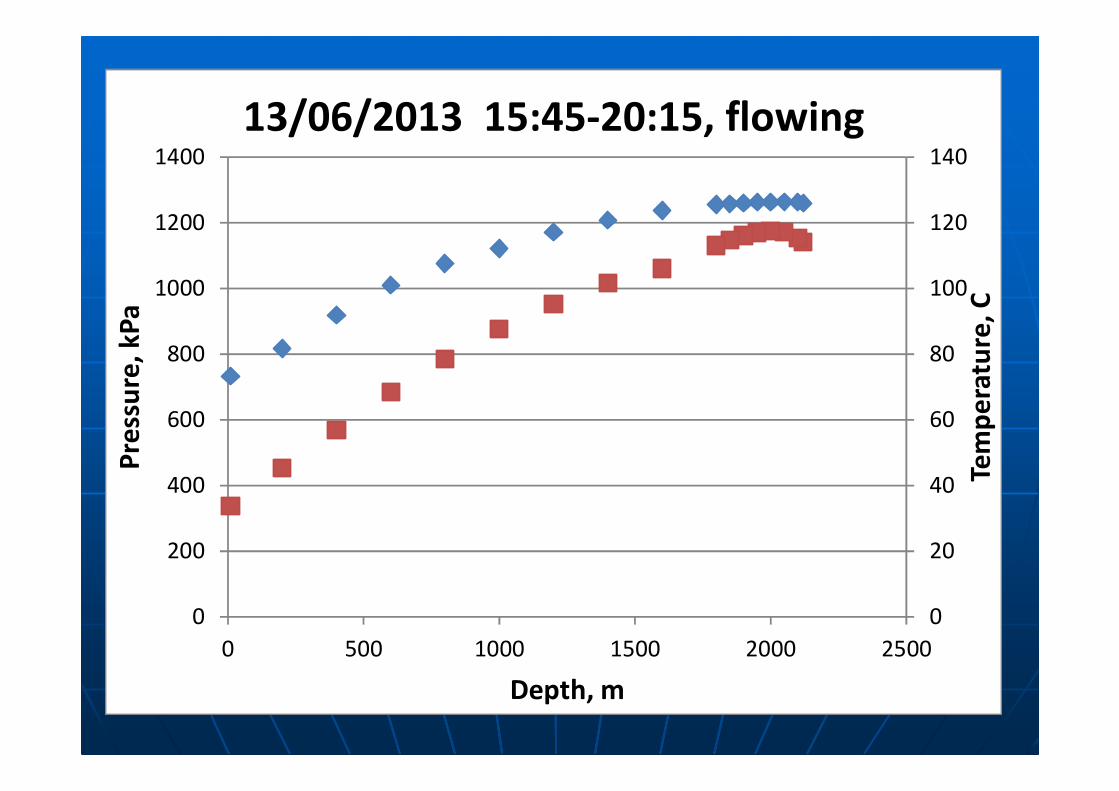
Depth, m
13/06/2013 15:45-20:15, flowing
Qw
Qg
as,
Pse
p,
Tse
p,
Pw
f, T
wf
Time
Qgas Psep Tsep Pwf Twf Qw End of test:
19/06/2013 03:30

0
20
40
60
80
100
120
140
160
180
200
0
500
1000
1500
2000
2500
3000
0 500 1000 1500 2000 2500
Tem
pe
ratu
re,
C
Pre
ssu
re,
Kp
a
Depth, m
15/06/2013 01:01:-5:35, flowing

Qw
Qg
as,
Pse
p,
Tse
p,
Pw
f, T
wf
Time
Qgas Psep Tsep Pwf Twf Qw End of test:
19/06/2013 03:30

0
20
40
60
80
100
120
140
0
200
400
600
800
1000
1200
1400
1600
1800
2000
0 500 1000 1500 2000 2500
Tem
pe
ratu
re,
C
Pre
ssu
re,
kP
a
Depth, m
17/06/2013 7:50-11:00, after
compressor problem

0
20
40
60
80
100
120
140
0
200
400
600
800
1000
1200
1400
0 500 1000 1500 2000 2500
Tem
pe
ratu
re,
C
Pre
ssu
re,
kP
a
Depth, m
17/06/2013 21:39-18/06/2013 02:09, flowing

Qw
Qg
as,
Pse
p,
Tse
p,
Pw
f, T
wf
Time
Qgas Psep Tsep Pwf Twf Qw End of test:
19/06/2013 03:30

0
20
40
60
80
100
120
140
2400
2450
2500
2550
2600
2650
2700
2750
2800
2850
0 500 1000 1500 2000 2500
Tem
pe
ratu
re,
C
Pre
ssu
re,
kP
a
Depth, m
19/06/2013 7:40-12:56, closed
406 kg/m 3
SummarySummary
�� Identification of liquid loadingIdentification of liquid loading
•• Evaluate adequate dataEvaluate adequate data
�� MeasurementsMeasurements
�� Identification of loading typeIdentification of loading type
�� Determination of the way of liquid removalDetermination of the way of liquid removal

Well# Well# -- EN EN –– EE-- 1414
�� Loading is occurred at the upper part of Loading is occurred at the upper part of
tubingtubing
�� There There areare no possibilities to increase flow no possibilities to increase flow
raterate (from the terms of liquid removal)(from the terms of liquid removal)
�� Possible solution#1: heating the upper Possible solution#1: heating the upper
part of the tubing (Insulation is not part of the tubing (Insulation is not
enough)enough)
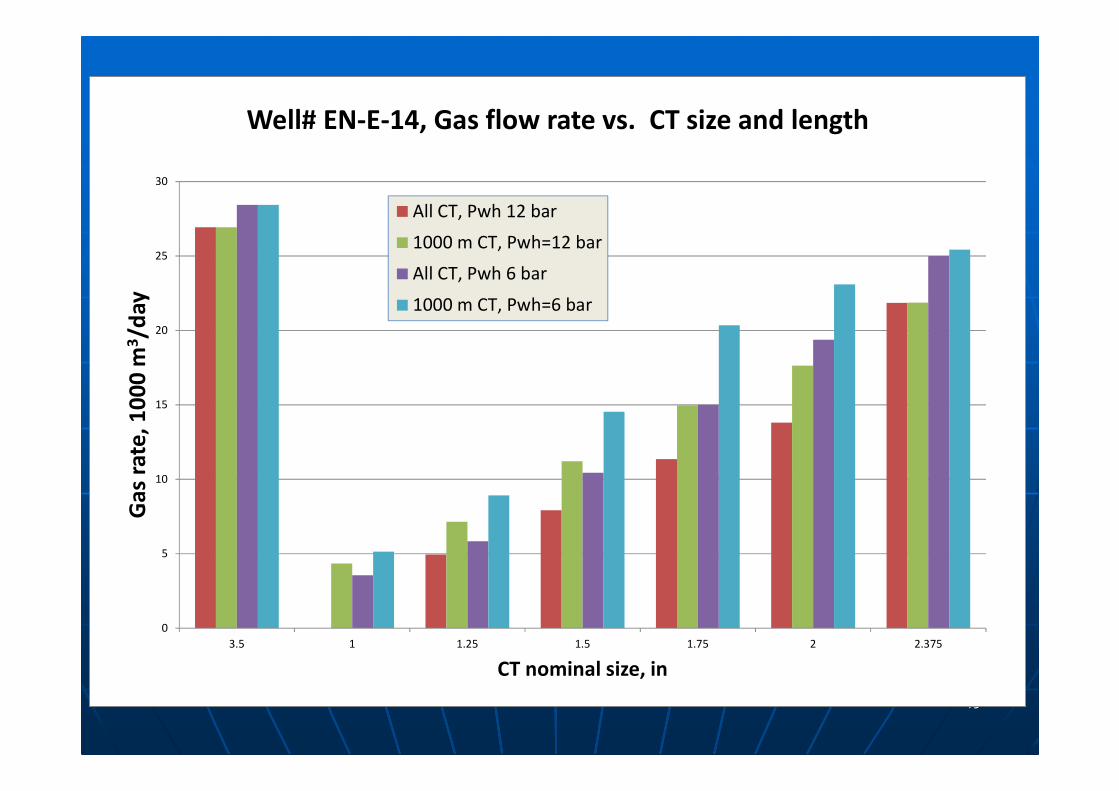
�� Possible solution#2:Using CT at the upper Possible solution#2:Using CT at the upper
1000 m of the tubing.1000 m of the tubing.
4949
0
5
10
15
20
25
30
3.5 1 1.25 1.5 1.75 2 2.375
Ga
s ra
te,
10
00
m3/d
ay
CT nominal size, in
Well# EN-E-14, Gas flow rate vs. CT size and length
All CT, Pwh 12 bar
1000 m CT, Pwh=12 bar
All CT, Pwh 6 bar
1000 m CT, Pwh=6 bar

5050
Thank You for Your Attention!