Embed Size (px)
Citation preview
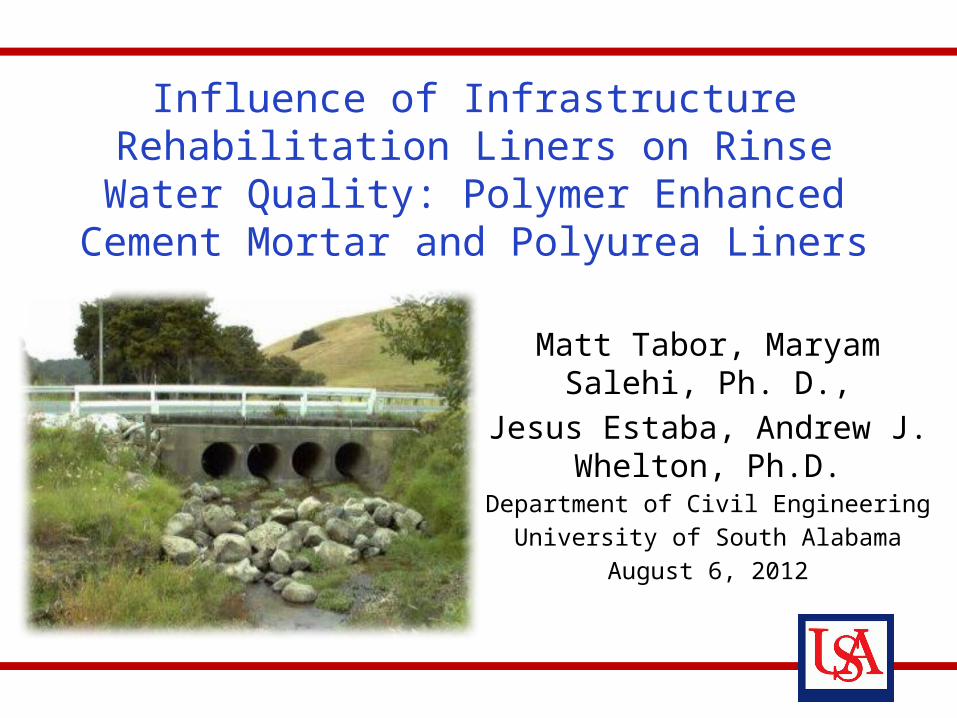
Matt Tabor, Maryam Salehi, Ph. D.,Jesus Estaba, Andrew J. Whelton,
Ph.D.Department of Civil Engineering
University of South AlabamaAugust 6, 2012
Influence of Infrastructure Rehabilitation Liners on Rinse Water Quality: Polymer Enhanced Cement Mortar and Polyurea
Liners
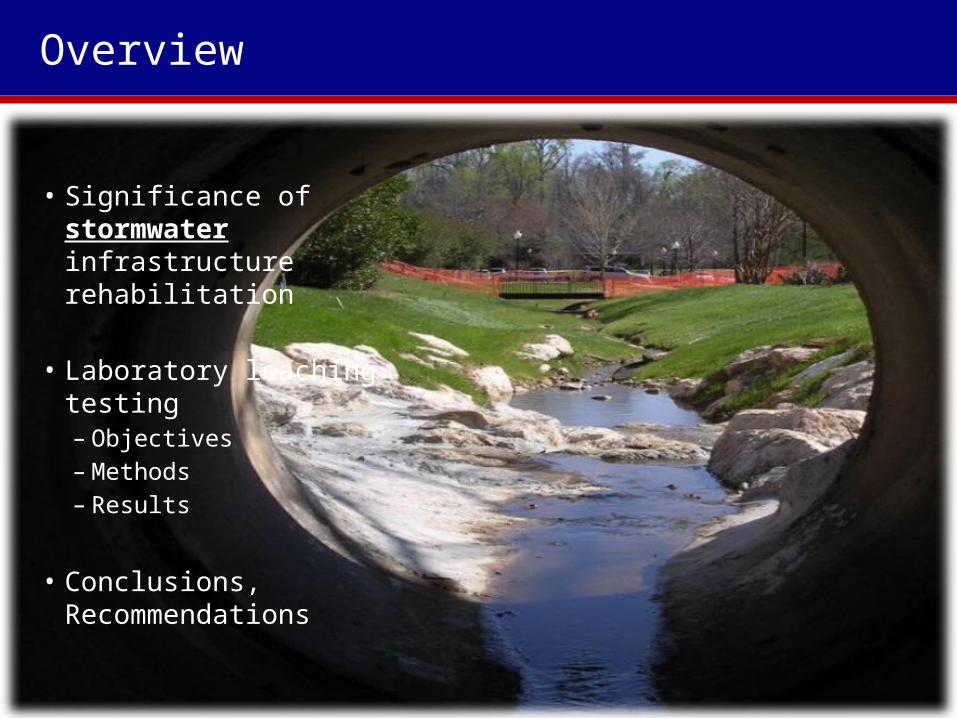
• Significance of stormwater infrastructure rehabilitation
• Laboratory leaching testing– Objectives– Methods– Results
• Conclusions, Recommendations
Overview
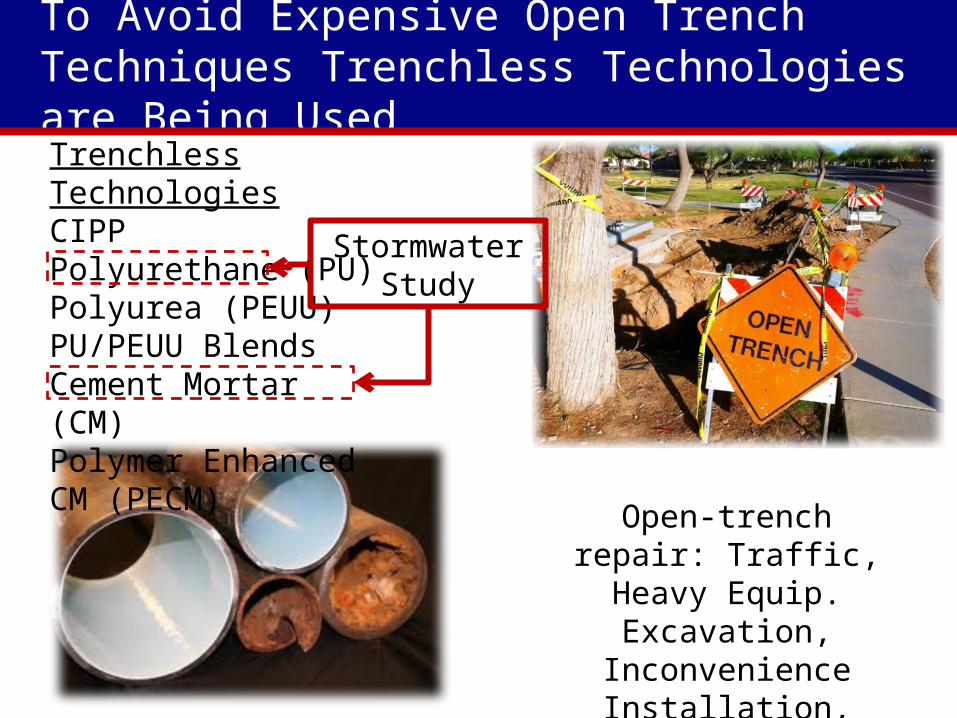
To Avoid Expensive Open Trench Techniques Trenchless Technologies are Being Used
Open-trench repair: Traffic, Heavy Equip.
Excavation, InconvenienceInstallation, Cover
Trenchless TechnologiesCIPPPolyurethane (PU)Polyurea (PEUU)PU/PEUU BlendsCement Mortar (CM)Polymer Enhanced CM (PECM)
Stormwater Study
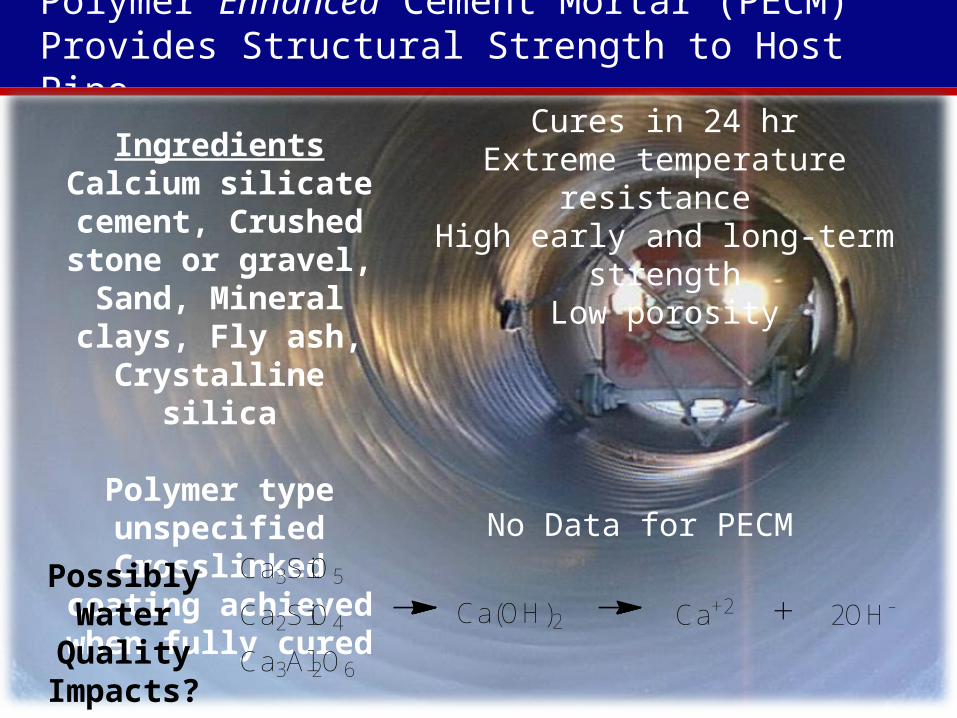
Polymer Enhanced Cement Mortar (PECM) Provides Structural Strength to Host Pipe
Ca3SiO5
Ca2SiO4
Ca3Al2O6
Ca(OH)2 Ca+2 2OH-
IngredientsCalcium silicate
cement, Crushed stone or gravel, Sand, Mineral clays, Fly ash,
Crystalline silica
Polymer type unspecified Crosslinked
coating achieved when fully cured
Cures in 24 hrExtreme temperature resistance High early and long-term strength
Low porosity
Possibly Water Quality
Impacts?
No Data for PECM
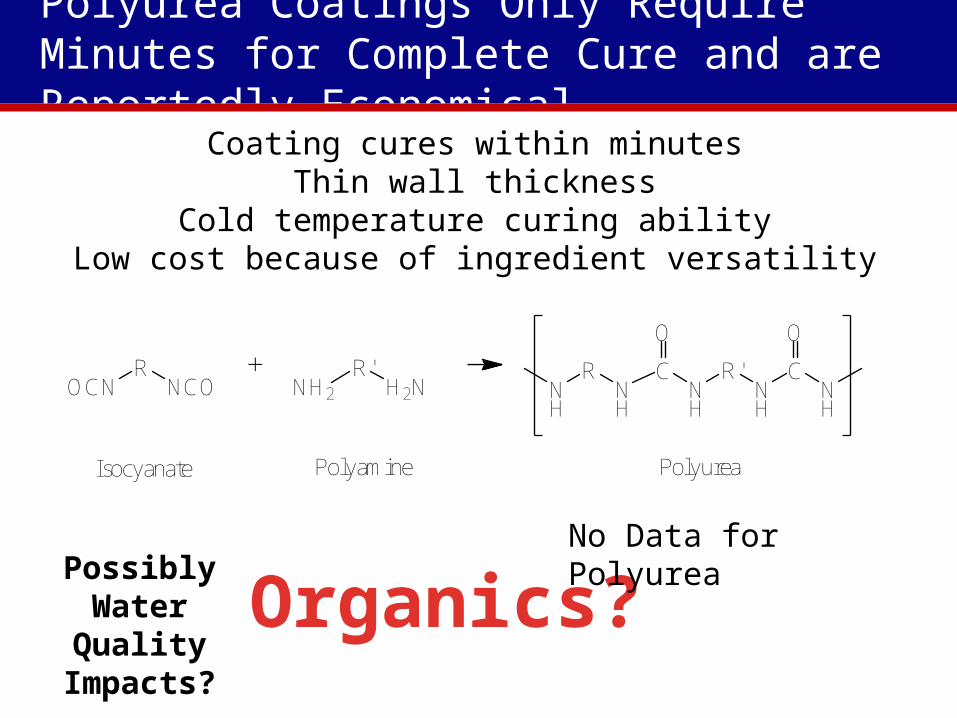
Polyurea Coatings Only Require Minutes for Complete Cure and are Reportedly Economical
Isocyanate Polyamine Polyurea
ROCN NCO
R'NH2 H2N
RNH
NH
C
O
NH
R'NH
C
O
NH
Coating cures within minutesThin wall thickness
Cold temperature curing abilityLow cost because of ingredient versatility
Possibly Water Quality
Impacts?Organics?
No Data for Polyurea
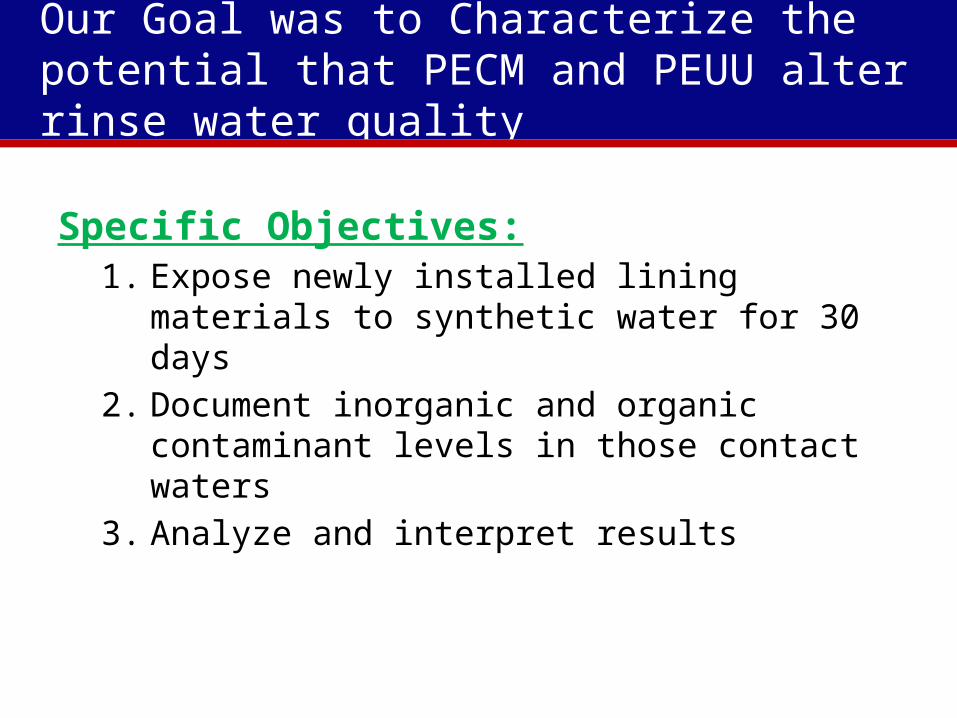
Specific Objectives:1. Expose newly installed lining materials to
synthetic water for 30 days 2. Document inorganic and organic contaminant
levels in those contact waters3. Analyze and interpret results
Our Goal was to Characterize the potential that PECM and PEUU alter rinse water quality
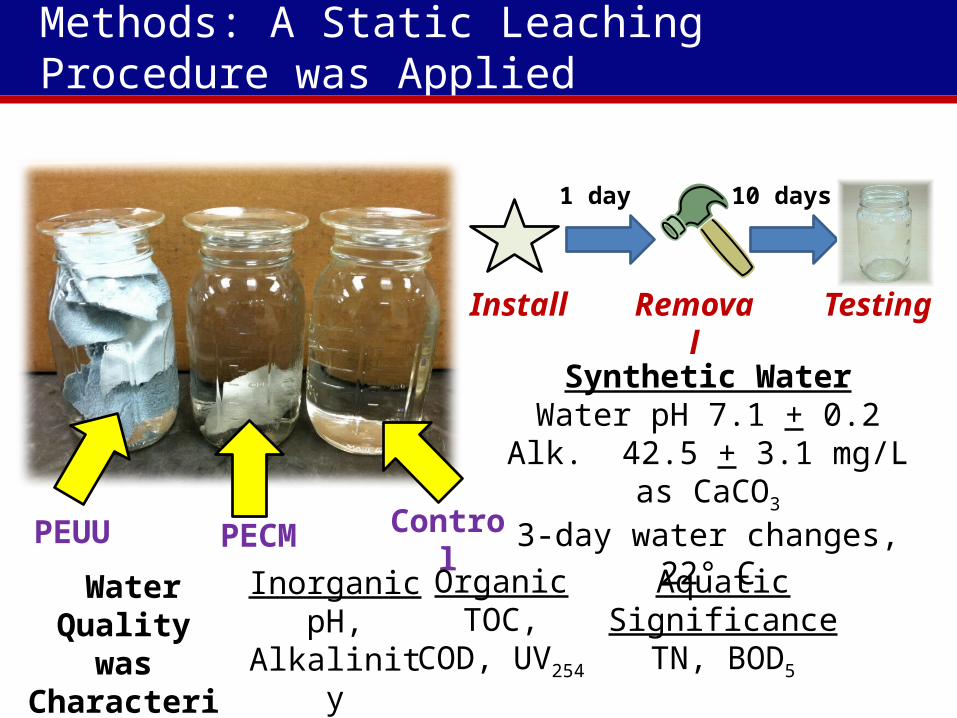
Methods: A Static Leaching Procedure was Applied
Synthetic WaterWater pH 7.1 + 0.2
Alk. 42.5 + 3.1 mg/L as CaCO3
3-day water changes, 22° CPEUU PECM Control
1 day
Install Removal
10 days
Testing
Aquatic SignificanceTN, BOD5
InorganicpH, Alkalinity
OrganicTOC, COD,
UV254
Water Quality was
Characterized
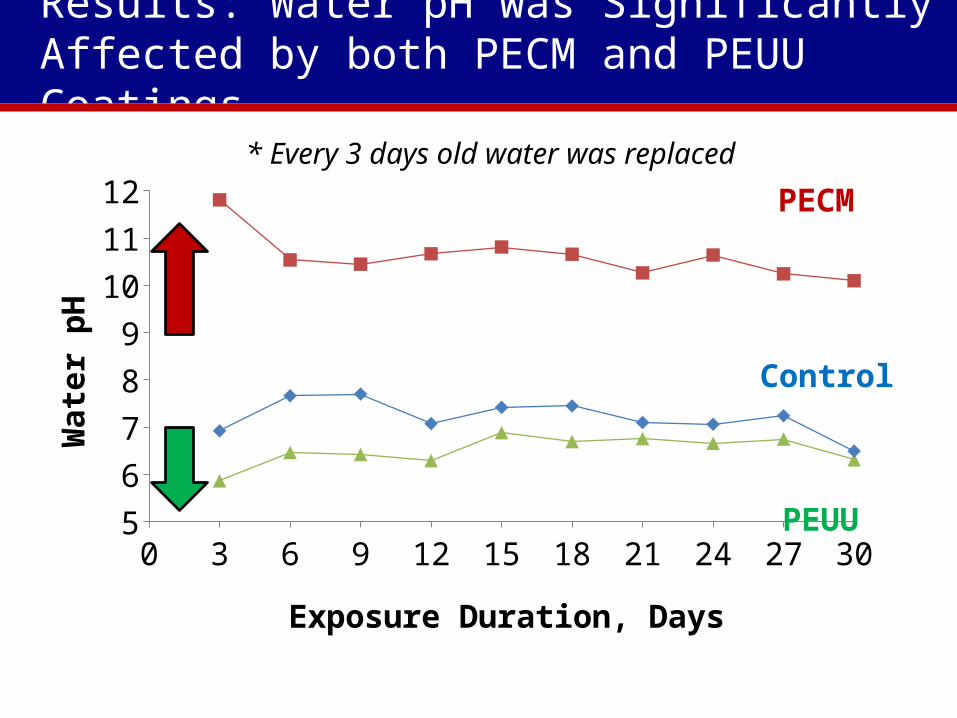
Results: Water pH was Significantly Affected by both PECM and PEUU Coatings
0 3 6 9 12 15 18 21 24 27 305
6
7
8
9
10
11
12
Exposure Duration, Days
Wat
er p
H
PECM
Control
PEUU
* Every 3 days old water was replaced
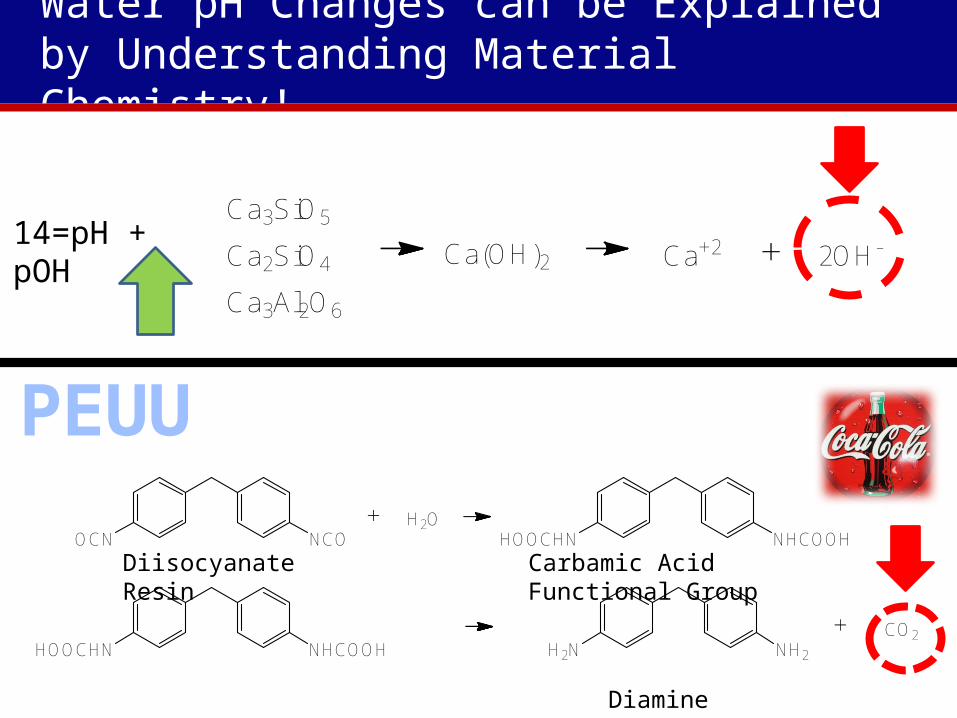
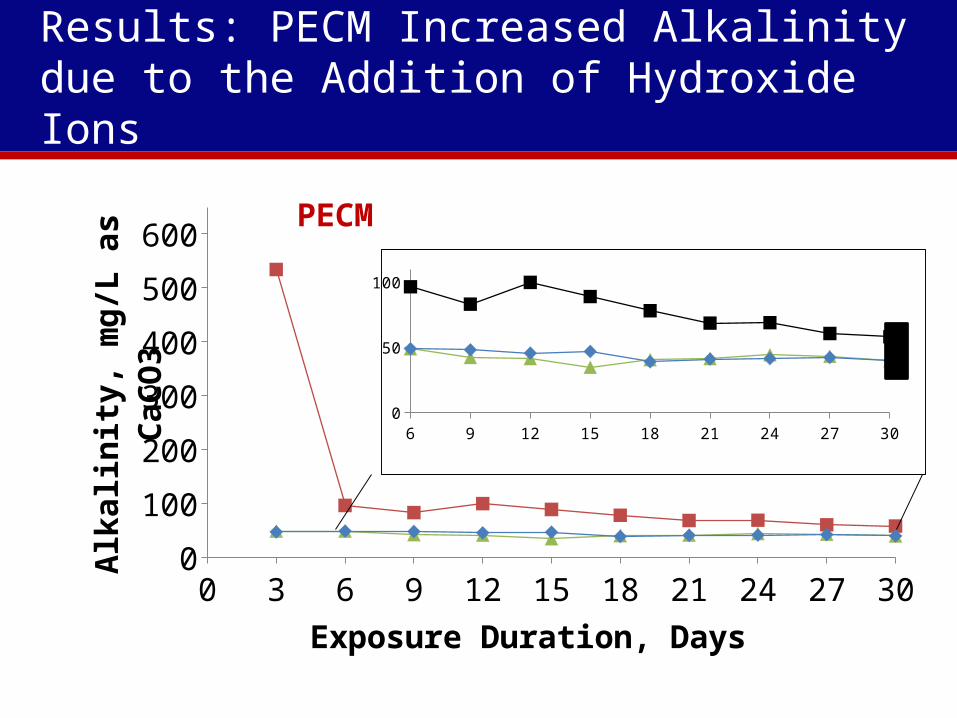
Water pH Changes can be Explained by Understanding Material Chemistry!
Ca3SiO5
Ca2SiO4
Ca3Al2O6
Ca(OH)2 Ca+2 2OH-14=pH + pOH
PECM
PEUU
Diisocyanate Resin Carbamic Acid Functional Group
Diamine
NCOOCNH2O
NHCOOHHOOCHN
NH2H2NCO2
NHCOOHHOOCHN
0 3 6 9 12 15 18 21 24 27 300
100
200
300
400
500
600
Exposure Duration, Days
Alk
alin
ity,
mg/
L a
s C
aCO
3
Results: PECM Increased Alkalinity due to the Addition of Hydroxide Ions
6 9 12 15 18 21 24 27 300
50
100
PECM
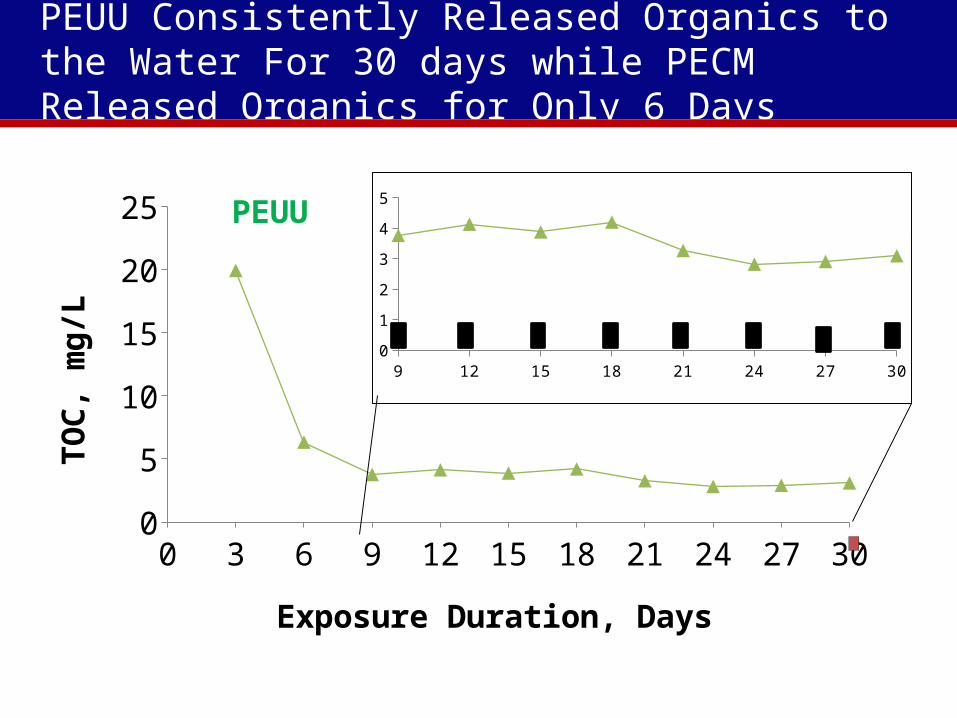
PEUU Consistently Released Organics to the Water For 30 days while PECM Released Organics for Only 6 Days
0 3 6 9 12 15 18 21 24 27 300
5
10
15
20
25
Exposure Duration, Days
TO
C, m
g/L
9 12 15 18 21 24 27 300
1
2
3
4
5PEUU
0 3 6 9 12 15 18 21 24 27 300
20
40
60
80
100
120
Exposure Duration, Days
CO
D, m
g/L
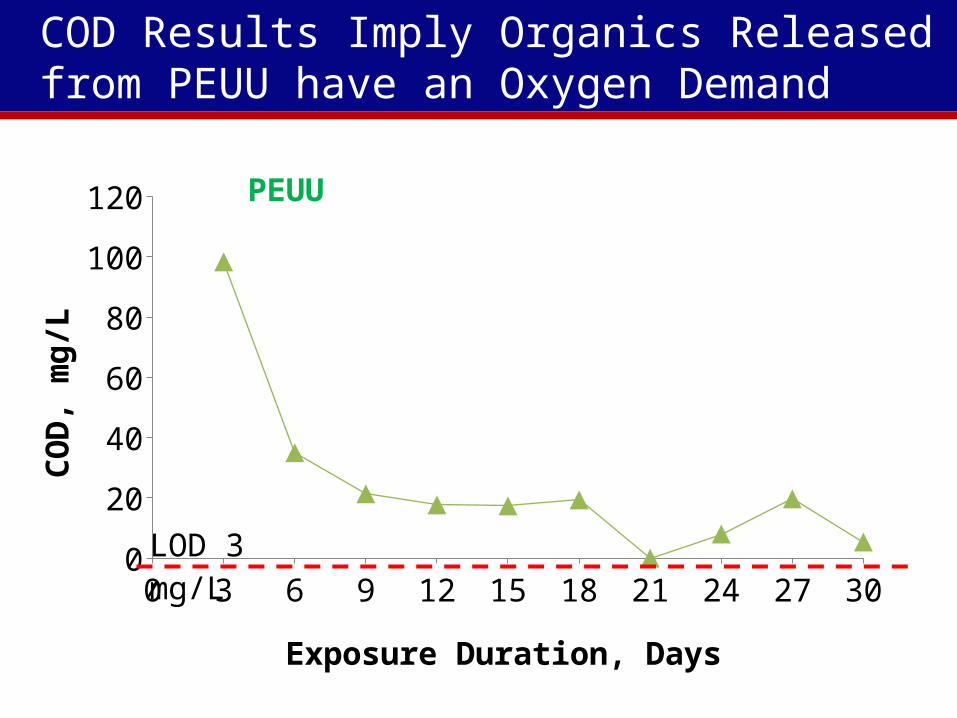
LOD 3 mg/L
COD Results Imply Organics Released from PEUU have an Oxygen Demand
PEUU
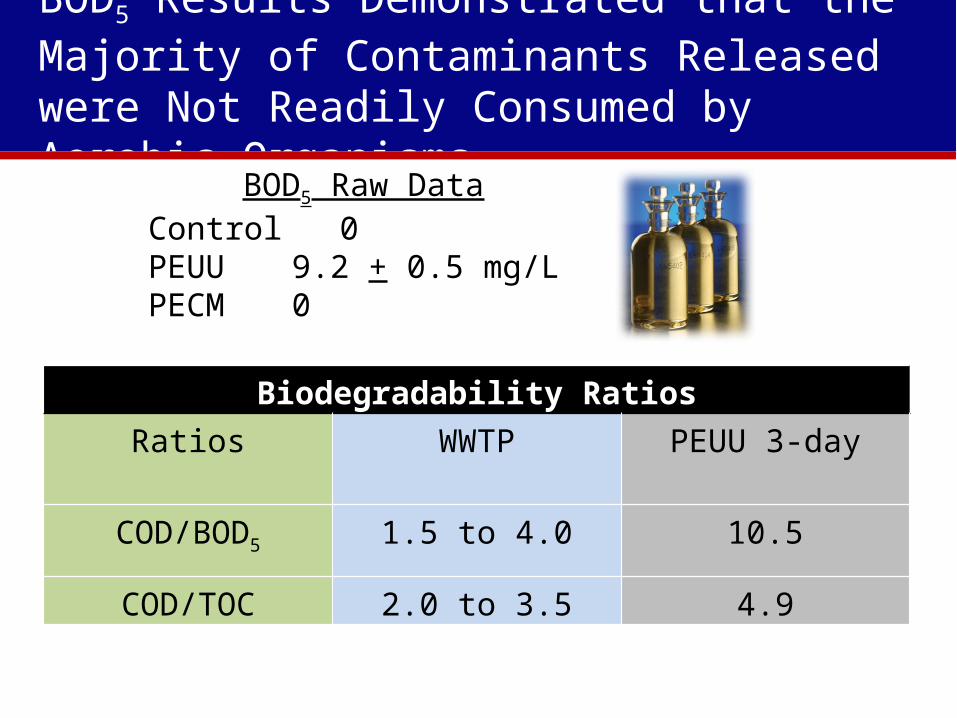
BOD5 Results Demonstrated that the Majority of Contaminants Released were Not Readily Consumed by Aerobic Organisms
BOD5 Raw DataControl 0PEUU 9.2 + 0.5 mg/L PECM 0
Biodegradability RatiosRatios WWTP PEUU 3-day
COD/BOD5 1.5 to 4.0 10.5
COD/TOC 2.0 to 3.5 4.9
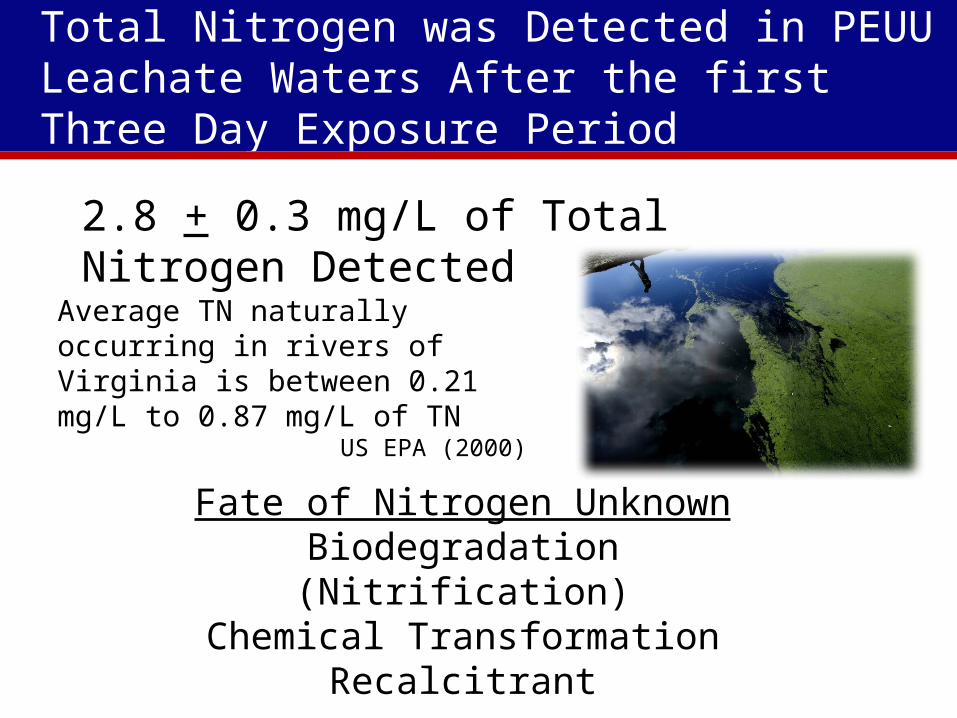
Total Nitrogen was Detected in PEUU Leachate Waters After the first Three Day Exposure Period
2.8 + 0.3 mg/L of Total Nitrogen Detected
Average TN naturally occurring in rivers of Virginia is between 0.21 mg/L to 0.87 mg/L of TN
US EPA (2000)
Fate of Nitrogen UnknownBiodegradation (Nitrification)
Chemical TransformationRecalcitrant
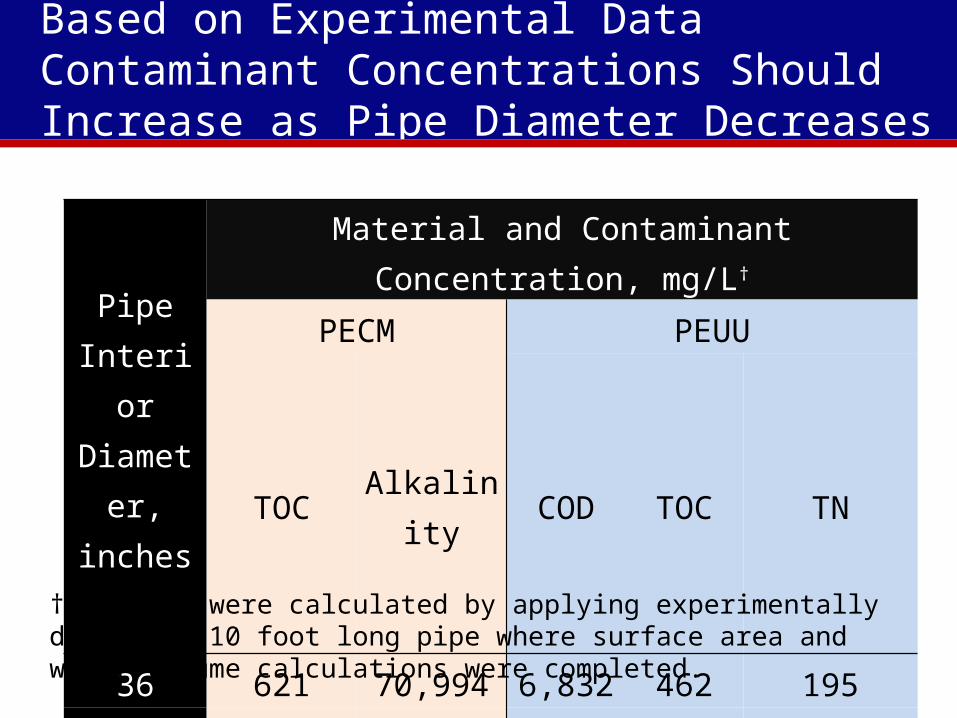
Based on Experimental Data Contaminant Concentrations Should Increase as Pipe Diameter Decreases
Pipe Interior
Diameter, inches
Material and Contaminant Concentration, mg/L†
PECM PEUU
TOC Alkalinity COD TOC TN
36 621 70,994 6,832 462 195
24 860 98,300 9,640 640 270
12 1,577 180,217 17,343 1,173 495† Results were calculated by applying experimentally data to a 10 foot long pipe where surface area and water volume calculations were completed.
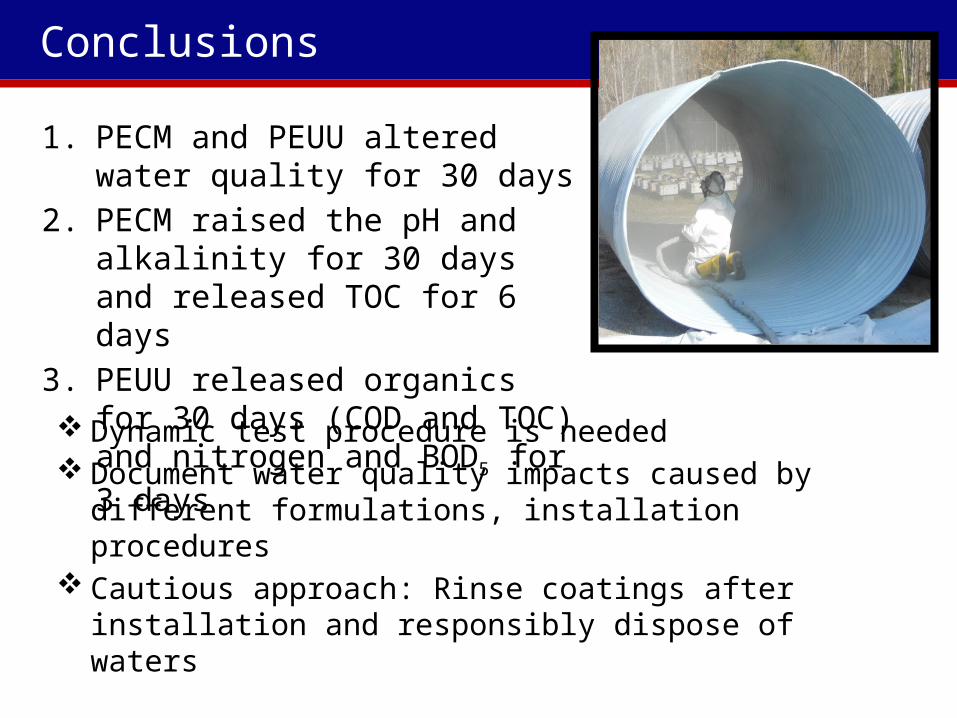
Conclusions
1. PECM and PEUU altered water quality for 30 days
2. PECM raised the pH and alkalinity for 30 days and released TOC for 6 days
3. PEUU released organics for 30 days (COD and TOC) and nitrogen and BOD5 for 3 days
Dynamic test procedure is needed Document water quality impacts caused by
different formulations, installation procedures Cautious approach: Rinse coatings after
installation and responsibly dispose of waters
Acknowledgement
Ms. Laura Linn (Dauphin Island Sea Laboratory)
Ms. Bridget Donaldson (Virginia Department of Transportation)
Ms. Eddy Colmenarez (University of South Alabama)
Dr. Kevin White (University of South Alabama)
Ms. Suzanne Lindblom (Mobile Area Water and Sewer System)
Dr. Andrew J. WheltonDepartment of Civil Engineering
University of South [email protected]
Matthew TaborDepartment of Civil Engineering
University of South [email protected]