Embed Size (px)
Citation preview
vol. 176, no. 6 the american naturalist december 2010 �
Matrix Dimensions Bias Demographic Inferences:
Implications for Comparative Plant Demography
Roberto Salguero-Gomez* and Joshua B. Plotkin
Biology Department, University of Pennsylvania, Philadelphia, Pennsylvania 19104
Submitted December 8, 2009; Accepted August 12, 2010; Electronically published October 22, 2010
Online enhancement: zip file.
abstract: While the wealth of projection matrices in plant de-mography permits comparative studies, variation in matrix dimen-sions complicates interspecific comparisons. Collapsing matrices toa common dimension may facilitate such comparisons but may alsobias the inferred demographic parameters. Here we examine howmatrix dimension affects inferred demographic elasticities and howdifferent collapsing criteria perform. We analyzed matrices13 # 13representing nine plant species, collapsing these matrices (i) into even
, , , and matrices and (ii) into matrices7 # 7 5 # 5 4 # 4 3 # 3 5 # 5using different criteria. Stasis and fecundity elasticities increasedwhen matrix dimension was reduced, whereas those of progressionand retrogression decreased. We suggest a collapsing criterion thatminimizes dissimilarities between the original- and collapsed-matrixelasticities and apply it to 66 plant species to study how life spanand growth form influence the relationship between matrix dimen-sion and elasticities. Our analysis demonstrates that (i) projectionmatrix dimension has significant effects on inferred demographicparameters, (ii) there are better-performing methods than previouslysuggested for standardizing matrix dimension, and (iii) herbaceousperennial projection matrices are particularly sensitive to changes inmatrix dimensionality. For comparative demographic studies, we rec-ommend normalizing matrices to a common dimension by collaps-ing higher classes and leaving the first few classes unaltered.
Keywords: collapsing, comparative plant demography, elasticity, ma-trix dimension, population growth rate (l), projection matrixmodels.
Introduction
Although most ecologists carry out specific experimentswith a limited set of study species, their ultimate goal isto discover general rules, often by compiling and com-paring studies. Indeed, most general ecological rules (e.g.,exponential growth potential and regulated populationgrowth, the principle of competitive exclusion, robust co-existence, life-history trade-offs) arose and have been con-
* Corresponding author; e-mail: [email protected].
Am. Nat. 2010. Vol. 176, pp. 000–000. � 2010 by The University of Chicago.0003-0147/2010/17606-51781$15.00. All rights reserved.DOI: 10.1086/657044
firmed through the extensive application of standardized,comparative methodologies.
In the case of demography, projection matrix modelshave become a widely used, powerful tool for studyingecological and evolutionary questions. A matrix modelclassifies individuals in a population according to a discreterange of ages (Leslie 1945), sizes, or developmental stages(Lefkovitch 1965) or a mixture of these variables (e.g.,Ehrlen et al. 2005; Jacquemyn et al. 2005). The projectionmatrix quantifies three fundamental processes for each ofthe classes that together determine the life cycle of thespecies: (i) the probability of survival of its individuals,(ii) their probability of staying in the same class (stasis)or transition to another class (progression to higher classesor retrogression to lower classes), and (iii) their contri-butions with newborns to the population (fecundity). Ma-trix models have been used to project population growth(e.g., Lefkovitch 1965; Marrero-Gomez et al. 2007) and toexamine the relative contributions of the different de-mographic processes to the population growth rate (e.g.,Bierzychudek 1999; van Mantgem and Stephenson 2005)using elasticity analysis (de Kroon et al. 1986). Matrixmodels have also been used to explore the importance ofalternative life-history strategies (e.g., Moloney 1988; Mor-ris and Doak 1998), to identify the most vulnerable classesof a life cycle for the purposes of population management(Werner and Caswell 1977; Lubben et al. 2008), and toestablish exploitation regimes that are compatible withlong-term demographic viability (Nault and Gagnon 1993;Freckleton et al. 2003).
A great potential for comparative demographic studieshas emerged from the large body of literature based onpopulation projection matrices. Such matrices have nowbeen estimated from data and published for more than475 plant species (R. Salguero-Gomez, unpublished data),whose life spans range across four orders of magnitude(e.g., Namkoong and Roberds 1974; Dostal 2007). Becausethese demographic dynamics are compiled in the sameformat—a matrix—the data can, in principle, be used to

000 The American Naturalist
Figure 1: Life span (mean � SE, gray bars) and matrix dimension (mean� SE, white bars) by growth form, collated from 475 published projectionmatrices of plant species. Letters indicate significant differences amonggroups (Tukey-Kramer HSD test).
examine broad ecological and evolutionary questionsabout demographic dynamics.
Studies using large numbers of projection matrices haveallowed for linkage between specific demographic pro-cesses and stages along ecological succession gradients (Sil-vertown et al. 1992); for the establishment of methodol-ogies to study the responses of populations to ecotones(Angert 2006), herbivory (Maron and Crone 2006), orhabitat fragmentation (Bruna et al. 2009); and for com-paring demographic dynamics of native and invasive plantspecies (Ramula et al. 2008), phylogenetic relationships oflife-history strategies (Burns et al. 2010), or relationshipsbetween short-term (transient) and long-term (asymp-totic) population dynamics (Stott et al. 2010). The numberof demographic studies based on projection matrices isgrowing rapidly (fig. A1, in the online edition of the Amer-ican Naturalist). Consequently, matrix models will likelyserve an important role in future studies of broad eco-logical and evolutionary questions.
Using published projection matrices for comparativestudies is attractive, but it is complicated by the fact thatthese matrices vary in the number of classes employed, ormatrix dimension (fig. 1). The dimension of projectionmatrices influences the apparent demographic processesof a specific class, such as per capita fecundities (de Matosand Silva Matos 1998), as well as other parameters derivedfrom the matrix, such as population growth rates (Lamarand McGraw 2005; Ramula and Lehtila 2005); transientdynamics (Tenhumberg et al. 2009; Stott et al. 2010); elas-ticities of matrix elements (Silvertown et al. 1993; Enrightet al. 1995) and vital rates (Zuidema 2000; Salguero-Gomez and Casper 2010); elasticities of demographic path-ways (Salguero-Gomez and Casper 2010), as analyzed byloop analysis (van Groenendael et al. 1994); and demo-graphic relationships based on phylogeny (Burns et al.2010; Stott et al. 2010). This is a nontrivial issue becausematrix dimension varies a great deal, from two (Sohn andPolicansky 1977) to 24 (Meagher 1982). Although severalalgorithms have been proposed to determine optimumcriteria to establish cutoffs for classes in constructing theoriginal matrices (Vandermeer 1978; Moloney 1986; Shi-matani et al. 2007), thus offering some standardization,most plant demographers still classify systems on the basisof the specific biology of the species and the question beingasked (Caswell 2001).
Concerns about matrix dimension were first addressedby Enright et al. (1995), who suggested ways to overcomethe problem of variation in dimension among projectionmatrices. First, they proposed keeping the number of clas-ses proportional to the life span of each species. However,populations of many short-lived herbaceous species areusually classified using many life stages (e.g., 15 classes inAllium tricoccum [Nault and Gagnon 1993] and 17 in Ari-
saema serratum [Kakehashi and Kinoshita 1990]; fig. 1).It would be laborious and probably meaningless from abiological perspective to follow the suggestion of Enrightet al. (1995) and enforce a correspondingly higher numberof life stages for longer-lived herbaceous, shrub, palm, andtree species (Ebert 1999; Caswell 2001). On the other hand,decreasing the number of classes for shorter-lived speciesmatrices would blur the study of their demographic dy-namics. Alternatively, Enright et al. (1995) recommendedcollapsing matrices to the same dimension for all speciesof a comparative study. However, we know of no com-parative plant demographic study that has adopted thissuggestion (but see Salguero-Gomez and Casper 2010),perhaps because this would require raw census data foreach species, which are frequently unavailable.

Matrices in Plant Comparative Demography 000
Currently, comparative demographic studies either donot control for varying matrix dimensions (Silvertown etal. 2001; Franco and Silvertown 2004; Bruna et al. 2009)or treat dimension as a covariate in the analysis (Ramulaet al. 2008; Burns et al. 2010; Stott et al. 2010), which isinappropriate unless the residuals are normally distributedwith linear effects on inferred parameters. Integral pro-jection models (IPMs; Easterling et al. 2000), on the otherhand, offer an appealing alternative for demographic com-parisons because they are more robust to life-cycle com-plexity than classical projection matrices (Ramula et al.2008; Zuidema et al. 2010). However, we know of only adozen plant species that have been studied with IPMs. Forclassical projection matrices, Enright et al. (1995) sug-gested specific collapsing criteria to minimize alterationsto demographic inferences. These criteria include formingcollapsed classes of similar residence times (the averagetime spent by an individual in a given class) and notmerging nonreproductive and reproductive classes, be-cause they are biologically different. However, no studyhas explicitly evaluated whether these collapsing criteriaminimize associated changes to demographic inferencesdrawn from the collapsed matrix.
In this article, we explore the inferred demographicparameters associated with matrices of different dimen-sions with the goal of providing rational guidelines forinterspecific comparative studies. Specifically, we evaluatehow the relative importance of each demographic pa-rameter (elasticity) varies as a function of matrix di-mension. We pay special attention to the populationgrowth rate and elasticities because they are of primaryinterest in comparative studies (Silvertown et al. 2001).We examine an overlooked algorithm that allows the re-duction of matrix dimension without using raw data andwithout altering the inferred population growth rate, re-productive output, or stable class distribution (Hooley2000). We apply this algorithm to the projection matricesof nine plant species with different growth forms andlongevities in order to (i) study the dissimilarities in theinferred elasticities of demographic processes in collapsedmatrices and (ii) evaluate Enright et al.’s (1995) col-lapsing criteria, as well as (iii) propose alternative col-lapsing criteria that minimize the differences in elasticityvalues between the original and the collapsed matrices.We demonstrate that matrix dimension affects the esti-mation of all parameters of interest, particularly in her-baceous perennial species, and that such relationships arenot always monotonic. We discuss the limitations ofHooley’s (2000) algorithm regarding stable stage distri-bution of the population. Finally, we conclude with somesuggestions for implementing meaningful comparativedemographic studies based on projection matrices.
Implementation of the Collapsing Algorithm inSize- and Developmental Stage–Based Models
The algorithm of Hooley (2000) describes a method toreduce the dimension of a projection matrix, once it hasbeen decided which classes to collapse. In its original form,Hooley’s algorithm was intended for age-based models.These models provide poor descriptions of plant demo-graphic patterns because plants are often difficult to ageand because age is usually not the best predictor of plantdemographics (Harper 1977; Werner and Caswell 1977;Ebert 1999). Here, we expand Hooley’s algorithm to size-and developmental stage–based matrix models. Such mod-els allow individuals not only to advance several classesper unit time but also to retrogress (e.g., Bruna and Oli2005; Lucas et al. 2008).
Briefly, three steps must be taken to reduce a projectionmatrix of n dimensions, , to one of m dimensions,An#n
: (1) choose classes to collapse according to someCm#m
specified “collapsing criteria,” (2) collapse rows of thoseclasses in the matrix, and (3) collapse the respective col-umns. Choosing the appropriate classes to collapse (i.e.,specifying the collapsing criteria) is a nontrivial decision,and we discuss it below. Collapsing rows is performed bya simple element-by-element addition. Collapsing the col-umns is the most complex step of the process because,without the raw data, we do not know the proportion ofindividuals of the original classes that will contribute toforming the matrix elements aij of the newly collapsedclass.
In the simplest case possible, that of collapsing the twoclasses k and of an n-dimensional matrix intok � 1 An#n
a new class k ′ in the collapsed matrix , we firstC(n�1)#(n�1)
add the matrix elements along the k anda � a Gjk, j k�1, j
rows. The resulting intermediate matrix isk � 1 B(n�1)#n
then collapsed for columns k and . For age-basedk � 1models, determining the entries in column k ′ of the newcollapsed matrix is rather intuitive: simply calculate theproportion of individuals in class who survive, andk � 1consequently age, entering class k after one transition pe-riod, as well as the proportion of individuals who survivefrom class k and will automatically age into class .k � 1Surviving individuals from class do not represent ak � 1challenge for this calculation because they will transitioninto another class that is not collapsed in this example.
The calculation of the entries of column k ′ for size- anddevelopmental stage–based models is somewhat challeng-ing, because it involves the calculation of survival for theindividuals in the two classes to be collapsed (k and k �
), transition probabilities with which the individuals in1either class will not leave the collapsed class, and transitionprobabilities with which the individuals from all other clas-ses (e.g., , ) may enter the collapsed class k ′;k � 1 k � 2
000 The American Naturalist
abrupt changes in size and development, typically expressedby some plant species, may lead individuals to leap overseveral classes over one time interval. For age-, size-, ordevelopmental stage–based models, the collapsed vectorthat can be obtained from the intermediate matrix
will report only the total number of individualsB(n�1)#n
in the collapsed class and not the breakdown in the num-ber of individuals coming from each class involved. Thus,in order to collapse the columns, we must assume thatthe population was close to equilibrium during the fieldcensuses. In this case, it is possible to take the elementsof the stable class distribution (w) as the weighting factorsto construct the new collapsed class. Consequently, wedefine the weighting factors andr p w /(w � w )k k k k�1
, which are the proportions of ther p w /(w � w )k�1 k�1 k k�1
merged classes that we expect to form from the originalclass k and class , respectively. Column k ′ in the col-k � 1lapsed matrix C is made of entries that are the weightedaverages, using weighting factors rk and , respectively,rk�1
of columns k and of the partially collapsed matrixk � 1B. The stable class distribution is an intrinsic parameterof the projection matrix that can be obtained with a two-line command in Matlab: the right eigenvector associatedwith the dominant eigenvalue. This knowledge regardingthe stable class distribution is critical because it can freeus from needing the raw field data to be able to quantifymatrix entries in collapsed matrices (app. D, in the onlineedition of the American Naturalist, describes whether ourtechniques are robust when the assumption of stable equi-librium is violated).
Matrix Algorithm Implementation
Mechanistically, the collapsing algorithm can be appliedto almost any (see “Discussion”) projection matrix fol-lowing the calculation:
P 7 A 7 Q p C , (1)m#n n#n n#m m#m
where P is a matrix of dimensions containingm # ndummy holders (“1”) on the elements that are to be col-lapsed ( and ), with the rest of the matrix beinga a′ ′k , k k , k�1
formed by identity submatrices I,
I 0 0 0k�1 P p 0 1 1 0 , (2)
0 0 0 I n�k�1 m#n
and Q is a matrix of dimensions that contains then # mweighting factors for the elements in the columns k and
that are to be collapsed, with the rest of the matrixk � 1elements characterized by identity submatrices,
I 0 0k�1 0 r 0kQ p . (3)0 r 0k�1 0 0 I n�k�1 n#m
This algorithm also allows us to collapse multiple classesinto a single class or into fewer, separated classes in justone step, which saves a significant amount of time whendealing with projection matrices of high dimension in largedatabases. The steps when dealing with multiple collapsesare the same: normalize the elements on the merging col-umns by calculating the weighted average of the appro-priate stable class distributions.
Methods: Illustration of the Matrix Dimension–Collapsing Algorithm in Nine Plant Species
We applied Hooley’s algorithm to population projectionmatrices of nine different plant species, in order to ex-amine the dissimilarities between the elasticities of de-mographic processes in matrices of different dimensionsand to establish the optimum collapsing criteria. The elas-ticity is a widely used measurement of the importance ofa demographic process in a population; elasticity reflectsthe proportional change in population growth rate as afunction of a proportional change in a part of the pro-jection matrix (de Kroon et al. 1986). Specifically, we ex-plored (i) how the inferred elasticities are influenced bymatrix dimension when a fixed collapsing criterion is used(“even collapsing”; see below) and (ii) how collapsing alarge matrix into a fixed, smaller dimension in differentways (i.e., using different collapsing criteria; fig. 2) influ-ences the associated elasticities. We refer to the first ofthese studies as the “matrix-dimension test” and the sec-ond as the “collapsing-criterion test.” We then investigatedhow the elasticities of the collapsed matrices had changedrelative to the elasticities of the original, uncollapsed ma-trices. We used these comparisons to determine guidelinesfor optimal collapsing (i.e., guidelines for both the size ofthe collapsed matrices and for the collapsing criteria thatminimize the dissimilarities between the inferredelasticities).
We chose nine plant species of different growth formsand longevities for which size- or developmental stage–based projection matrices with relatively high dimensionwere available in the literature (table 1). These species’matrices differ because the demographic dynamics arestrongly influenced by the growth forms and life historiesof the species (Silvertown and Franco 1993). For instance,herbaceous species display a higher fluctuation in sizes anddevelopmental stages because they may skip over morethan one class, in both positive (progression) and negative(retrogression) directions, after one annual transition. By
Matrices in Plant Comparative Demography 000
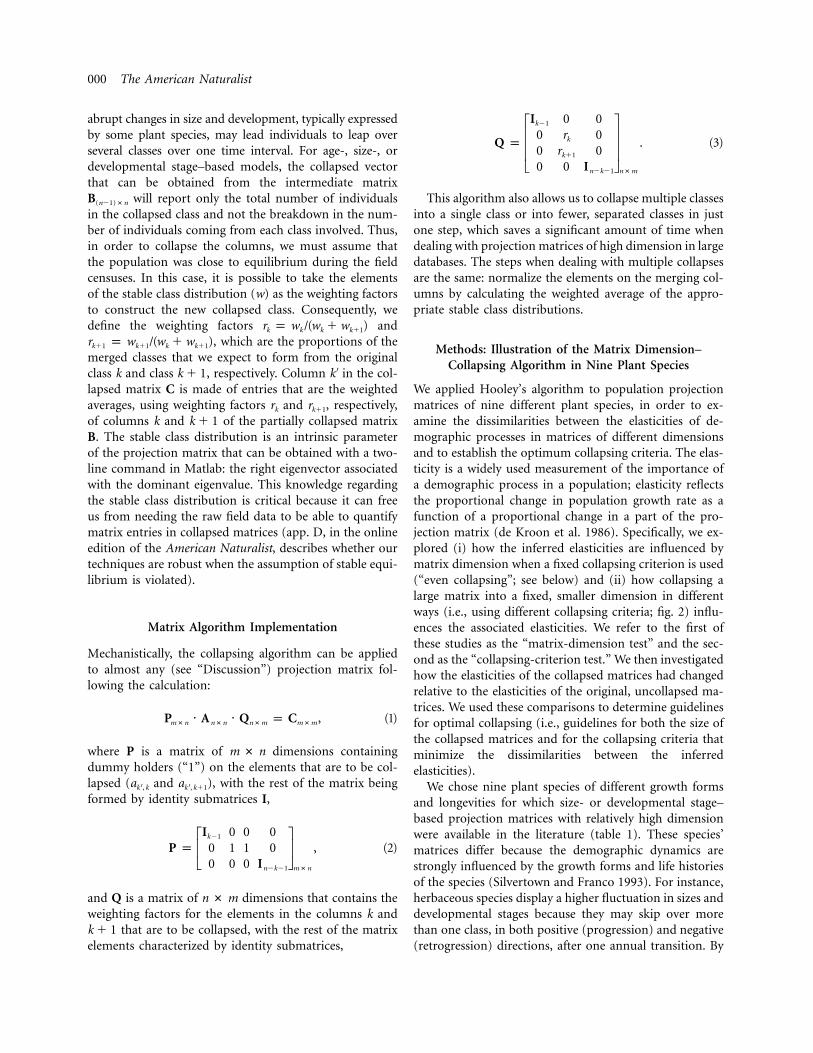
Figure 2: Collapsing approaches used to reduce the dimensions ofprojection matrices. Adjacent classes represented with the same13 # 13
color were collapsed. The first class was kept unaltered because it containsreproduction probabilities that are not to be merged with transitionprobabilities. A, The original matrix was collapsed evenly into13 # 13
, , and matrices to study the effect of decreasing7 # 7 5 # 5 4 # 4 3 # 3matrix dimension on its elasticity structure. B, The original 13 # 13matrix was collapsed into matrices in different ways to evaluate5 # 5the effect of several collapsing criteria on the matrix elasticity structure.Criteria are (I) collapsing an even number of classes, resulting in thestructure {1, 2–4, 5–7, 8–10, 11–13}; (II) leaving unaltered the first three{1, 2, 3, 4, 5–13}, (III) the middle two {1, 2–6, 7, 8, 9–13}, or (IV) thelast three classes {1, 2–10, 11, 12, 13}; (V) collapsing every two classesfor the first six classes and collapsing the remaining classes into a largeclass {1, 2–3, 4–5, 6–7, 8–13}, (VI) leaving unaltered the middle and lastclass and collapsing the remaining classes {1, 2–6, 7, 8–12, 13}, (VII)collapsing the central classes an leaving unaltered the first and last twoclasses {1, 2, 3–11, 12, 13}; and collapsing classes so that the newly formedclasses will keep their respective stasis probabilities (VIII), residence times(IX), and mortality probabilities (X) similar for each new class. Collapsingcriteria VIII–X are species specific (the example here presented is forCryptantha flava; fig. A2, in the online edition of the American Naturalist).
contrast, the dynamics of longer-lived shrubs and trees are“slower” because biomass decreases or dramatic increasesoccur rarely. We did not include annuals because theirmatrix dimensions are typically too small for us to im-plement any reduction with a meaningful outcome (fig.1).
We chose an original, uncollapsed dimension of 13 # 13in order to study the dissimilarities of elasticities in col-lapsed matrices, starting from a matrix of a dimension that
falls within the range typically reported in the literature.For collapsing purposes, we treated the original 13 # 13matrices as matrices in which the first(1 � 12) # (1 � 12)class was never merged with other classes so as to avoidmixing the transition probabilities with the perp � (0, 1)ij
capita contributions of fecundity (fig. 2). Notea � (0, �)1i
that in some projection matrix models, per capita contri-butions such as seed bank, seedling recruitment, and clonalreproduction can expand beyond the first row (e.g., Er-iksson 1988; Cipollini et al. 1994; but this is not the casefor any of the species in table 1) and that, likewise, theseclasses should not be merged with those that contain tran-sition probabilities.
Because the matrix dimensions of the chosen specieswere not identical (table 1), we slightly modified them toproduce matrices of initial dimension . For those13 # 13species whose original dimensions were higher than
(Ulex minor and Araucaria cunninghamii), we13 # 13used Hooley’s algorithm to collapse the higher classes toform a life cycle of 13 classes. For one species (Cryptanthaflava), we recalculated its projection matrix on the basisof a 13-class life cycle, using the available raw data (B.Casper, personal communication). The matrix of anotherspecies (Rourea induta) was already of a dimen-13 # 13sion. All other species had matrix dimensions below
(Calathea ovandensis, Viola frimbriatula, Ptero-13 # 13cereus gaumerii, Neobuxbaumia macrocephala, and Thrinaxradiata), and here we expanded the number of classes byreplicating the matrix elements of the last classes and re-adjusting the transition probabilities and per capita re-productive contributions to resemble the dynamics de-scribed by the original matrices. In all cases, we calculatedthe primary demographic parameters (life span, popula-tion growth rate, stable stage distribution, and elasticities)before and after the readjustment to make sure that themodification did not alter their demographic traits (app.B, in the online edition of the American Naturalist). Nev-ertheless, we emphasize that our goal is not to study theprecise details of these particular species but rather toexplore the effects of matrix dimension on the demo-graphic dynamics of realistic exemplars of a range of plantspecies. Life spans were calculated as described in Forbisand Doak (2004). We calculated the demographic param-eters using MatLab, version 7.1 (MathWorks 2001), andPopTools, version 3.0 (Hood 2003).
For every projection matrix, either or of reduced13 # 13size, we calculated the population growth rate l, the stableclass distribution w, the reproductive output , and thevelasticities of the demographic processes involved. We cal-culated two types of elasticities: matrix-element elasticitiesand vital-rate elasticities. Matrix-element elasticity measuresthe proportional change in the population growth rate (l)due to a proportional change in a group of matrix cells
000 The American Naturalist
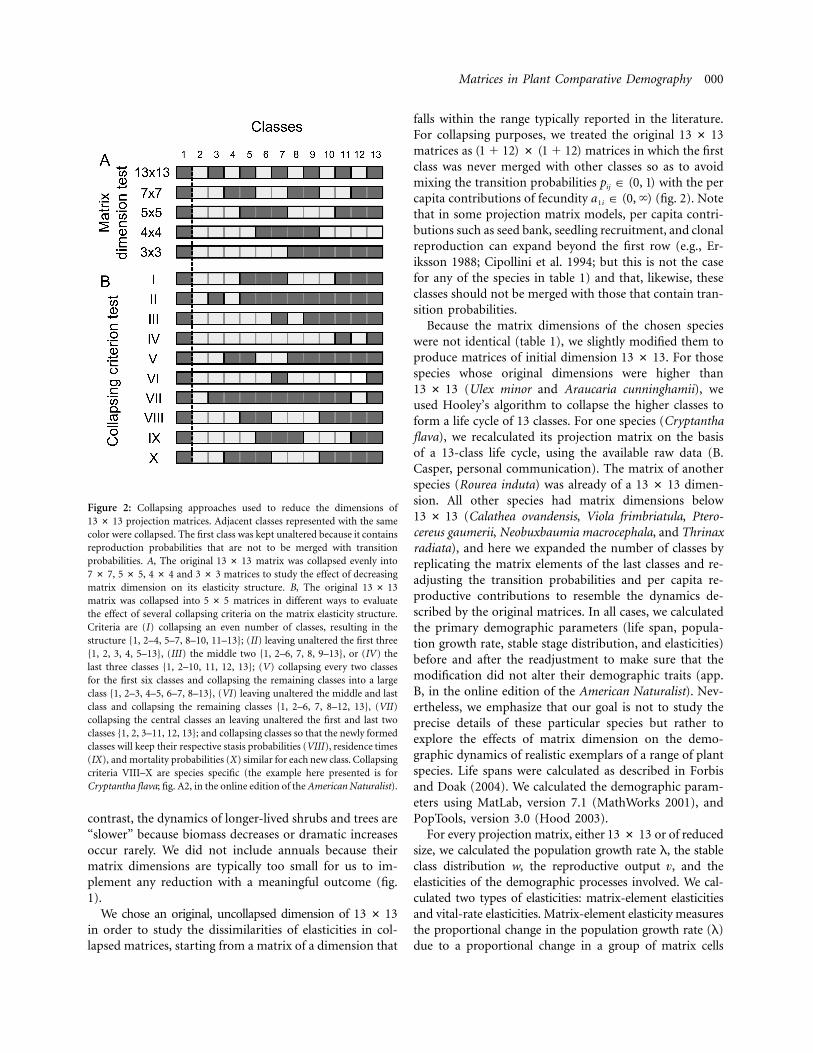
Table 1: Description of species used in this study, ranked by life span
Species FamilyArchitectural
typeLife span
(years)
Populationgrowthrate (l)
Matrixdimension Source
Cryptantha flava Boraginaceae Herbaceous 14 .86 13a Lucas et al. 2008Calathea ovandensis Marantaceae Herbaceous 20 .99 8 Horvitz and Schemske 1995Ulex minor Fabaceae Shrub 21 1.31 16 Stokes et al. 2004Viola frimbriatula Violaceae Herbaceous 23 1.22 11 Solbrig et al. 1988Pterocereus gaumerii Cactaceae Succulent 31 1.00 10 Mendez et al. 2004Neobuxbaumia
macrocephala Cactaceae Succulent 41 1.03 10 Esparza-Olguın et al. 2005Rourea induta Connaraceae Shrub 52 .99 13 Hoffmann 1999Thrinax radiata Arecaceae Palm 136 1.13 9 Olmsted and Alvarez-Buylla 1995Araucaria
cunninghamii Araucariaceae Tree 256 1.02 17 Enright and Ogden 1979
a Original matrix dimensions in the publication were , but we used the raw data to recalculate the matrix on the basis of a life cycle of 13 stages.7 # 7
corresponding to a demographic process, while vital-rateelasticity measures proportional changes in l based on pro-portional changes of the underlying demographic processesthat correspond to each projection matrix element, such assurvival (Franco and Silvertown 2004).
To examine the effect of matrix dimension on the in-ferred elasticities (hereafter “matrix-dimension test”), wecollapsed the -class life cycle into new classes of13 # 13even size, with the exception of the first class, which wasnot collapsed. This resulted in matrices of dimensions
, , , and . We then calculated the7 # 7 5 # 5 4 # 4 3 # 3dissimilarities between the elasticity structure of the orig-inal and the sequentially collapsed matrices. In order toexplore how different ways of collapsing the matrices af-fects differently the elasticities and to establish an optimumcriterion (“collapsing-criterion test”), we collapsed the
matrices into matrices (the median di-13 # 13 5 # 5mension in demographic studies; fig. A3), using variouscollapsing criteria. We then calculated the dissimilarity be-tween the elasticities of the original and its respectivelycollapsed matrices; the collapsing criterion that resulted inthe lowest dissimilarity was then established as the opti-mum criterion. We performed the matrix-dimension testand the collapsing-criterion test for both matrix-elementelasticities and vital-rate elasticities. We carried out a prin-cipal-component analysis (PCA) on the elasticities of sur-vival, stasis, retrogression, progression, and fecundity tocalculate elasticity dissimilarities. The PCA reveals rela-tionships and measures of proximity based on Euclideandistances (Davidson 1975). The comparisons of elasticitiesbased on Euclidean distances were carried out for bothmatrix-element elasticities and their underlying vital-rateelasticities.
In the collapsing-criterion test, we applied 10 differentcollapsing criteria to produce collapsed matrices of di-mension . Briefly, these criteria involved collapsing5 # 5
classes evenly (I), collapsing a large number of classestogether but in different positions of the life cycle (II–IV),collapsing irregularly (V–VII), and collapsing so that themean stasis probabilities (VIII), residence times (IX), andmortality rates (X) were as similar as possible for eachnew class (see fig. 2 for a detailed description of thesecriteria). For criterion IX, the class-specific residence timeswere calculated according to Caswell (2001, p. 112). Thelast three collapsing criteria (VIII–X) are species specificbecause of the species’ different demographic life histories(app. B). Similarly, because each species has to passthrough a different number of classes before attaining ma-turity, the criteria that separate nonreproductive and re-productive classes (an approach suggested by Enright etal. [1995]), are also species specific, although there wasfor each species at least one criterion that fulfilled such acondition (fig. A2).
Finally, we also measured the dissimilarity of the elas-ticity structures before and after collapsing the populationprojection matrices of a large database as a function oftheir growth form and life span. We applied the optimumcollapsing algorithm that was identified from the collaps-ing-criterion test to a set of 66 species’ projection matrices.We calculated the Euclidean distance between the elastic-ities before and after collapsing each original matrix to a
matrix. We then performed linear regressions to5 # 5study how life span and growth form correlate with theseEuclidean distances, using R (R Development Core Team2009).
Results
The collapsed matrices for the matrix-dimension andcollapsing-criterion tests of the nine species had the sameor extremely similar asymptotic growth rates and life spansas their respective matrices (app. B), as guaran-13 # 13
Matrices in Plant Comparative Demography 000
teed by the Hooley algorithm. Their stable class distri-butions and reproductive outputs were also the same, withthe exception of the collapsed classes, whose class distri-bution and reproductive outputs were equal to the sumof the classes that were merged (not shown).
Matrix-Dimension Test: How Does Matrix DimensionAffect the Estimation of Elasticities?
Matrix dimension affected the matrix-element elasticitiesconsistently across all species in our study for matricescollapsed to dimensions of more than . When even3 # 3collapsing to produce , , or matrices,7 # 7 5 # 5 4 # 4the matrix-element elasticities of stasis and fecundity in-creased, whereas the elasticities of retrogression and pro-gression decreased. The relationships between matrix di-mension and inferred elasticities were not always linear(fig. 3). A similar pattern was detected for the vital-rateelasticities, except for Calathea ovandensis (fig. 3A), Ptero-cereus gaumerii, and Neobuxbaumia macrocephala (app. C,in the online edition of the American Naturalist), wherethe matrix-element elasticities of stasis, after havingreached a maximum value in matrices, decreased5 # 5for the matrices.4 # 4
When the matrices were further collapsed to a dimen-sion of , an unexpected behavior was detected. In3 # 3the case of the matrix-element elasticities of the herbaceousC. ovandensis and the palm Thrinax radiata (fig. 3), theelasticity of stasis decreased drastically in the ma-3 # 3trices. Nonetheless, this behavior was not consistent acrossall species. In the case of the vital-rate elasticities, survivaldecreased from matrices to matrices, not only4 # 4 3 # 3in C. ovandensis and T. radiata but also in Viola fimbriatula,N. macrocephala, and Araucaria cunninghamii (app. C). Inthese five species, the decreases in the vital-rate elasticityof survival (C. ovandensis: �17%; T. radiata: �3%; allother species experienced a less drastic decrease of survival,between 0% and �1%), and the increases in fecundity (C.ovandensis: �435% and �115%; T. radiata: �317% and�197%, for element matrix and vital-rate elasticities, re-spectively) were rather steep.
The effects of collapsing matrix dimension on inferredelasticities were typically smaller for vital-rate elasticitiesthan for matrix-element elasticities. In particular, the Eu-clidean distances between the collapsed and original elas-ticities were smaller for vital-rate elasticities than for matrix-element elasticities in 29 out of 36 cases (four matrixdimensions [ , , , ] # nine species;7 # 7 5 # 5 4 # 4 3 # 3
, binomial test; fig. 4).P ! .001
Collapsing-Criterion Test: What Is the Best Criterion forSpecifying Which Classes to Collapse?
The collapsing criterion that did not modify the first fourclasses and collapsed classes k4–k13 into class (fig. 2B,k ′5
criterion II) resulted in the smallest dissimilarity betweenthe associated elasticities of the original and13 # 13
collapsed matrices (fig. 5). Such dissimilarity was5 # 5particularly small for the comparison based on vital-rateelasticities ( ).x p 0.07criterion II
The criteria that formed matrices such that the5 # 5stasis probabilities (VIII), residence times (IX), or mor-tality probabilities (X) of each collapsed class were similardid not rank among the most optimal collapsing criteria.The Euclidean distances ranked the collapsing criteria asfollows when based on matrix-element elasticities: II(Euclidean distance p 0.16) ! V (0.17) ! IX (0.20) ! III(0.20) ! VIII (0.20) ! VI (0.20) ! I (0.21) ! VII (0.23) !
; the criteria were ranked as followsX (0.23) ! IV (0.27)when based on vital-rate elasticities: II (0.07) ! V(0.13) ! VIII (0.16) ! X (0.16) ! IX (0.16) ! I (0.17) ! III
; see figure 2B.(0.17) ! VI (0.18) ! VII (0.19) ! IV (0.27)The collapsing criteria that separated nonreproductive
and reproductive classes (fig. A2) did not systematicallyresult in lower dissimilarities between the elasticity struc-tures of the original and the collapsed matrices. Forinstance, for Cryptantha flava and C. ovandensis, all col-lapsing criteria separated nonreproductive and reproduc-tive classes, but the criterion that collapsed classes k5–k13
(fig. 2B, criterion II) performed the best, in that the dis-similarity between the elasticities of the original and col-lapsed matrices was lowest. A cursory evaluation of theresults in figure 5, contrasted with figure A2, would suggestthat this criterion (criterion II; fig. 2B) is the optimumone because it splits nonreproductive and reproductiveclasses in five of the nine species in our study. However,the same is true of the criterion where classes k3–k11 werecollapsed (criterion VII; fig. 2B), and yet it performedrelatively poorly. Furthermore, the criterion that collapsedonly the last classes into a new class (criterion II; fig. 2B)was the best approach even for those species in which thiscriterion did not separate reproductive and nonreproduc-tive classes (e.g., P. gaumerii, N. macrocephala, T. radiata,and A. cunninghamii).
We found that collapsing matrices had a larger effecton inferred elasticities for shorter-lived species. While thelinear regression between life-span and dissimilarity mea-surements of the nine study species was not significant formatrix-element elasticities ( , ) and wast p 6.14 P p .1041, 8
borderline significant for vital-rate elasticities (t p1, 8
, ), this relationship was highly significant5.15 P p .057when a more extensive study of 66 species was used, inwhich their projection matrices had been collapsed to a

Figure 3: Effects of matrix dimension on the elasticity of vital rate– and matrix element–based demographic processes for three of the nine speciesour study: Calathea ovandensis (A), Ulex minor (B), and Thrinax radiata (C). In each case, the original projection matrix was collapsed by13 # 13combining two, three, four, or six adjacent classes, to produced , , , and matrices, respectively. Retrogression vital-rate7 # 7 5 # 5 4 # 4 3 # 3elasticities are represented as absolute values to fit into the positive axis, but they are negative.

Matrices in Plant Comparative Demography 000
Figure 4: Euclidean distance ( ) between the elasticities of thexdimension
original matrix and the elasticities of the , , ,13 # 13 7 # 7 5 # 5 4 # 4and matrices for each species (using criteria described in fig. 2A).3 # 3Species are ranked from top to bottom by increasing life span.
Figure 5: Euclidean distance between the elasticities of the originalmatrix and the elasticities of the collapsed matrices ob-13 # 13 5 # 5
tained with the various collapsing criteria described in figure 2B. OverallEuclidean distances are averaged per species ( ) and per criterionxspecies
( ).xcriteria
dimension via the previously established optimum5 # 5criterion (criterion II; fig. 2B; , ,t p 18.49 P ! .0011, 64
; fig. 6). Furthermore, the correlation between2R p 22.4%dissimilarity and life span was growth form specific( , ; growth form as covariate:F p 7.45 P ! .001 F p5, 60 4, 60
, ), and it was primarily driven by the signif-5.02 P ! .001icant life span–dissimilarity correlation of herbaceous pe-rennials ( , ); this correlation was non-t p 17.95 P ! .0011, 36
significant for succulent, shrub, palm, and tree species.
Discussion
Our study offers insights into how and why the dimensionof projection matrices influences the estimation of fun-damental demographic parameters. Using an overlookedalgorithm (Hooley 2000) for collapsing matrix dimensionwithout relying on raw field data, we have (i) establishedcollapsing criteria better than those previously suggested(Enright et al. 1995); (ii) found that the effect of matrixdimension on the associated elasticity structure is oftennonmonotonic and not always lower on vital-rate elastic-ities than on matrix-element elasticities, as previously re-ported (Zuidema 2000); (iii) observed unexpected behav-ior for very small matrices (e.g., ) that allows us to3 # 3establish a dimension threshold for comparative plant de-mographic studies; and (iv) found a negative relationshipbetween life span and the robustness of elasticities to ma-trix dimension in herbaceous perennials.
Our results indicate that collapsing a population pro-jection matrix by similar residence times leads to a large
difference in elasticities between the original and collapsedmatrices, contrary to the suggestion of Enright et al.(1995). Specifically, we found that for all species in thisstudy, keeping the first life-cycle classes unaltered (crite-rion II; fig. 2B) resulted in the lowest effect on the inferredelasticities. This likely occurs because individuals of youn-ger/smaller/less developed classes are usually more sus-ceptible to changes in the environment and thus typicallyexhibit distinct, class-specific vital rates (Harper 1977).These conclusions are further supported by the fact thatwhile the criterion that grouped the first classes and leftthe last four classes unaltered (IV, the opposite of II; fig.2B) was the worst performer, the criterion where the firstclasses were collapsed only two at a time, in a form verysimilar to criterion II, always ranked in the second posi-tion. Our results are also supported by a study that suggestsways to save time, resources, and field effort while con-structing projection matrices from small populations ofthreatened species (Ramula and Lehtila 2005).
Our findings suggest that fecundity or age at firstreproduction are not the most important biological pro-

000 The American Naturalist
Figure 6: Euclidean distance between the elasticities of the original andthe collapsed matrices (using collapsing criterion II in fig. 2B) as5 # 5a function of life span for 66 plant species: 38 herbaceous perennial, 6succulent, 6 shrub, 7 palm, and 9 tree species.
cesses on which to base the classes chosen for matrixconstruction and collapsing. Enright et al. (1995) rec-ommended against merging nonreproductive and repro-ductive classes because trade-offs between reproduction,growth, and survival would result in distinctive demo-graphic dynamics in both life-cycle stages. However, weshow that collapsing criteria that violate this suggestioncan produce more robust elasticities than collapsing cri-teria that differentiate nonreproductive from reproductiveclasses.
We also found some inconsistencies with previous workson the robustness of vital-rate versus matrix-element elas-ticities to varying matrix dimension. Zuidema and Zagt(in Zuidema 2000) studied the effect of matrix dimensionon inferred elasticities and found that progression andretrogression matrix-element elasticities decreased with in-creasing dimension, consistent with our results. However,they also reported that the vital-rate elasticities were morerobust to varying matrix dimension than their matrix-element counterparts. Our results generally agree withtheirs, but in 20% of the cases ( species) in ourn p 9study, vital-rate elasticities were more robust than matrix-element elasticities to changes in matrix dimension. Nev-ertheless, vital-rate elasticities seem more relevant for thestudy of ecological patterns because they reflect indepen-dent demographic processes and allow for the separationof the survival vital rates (e.g., Bruna et al. 2009).
Although the collapsing algorithm we have analyzedhere has the virtue of preserving population growth rates,stable class distributions, and reproductive output, thisalgorithm assumes demographic stability. In an ideal sce-nario, field censuses would be extensively temporarily rep-
licated so that they comprise all biotic and abiotic phe-nomena that are inherent to the species’ life cycle. Doingso would approximate the mean observed class distribu-tion to the stable class distribution. We suggest that classdistributions be calculated and compared to the stable classdistribution as a prerequisite to deciding whether to in-corporate a given annual transition for later interspecificcomparison. Applying methods to do so (Keyfitz’s D, inCaswell 2001, p. 101), we have found evidence thatHooley’s algorithm provides reliable collapsed projectionmatrices for at least one population subjected to extremeweather events (app. D). We also recommend averagingthe control transition matrices for as many sites and yearsas there are data available to reduce the effect of abnormalbiotic and abiotic fluctuations.
Intuition behind the Impact of Matrix Dimensionon Elasticities
Although we cannot provide a mechanistic explanation forall the specific details of our results on the nine plantspecies, there is a simple intuition for the general effectsof collapsing dimension on associated elasticities. The elas-ticities of fecundity tend to increase as matrix dimensionis reduced because the merging of nonreproductive andreproductive classes inevitably makes reproductive statusattainable in a shorter period of time by the faster-growingindividuals in the population (Enright et al. 1995). Fasterdemographic processes have been shown to have greaterelasticities (Zuidema et al. 2009). Similarly, the elasticityof stasis also increases because, with fewer classes in acollapsed matrix, the amount of stasis is again augmented.Since stasis elasticity increases while the overall populationgrowth rate l is kept constant, the elasticities of retro-gression and progression must decrease. Although there issome variation across species and some aberrant behaviorat very small dimensions, this simple intuition explainsmost of the general patterns we have observed. We at-tribute the unexpected increase in matrix-element pro-gression elasticities in small matrices of some herbaceousperennials and succulent species, and the subsequent de-crease in stasis elasticity, to the high degree of phenotypicplasticity of these growth forms and their fast demographicdynamics (Chien and Zuidema 2006). Furthermore, stud-ies of herbaceous perennials often suffer from small samplesizes in large size classes.
Guidelines for Comparative Demographic Studies
Our results on the relationship between matrix dimensionand inferred demographic properties have important im-plications for comparative studies. We have shown thatthe apparent importance of fecundity, stasis, progression,

Matrices in Plant Comparative Demography 000
retrogression, and survival is highly sensitive to the di-mensions of the projection matrix. Consequently, demo-graphic comparisons of species based on elasticities mustcarefully account for the varying matrix dimensions.
For comparative work based on published projectionmatrices, we suggest two alternatives: either account formatrix dimension with a nonlinear analysis or collapsematrices into an equal dimension, at least for the herba-ceous perennials, whose elasticities are most sensitive tomatrix dimension (fig. 6). Surprisingly, most recent com-parative studies using projection matrices have not usedmatrix dimension as a covariate (Franco and Silvertown2004; Bruna et al. 2009). On the other hand, a trade-offemerges between the matrix dimension cutoff and howmany studies to include for comparative purposes because(i) matrix collapsing will mean that species with fairlydissimilar traits will be treated as equals from a demo-graphic standpoint (e.g., Crouse et al. 1987; Cochran andEllner 1992); (ii) decreasing dimension, regardless of thecollapsing criteria, will tend to artificially promote the ap-parent importance of stasis and fecundity, compared toprogression and retrogression; and (iii) an extreme de-crease in the number of classes will not allow for the studyof processes such as class-specific mortality rates, time tomaturation, senescence, clonal growth, or vegetative dor-mancy. In the extreme, a very small matrix will inevitablymerge transition probabilities for stasis, progression, and/or retrogression with sexual and/or clonal re-p � (0, 1)ij
production , which makes little biological sense.a � (0, �)i
Based on the results of our matrix-dimension test, in whichthe elasticities exhibited unexpected behaviors for dimen-sions smaller than 4, we suggest dimensions of at least 5in complex and 4 in simple life cycles for comparativestudies, despite the fact that this rules out a large numberof published projection matrices with smaller dimensions( ; R. Salguero-Gomez, unpublished data) for de-n p 107mographic comparisons. Finally, our results suggest anoptimum criterion for choosing which stages to collapsein a projection matrix (criterion II; fig. 2B): keeping thefirst few life-cycle classes unaltered and collapsing all otherolder/larger/more developed classes, regardless of whetherthat means merging nonreproductive and reproductiveclasses or keeps the residence times constant in the newlycollapsed classes.
Acknowledgments
We thank B. Casper, M. Franco, B. Waring, and P. Zuidemafor valuable comments on the manuscript. Thanks are alsodue to R. Lucas and B. Casper, who made available theraw demographic data for Cryptantha flava. The manu-script also greatly benefited from useful comments fromtwo reviewers. J.B.P. acknowledges support from the Bur-
roughs Wellcome Fund, the David and Lucile PackardFoundation, the James S. McDonnell Foundation, and theAlfred P. Sloan Foundation. R.S.-G. was supported by aDissertation Research Fellowship of the University ofPennsylvania.
Literature Cited
Angert, A. L. 2006. Demography of central and marginal populationsof monkeyflowers (Mimulus cardinalis and M. lewisii). Ecology 87:2014–2025.
Bierzychudek, P. 1999. Looking backwards: assessing the projectionsof a transition matrix model. Ecological Applications 9:1278–1287.
Bruna, E. M., and M. K. Oli. 2005. Demographic effects of habitatfragmentation on a tropical herb: life-table response experiments.Ecology 86:1816–1824.
Bruna, E. M., I. J. Fiske, and M. D. Trager. 2009. Habitat fragmen-tation and plant populations: is what we know demographicallyirrelevant? Journal of Vegetation Science 20:569–576.
Burns, J. H., S. P. Blomberg, E. E. Crone, J. Ehrlen, T. M. Knight,J.-B. Pichancourt, S. Ramula, G. M. Wardle, and Y. M. Buckley.2010. Empirical tests of life�history evolution theory using phy-logenetic analysis of plant demography. Journal of Ecology 98:334–344.
Caswell, H. 2001. Matrix population models, construction, analysisand interpretation. Sinauer, Sunderland, MA.
Chien, P. D., and P. A. Zuidema. 2006. What dimension to use formatrix models of trees? recommendations based on a validationof age estimate by tree ring analysis. Pages 107–124 in P. D. Chien.Demography of threatened tree species in Vietnam. PhD diss.Utrecht University.
Cipollini, M. L., D. A. Wallace-Senft, and D. F. Whigham. 1994. Amodel of patch dynamics, seed dispersal, and sex ratio in thedioecious shrub Lindera benzoin (Lauraceae). Journal of Ecology82:621–633.
Cochran, M. E., and S. Ellner. 1992. Simple methods for calculatingage-based life-history parameters for stage-structured populations.Ecological Monographs 62:345–364.
Crouse, D. T., L. B. Crowder, and H. Caswell. 1987. A stage-basedpopulation model for loggerhead sea turtles and implications forconservation. Ecology 68:1412–1423.
Davidson, J. 1975. Use of principal components, factor-analysis andvarimax rotation to describe variability in wood of Eucalyptusdeglupta Blume. Wood Science and Technology 9:275–291.
de Kroon, H., A. Plaisier, J. van Groenendael, and H. Caswell. 1986.Elasticity: the relative contribution of demographic parameters topopulation growth rate. Ecology 67:1427–1431.
de Matos, M. B., and D. M. Silva Matos. 1998. Mathematical con-straints on transition matrix elasticity analysis. Journal of Ecology86:706–708.
Dostal, P. 2007. Population dynamics of annuals in perennial grass-land controlled by ants and environmental stochasticity. Journalof Vegetation Science 18:91–102.
Easterling, M. R., Ellner, S. P., and P. M. Dixon. 2000. Size-specificsensitivity: applying a new structured population model. Ecology81:694–708.
Ebert, T. A. 1999. Plant and animal populations: methods in de-mography. Academic Press, San Diego, CA.
Ehrlen, J., K. Syrjanen, R. Leimu, M. B. Garcia, and K. Lehtila. 2005.

000 The American Naturalist
Land use and population growth of Primula veris: an experimentaldemographic approach. Journal of Applied Ecology 42:317–326.
Enright, N., and J. Ogden. 1979. Applications of transition martixmodels in forest dynamics: Araucaria in Papua-New Guinea andNothofagus in New Zealand. Australian Journal of Ecology 4:3–23.
Enright, N. J., M. Franco, and J. Silvertown. 1995. Comparing plantlife histories using elasticity analysis: the importance of life spanand the number of life cycle stages. Oecologia (Berlin) 104:79–84.
Eriksson, O. 1988. Ramet behaviour and population growth in theclonal herb Potentilla anserina. Journal of Ecology 76:522–536.
Esparza-Olguın, L., T. Valverde, and M. C. Mandujano. 2005. Com-parative demographic analysis of three Neobuxbaumia species(Cactaceae) with differing degree of rarity. Population Ecology 47:229–245.
Forbis, T. A., and D. F. Doak. 2004. Seedling establishment and lifehistory trade-offs in alpine plants. American Journal of Botany 91:1147–1153.
Franco, M., and J. Silvertown. 2004. Comparative demography ofplants based upon elasticities of vital rates. Ecology 85:531–538.
Freckleton, R. P., D. M. Silva Matos, M. L. A. Bovi, and A. R. Wat-kinson. 2003. Predicting the impacts of harvesting using structuredpopulation models: the importance of density-dependence andtiming of harvest for a tropical palm tree. Journal of AppliedEcology 40:846–858.
Harper, J. L. 1977. Population biology of plants. Academic Press,New York.
Hoffmann, W. A. 1999. Fire and population dynamics of woodyplants in a Neotropical savanna: matrix model projections. Ecology80:1354–1369.
Hood, G. 2003. PopTools, version 3.0. Commonwealth Scientificand Industrial Research Organisation (CSIRO), Clayton South.http://www.cse.csiro.au/poptools/index.htm.
Hooley, D. E. 2000. Collapsed matrices with (almost) the same ei-genstuff. College Mathematical Journal 31:297–299.
Horvitz, C. C., and D. W. Schemske. 1995. Spatiotemporal variationin demographic transitions of a tropical understory herb: projec-tion matrix analysis. Ecological Monographs 136:499–516.
Jacquemyn, H., R. Brys, and M. G. Neubert. 2005. Fire increasesinvasive spread of Molinia caerulea mainly through changes indemographic parameters. Ecological Applications 15:2097–2108.
Kakehashi, M., and E. Kinoshita. 1990. An application of the sexallocation theory to Arisaema serratum. Plant Species Biology 5:121–129.
Lamar, W. R., and J. B. McGraw. 2005. Evaluating the use of remotelysensed data in matrix population modeling for eastern hemlock(Tsuga canadensis L.), Forest Ecology and Management 212:50–64.
Lefkovitch, L. P. 1965. Study of population growth in organismsgrouped by stages. Biometrics 21:1–18.
Leslie, P. H. 1945. On the use of matrices in certain populationmathematics. Biometrika 33:183–212.
Lubben, J., B. Tenhumberg, A. Tyre, and R. Rebarber. 2008. Man-agement recommendations based on matrix projection models:the importance of considering biological limits. Biological Con-servation 141:517–523.
Lucas, R. W., I. N. Forseth, and B. B. Casper. 2008. Using rainoutshelters to evaluate climate change effects on the demography ofCryptantha flava. Journal of Ecology 96:514–522.
Maron, J. L., and E. Crone. 2006. Herbivory: effects on plant abun-
dance, distribution and population growth. Proceedings of theRoyal Society B: Biological Sciences 273:2575–2584.
Marrero-Gomez, M. V., J. G. B. Oostermeijer, E. Carque-Alamo, andA. Banares-Baudet. 2007. Population viability of the narrow en-demic Helianthemum juliae (CISTACEAE) in relation to climatevariability. Biological Conservation 136:552–562.
MathWorks. 2001. Matlab. Version 7.1. MathWorks, Natick, MA.Meagher, T. R. 1982. The population biology of Chamaelirium lu-
teum, a dioecious member of the lily family: two-sex populationprojections and stable population structure. Ecology 63:1701–1711.
Mendez, M., R. Duran, I. Olmsted, and K. Oyama. 2004. Populationdynamics of Pterocereus gaumeri, a rare and endemic columnarcactus of Mexico. Biotropica 36:492–504.
Moloney, K. A. 1986. A generalized algorithm for determining cat-egory size. Oecologia (Berlin) 69:176–180.
———. 1988. Fine-scale spatial and temporal variation in the de-mography of a perennial bunchgrass. Ecology 69:1588–1598.
Morris, W. F., and D. F. Doak. 1998. Life history of the long-livedgynodioecious cushion plant Silene acaulis (Caryophyllaceae), in-ferred from size-based population projection matrices. AmericanJournal of Botany 85:784–793.
Namkoong, G., and J. H. Roberds. 1974. Extinction probabilities andchanging age structure of redwood forests. American Naturalist108:355–368.
Nault, A., and D. Gagnon. 1993. Ramet demography of Allium tri-coccum, a spring ephemeral, perennial forest herb. Journal of Ecol-ogy 81:101–119.
Olmsted, I., and E. R. Alvarez-Buylla. 1995. Sustainable harvestingof tropical trees: demography and matrix models of two palmspecies in Mexico. Ecologocal Applications 5:484–500.
R Development Core Team. 2009. R: a language and environmentfor statistical computing. R Foundation for Statistical Computing,Vienna. http://www.R-project.org.
Ramula, S., and K. Lehtila. 2005. Matrix dimensionality in demo-graphic analysis of plants: when to use smaller matrices? Oikos111:563–573.
Ramula, S., T. M. Knight, J. H. Burns, and Y. M. Buckley. 2008.General guidelines for invasive plant management based on com-parative demography of invasive and native plant populations.Journal of Applied Ecology 45:1124–1133.
Salguero-Gomez, R., and B. B. Casper. 2010. Keeping shrinkage inthe demographic loop. Journal of Ecology 98:312–323.
Shimatani, I. K., Y. Kubota, K. Araki, S. Aikawa, and T. Manabe.2007. Matrix models using fine size classes and their applicationto the population dynamics of tree species: Bayesian non-para-metric estimation. Plant Species Biology 22:175–190.
Silvertown, J., and M. Franco. 1993. Plant demography and habitat:a comparative approach. Plant Species Biology 8:67–73.
Silvertown, J., M. Franco, and K. McConway. 1992. A demographicinterpretation of Grime’s triangle. Functional Ecology 6:130–136.
Silvertown, J., M. Franco, I. Pisanty, and A. Mendoza. 1993. Com-parative plant demography: relative importance of life cycle com-ponents to the finite rate of increase in woody and herbaceousperennials. Journal of Ecology 81:465–476.
Silvertown, J., M. Franco, and R. Perez. 2001. Evolution of senescencein iteroparous perennial plants. Evolutionary Ecology Research2001:393–412.
Sohn, J. J., and D. Policansky. 1977. Costs of reproduction in may-apple Podophyllum peltatum (Berberidaceae). Ecology 58:1366–1374.
Matrices in Plant Comparative Demography 000
Solbrig, O. T., R. Sarandon, and W. Bossert. 1988. A density-depen-dent growth model of a perennial herb, Viola fimbriatula. Amer-ican Naturalist 131:385–400.
Stokes, K. E., J. M. Bullock, and A. R. Watkinson. 2004. Populationdynamics across a parapatric range boundary: Ulex gallii and Ulexminor. Journal of Ecology 92:142–155.
Stott, I., M. Franco, D. Carslake, S. Townley, and D. Hodgson. 2010.Boom or bust? a comparative analysis of transient populationdynamics in plants. Journal of Ecology 98:302–311.
Tenhumberg, B., A. J. Tyre, and R. Rebarber. 2009. Model complexityaffects transient population dynamics following a dispersal event:a case study with pea aphids. Ecology 90:1878–1890.
van Groenendael, J., H. de Kroon, S. Kalisz, and S. Tuljapurkar. 1994.Loop analysis: evaluating life history pathways in population pro-jection matrices. Ecology 75:2410–2415.
van Mantgem, P. J., and N. L. Stephenson. 2005. The accuracy ofmatrix population model projections for coniferous trees in theSierra Nevada, California. Journal of Ecology 93:737–747.
Vandermeer, J. 1978. Choosing category size in a stage projectionmatrix. Oecologia (Berlin) 32:79–84.
Werner, P. A., and H. Caswell. 1977. Population growth rates andage versus stage distribution models for teasel (Dipsacus sylvestrisHuds.). Ecology 58:1103–1111.
Zuidema, P. A. 2000. Demography of exploited tree species in theBolivian Amazon. PhD diss. Utrecht University.
Zuidema, P. A., R. J. Brienen, H. J. During, and B. Guneralp. 2009.Do persistently fast-growing juveniles contribute disproportion-ately to population growth? a new analysis tool for matrix modelsand its application to rainforest trees. American Naturalist 174:709–719.
Zuidema, P. A., E. Jongejans, P. D. Chien, H. J. During, and E.Schieving. 2010. Integral projection models for trees: a new pa-rameterization method and a validation of model output. Journalof Ecology 98:345–355.
Associate Editor: Carol HorvitzEditor: Donald L. DeAngelis
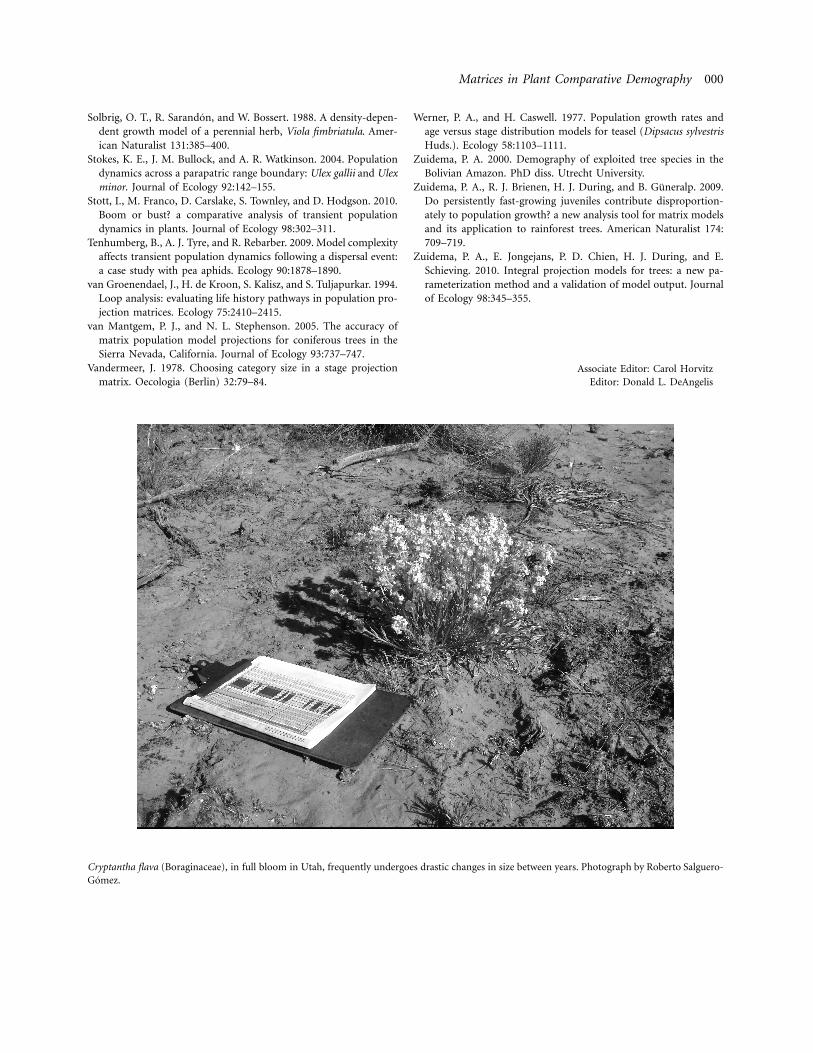
Cryptantha flava (Boraginaceae), in full bloom in Utah, frequently undergoes drastic changes in size between years. Photograph by Roberto Salguero-Gomez.


![Economic and Demographic Transition, Mortality, and ... · demographic dimensions in a unified framework delivering an ... de la Croix and Licandro, jet 2002, Soares, aer 2005] I](https://img.pdfslide.us/doc/110x75/5c6391e409d3f2241d8b68b5/economic-and-demographic-transition-mortality-and-demographic-dimensions.jpg)